Unlock document.
This document is partially blurred.
Unlock all pages and 1 million more documents.
Get Access

Although seasonal effects can confound a trend analysis, a regression model is robust to
these effects and the researcher does not need to adjust for seasonality prior to using a
regression model to analyze trends.
The variability in the estimated slope is smaller when the x-values are more spread out.
Minitab and Excel output for a multiple regression model show the t tests for the
regression coefficients but do not provide a t test for the regression constant.
Given two events, A and B, if the probability of A is 0.7, the probability of B is 0.3, and
the joint probability of A and B is 0.21, then the two events are independent.

When finding a confidence interval for the difference between two population
proportions we use the pooled estimate of the proportion.
A hypergeometric distribution applies to experiments in which the trials represent
sampling with replacement.
When a true null hypothesis is rejected, the researcher has made a Type I error.

The value of perfect information is the difference between the monetary payoff with
perfect information and the expected monetary payoff with no information.
The mean or the expected value of a discrete distribution is the long-run average of the
occurrences.
Since a normal distribution curve extends from minus infinity to plus infinity, the area
under the curve is infinity.
In a randomized complete block design the conclusion might be that blocking is not

necessary.
Generally speaking, the hypotheses that business researchers want to prove are stated in
the alternative hypothesis.
If the degrees of freedom in a t distribution increase, difference between the t values
and the z values will also increase.
The Mann-Whitney U-test requires that the two samples under consideration have the
same number of observations.

The slope of the regression line, y = 21 − 5x, is 21.
The lowest level of data measurement is the ratio level.
The probability of type II error becomes bigger if the level of significance is changed
from 0.01 to 0.05.

In regression, the predictor variable is called the dependent variable.
One definition that captures the spirit of most quality efforts in the business world is
that quality results when a product delivers what is stipulated for it in its specifications.
A nonrandom sampling technique that is similar to stratified random sampling is called
quota sampling.
When the population standard deviation (
) is unknown, the value of s-1is used to
compute the tvalue.

Correlation is a measure of the degree of linear relationship between two variables.
If a null hypothesis is not rejected at the 0.05 level of significance, the p-value is bigger
than 0.05
For an exponential distribution, the mean is always equal to its variance.

Whenever hypotheses are established such that the alternative hypothesis is
"μ>8",where μ is the population mean,the hypothesis test would be a two-tailed test.
The standard deviation of a sampling distribution of the sample means is commonly
called the standard error of the mean.
Minitab and Excel output for a multiple regression model show the F test for the
overall model, but do not provide the t tests for the regression coefficients.
A control chart is used to control the flow of materials into a process.

A z test of proportions is used when a hypothesis test is conducted on a population
proportion.
A chi-square goodness-of-fit test is being used to test the goodness-of-fit of a uniform
distribution for a dataset with "k" categories. This test has (k-3) degrees of freedom.
If the population is normal and its standard deviation, , is known and the
sample size, n, is large (n ≥ 30), interval estimates for the population mean must be
determined using z-values.

Pate's Pharmacy, Inc. operates a regional chain of 120 pharmacies. Each pharmacy's
floor plan includes a greeting card department which is relatively isolated. Sandra
Royo, Marketing Manager, feels that the level of lighting in the greeting card
department may affect sales in that department. She chooses three levels of lighting
(soft, medium, and bright) and randomly assigns six pharmacies to each lighting level.
Analysis of Sandra's data yielded the following ANOVA table.
Using
= 0.05, the critical F value is _____________.
a) 13.68
b) 19.43
c) 3.59
d) 19.45
e) 3.68
The equation of the trend line for the data based on sales (in $1000) of a local restaurant
over the years 2005-2010 is Sales= -265575+132.571 year. The equation of the trend
line when using 1 to 6 for 2005-2010 is ________
a) -265575+132.571x
b) 132,571x
c) 97.284+132.571x
d) -263571+98x
e) 2004+37.2x

A large national company is considering negotiating cellular phone rates for its
employees. The Human Resource department would like to estimate the proportion of
its employee population who own an Apple iPhone.. A random sample of size 250 is
taken and 40% of the sample own and iPhone. The 90% confidence interval to estimate
the population proportion is ____.
a) 0.35 to 0.45
b) 0.34 to 0.46
c) 0.37 to 0.43
d) 0.39 to 0.41
e) 0.40 to 0.45
A researcher wants to know what the average variation is in altimeters of small,
privately owned airplanes. The task of determining this is expensive and time
consuming, if even possible, given the large number of such airplanes. The researcher
decides to use government records to randomly locate the owners of ten such planes
and then get permission to test the altimeters. When the researcher is done, he will use
the data gathered from the group of ten to reach conclusions about all small, privately
owned airplanes. This process can best be described as _______.
a) data statistics
b) research statistics

c) descriptive statistics
d) inferential statistics
e) nonparametric statistics
If sampling is performed without replacement, the hypergeometric distribution should
be used. However, the binomial may be used to approximate this if _______.
a) n > 5%N
b) n < 5%N
c) the population size is very small
d) there are more than two possible outcomes of each trial
e) the outcomes are continuous
The expected monetary value without information is $2,500, and the expected monetary
payoff with perfect information is $5,000. The expected value of perfect information is
____________.
a) $7,500
b) $2,500

c) $1,500
d) $2,000
e) $1,250
The Chamber of Commerce wants to assess its membership's opinions of the North
American Free Trade Agreement. One-hundred of the 2,000 members are randomly
selected and contacted by telephone. Seventy-five reported an overall favorable
opinion, and twenty-five reported an overall unfavorable opinion. The proportion, 0.75,
is a ___________.
a) parameter
b) statistic
c) population
d) sample
e) frame
Pinky Bauer, Chief Financial Officer of Harrison Haulers, Inc., suspects irregularities in
the payroll system and orders an inspection of "each and every payroll voucher issued
since January 1, 2000." Each payroll voucher was inspected and the following
frequency distribution was compiled.

The midpoint of the first class interval is _________.
a) 500
b) 2
c) 1.5
d) 1
e) 250
A market researcher is studying the use of coupons by consumers of varying ages. She
classifies consumers into four age categories and counts the number of grocery store
customers who use at least one coupon during check out. It is expected that data are
uniformly distributed across the four age categories. The observed data results in
frequencies of 22, 35, 32, and 21. Using
= .10, the appropriate decision is _______.
a) do not reject the null hypothesis that the observed distribution is uniform
b) do not reject the null hypothesis that the observed distribution is not uniform
c) reject the null hypothesis that the observed distribution is uniform
d) reject the null hypothesis that the observed distribution is not uniform
e) do nothing

A researcher believes that a variable is Poisson distributed across six categories. To test
this, the following random sample of observations is collected:
Using
= 0.10, the critical value of chi-square for the data is _______.
a) 9.236
b) 7.779
b) 1.064
c) 13.277
d) 12.89
The probability of selecting 3 female employees and 7 male employees to win a
promotional trip a company with 10 female and 50 male employees would best be
modeled with the _______.
a) binomial distribution
b) hypergeometric distribution
c) Poisson distribution
d) hyperbinomial distribution
e) exponential distribution
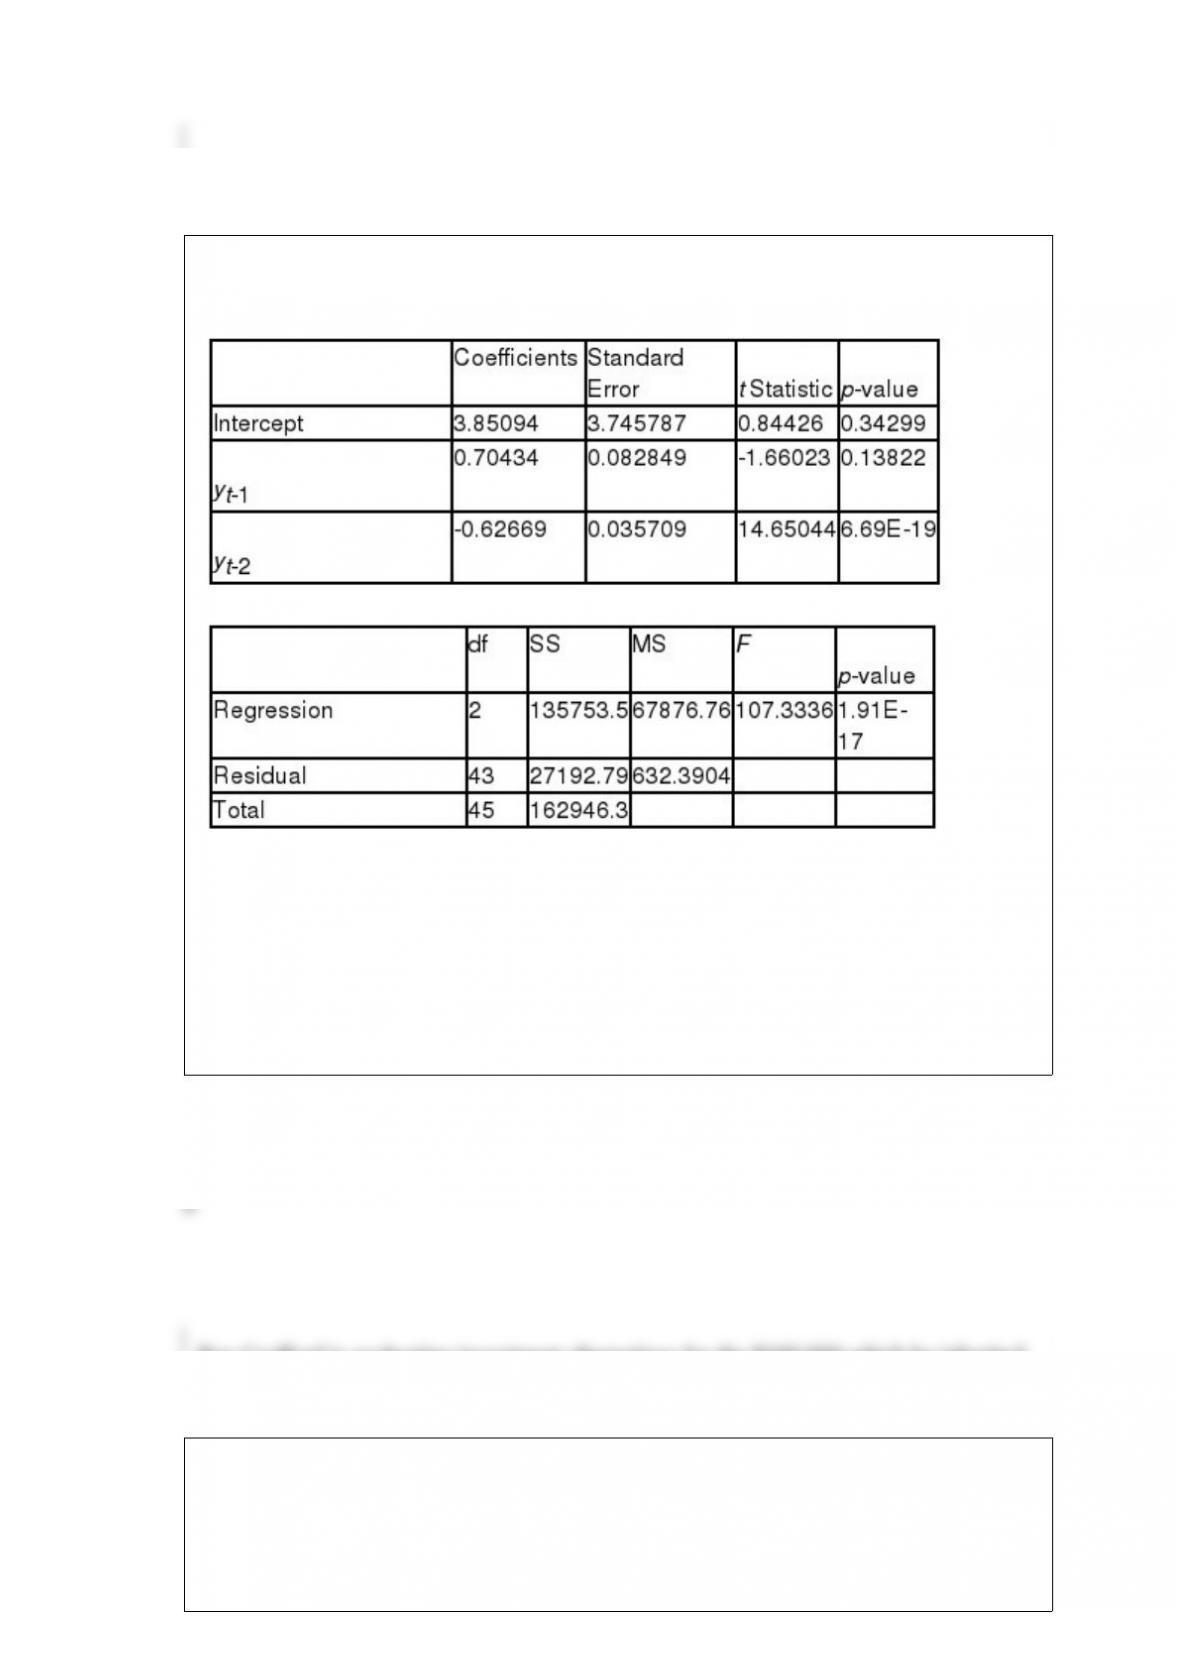
Analysis of data for an autoregressive forecasting model produced the following tables.
The forecasting model is __________.
a) yt= 3.745787 + 0.082849yt-1+ 0.035709yt-2
b) yt= 3.85094 + 0.70434yt-1- 0.62669yt-2
c) yt= 0.84426 - 1.66023yt-1+ 14.65023yt-2
d) yt= 0.34299 + 0.13822yt-1+ 9.69yt-2
e) yt= 0.34299 + 0.13822yt-1- 6.69yt-2
Ray Crofford is evaluating investment alternatives for the $100,000 which he inherited
from his grandfather. His investment advisor has identified two alternatives and
constructed the following tables which show (1) expected profits (in $10,000's) for
various market conditions and their probabilities, and (2) the advisor's track record on
predicting Bull and Bear markets.

The EMV of this investment opportunity with the advisor's prediction is ________.
a) $167,379
b) $174,200
c) $153,900
d) $136,700
e) $140,011
A researcher is interested in estimating the mean weight of a semi tracker truck to
determine the potential load capacity. She takes a random sample of 17 trucks and
computes a sample mean of 20,000 pounds with sample standard deviation of 1,500.
The 90% confidence interval for the population mean rod length is ______________.
a) 19,365 to 20,635
b) 19,367 to 20,633
c) 19,514 to 20,486
d) 19,515 to 20,485

e) 18,500 to 21,500
A production run of 500 items resulted in 29 defectives items. A defective item is coded
as 1 and a good item as 0. The following is an output from Minitab.
The null hypothesis for a one-sample runs test is __________________.
a) successive items did not constitute a random sample.
b) successive items constituted a random sample
c) the proportion of defective items is 0.05
d) the proportion of defective items is 0.058
e) the distribution is binomial
Ray Crofford is evaluating investment alternatives to invest $100,000 which he
inherited from his grandfather. His investment advisor has identified four alternatives
and constructed the following payoff table which shows expected profits (in $10,000's)
for various market conditions.

For the 'Stocks' and 'Bonds' choices, the indifference value of Hurwicz's alpha is ____.
a) 0.82
b) 0.71
c) 0.65
d) 0.33
e) 0.50
A sample was taken of the salaries of four employees from a large company. The
following are their salaries (in thousands of dollars) for this year: 33, 36, 41, and 47.
The median of their salaries is approximately
a) 38.5
b) 34.5
c) 34
d) 44.5
e) 38

The following graph is a binomial distribution withn = 6.
This graph reveals that ____________.
a) p = 0.5
b) p = 1.0
c) p = 0
d) p < 0.5
e) p = 1.5
Ray Crofford is evaluating investment alternatives to invest $100,000 which he
inherited from his grandfather. His investment advisor has identified four alternatives
and constructed the following payoff table which shows expected profits (in $10,000's)
for various market conditions.
If Ray uses the Hurwicz criterion with alpha = 0.5, the appropriate choice is ______.
a) T-Bills
b) Stocks
c) Bonds
d) Mixture
e) None
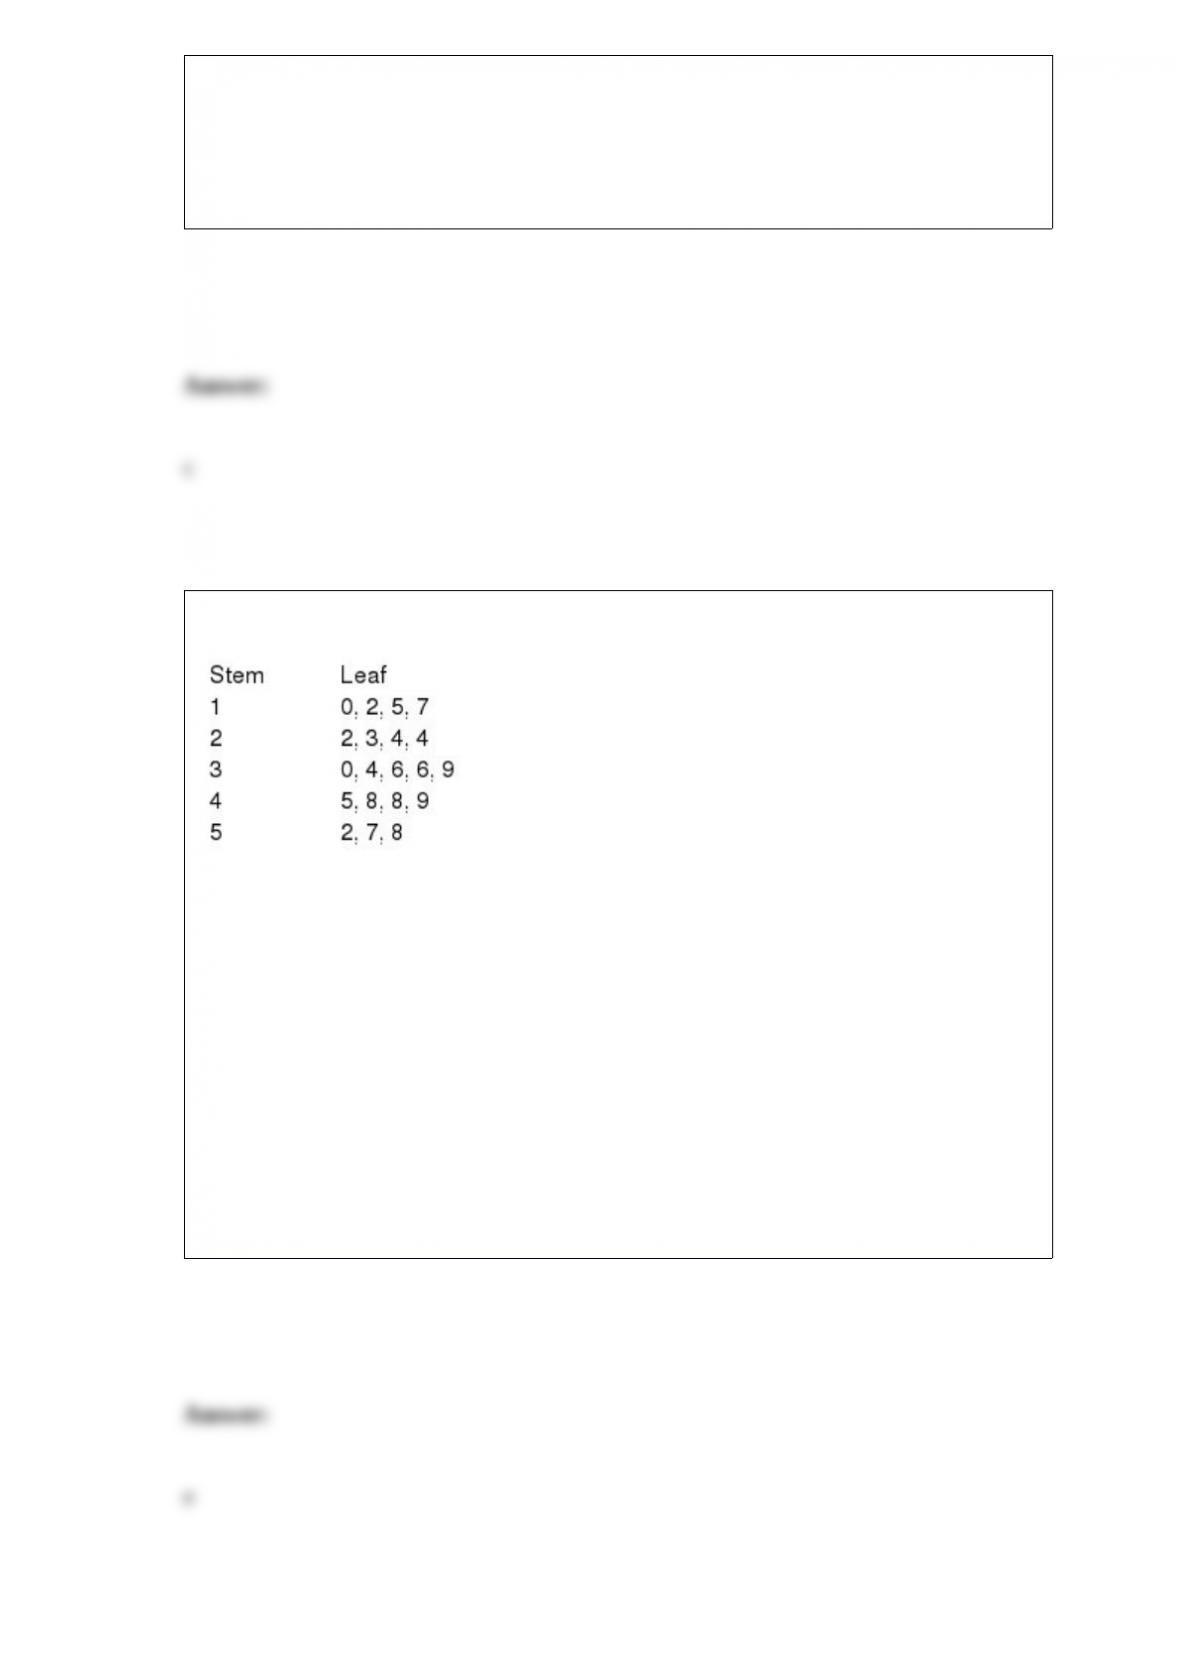
Consider the following stem and leaf plot:
Suppose that a frequency distribution was developed from this, and there were 5 classes
(10-under 20, 20-under 30, etc.). What would the frequency be for class 30-under 40?
a) 3
b) 4
c) 6
d) 7
e) 5

An automobile dealer wishes to investigate the relation between the gender of the buyer
and type of vehicle purchased. Based on the following joint probability table that was
developed from the dealer's records for the previous year, P (Male) = ________
a) 0.48
b) 0.50
c) 0.20
d) 0.02
e) 0.60
The number of standard deviations that a value (x) is above or below the mean is the
_________________.
a) absolute deviation
b) coefficient of variation
c) interquartile range
d) z score
e) correlation coefficient

Suppose 40% of all college students have a computer at home and a sample of 64 is
taken. What is the probability that more than 30 of those in the sample have a computer
at home?
a) 0.3686
b) 0.1314
c) 0.8686
d) 0.6314
e) 0.1343
Ray Crofford is evaluating investment alternatives for the $100,000 which he inherited
from his grandfather. His investment advisor has identified two alternatives and
constructed the following tables which show (1) expected profits (in $10,000's) for
various market conditions and their probabilities, and (2) the advisor's track record on
predicting Bull and Bear markets.

If the advisor predicts a Bull market the EMV of the Stocks alternative, using revised
probabilities, is ________.
a) $168,900
b) $207,650
c) $157,300
d) $306,000
e) $134,650
Sami Schmitt believes that number of cars arriving at his Scrub and Shine Car Wash
follow a Poisson distribution. He collected a random sample and constructed the
following frequency distribution to test his hypothesis.
The observed value of chi-square for this goodness-of-fit test is _____.
a) 0.73
b) 6.72
c) 3.15
d) 7.81
e) 9.87

Cindy Ho, VP of Finance at Discrete Components, Inc. (DCI), theorizes that the
discount level offered to credit customers affects the average collection period on credit
sales. Accordingly, she has designed an experiment to test her theory using four sales
discount rates (0%, 2%, 4%, and 6%) by randomly assigning five customers to each
sales discount rate. In Cindy's experiment, "sales discount rate" is ______.
a) the dependent variable
b) a treatment variable
c) a blocking variable
d) a concomitant variable
e) a constant
The following ANOVA table is from a multiple regression analysis with n = 35 and four
independent variables.
The adjusted R2 value is __________.
a) 0.80
b) 0.70
c) 0.66
d) 0.76
e) 0.30
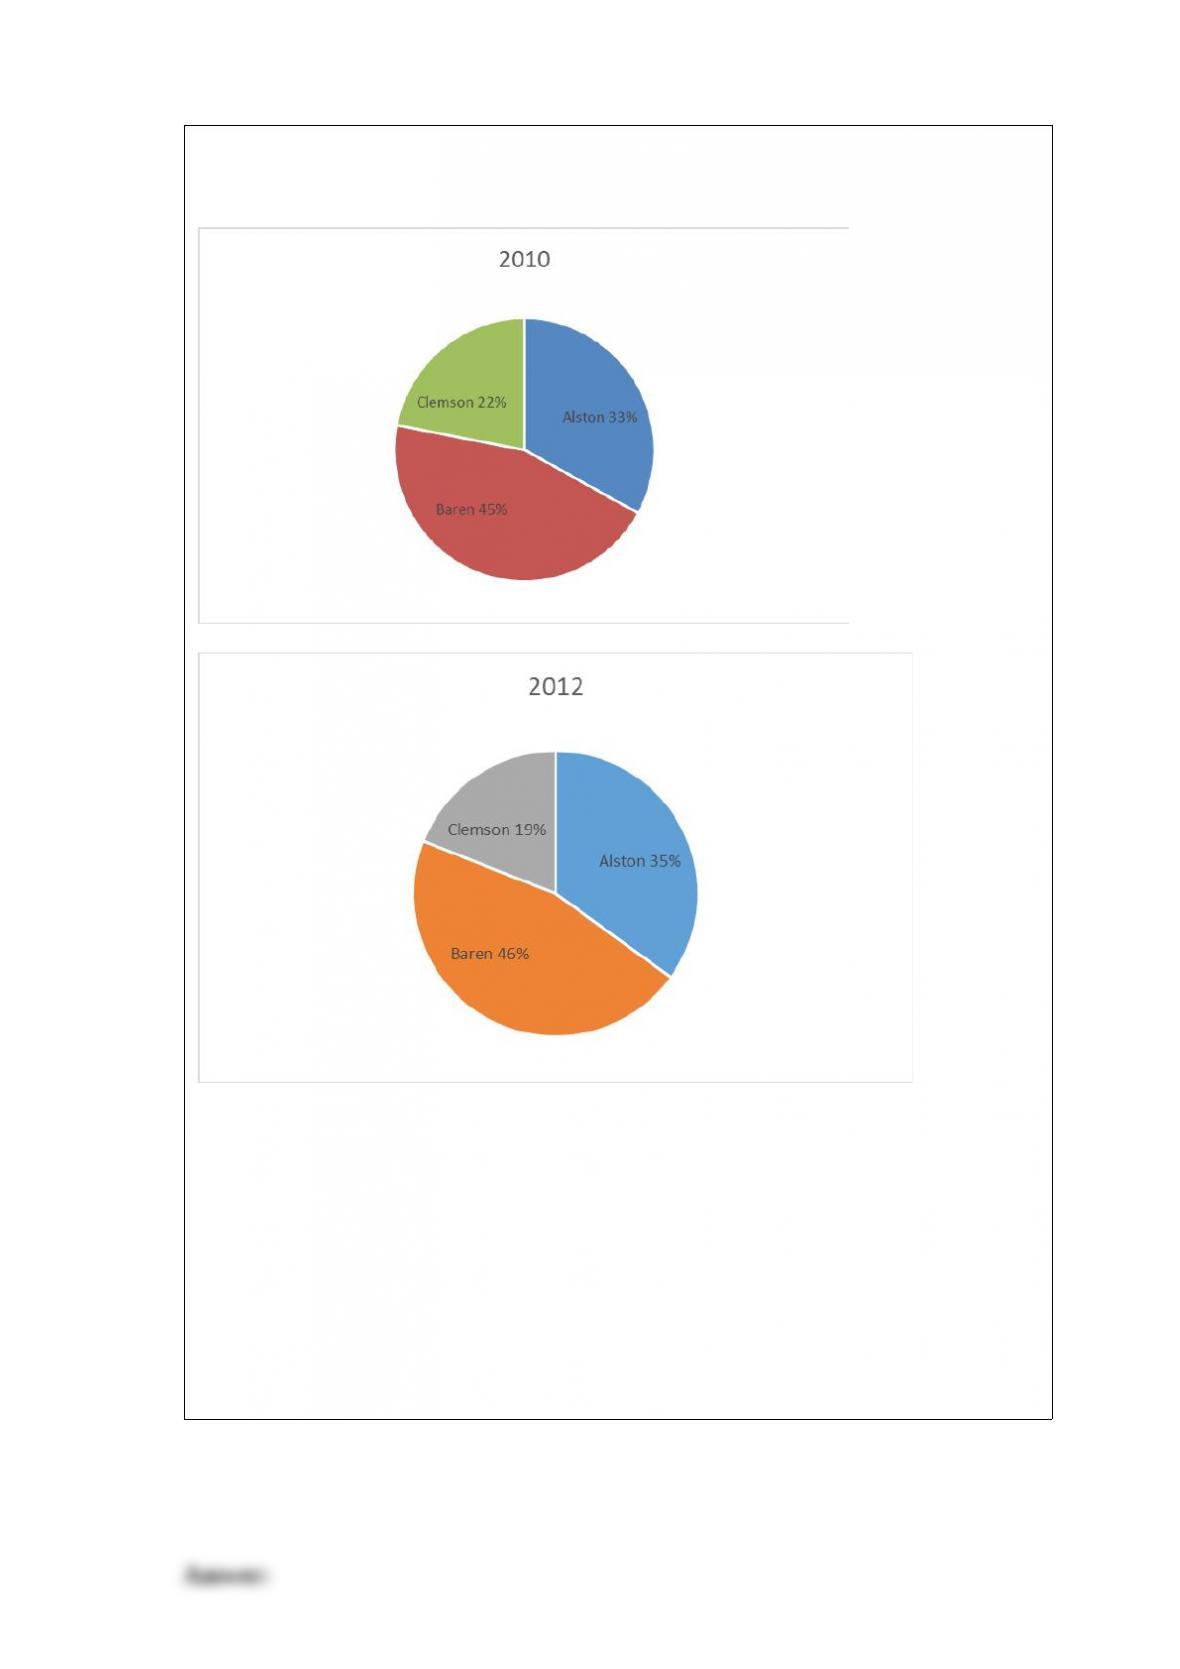
The 2010 and 2012 market share data of the three competitors (Alston, Baren, and
Clemson) in an oligopolistic industry are presented in the following pie charts.
Which of the following may be a false statement?
a) Sales revenues declined at Clemson.
b) Only Clemson lost market share.
c) Alston gained market share.
d) Baren gained market share.
e) Both Alston and Baren gained market share

Which of the following iterative search procedures for model-building in a multiple
regression analysis reevaluates the contribution of variables previously include in the
model after entering a new independent variable?
a) Backward elimination
b) Stepwise regression
c) Forward selection
d) All possible regressions
e) Backward selection
Trey Leeman, Operations Manager at National Consumers, Inc. (NCI), is evaluating
alternatives for increasing capacity at NCI's Fountain Hill plant. He has identified four
alternatives, and has constructed the following payoff table which shows payoffs (in
$1,000,000's) for the three possible levels of market demand.
The opportunity loss for the combination "Purchase New Equipment" and "High" is
___.
a) 0.0
b) 0.5
c) 2.5
d) 3.0

e) 3.5
Performance records for 18 salespersons are selected to investigate whether
compensation methods are a significant motivational factor.
A Kruskal-Wallis test is to be performed with
= 0.01. The critical chi-square value is
_______.
a) 15.086
b) 13.277
c) 7.779
d) 9.210
e) 8.657
Each day, the office staff at Oasis Quick Shop prepares a frequency distribution and an
ogive of sales transactions by dollar value of the transactions. Saturday's cumulative
frequency ogive follows.

The percentage of sales transactions on Saturday that were between $100 and $150 was
_____________.
a) 20%
b) 40%
c) 60%
d) 80%
e) 10%
Ophelia O'Brien, VP of Consumer Credit of American First Banks (AFB), monitors the
default rate on personal loans at the AFB member banks. One of her standards is: "no
more than 5% of personal loans should be in default." On each Friday, the default rate
is calculated for a sample of 500 personal loans. Last Friday's sample contained 30
defaulted loans. Ophelia's null hypothesis is _______.
a) p > 0.05
b) p =0.05
c)
30
d)
> 30
e) s> 30

In a regression analysis if SST = 150 and SSR = 100, r 2= _________.
a) 0.82
b) 1.22
c) 1.50
d) 0.67
e) -1.00


