A lube and oil change business believes that the number of cars that arrive for service is
the same each day of the week. If the business is open six days a week (Monday –
Saturday) and a random sample of n = 200 customers is selected, the critical value for
testing the hypothesis using a goodness-of-fit test is x2 = 9.2363 if the alpha level for
the test is set at .10.
The number of no-shows for dinner reservations at the Cottonwood Grille is a discrete
random variable with the following probability distribution:
Based on this information, the most likely number of no-shows on any given day is 0
customers.
Given a sample of data for use in simple linear regression, the values for the slope and
the intercept are chosen to minimize the sum of squared errors.
Typically, it is possible to include a larger number of questions in a phone survey than
in a mail survey since it takes less time to complete the survey over the phone.
If a set of data has 1,500 values, the 30th percentile value will correspond to the 450th
value in the data when the data have been arranged in numerical order.
One way to improve the response rate for a survey is to administer the surveys directly
to the respondents.
A two-tailed test for two population variances could have a null hypothesis like the
following:
H0 : =
A report recently submitted to the managing partner for a market research company
stated “the hypothesis test may have resulted in either a Type I or a Type II error. We
won’t know which one occurred until later.” This statement is one that we might
correctly make for any hypothesis that we have conducted.
In a two-tailed hypothesis test the area in each tail of the rejection region is equal to α.
Stratified random sampling is the same thing as simple random sampling.
The Cromwell Construction Company has the opportunity to enter into a contract to
build a mountain road. The following table shows the probability distribution for the
profit that could occur if it takes the contract:
Based on this information, the profit standard deviation for the company if it takes the
contract is $11,235.
A fixed effects analysis of variance differs from a random-effects analysis of variance in
the way in which the sums of squares are computed.
A cell phone company believes that 90 percent of their customers are satisfied. They
survey a sample of n = 100 customers and find that 82 say they are satisfied. In
calculating the standard error of the sampling distribution (σp) the proportion to use is
0.82.
If the mean age for all students that attend your university is 24.78 years, it would be
reasonable to expect that the mean of a sample of students selected from that population
would also equal 24.78 years as long at the sampling is done using sound statistical
methods.
In estimating a confidence interval for the difference between two means, when the
samples are independent and the standard deviations are unknown, it can be acceptable
for there to be small violations of the assumptions of normality and equal variances,
especially when the sample sizes are equal.
An accountant has recently prepared a report for a client that contains a variety of
graphs and charts. In doing so, she has used descriptive statistical methods.
A high coefficient of determination (R2) implies that the regression model will be a
good predictor for future values of the dependent variable given the value of the
independent variable.
At a potato processing plant in the state of Washington, 400 potatoes have been
examined for disease. Of these, four were diseased. Based on this, the plant manager
has stated that the probability of finding a diseased potato is 0.01. He is applying
subjective probability to arrive at this 0.01 value.
The editor of a local newspaper is interested in determining the percentage of
subscribers who read the paper’s editorials. The statistical technique that he would use
is called estimation.

Recently, a marketing research company reported that based on a random sample of 300
households the mean number of trips to a major shopping mall per month per household
is 4.12 trips. This value is referred to as a parameter and is subject to sampling error.
In process improvement efforts, the goal is to first remove the common cause variation
and then to reduce the special cause variation in a system.
A contract calls for the strength of a steel rod to stand up to pressure of 200 lbs per
square inch on average. The contract also requires that the variability in strength for
individual steel rods be no more than 5 pounds per square inch. If a random sample of n
= 15 rods is selected and the sample standard deviation is 6.7 pounds, the test statistic is
approximately χ2 = 25.138.
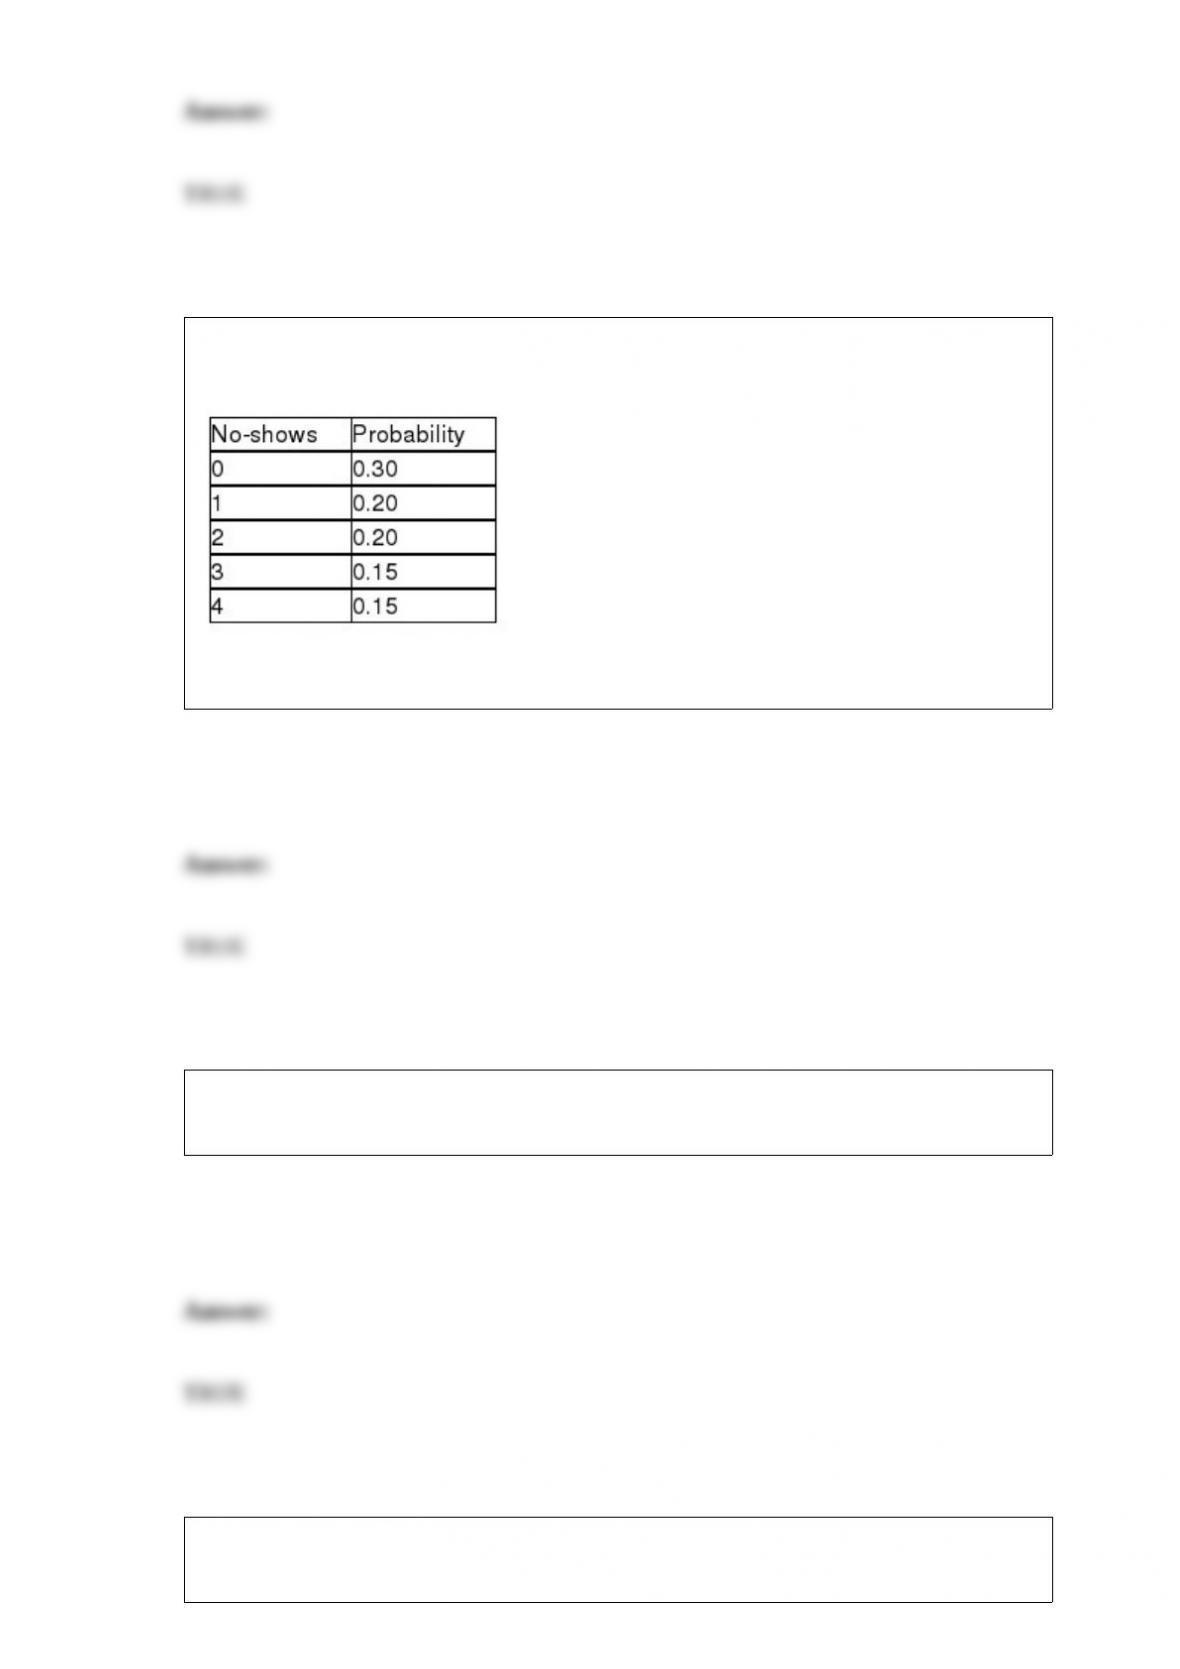
The number of no-shows each day for dinner reservations at the Cottonwood Grille is a
discrete random variable with the following probability distribution:
Based on this information, the expected number of no-shows is 1.65 customers.
If a population mean is equal to 200, the sample mean for a random sample selected
from the population is about as likely to be higher or lower than 200.
A claim was recently made that stated that the median income for male and female
graduates is the same for those graduating with a degree in operations management. The
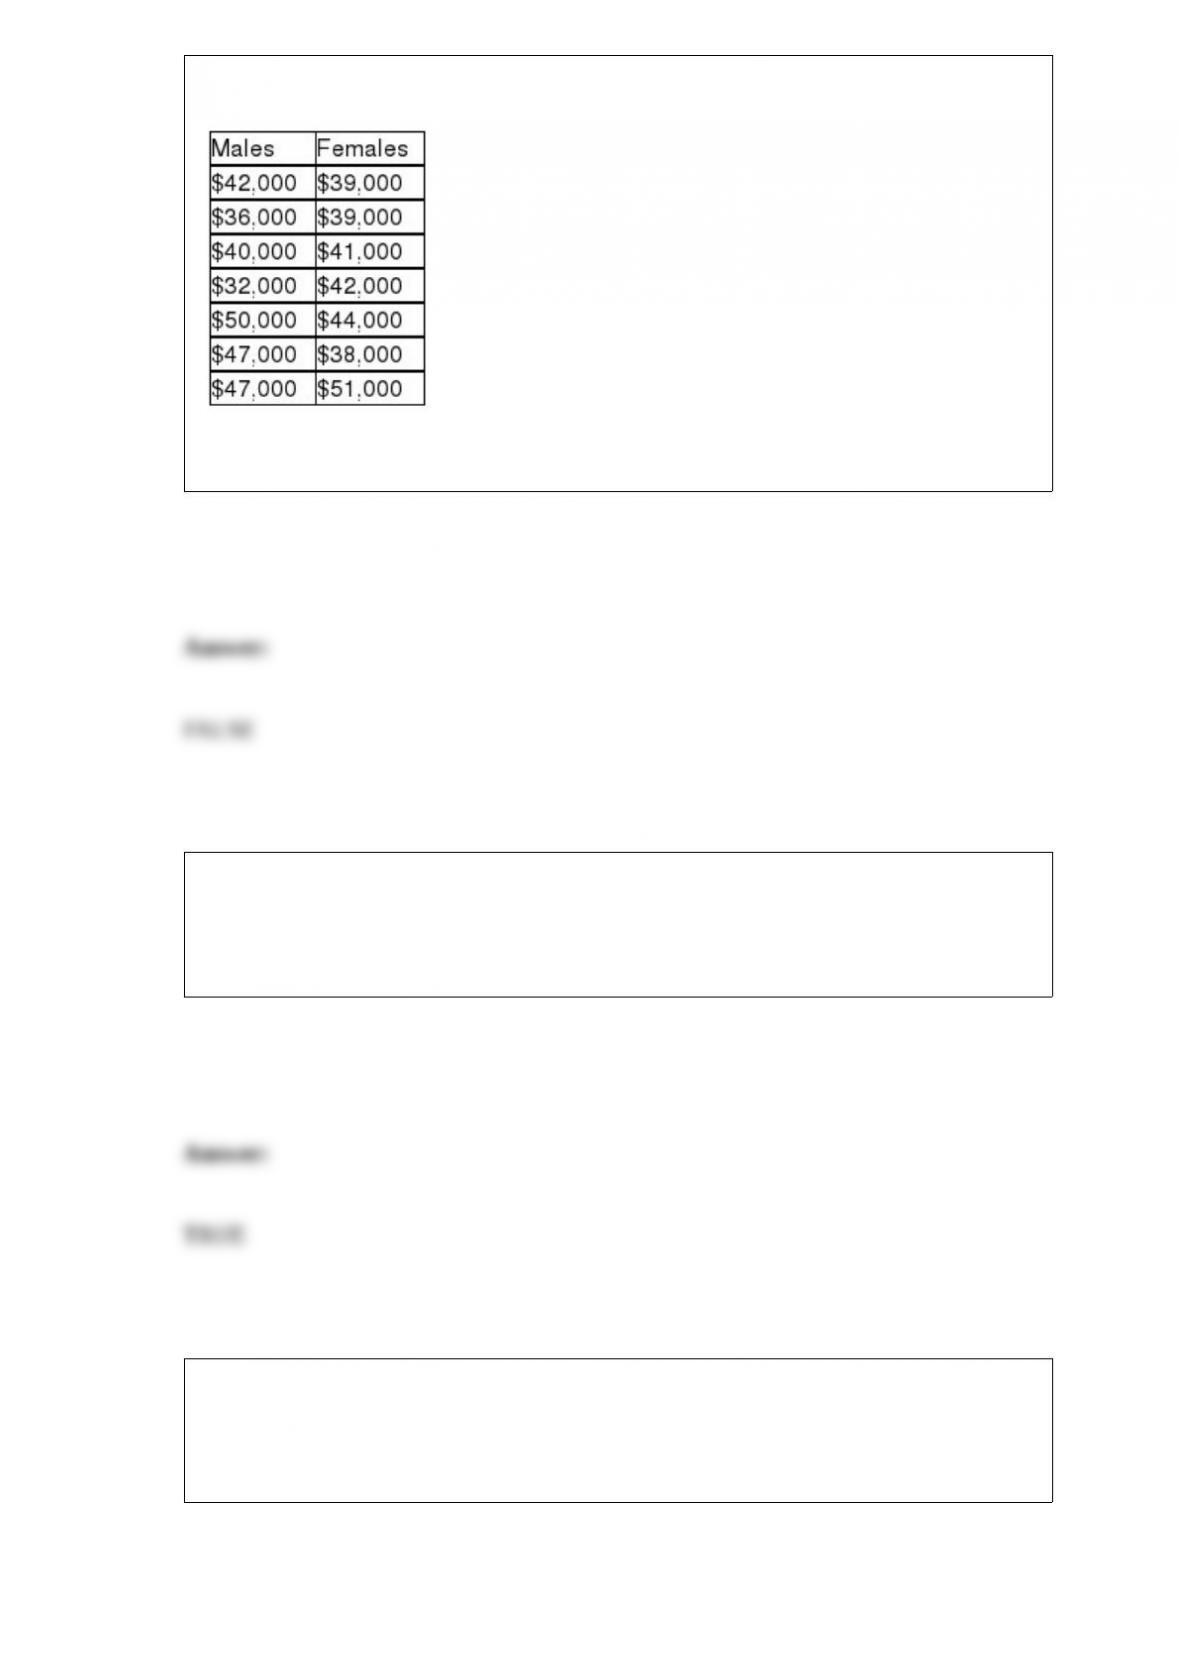
following sample data were collected:
In employing the Mann-Whitney U test, the U test statistic for the males is 43.5
If you were planning to take a small group out to dinner on a Thursday evening and you
were considering whether to call ahead for a reservation, the method of probability
assessment you would most likely use to assess the chances of being able to get in for
dinner without having a reservation would be subjective assessment.
Renton Industries makes replacement parts for the automobile industry. As part of the
company’s capacity planning, it needs a long-range total demand forecast. The
following information was generated based on 10 years of historical data on total
number of parts sold each year.
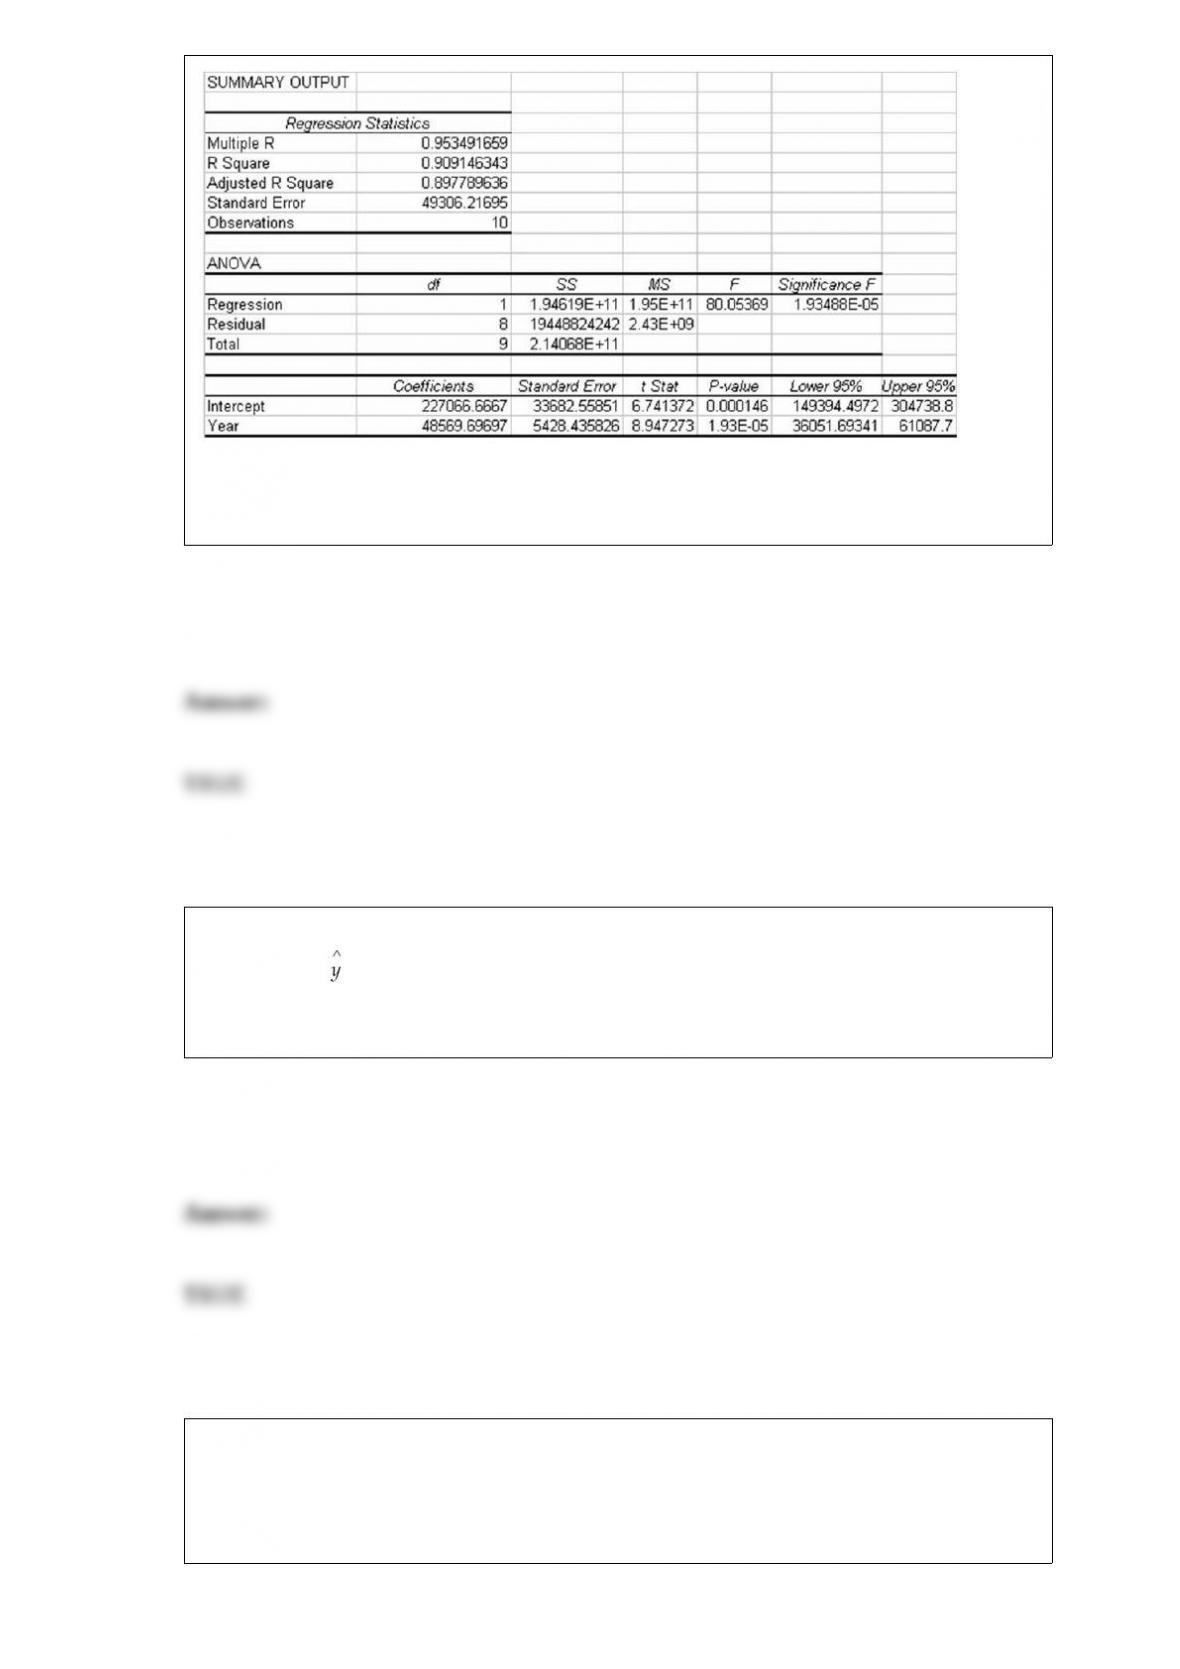
Based on this information, the percent of variation in the number of parts sold that is
explained by the linear trend model is approximately 90.9.
The following regression model has been computed based on a sample of twenty
observations: = 34.2 + 19.3x. The first observations in the sample for y and x were
300 and 18, respectively. Given this, the residual value for the first observation is
approximately 81.6.
When deciding the null and alternative hypotheses, the rule of thumb is that if the claim
contains the equality (e.g., at least, at most, no different from, etc.), the claim becomes
the null hypothesis. If the claim does not contain the equality (e.g., less than, more than,
different from), the claim is the alternative hypothesis.
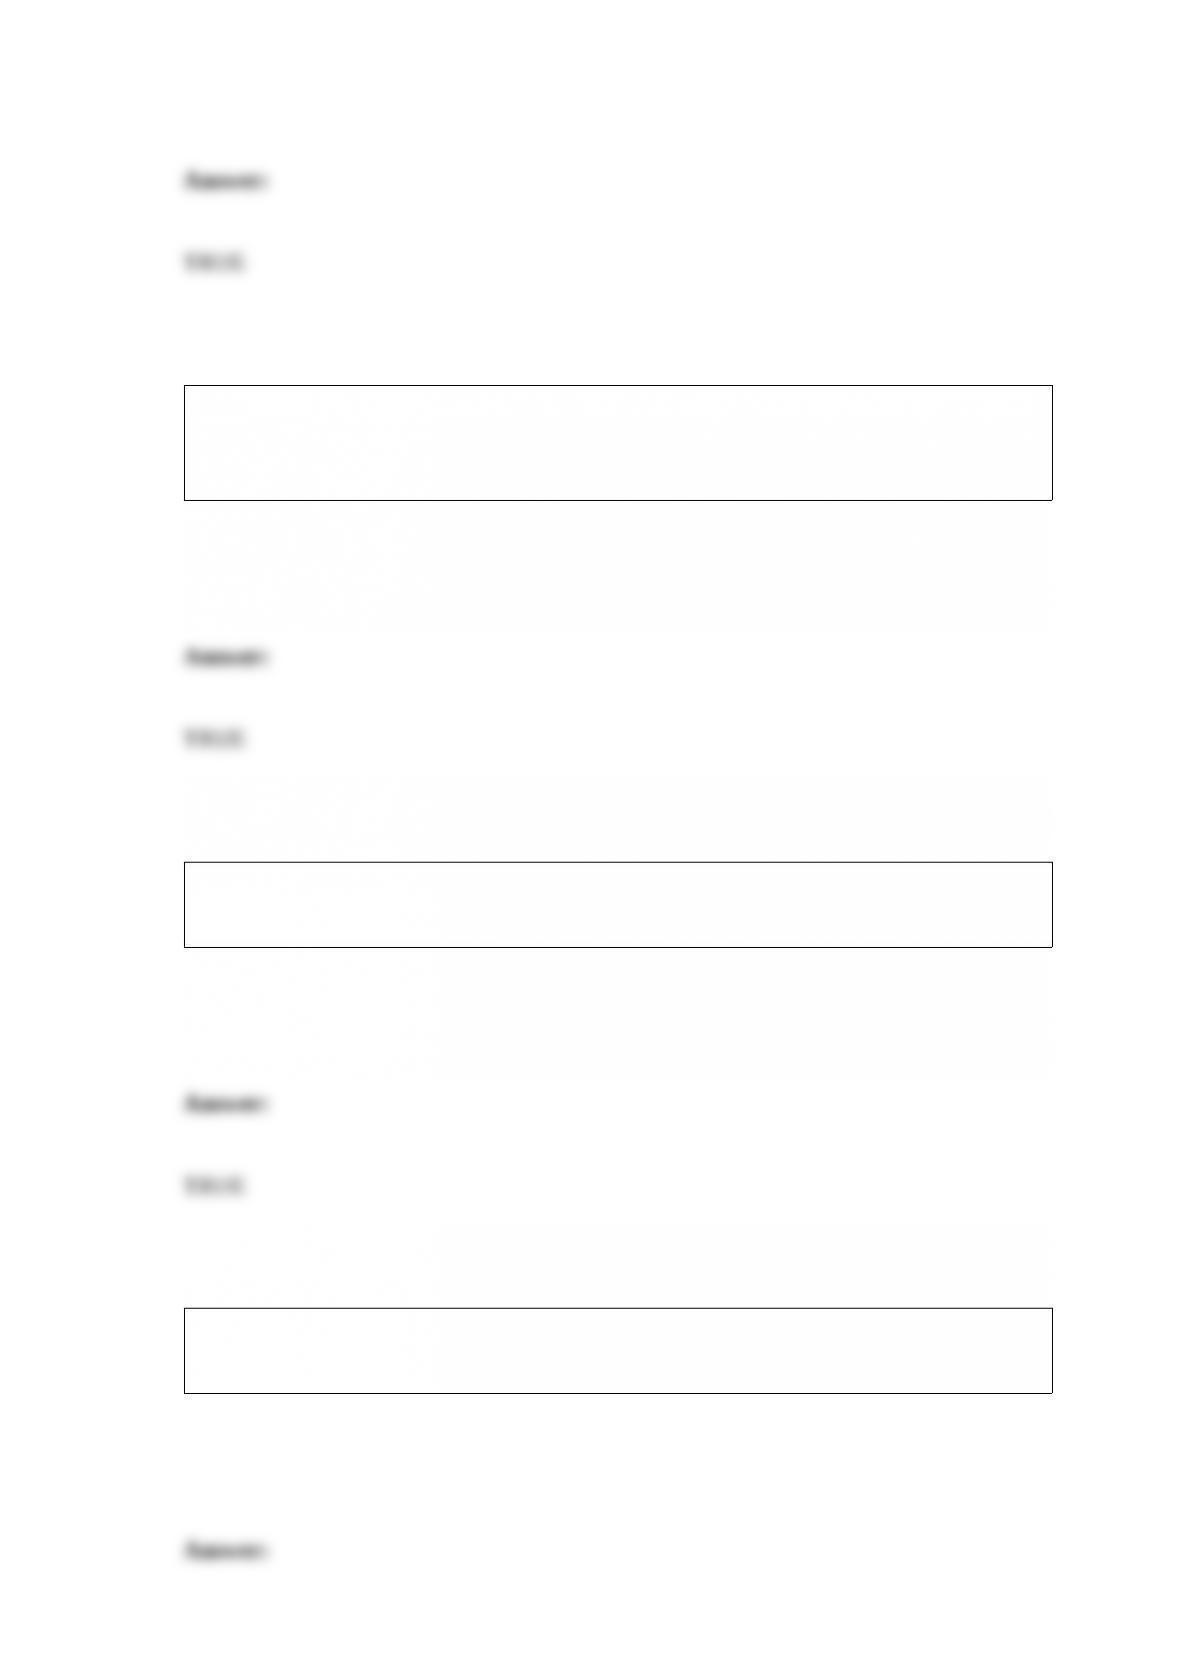
If a polynomial model has a larger R-square than a linear model for the same set of
data, this is one indication that the polynomial model fits the data better than the linear
model.
In multiple regression analysis, the model will be developed with one dependent
variable and two or more independent variables.
In constructing a stem and leaf diagram, there is a hard-and-fast rule for defining the
stem and the leaves.
The frequency distribution of most processes’ statistics will begin to resemble the shape
of the normal distribution as the values are collected and grouped into classes.
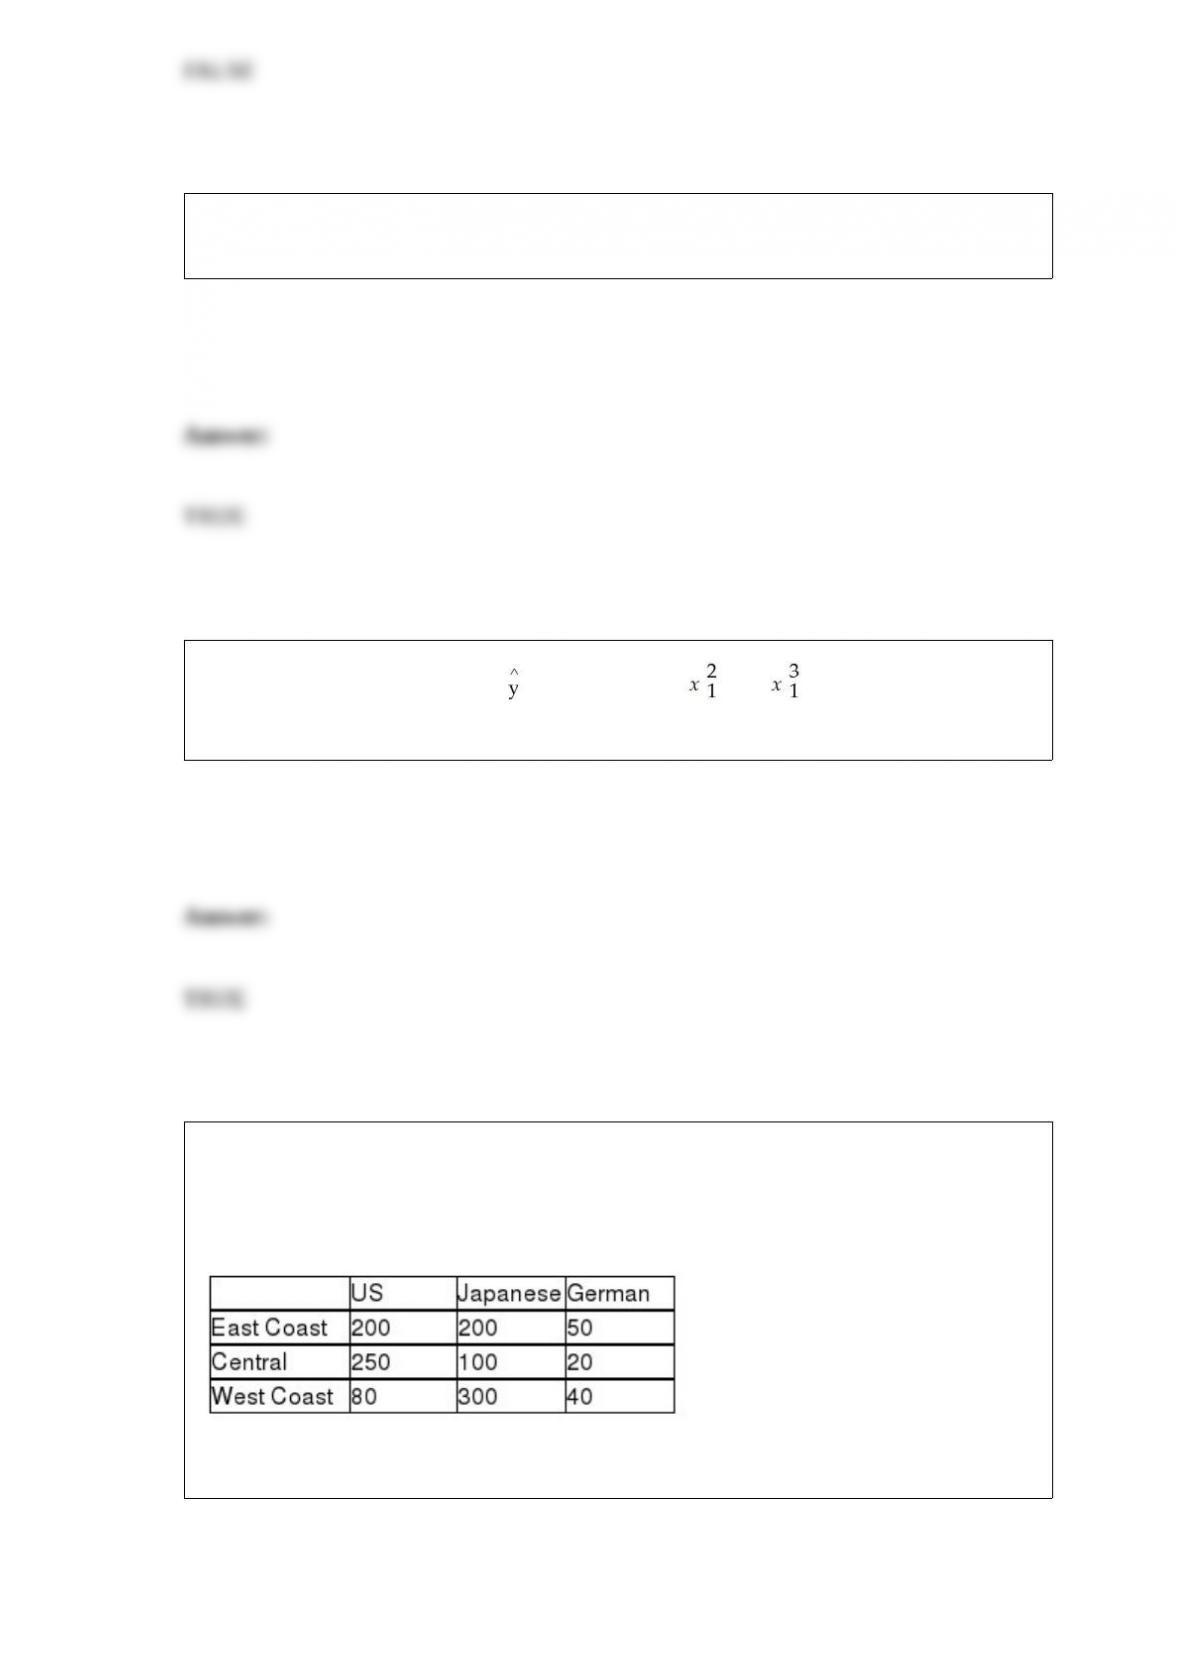
A regression model of the form: = B0 + B1x1 + B2 + B3+ ε is called a 3rd order
polynomial model.
A study was recently done in the United States in which car owners were asked to
indicate whether their most recent car purchase was a U.S. car, a German car, or a
Japanese car. The people in the survey were divided by geographic region in the United
States. The following data were recorded.
Given this situation, the sample size used in this study was nine.

In order to assume that the sampling distribution for a proportion is approximately
normal, the population proportion must be very close to 0.50.
The following is an appropriate statement of the null and alternate hypotheses for a test
of a population mean:
H0: μ < 50
HA : μ > 50
Classical probability assessment is likely to be the most common method of probability
assessment used in business decision making.
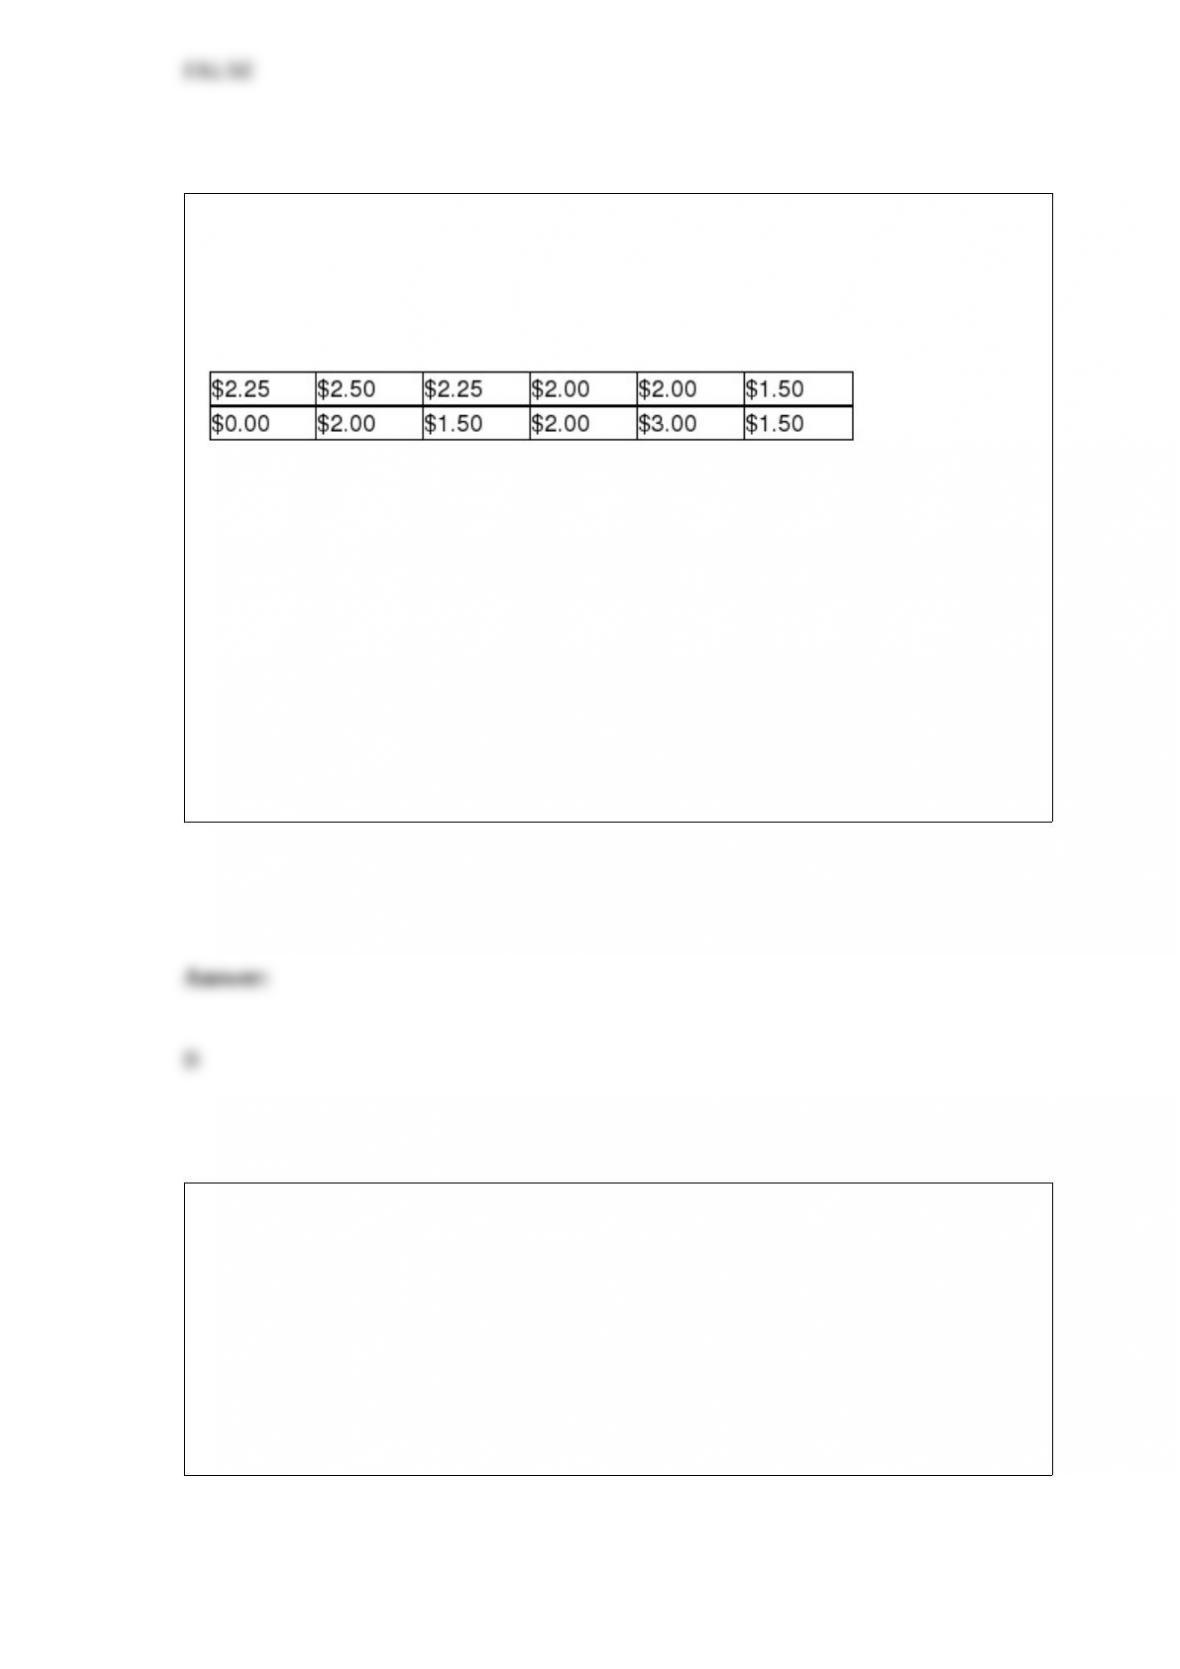
Allante Pizza delivers pizzas throughout its local market area at no charge to the
customer. However, customers often tip the driver. The owner is interested in estimating
the mean tip income per delivery. To do this, she has selected a simple random sample
of 12 deliveries and has recorded the tips that were received by the drivers. These data
are:
Suppose the owner is interested in developing a 90% confidence interval estimate.
Given the fact that the population standard deviation is unknown, what distribution will
be used to obtain the critical value?
A) s-distribution
B) t-distribution
C) z-distribution
D) k-distribution
Which of the following is NOT true of a bar chart?
A) It is used for numerical data.
B) The bars can be either horizontal or vertical.
C) It can show either frequency or relative frequency.
D) It is used for categorical data.
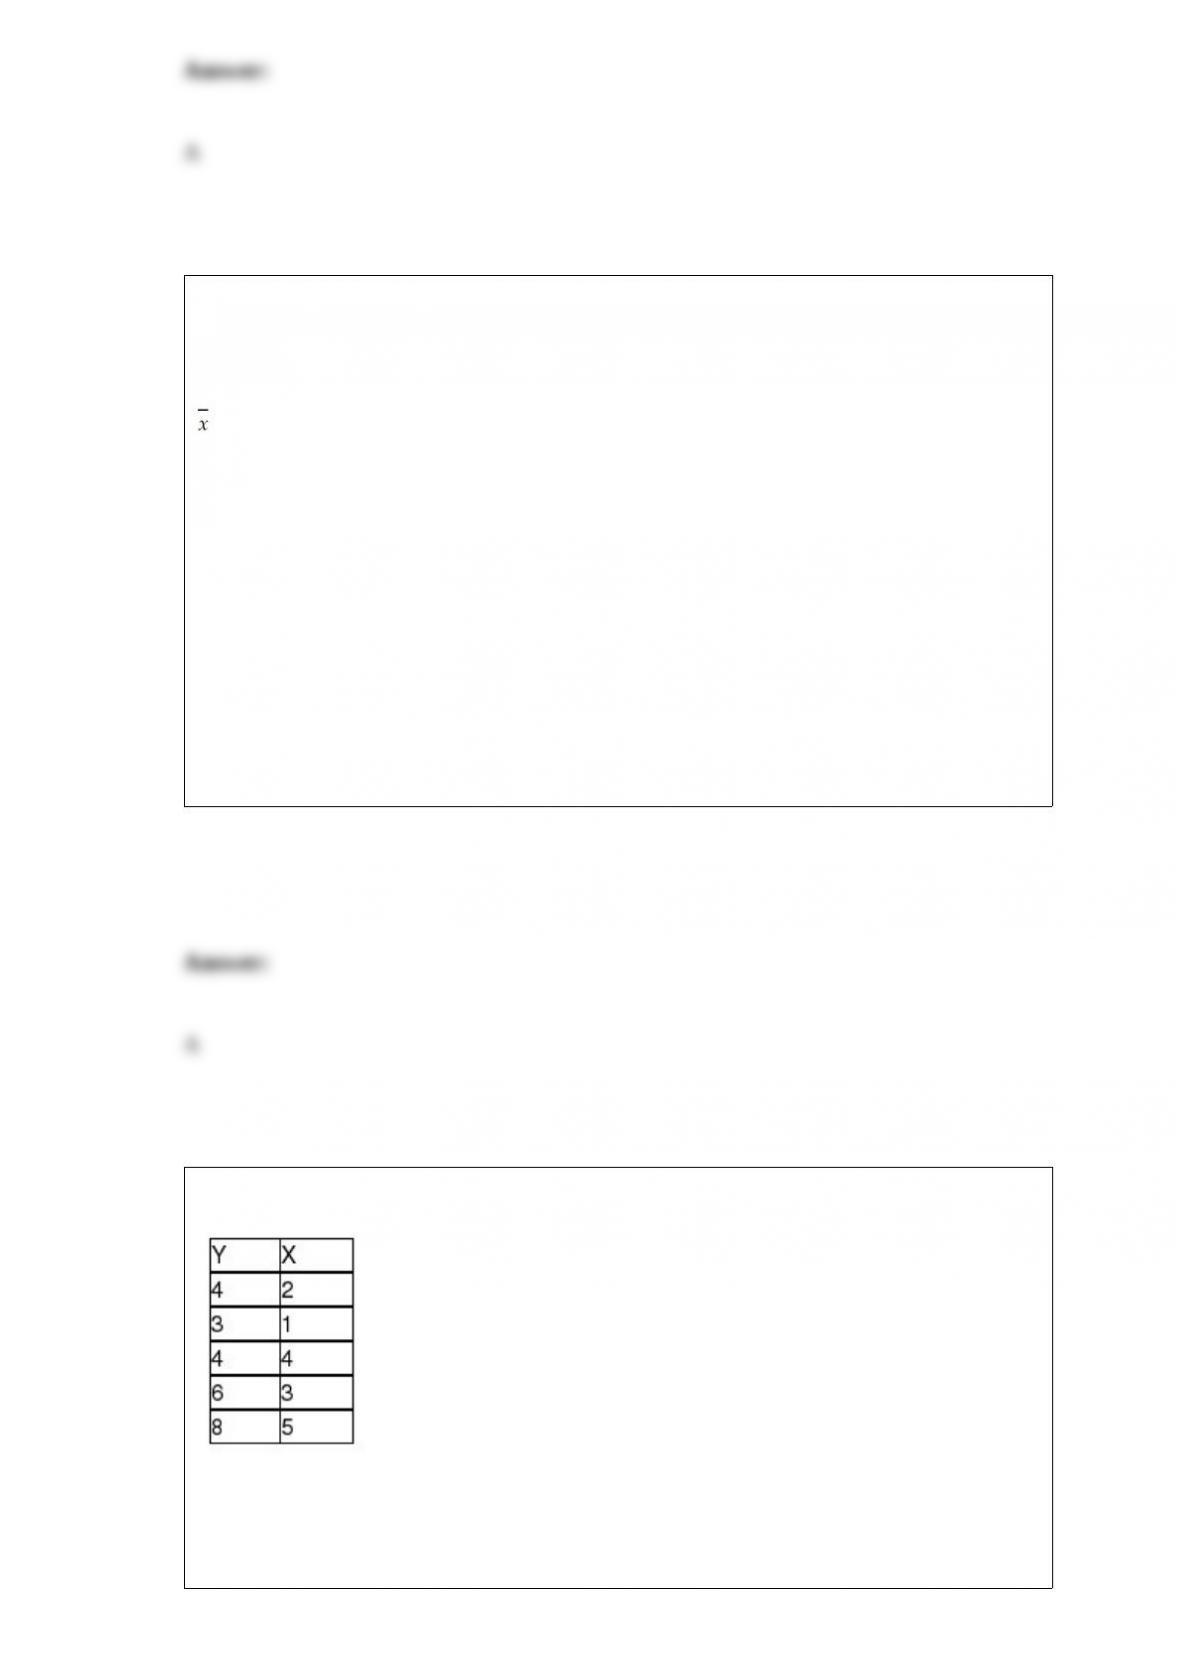
In an application to estimate the mean number of miles that downtown employees
commute to work roundtrip each day, the following information is given:
n = 20
= 4.33
s = 3.50
Based on this information, the upper limit for a 95 percent confidence interval estimate
for the true population mean is:
A) about 5.97 miles.
B) about 7.83 miles.
C) nearly 12.0 miles.
D) about 5.86 miles.
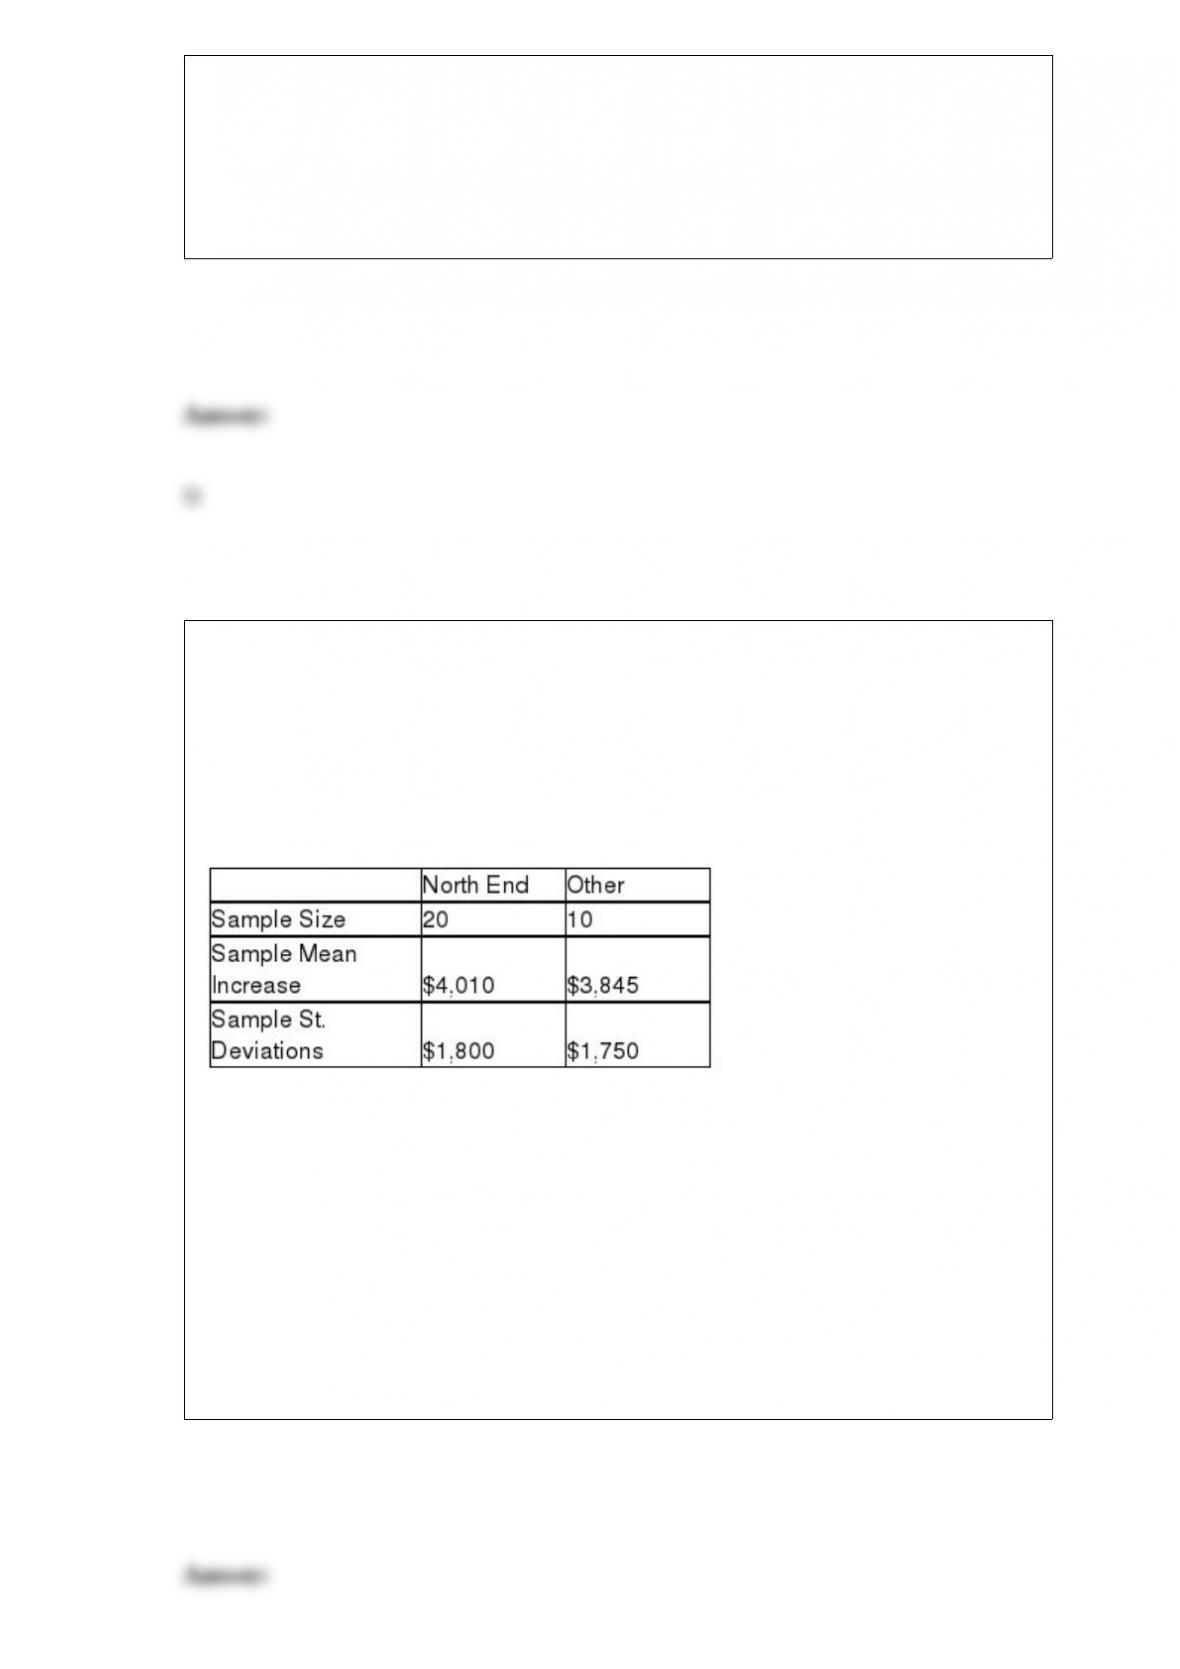
Given the data below, one ran the simple regression analysis of Y on X.
The relationship between Y and X is
A) significant at the alpha = 1 percent level.
B) significant at the alpha = 5 percent level.
C) significant at the alpha = 10 percent level.
D) not significant at the alpha = 10 percent level.
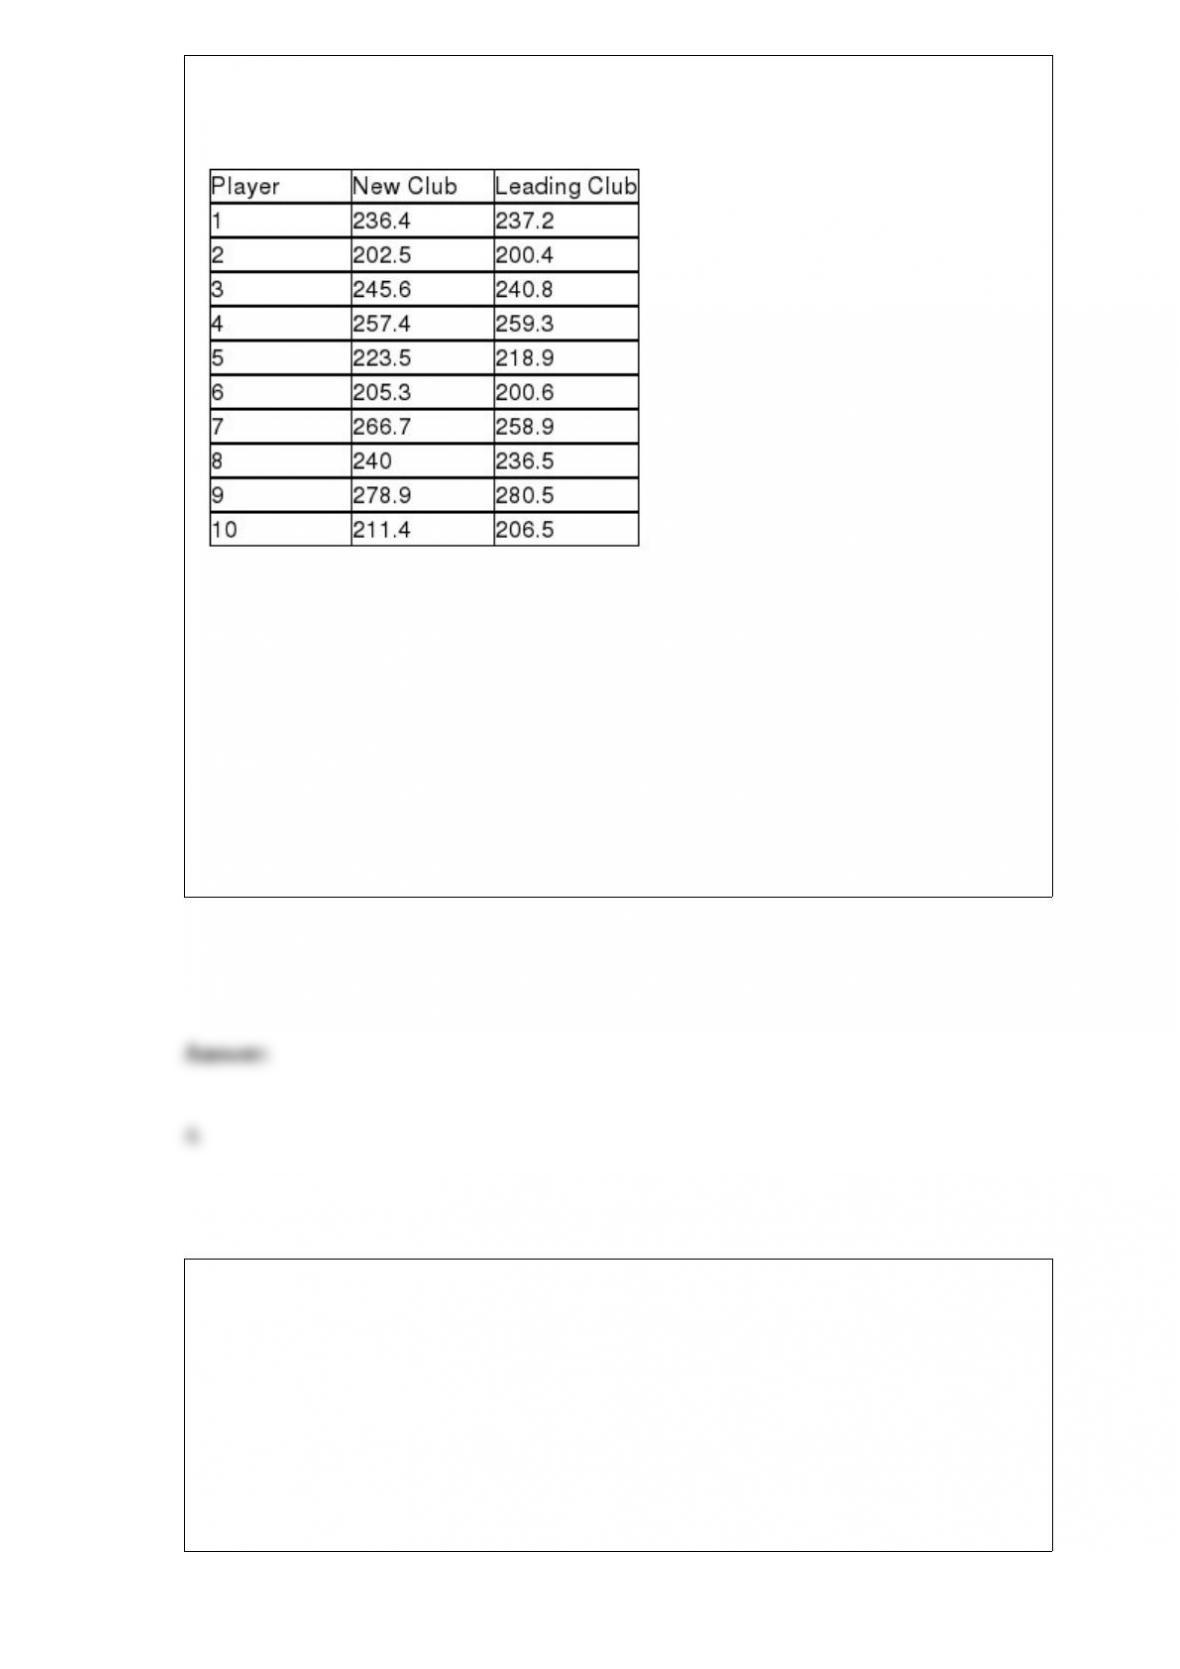
There have been complaints recently from homeowners in the north end claiming that
their homes have been assessed at values that are too high compare with other parts of
town. They say that the mean increase from last year to this year has been higher in
their part of town than elsewhere. To test this, the assessor’s office staff plans to select a
random sample of north end properties (group 1) and a random sample of properties
from other areas within the city (group 2) and perform a hypothesis test. The following
sample information is available:
Assuming that the null hypothesis will be tested using an alpha level equal to 0.05, what
is the critical value?
A) z = 1.578
B) t = 1.7011
C) t = 0.2388
D) t = 2.0484

The general format for a confidence interval is:
A) point estimate z (standard deviation).
B) point estimate (critical value)(standard error).
C) margin of error (confidence coefficient) (standard error).
D) point estimate (critical value)(standard deviation)
Swift is the holding company for Swift Transportation Co., Inc., a truckload carrier
headquartered in Phoenix, Arizona. Swift operates the largest truckload fleet in the
United States. Before Swift switched to its current computer-based billing system, the
average payment time from customers was approximately 40 days. Suppose before
purchasing the present billing system, it performed a test by examining a random
sample of 24 invoices to see if the system would reduce the average billing time. The
sample indicates that the average payment time is 38.7 days.
The company that created the billing system indicates that the system would reduce the
average billing time to less than 40 days. Conduct a hypothesis test to determine if the
new computer-based billing system would reduce the average billing time to less than
40 days. Assume the standard deviation is known to be 6 days. Use a significance level
of 0.025.
A) Since z = -0.423 > -1.96, we will not reject H0, there is not sufficient evidence to
conclude that the new computer-based billing system would reduce the average billing
time to less than 40 days.
B) Since z = -1.0614 > -1.96, we will not reject H0, there is not sufficient evidence to
conclude that the new computer-based billing system would reduce the average billing
time to less than 40 days.

C) z = -1.0231 > -1.96, we will reject H0, there is sufficient evidence to conclude that
the new computer-based billing system would reduce the average billing time to less
than 40 days.
D) z = 0.341 > -1.96, we will reject H0, there is sufficient evidence to conclude that the
new computer-based billing system would reduce the average billing time to less than
40 days.
A random variable is normally distributed with a mean of 25 and a standard deviation of
5. If an observation is randomly selected from the distribution, what value will be
exceeded 85% of the time?
A) 16.2
B) 17.9
C) 19.8
D) 14.2
Most companies that make golf balls and golf clubs use a one-armed robot named “Iron
Byron” to test their balls for length and accuracy, but because of swing variations by
real golfers, these test robots don’t always indicate how the clubs will perform in actual
use. One company in the golfing industry is interested in testing its new driver to see if
has greater length off the tee than the best-selling driver. To do this, it has selected a
group of golfers of differing abilities and ages. Its plan is to have each player use each
of the two clubs and hit five balls. It will record the average length of the drives with
each club for each player. The resulting data for a sample of 10 players is:
Based on these sample data, what is the point estimate for the difference between the
mean distance for the new driver versus the leading driver?
A) 2.81
B) 1.55
C) -3.45
D) 233.4
Given a binomial distribution with n = 8 and p = 0.40, obtain the mean.
A) 2.8
B) 3.2
C) 3.6
D) 4.2

In Excel, what procedure is used to select random numbers?
A) The random numbers function
B) Click on the Data tab, then click on Data Analysis, then click on Sampling
C) Click on the Data tab, then click on Data Analysis, then click on Random Number
Generation
D) Random numbers are not available in Excel.
The t-test for the mean difference between 2 related populations assumes that the
respective:
A) sample sizes are equal.
B) sample variances are equal.
C) populations are approximately normal or sample sizes are large.
D) All of the above

When small samples are used to estimate a population mean, in cases where the
population standard deviation is unknown:
A) the t-distribution must be used to obtain the critical value.
B) the resulting margin of error for a confidence interval estimate will tend to be fairly
small.
C) there will be a large amount of sampling error.
D) None of the above
In conducting a personal interview, what problem can result if the interviewer is
allowed to arbitrarily decide who should be interviewed?
A) Nonresponses
B) Missing data
C) Bias
D) Poor response rate
You are given the following results of a paired-difference test:
= -4.6

sd = 0.25
n = 16
Construct a 90% confidence interval estimate for the paired difference in mean values.
A) -2.86 ——- -2.53
B) -5.72 ——- -5.18
C) -3.81 ——- -3.71
D) -4.71 ——- -4.49
If a study is set up in such a way that a sample of people is surveyed to determine
whether they have ever used a particular product, the likely probability distribution that
would describe the random variable, the number who say yes, is a:
A) binomial distribution.
B) Poisson distribution.
C) uniform distribution.
D) continuous distribution.
Given a binomial distribution with n = 8 and p = 0.40, obtain the standard deviation.

A) 1.921
B) 1.386
C) 1.848
D) 1.465
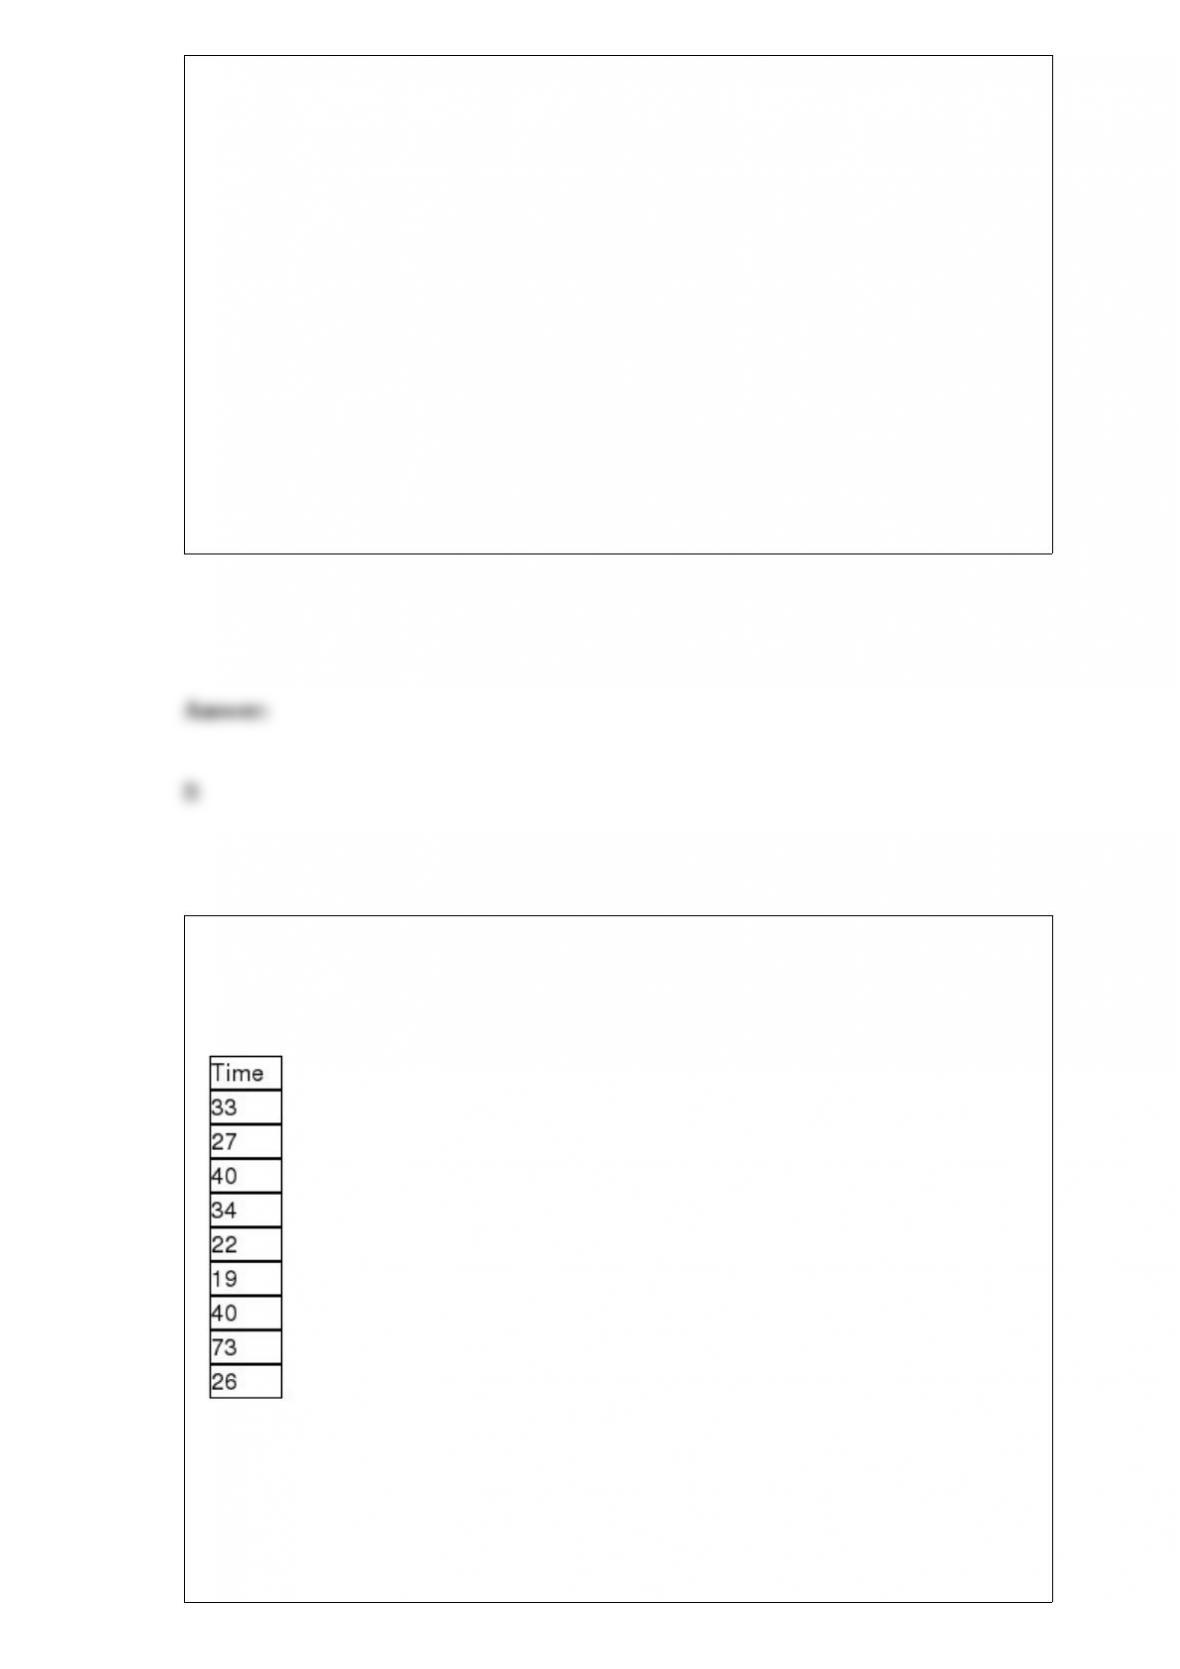
The General Electric service department believes that the median time for a service call
should be 30 or fewer minutes. To test this, the following random sample of service
times was collected:
Given that the managers do not wish to make the assumption that the population is
normally distributed, the test statistic for the Wilcoxon signed rank sum test is:
A) W = 43.0
B) W = 27.0
C) W = 18.0
D) None of the above

Which of the following statements is correct?
A) A process can be in statistical control, yet it can be producing defects in abundance.
B) At least three points outside the upper or lower control limits on a control chart are
required before the process is deemed to be out of control.
C) If a process is out of control, then the variation that is present is limited to common
cause variation.
D) When special cause variation is present, the process can be expected to be in control.
Chicago Connection, a local pizza company, delivers pizzas for free within the market
area. The delivery drivers are paid $2.00 per delivery plus they get to keep any tips. To
estimate the proportion of deliveries that result in a tip to the driver, a random sample of
64 deliveries was selected. Of these, 48 times a tip was received. Based on this
information, and using a 95 percent confidence level, the margin of error for the
estimate is approximately .1061.
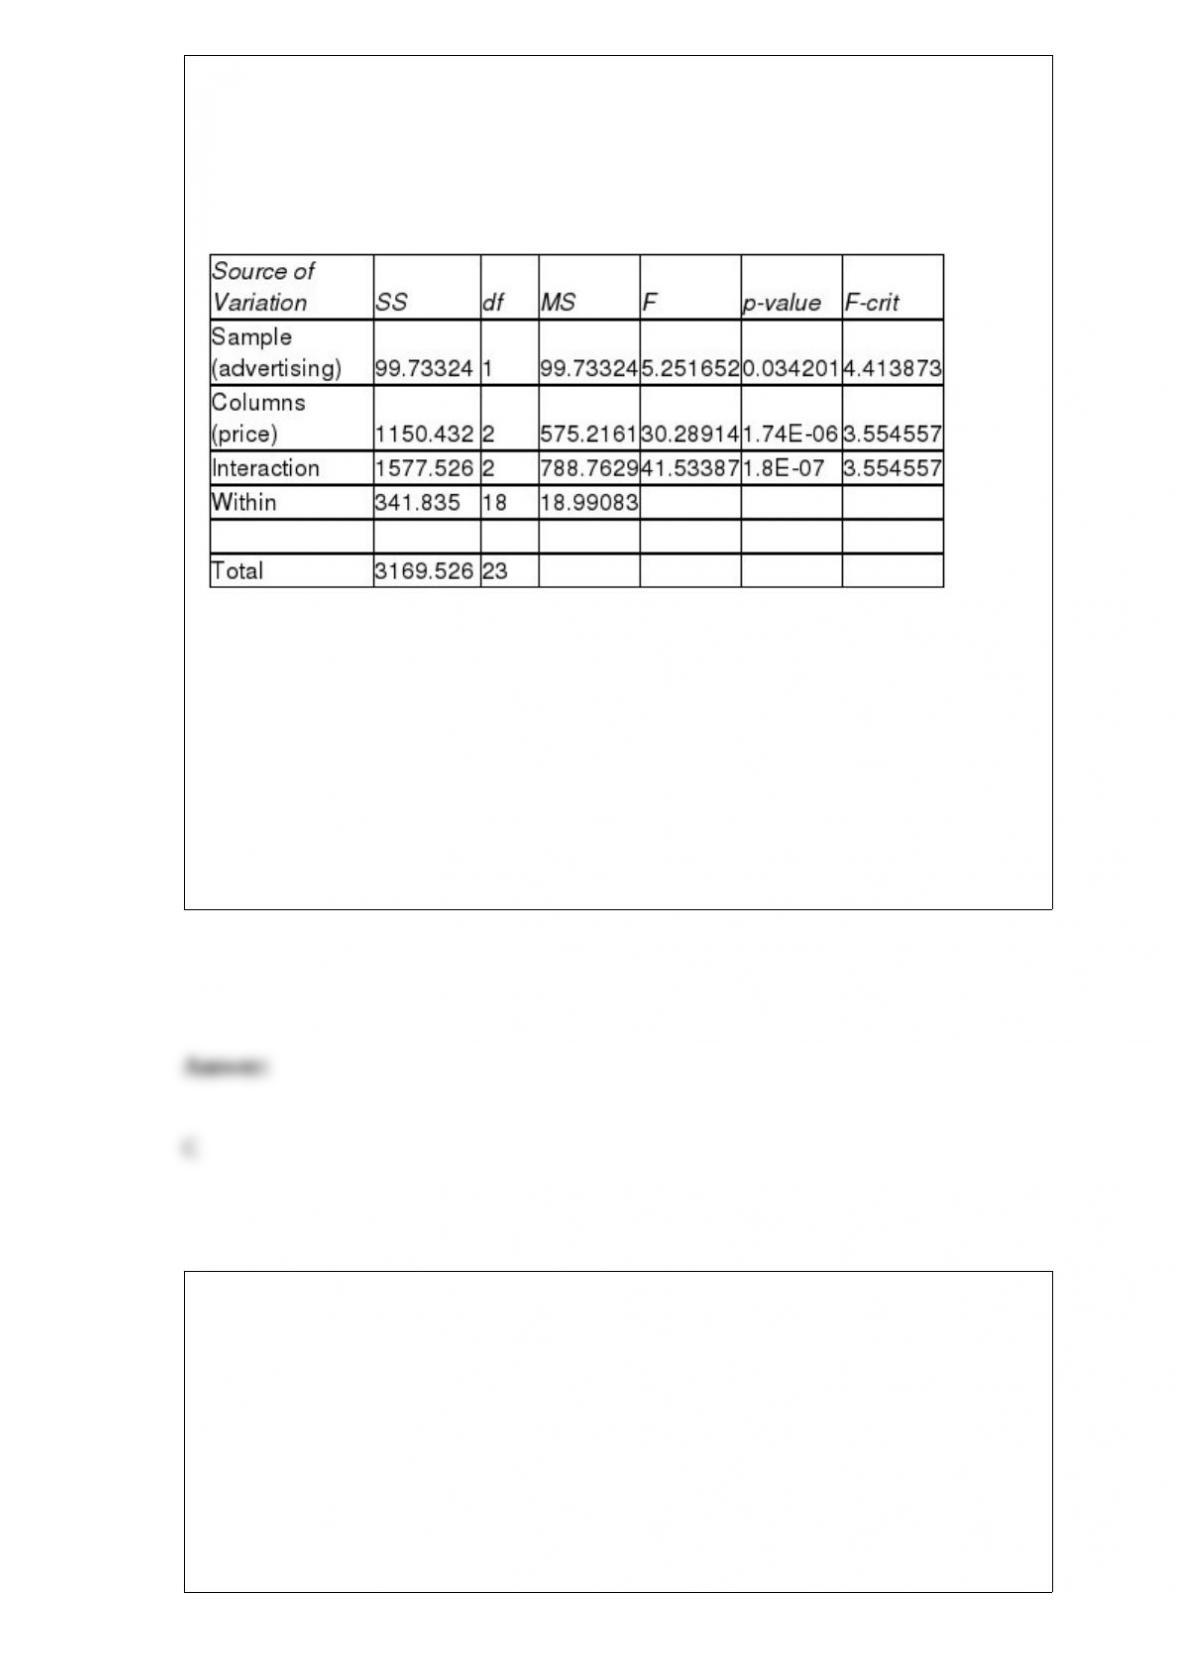
A two-factor analysis of variance is conducted to test the effect the price and advertising
have on sales of a particular brand of bottled water. Each week a combination of
particular levels of price and advertising are used and the sales level is recorded. The
computer results are shown below.
ANOVA
Based on the results above, which of the following is correct?
A) 1 level of advertising and 2 levels of price were used.
B) 3 levels of adverting and 2 levels of price were used.
C) 2 levels of advertising and 3 levels of price were used.
D) There were a total of 6 different treatments.
The Weyerhauser Lumber Company headquartered in Tacoma, Washington, is one of
the largest timber and wood product companies in the world. Weyerhauser
manufactures plywood at one of its Oregon plants. Plywood contains minor
imperfections that can be repaired with small “plugs.” One customer will accept
plywood with a maximum of 3.5 plugs per sheet on average. Suppose a shipment was
sent to this customer and when the customer inspected two sheets at random, 10
plugged defects were counted. What is the probability of observing 10 or more plugged
defects if in fact the 3.5 average per sheet is being satisfied?
A) 0.1887

B) 0.1695
C) 0.2115
D) 0.2675
In testing a hypothesis that two categorical variables are independent using the x2 test,
the expected cell frequencies are based on assuming:
A) the null hypothesis.
B) the alternative hypothesis.
C) the normal distribution.
D) the variable are related.
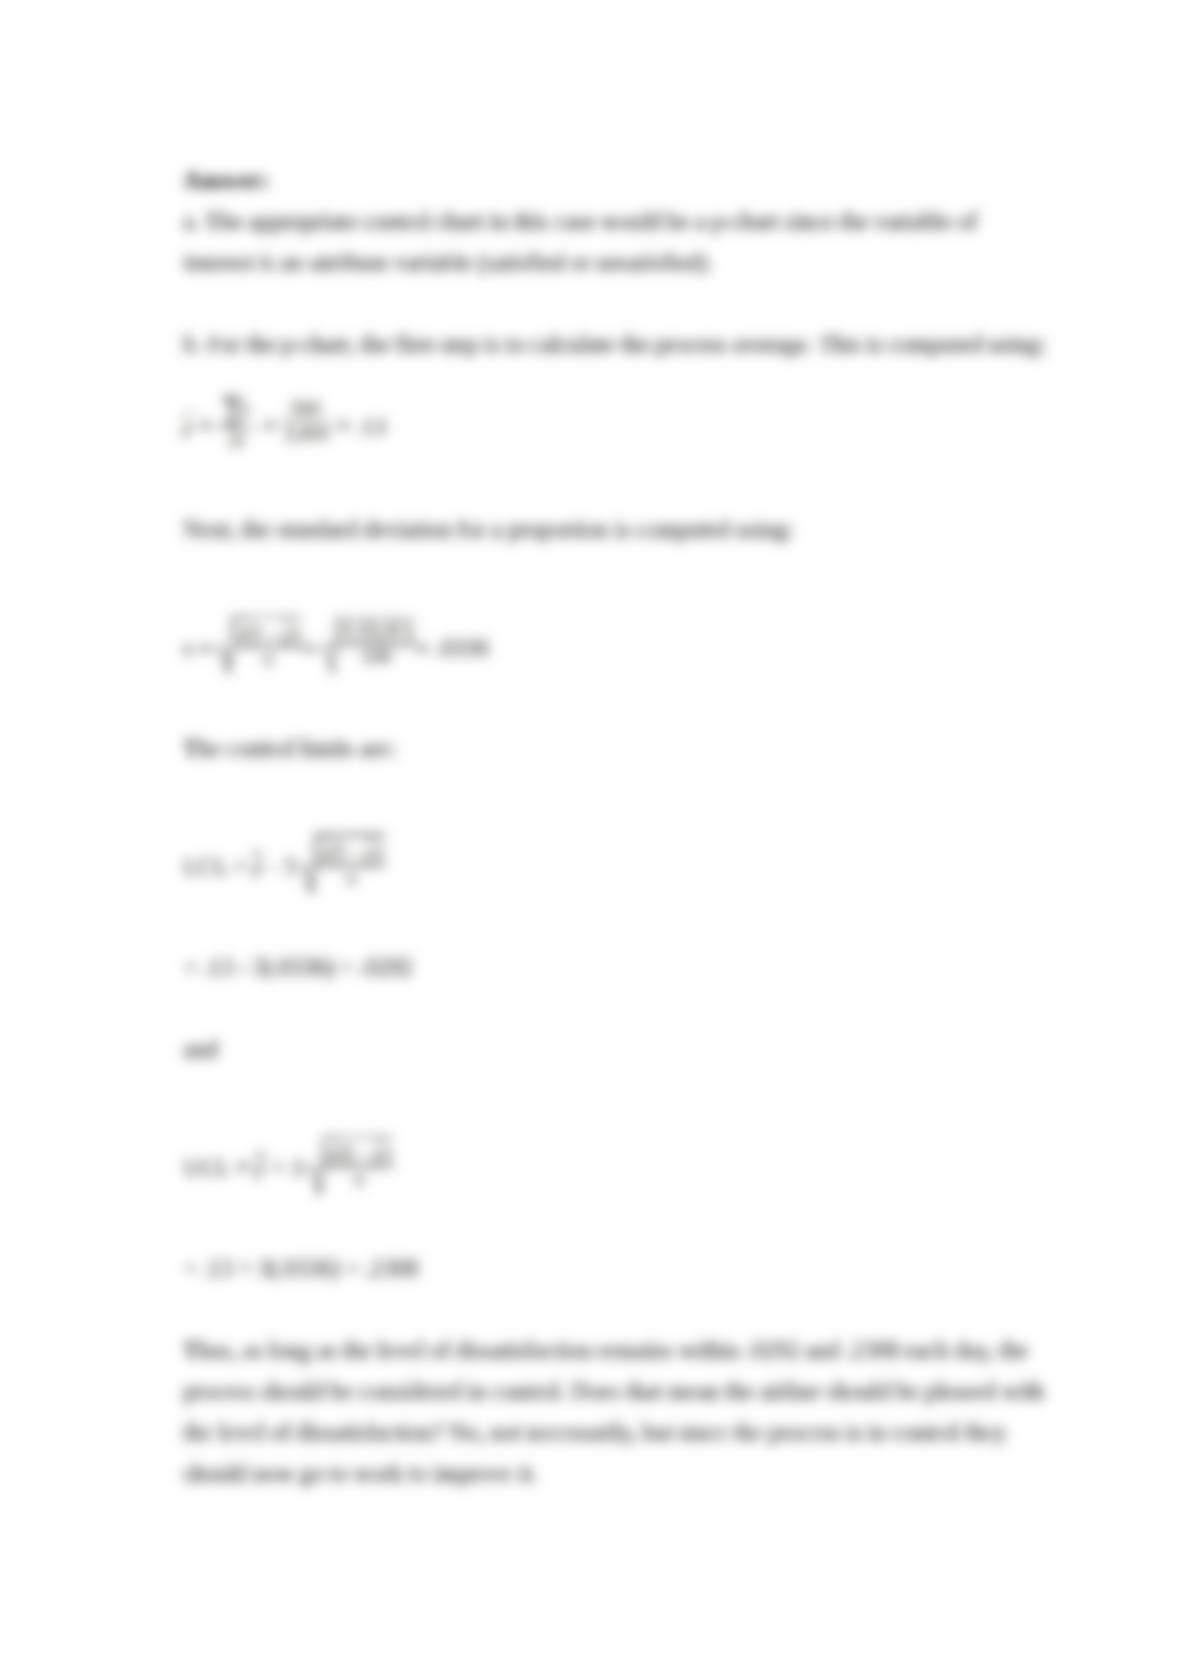
A major airline is interested in monitoring customer satisfaction with its baggage
handling process. To do so, each day the airline randomly selects 100 customers and
surveys them to determine if they are satisfied or not with the service provided. After 20
samples, a total of 260 unsatisfied customers were surveyed.
a. If the airline wishes to use a control chart, which chart would you recommend and
why?
b. Determine the 3-sigma control limits for the appropriate control chart.

A claim was recently made on national television that two of every three doctors
recommend a particular pain killer. Suppose a random sample of n = 300 doctors
revealed that 180 said that they would recommend the painkiller. If the TV claim is
correct, what is the probability of 180 or fewer in the sample agreeing?
A) 0.4929
B) 0.0049
C) 0.9929
D) 0.0142
In a chi-square contingency analysis, when expected cell frequencies drop below 5, the
calculated chi-square value tends to be inflated and may inflate the true probability of
________ beyond the stated significance level.
A) committing a Type I error
B) committing a Type II error
C) Both A and B
D) All of the above
At a recent meeting, the manager of a national call center for a major Internet bank
made the statement that the average past-due amount for customers who have been

called previously about their bills is now no larger than $20.00. Other bank managers at
the meeting suggested that this statement may be in error and that it might be
worthwhile to conduct a test to see if there is statistical support for the call center
manager’s statement. The file called Bank Call Center contains data for a random
sample of 67 customers from the call center population. Assuming that the population
standard deviation for past due amounts is known to be $60.00, what should be
concluded based on the sample data? Test using α = 0.10.
A) Because p-value = 0.4121 > alpha = 0.10, we do not reject the null hypothesis.
The sample data do not provide sufficient evidence to reject the call center manager’s
statement that the mean past due amount is $20.00 or less.
B) Because p-value = 0.4121 > alpha = 0.10, we reject the null hypothesis.
The sample data provide sufficient evidence to reject the call center manager’s
statement that the mean past due amount is $20.00 or less.
C) Because p-value = 0.2546 > alpha = 0.10, we do not reject the null hypothesis.
The sample data do not provide sufficient evidence to reject the call center manager’s
statement that the mean past due amount is $20.00 or less.
D) Because p-value = 0.2546 > alpha = 0.10, we reject the null hypothesis.
The sample data provide sufficient evidence to reject the call center manager’s
statement that the mean past due amount is $20.00 or less.
Damage to homes caused by burst piping can be expensive to repair. By the time the
leak is discovered, hundreds of gallons of water may have already flooded the home.
Automatic shutoff valves can prevent extensive water damage from plumbing failures.
The valves contain sensors that cut off water flow in the event of a leak, thereby
preventing flooding. One important characteristic is the time (in milliseconds) required
for the sensor to detect the water leak. Sample data obtained for four different shutoff
valves are contained in the file entitled Waterflow.
Use the Tukey-Kramer multiple comparison technique to discover any differences in
the average detection time. Use a significance level of 0.05.
A) The confidence intervals indicate that there is not sufficient evidence to conclude
that the average detection time for valve 1, 2, and 3 differ. There is, however, enough
evidence to indicate that the average detection time for valve 4 is larger than the other
three means.
B) The confidence intervals indicate that there is not sufficient evidence to conclude
that the average detection time for valve 1, 2, and 4 differ. There is, however, enough
evidence to indicate that the average detection time for valve 3 is larger than the other
three means.
C) The confidence intervals indicate that there is not sufficient evidence to conclude
that the average detection time for valve 2 and 4 differ. There is, however, enough
evidence to indicate that the average detection time for valve 1 and 3 are larger than the
other two means.
D) All mean detection times are equal.
The General Electric service department believes that the median time for a service call
should be 30 or fewer minutes. To test this, the following random sample of service
times was collected:
Given that the managers do not wish to make the assumption that the population is
normally distributed, the appropriate statistical test for testing about service times is:
A) the t-test.

B) the Kruskal-Wallis test.
C) the Wilcoxon signed rank sum test.
D) the F-test.
Which of the following is an advantage of using stepwise regression compared to just
entering all the independent variables at one time?
A) Stepwise will generally produce a model with a larger R-square value.
B) The standard error of the estimate for a model constructed with stepwise regression
will be larger than the one generated when all variables are entered at the same time.
C) The stepwise regression allows the decision maker to observe the effects of
multicollinearity more easily than when all the variables are entered at one time.
D) There are no advantages of using stepwise regression over entering all variables at
one time.
The Polson Pole and Fence Company recently did a quality check on the length of fence
posts. To do this, each of the 400 posts in inventory was numbered. Numbers from 1 to
400 were placed in a bowl. Twenty numbers were selected from the bowl without
looking. These 20 poles were the ones selected for the study. This type of sampling is
called:
A) cluster sampling.

B) simple random sampling.
C) nonstatistical.
D) convenience sampling.
A local FedEx/Kinkos has three black-and-white copy machines and two color copiers.
Based on historical data, the chances that each black-and-white copier will be down for
repairs is 0.10. The color copiers are more of a problem and are down 20% of the time
each.
Based on this information, what is the probability that if a customer needs a color copy,
both color machines will be down for repairs?
A) 0.04
B) 0.96
C) 0.47
D) 0.42
In a chi-square goodness-of-fit test, by combining cells we guard against having an
inflated test statistic that could have caused us to:
A) incorrectly reject the H0.
B) incorrectly accept the H0.
C) incorrectly reject the H1.
D) incorrectly accept the H1.
Explain the difference between stratified random sampling and cluster random
sampling.
Explain how Tchebysheff’s theorem can be used to help describe data in a population or
a sample.
A real estate agent believes that home with swimming pools take longer to sell than
home without swimming pools. A random sample of each type of recently sold homes
was taken where the number of days on the market is recorded. Results are:
Homes with pool Homes w/o pool
Sample mean 77 days 65 days
Sample Standard deviation 8.4 days 7.2 days
Sample size 19 23
Assuming that the populations are normally distributed and the variances are equal,
conduct the appropriate hypothesis test to determine if the real estate agent is correct.
Use the 0.05 level of significance.
Suppose that you have a data set of 512 observations and the data values range from 36
to 187. What classes would you choose for this data set? Explain why you would
choose these values.
Explain the difference between a stratified random sample and cluster random sample.
As a member of the student council at your university, you have been assigned the task
of conducting a phone survey of undergraduate students to determine satisfaction with
the campus food service. Explain how you would go about selecting a simple random
sample.
A PC company uses two suppliers for rechargeable batteries for its notebook computers.
Two factors are important quality features of the batteries: mean use time and variation.
It is desirable that the mean use time be high and the variability be low. Recently, the
PC maker conducted a test on batteries from the two suppliers. In the test, 9 randomly
selected batteries from Supplier 1 were tested and 12 randomly selected batteries from
Supplier 2 were tested. The following results were observed
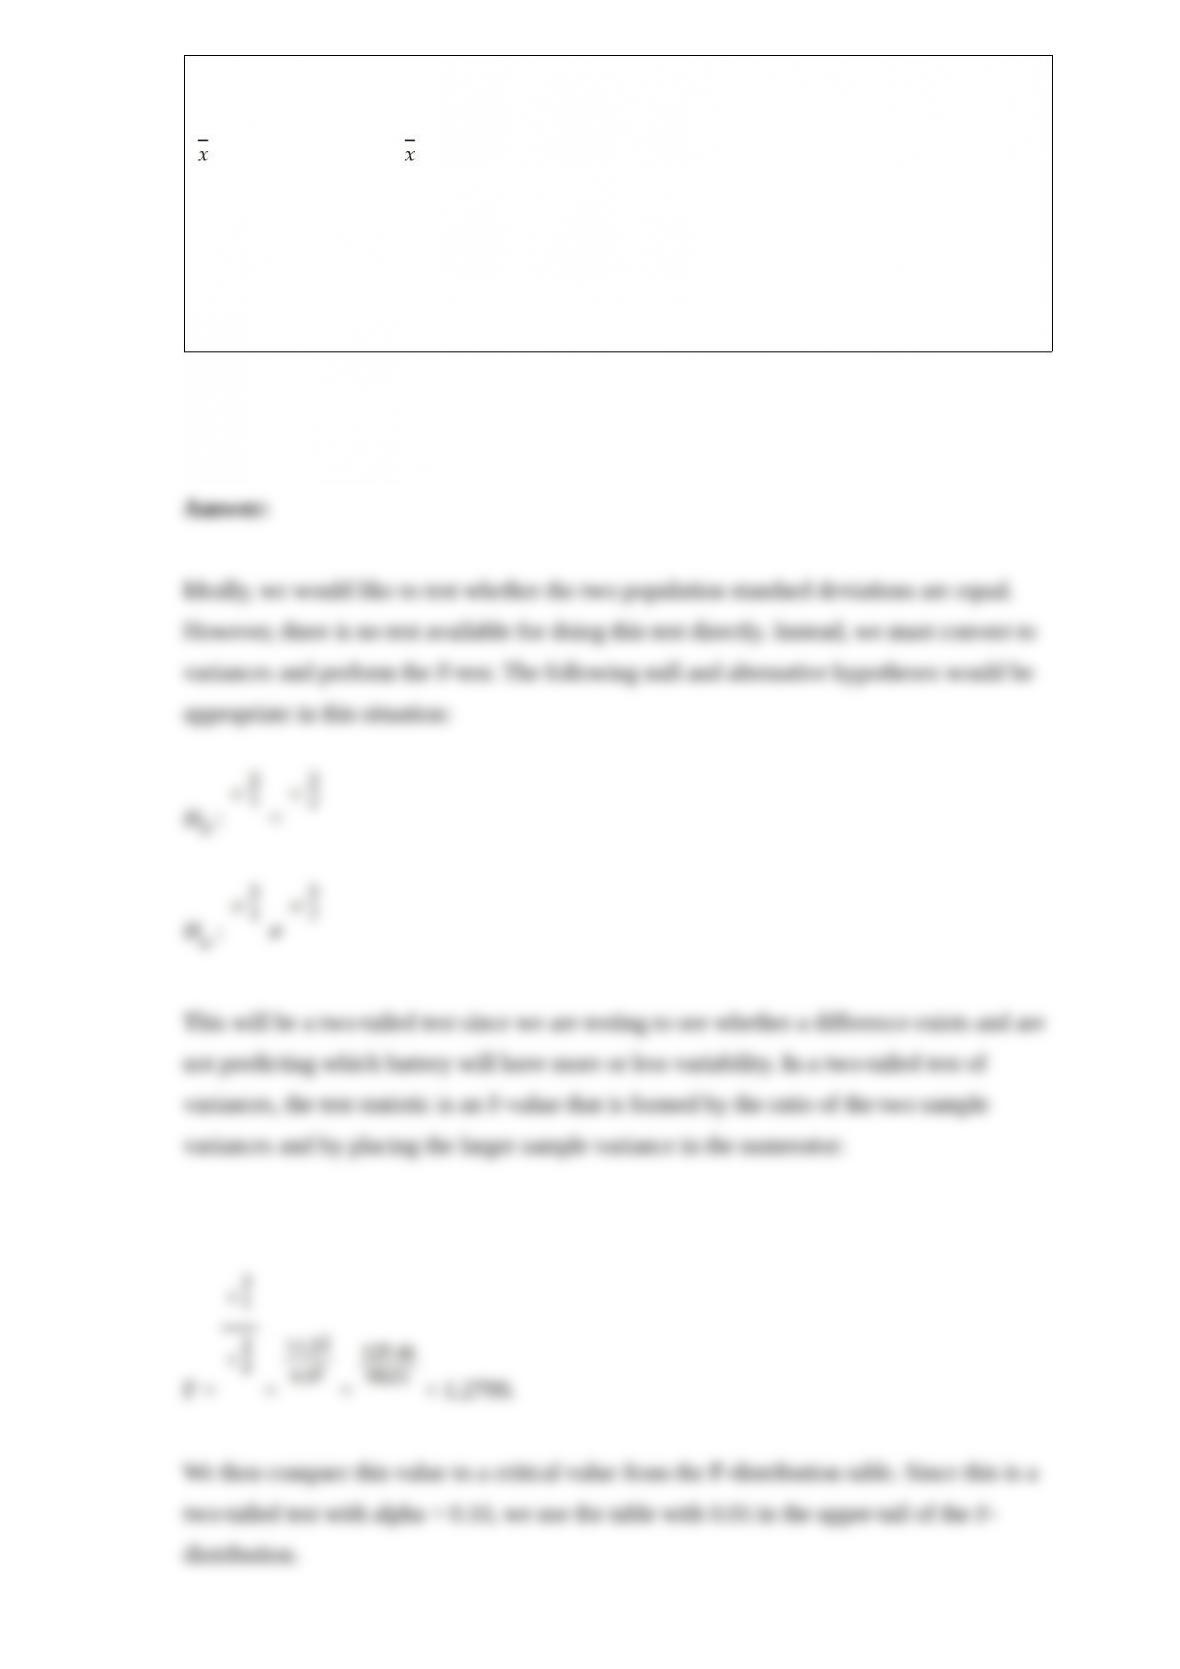
Supplier 1 Supplier 2
n1 = 9 n2 = 12
1 = 67.25 min 2 = 72.4 min
s1 = 11.2 min s2 = 9.9 min
Based on these sample results, can the PC maker conclude that a difference exists
between the two batteries with respect to the population standard deviations? Test using
a 0.10 level of significance.
Under what conditions is the binomial distribution symmetric?
Explain why an increase in sample size will reduce the probability of a Type II error but
will not impact the probability of a Type I error.
Explain what is meant by a p-value.
The fares received by taxi drivers working for the City Taxi line are normally
distributed with a mean of $12.50 and a standard deviation of $3.25. Based on this
information, what is the probability that a specific fare will exceed $15.00?
A PC company uses two suppliers for rechargeable batteries for its notebook computers.
Two factors are important quality features of the batteries: mean use time and variation.
It is desirable that the mean use time be high and the variability be low. Recently, the
PC maker conducted a test on batteries from the two suppliers. In the test, 9 randomly
selected batteries from Supplier 1 were tested and 12 randomly selected batteries from
Supplier 2 were tested. The following results were observed:
Supplier 1 Supplier 2
n1 = 9 n2 = 12
1 = 67.25 min 2 = 72.4 min.
S1= 11.2 min S2 = 9.9 min
Based on these sample results, can the PC maker conclude that a difference exists
between the two batteries with respect to the population mean use time? Test using a
0.10 level of significance.
Discuss the differences and similarities between statistical estimation and statistical
hypothesis testing.
Indicate why the Central Limit Theorem is so important in the application of statistical
analysis.
The AMI Company has two assembly lines in its Kansas City plant. Line A produces an
average of 335 units per day with a standard deviation equal to 11 units. Line B
produces an average of 145 units per day with a standard deviation equal to 8 units.
Based on this information, which line is relatively more consistent?
