Unlock document.
This document is partially blurred.
Unlock all pages and 1 million more documents.
Get Access

For any data set, Chebyshev's Theorem estimates the proportion of observations that
occurs within k standard deviations of the mean, where k is greater than 1.0.
The variance inflation factor is used to select or remove independent variables to reduce
the effects of multicollinearity in a multiple regression equation.
For the sampling distribution of sample means, sampling error will decrease as sample
size increases.
The items or individuals of the population are arranged in a file drawer alphabetically
by date received. A random starting point is selected and then every kth member of the
population is selected for the sample. This sampling method is called systematic
random sampling.

A listing of 100 family annual incomes is an example of statistics.
If the hypothesis H0: β1= 0, is rejected, then the sample regression coefficient b1
indicates the change in the predicted value for a unit change in X1 when all other Xi
variables are held constant.
The random variable for a Poisson probability distribution can assume an infinite
number of values.

To apply the special rule of addition, the events must be mutually exclusive.
Hypothesis testing is a procedure that uses sample evidence and probability theory to
decide whether to reject or fail to reject a hypothesis.
The coefficient of determination is the proportion of total variation in Y that is
explained by X.
The terms descriptive statistics and inferential statistics can be used interchangeably.

For an ANOVA test, rejecting the null hypothesis does not identify which treatment
means differ significantly.
If the null hypothesis is ≥ 200, then a two-tail test is being conducted.
When deciding to collect sample information rather than collecting information from
the population, the amount of time required to collect the information is unimportant.

An example of a dummy variable is "time to product's first repair" in years.
Percentiles divide a distribution into 100 equal parts.
The Greek letter used to represent the probability of a Type I error is alpha (α).

If we are testing for the difference between two population means and assume that the
two populations have equal but unknown standard deviations, the variances are pooled
to compute the best estimated variance.
The variance of a binomial distribution is found by nπ (1 - π).
In multiple regression analysis, a residual is the difference between the value of an
independent variable and its corresponding dependent variable value.

An ordinal level of measurement implies some sort of ranking.
Quartiles divide a distribution into 10 equal parts.
We can expect some difference between sample statistics and the corresponding
population parameters. This difference is called the sampling error.

A dot plot is useful for showing individual observations.
Statistics are used as a basis for making decisions.
The population variation has little or no effect in determining the size of a sample
selected from the population.
A class interval, or class width, can be determined by subtracting the lower limit of a

class from the lower limit of the next higher class.
The complement rule states that the probability of an event not occurring is equal to one
minus the probability of its occurrence.
A coin is tossed four times. The joint probability that all four tosses will result in a head
is or 0.25.
The central limit theorem allows us to use a z-statistic to compute probabilities for the
sampling distribution of the sample mean.

One assumption underlying linear regression is that the X values are normally
distributed.
A point estimate is a single value used to estimate a population parameter.
Statistics are used to report the summary results of market surveys.

One factor in determining the size of a sample is the degree of confidence selected. This
is usually 0.95 or 0.99, but it may be any degree of confidence you specify.
What is an important similarity between the uniform and normal probability
distributions?
A. The mean, median, and mode are all equal.
B. The mean and median are equal.
C. They are negatively skewed.
D. About 68% of all observations are within one standard deviation of the mean.
The sum of the differences between sample observations and the sample mean is equal

to _______.
A. Zero
B. The mean deviation
C. The range
D. The standard deviation
Refer to the following frequency distribution on days absent during a calendar year by
employees of a manufacturing company:
How many employees were absent between 3 up to 6 days?
A. 31
B. 29
C. 14
D. 2

What is the area under the normal curve between z = 0.0 and z = 1.79?
A. 0.4633
B. 0.0367
C. 0.9599
D. 0.0401
To determine if a set of ungrouped raw data is normally distributed, we can use
_________.
A. Graphical methods
B. A chi-square test
C. ANOVA
D. Regression

A student was interested in the cigarette smoking habits of college students and
collected data from an unbiased random sample of students. The data is summarized in
the following table:
What type of chart best represents the frequency table?
A. Bar chart
B. Box plot
C. Scatter plot
D. Frequency polygon
What can we conclude if the global test of regression does not reject the null
hypothesis?
A. A strong relationship exists among the variables.
B. No relationship exists between the dependent variable and any of the independent
variables.
C. The independent variables are good predictors.

D. Good forecasts are possible.
A survey of property owners' opinions about a street-widening project was taken to
determine if owners' opinions were related to the distance between their home and the
street. A randomly selected sample of 100 property owners was contacted and the
results are shown next.
What is the expected frequency for people who are in favor of the project and have less
than 45 feet of property foot-frontage?
A. 10
B. 12
C. 35
D. 50
To determine if a set of ungrouped raw data is normally distributed, what test statistic
would we use?
A. A z-statistic
B. An F-statistic
C. Anderson-Darling
D. A chi-square
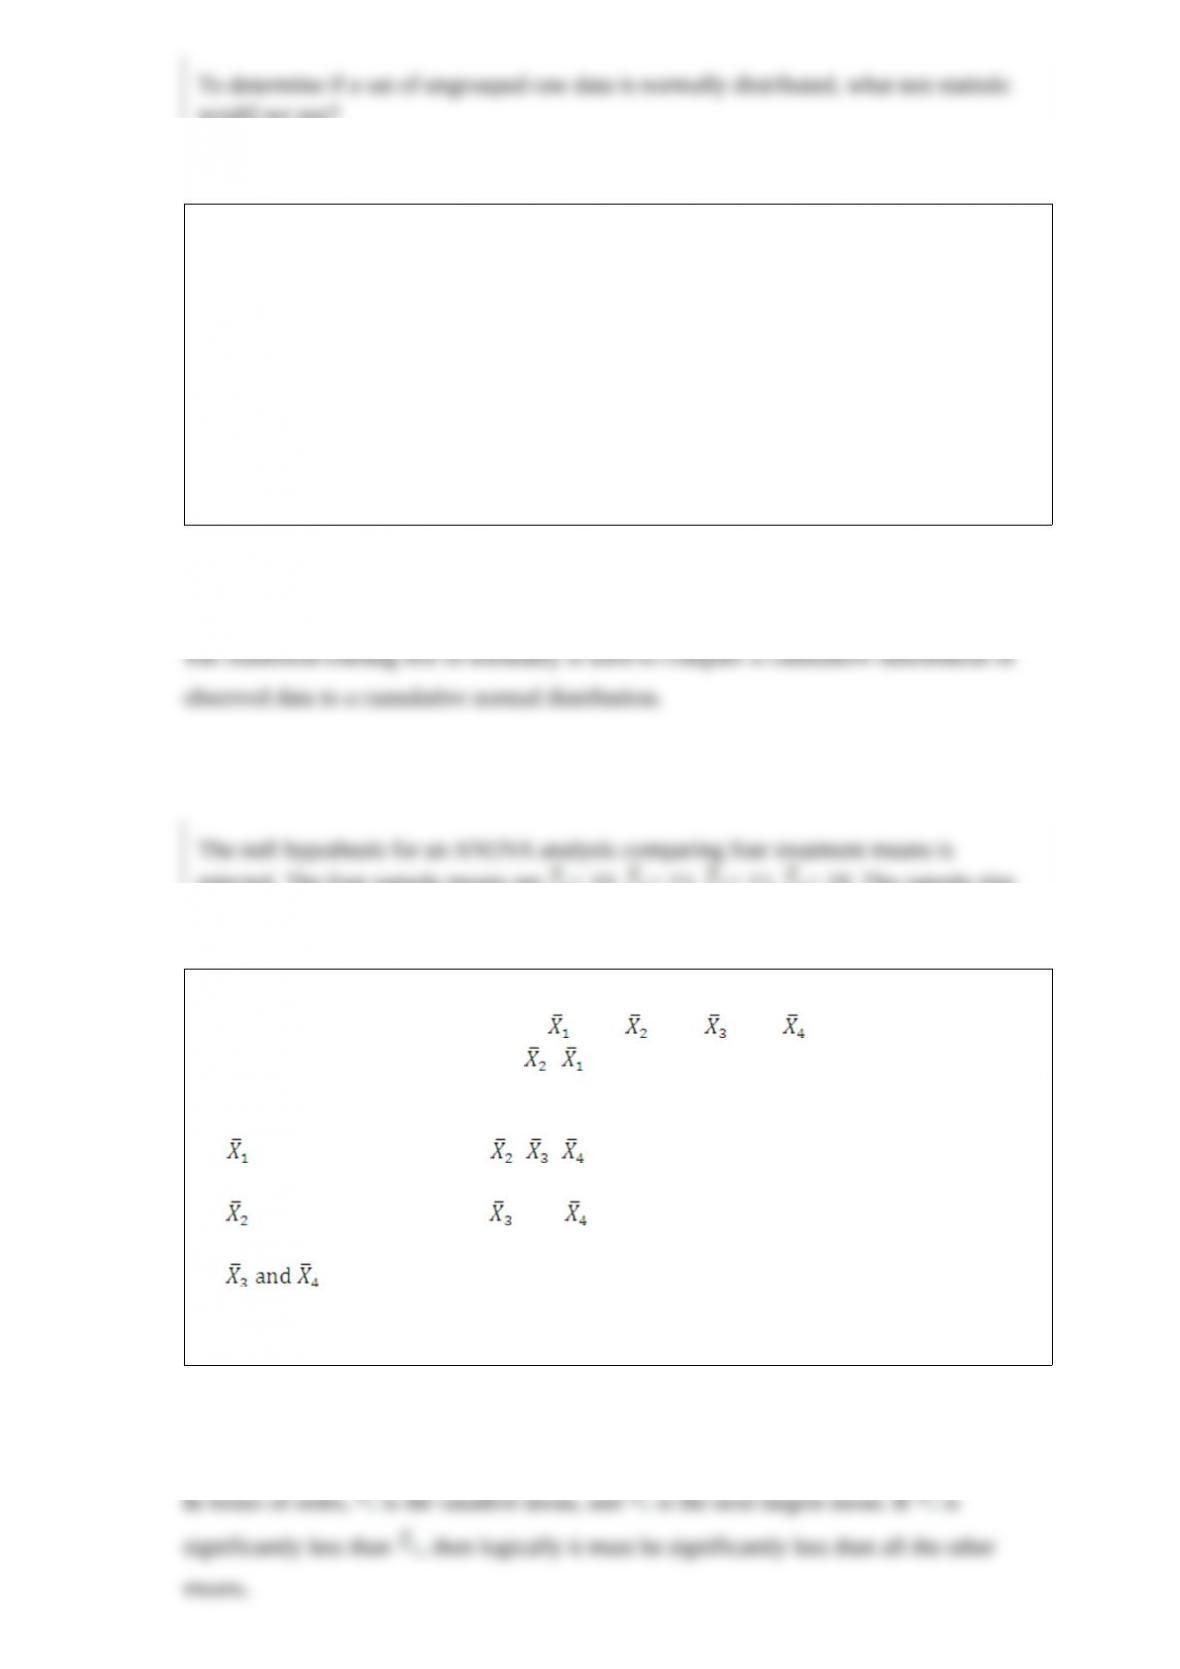
The null hypothesis for an ANOVA analysis comparing four treatment means is
rejected. The four sample means are = 10, = 12, = 15, = 18. The sample size
for each treatment is the same. If ( - ) is significantly different from zero, then
___________.
A. is significantly less than , , .
B. is significantly less than , and .
C. are significantly different.
D. The treatment means are all equal.

Given the following ANOVA table for three treatments each with six observations:
What is the computed value of F?
A. 7.48
B. 7.84
C. 8.84
D. 8.48
In the following set of data: what are the first, second, and
third quartiles?

A. 1, 6, and 100
B. 3, 5, and 9
C. 3, 6, and 9
D. 1, 5, and 100
Which condition must be met to conduct a test for the difference in two sample means
using a z-statistic?
A. The data must be at least of nominal scale.
B. The populations must be normal.
C. The two population standard deviations must be known.
D. The samples are dependent.

Each salesperson in a large department store chain is rated on their sales ability and
their potential for advancement. The data for the 500 sampled salespeople are
summarized in the following table.
What is the probability that a salesperson selected at random has above average sales
ability and has excellent potential for advancement?
A. 0.20
B. 0.50
C. 0.27
D. 0.75
From the least difficult to the most difficult to compute, rank the measures of
dispersion.
A. Mode, median, mean
B. Range, mean deviation, variance
C. Variance, mean deviation, range
D. There is no difference.

Refer to the following information from a frequency distribution for "heights of college
women" recorded to the nearest inch: the first two class midpoints are 62.5" and 65.5".
What are the class limits for the lowest class?
A. 61 and up to 64
B. 62 and up to 64
C. 62 and 65
D. 62 and 63
Recently, students in a marketing research class were interested in the driving behavior
of students. Specifically, the marketing students were interested in finding out if
exceeding the speed limit was related to social activity. They collected the following
responses from 100 randomly selected students:
Based on the analysis, what can be concluded?
A. Driving behavior and gender are correlated.
B. Driving behavior and gender are not related.
C. Driving behavior and gender are related.
D. No conclusion is possible.
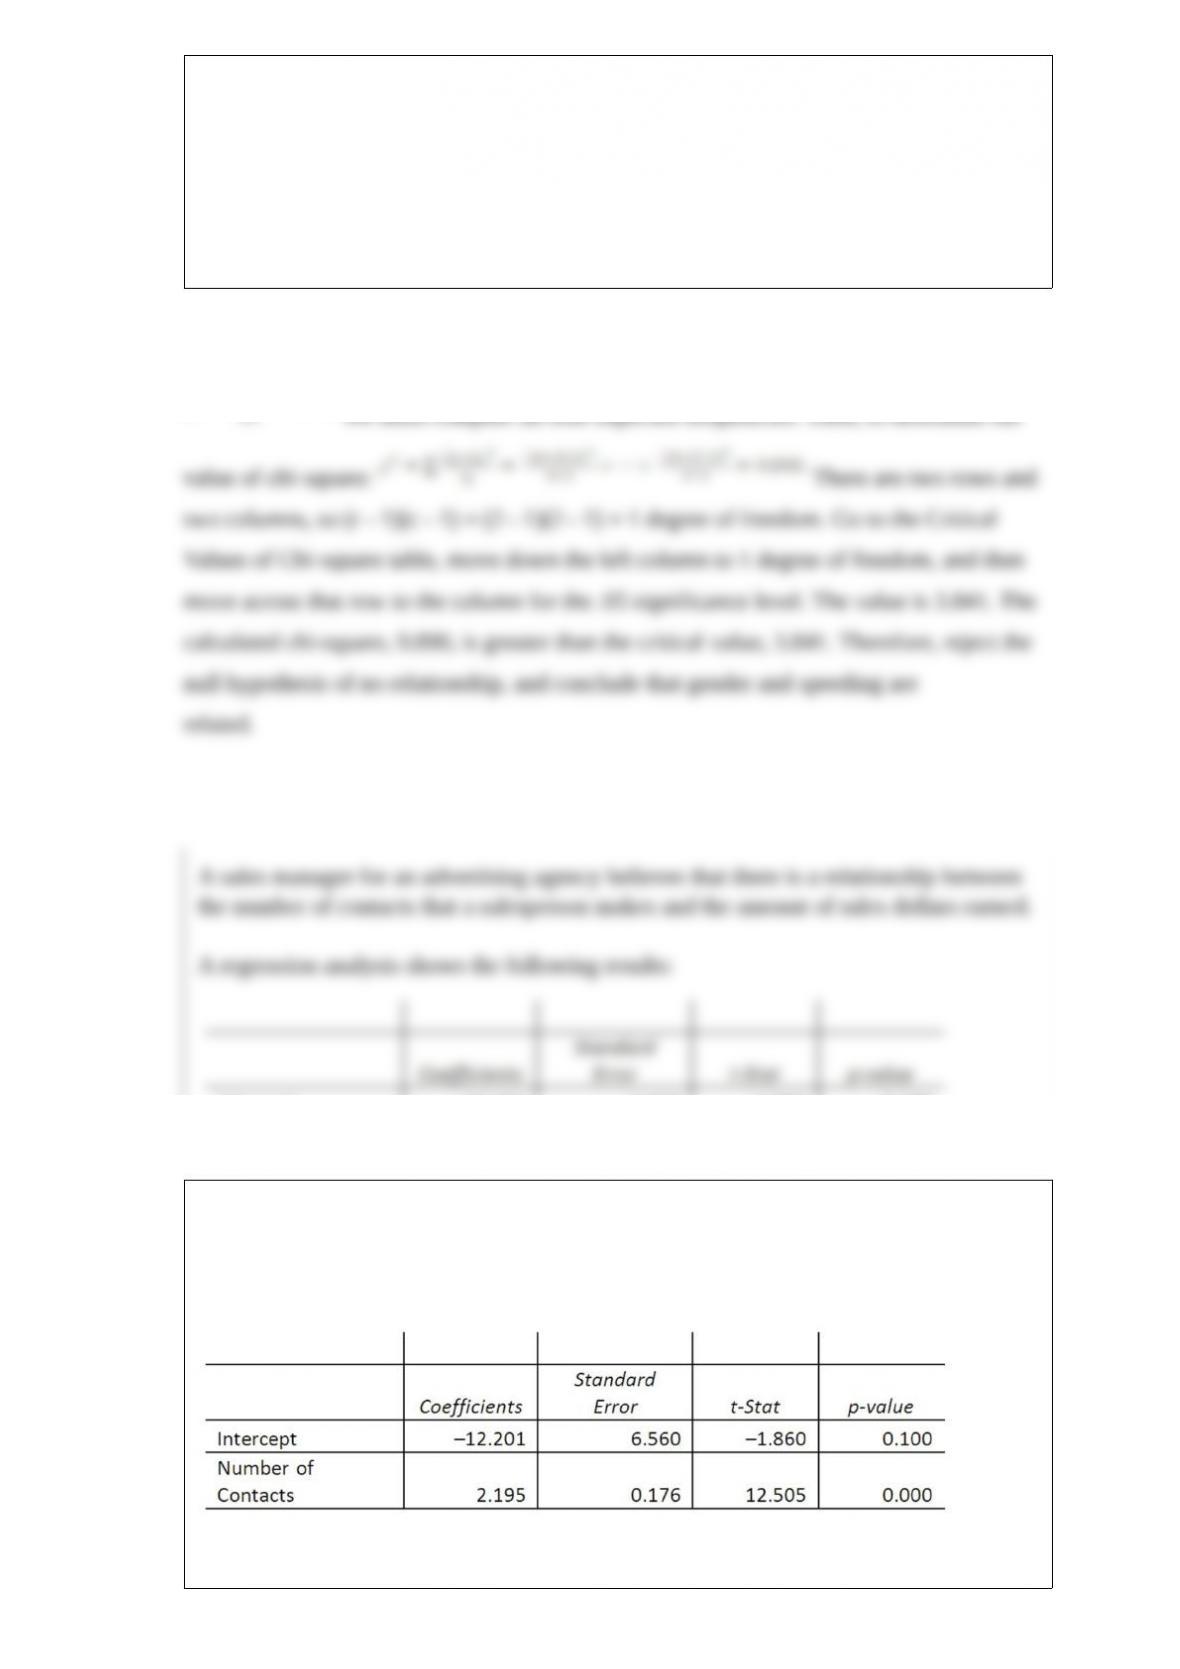
A sales manager for an advertising agency believes that there is a relationship between
the number of contacts that a salesperson makes and the amount of sales dollars earned.
A regression analysis shows the following results:
What is the standard error of the slope?

A. 0.176
B. 6.560
C. -12.201
D. 12.505
Refer to the following distribution of commissions:
What is the relative frequency for those salespersons that earn from $1,600 up to
$1,800?
A. .02
B. .024
C. .20
D. .24

An accelerated life test on a large number of type-D alkaline batteries revealed that the
mean life for a particular use before they failed is 19.0 hours. The distribution of the
lives approximated a normal distribution. The standard deviation of the distribution was
1.2 hours. About 95.44% of the batteries failed between what two values?
A. 8.9 and 18.9
B. 12.2 and 14.2
C. 14.1 and 22.1
D. 16.6 and 21.4
A student was studying the political party preferences of a university's student
population. The survey instrument asked students to identify their political
preferencefor example, Democrat, Republican, Libertarian, or another party. The best
way to illustrate the relative frequency distribution is a __________.
A. Bar chart
B. Pie chart
C. Histogram
D. Frequency polygon

Sampling error is the difference between a sample statistic and its corresponding
_________.
A. Sample mean
B. Variance
C. Population parameter
D. Trend
The National Center for Health Statistics reported that of every 883 deaths in recent
years, 24 resulted from an automobile accident, 182 from cancer, and 333 from heart
disease. What is the probability that a particular death is due to an automobile accident?
A. 24/883 or 0.027
B. 539/883 or 0.610
C. 24/333 or 0.072

D. 182/883 or 0.206
The following graph is _______________.
A. Positively skewed
B. Negatively skewed
C. Symmetric
D. Uniformly distributed
Outliers are clearly presented in a _____________.
A. Dot plot
B. Stem-and-leaf display

C. Box plot
D. Contingency table
The mean weight of newborn infants at a community hospital is 6.6 pounds. A sample
of seven infants is randomly selected and their weights at birth are recorded as 9.0, 7.3,
6.0, 8.8, 6.8, 8.4, and 6.6 pounds. Does the sample data show a significant increase in
the average birthrate at a 5% level of significance?
A. Fail to reject the null hypothesis and conclude the mean is 6.6 lb.
B. Reject the null hypothesis and conclude the mean is lower than 6.6 lb.
C. Reject the null hypothesis and conclude the mean is greater than 6.6 lb.
D. Cannot calculate because the population standard deviation is unknown.

Customers of the Key Refining Company charge an average of $70 per month. The
distribution of amounts charged is approximately normal, with a standard deviation of
$10. What is the probability of selecting a credit card customer at random and finding
the customer charged between $70 and $83?
A. 0.1962
B. 0.4032
C. 0.3413
D. 0.4750
For a one-tailed hypothesis test, the critical z value of the test statistic is -2.33. Which of
the following is true about the hypothesis test?
A. α = 0.05 for a lower-tailed test
B. α = 0.01 for a lower-tailed test
C. α = 0.05 for an upper-tailed test
D. α = 0.01 for an upper-tailed test

When an experiment is conducted "without replacement," __________.
A. Events are dependent
B. Events are equally likely
C. The experiment can be illustrated with a Venn diagram
D. The probability of two or more events is computed as a joint probability
Given the following ANOVA table for three treatments each with six observations:
What is the treatment mean square?
A. 71.2
B. 71.4
C. 558
D. 534

What is a normal distribution with a mean of 0 and a standard deviation of 1 called?
A. Frequency distribution
B. Z-score
C. Standard normal distribution
D. Binomial probability distribution
Which of the following can be used to test the hypothesis that two nominal variables are
related?
A. A contingency table analysis
B. A goodness-of-fit
C. ANOVA
D. A regression analysis

The statistical technique used to test the equality of three or more population means is
___________________.
The collection of all possible objects of interest is referred to as the ____________.
The ______________ is used to measure the relative symmetry of a distribution.

A sample of 500 part-time students revealed that their annual incomes were normally
distributed with a mean income of $30,000 and a standard deviation of $3,000. The
number of students that earned between $27,000 and $33,000 is _____.
The branch of statistics that does not involve generalizations is called ______________.
For a distribution of sample means with a known population standard deviation, about
_____ percent of the sample means are within one standard error of population mean.
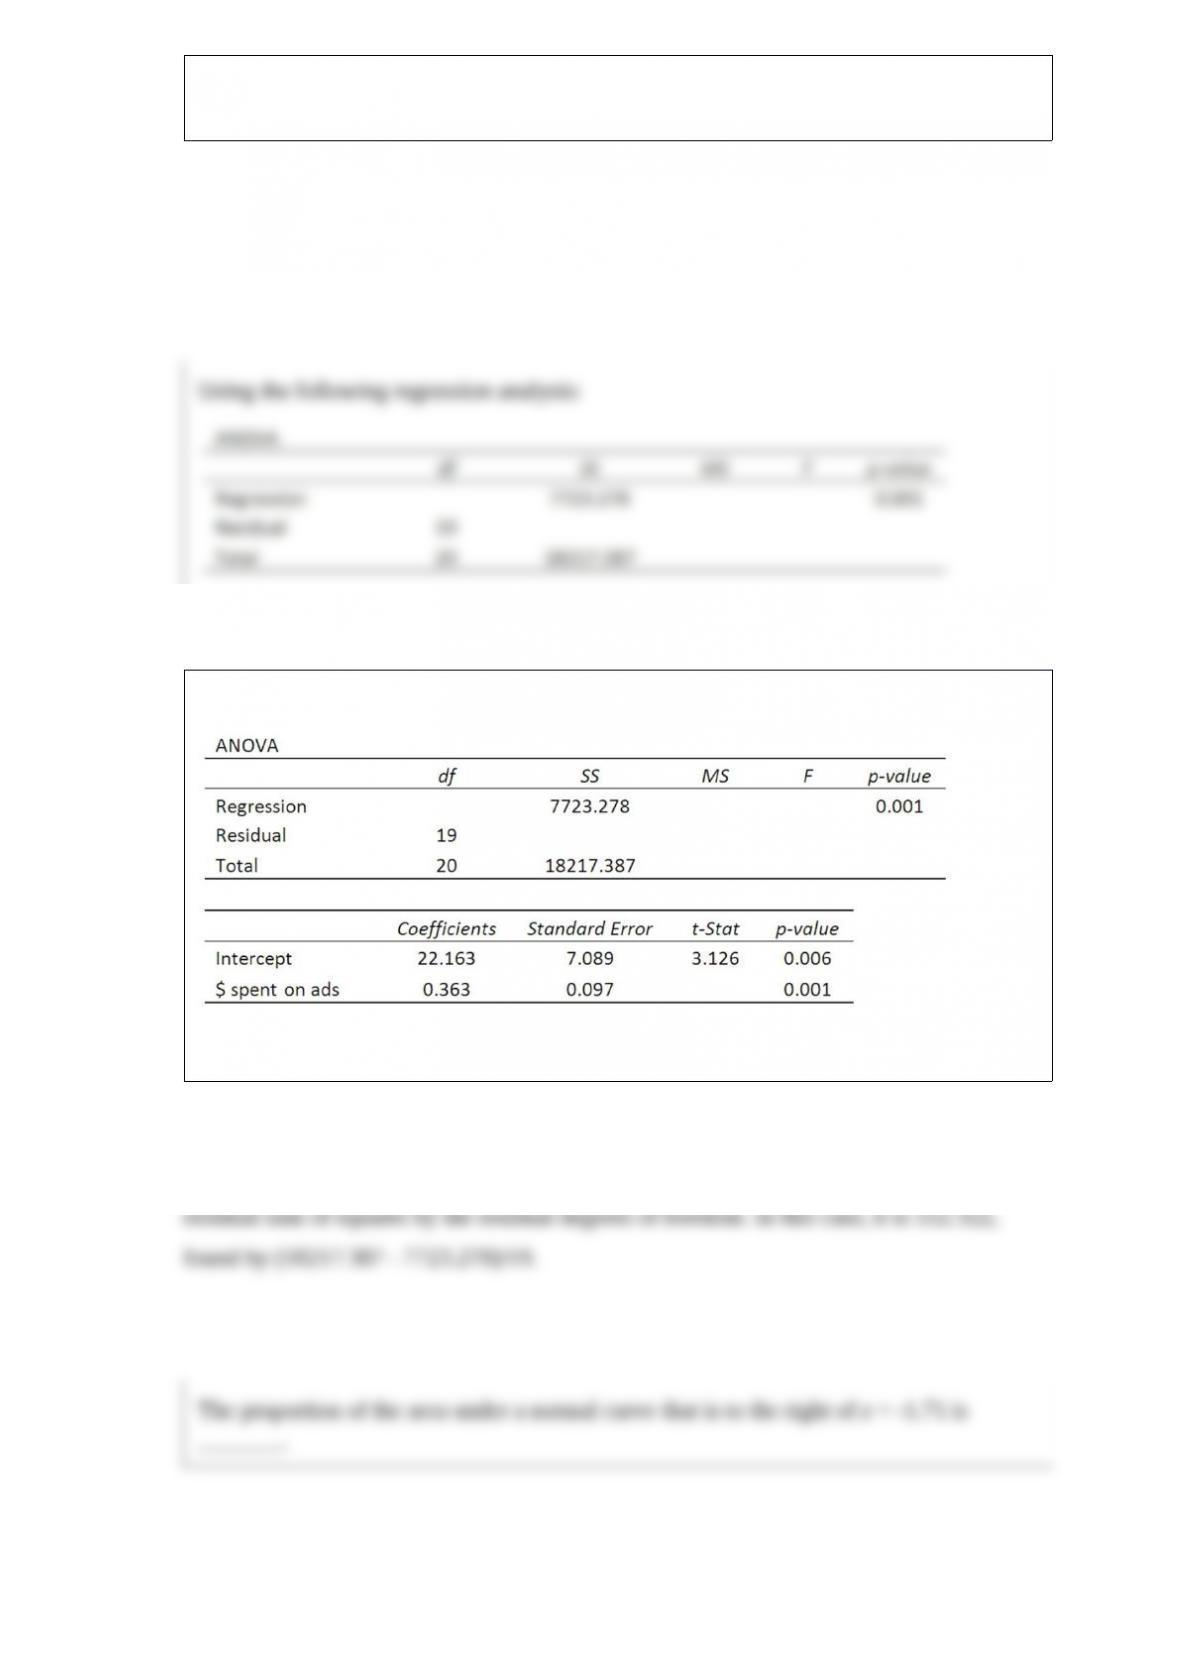
Using the following regression analysis:
What is the residual mean square?

The proportion of the area under a normal curve that is to the right of z = -1.71 is
_______.
A consultant is planning a survey of corporate executives to determine their mean
amount of weekly work time. A pilot survey indicated that the mean work time per
week is 50 hours, with a standard deviation of 10 hours. The consultant wants to
estimate the mean weekly work time within five hours. The 95% level of confidence is
to be used. How many executives should be surveyed?
When reporting descriptive statistics for a variable, why should the report include
measures of location and dispersion?

A telemarketing firm is monitoring the performance of its employees based on the
number of sales per hour. One employee had the following sales for the last 19 hours.
What is the third quartile for the distribution of number of sales per hour?
A university wants to determine the proportion of students who use a cash card to pay at
the university food service. Out of 100 students surveyed, 65 students use a cash card.
Estimate the value of the population proportion.

Six people have declared their intentions to run for a seat on the school board in the
next local election. A poll is conducted during the campaign among 1,020 randomly
sampled voters to determine if there is any clear preference among the voters. The
responses are shown next.
What is the critical value at the 5% level of significance?
If there is absolutely no relationship between two variables, Pearson's r will equal
_____.

When the population standard deviations are equal but unknown, a test for the
differences between two populations assumes that the populations are _____________
distributed.


