Systematic sampling is a type of random sampling technique.
The middle value in an ordered array of numbers is called the mode.
The slope of the regression line, y = 21 − 5x, is 5.
For the regression line, y = 21 − 5x, 21 is the y-intercept of the line.

The value of committing a Type II error is defined by the researcher prior to the study.
When using the ttest to test a hypothesis about a population mean with an unknown
population standard deviation (
) the degrees of freedom is defined as n-1.
For any given data set, a frequency distribution with a larger number of classes will
always be better than the one with a smaller number of classes.

If a data set contains k independent variables, the “all possible regression” search
procedure will determine 2kdifferent models.
If we reject H0: β1= β2=0 using the F-test, then we should conclude that both slopes are
different from zero.
A cumulative frequency polygon is also called an ogive.
Dot Plots are mainly used to display a large data set.

The sampling distribution of has a mean equal to the square root of the
population
proportion p.
When a range of values is used to estimate a population parameter, it is called a range
estimate.
A census is the process of gathering data on all the entities in the population.

In order to construct an interval estimate for the difference in the means of two
normally distributed populations with unknown but equal variances, using two
independent samples of size n1and n2, we must use a tdistribution with (n1+ n2− 2)
degrees of freedom.
If the variances of the two populations are not equal, it is appropriate to use the
“pooled” formula to determine the t-statistic for the hypothesis test of the difference in
the two population means.
The method of assigning probabilities to uncertain outcomes based on laws and rules is
called the relative frequency method.

In determining the interval estimates for a population proportion using the sample
proportion, it is appropriate to use the z-distribution.
A market researcher computed a confidence interval for a population proportion using a
95% confidence level. Her boss decided that she wanted a 99% confidence level
instead. The new interval with 99% confidence level will be widerthan the original one
with a 95% confidence level.
If no variation occurred between manufactured items, the resulting points on a control
chart would form a horizontal line.
Hypotheses are tentative explanations of a principle operating in nature.

The standard error of the estimate of a multiple regression model is computed by taking
the square root of the mean squares of error.
The regression model y =
0+
1x1+
2x2
1+
is called a quadratic model.
Nave forecasting models have no useful applications because they do not take into
account data trend, cyclical effects or seasonality.

Poisson distribution describes the occurrence of discrete events that may occur over a
continuous interval of time or space.
The logistic regression model constrains the estimated probabilities to lie between 0 and
100.
The mean square error (MSerr) is calculated by dividing the sum of squares error (SSerr)
by the number of observations in the data set (N).

In a decision-making under uncertainty scenario using the strategy of minmax regret, all
the entries in the opportunity loss table must be zero or positive.
The value of adjusted R2always goes up when a nontrivial explanatory variable is added
to a regression model.
Bayes’ rule is an extension of the law of conditional probabilities to allow revision of
original probabilities with new information.
The nonparametric alternative to linear regression is the Kruskal-Wallis test.

If a square-transformation is applied to a series of positive numbers, all greater than 1,
the numerical values of the numbers in the transformed series will be smaller than the
corresponding numbers in the original series.
A Pareto chart is a diagnostic tool that displays possible causes of a quality problem and
the interrelationships among the causes.
Let F be the event that a student is enrolled in a finance course, and let S be the event
that a student is enrolled in a statistics course. It is known that 40% of all students are
enrolled in an finance course and 35% of all students are enrolled in statistics. Included
in these numbers are 15% who are enrolled in both statistics and finance. Find P(S).
a) 0.15
b) 0.35
c) 0.40

d) 0.55
e) 0.60
A zscore is the number of __________ that a value is from the mean.
a) variances
b) standard deviations
c) units
d) miles
e) minutes
If X and Y are mutually exclusive events, then if X occurs _______.
a) Y must also occur
b) Y cannot occur
c) X and Y are independent
d) X and Y are complements
e) A and Y are collectively exhaustive

In a certain communications system, there is an average of 1 transmission error per 10
seconds. Assume that the distribution of transmission errors is Poisson. The probability
of 1 error in a period of one-half minute is approximately ________
a) 0.1493
b) 0.3333
c) 0.3678
d) 0.1336
e) 0.03
The mean life of a particular brand of light bulb is 1200 hours and the standard
deviation is 50 hours. We can conclude that at least 75% of this brand of bulbs will last
between _______.
a) 1100 and 1300 hours
b) 1150 and 1250 hours
c) 1050 and 1350 hours
d) 1000 and 1400 hours
e) 950 and 1450 hours

Ophelia O’Brien, VP of Consumer Credit of American First Banks (AFB), monitors the
default rate on personal loans at the AFB member banks. One of her standards is “no
more than 5% of personal loans should be in default.” On each Friday, the default rate
is calculated for a sample of 500 personal loans. Last Friday’s sample contained 30
defaulted loans. Using = 0.10, the appropriate decision is _______.
a) reduce the sample size
b) increase the sample size
c) reject the null hypothesis
d) fail to reject the null hypothesis
e) do nothing
A consumer has been asked to rank five cars based upon their desirability. This level of
measurement is _______.
a) interval level
b) ordinal level
c) nominal level
d) ratio level
e) relative level
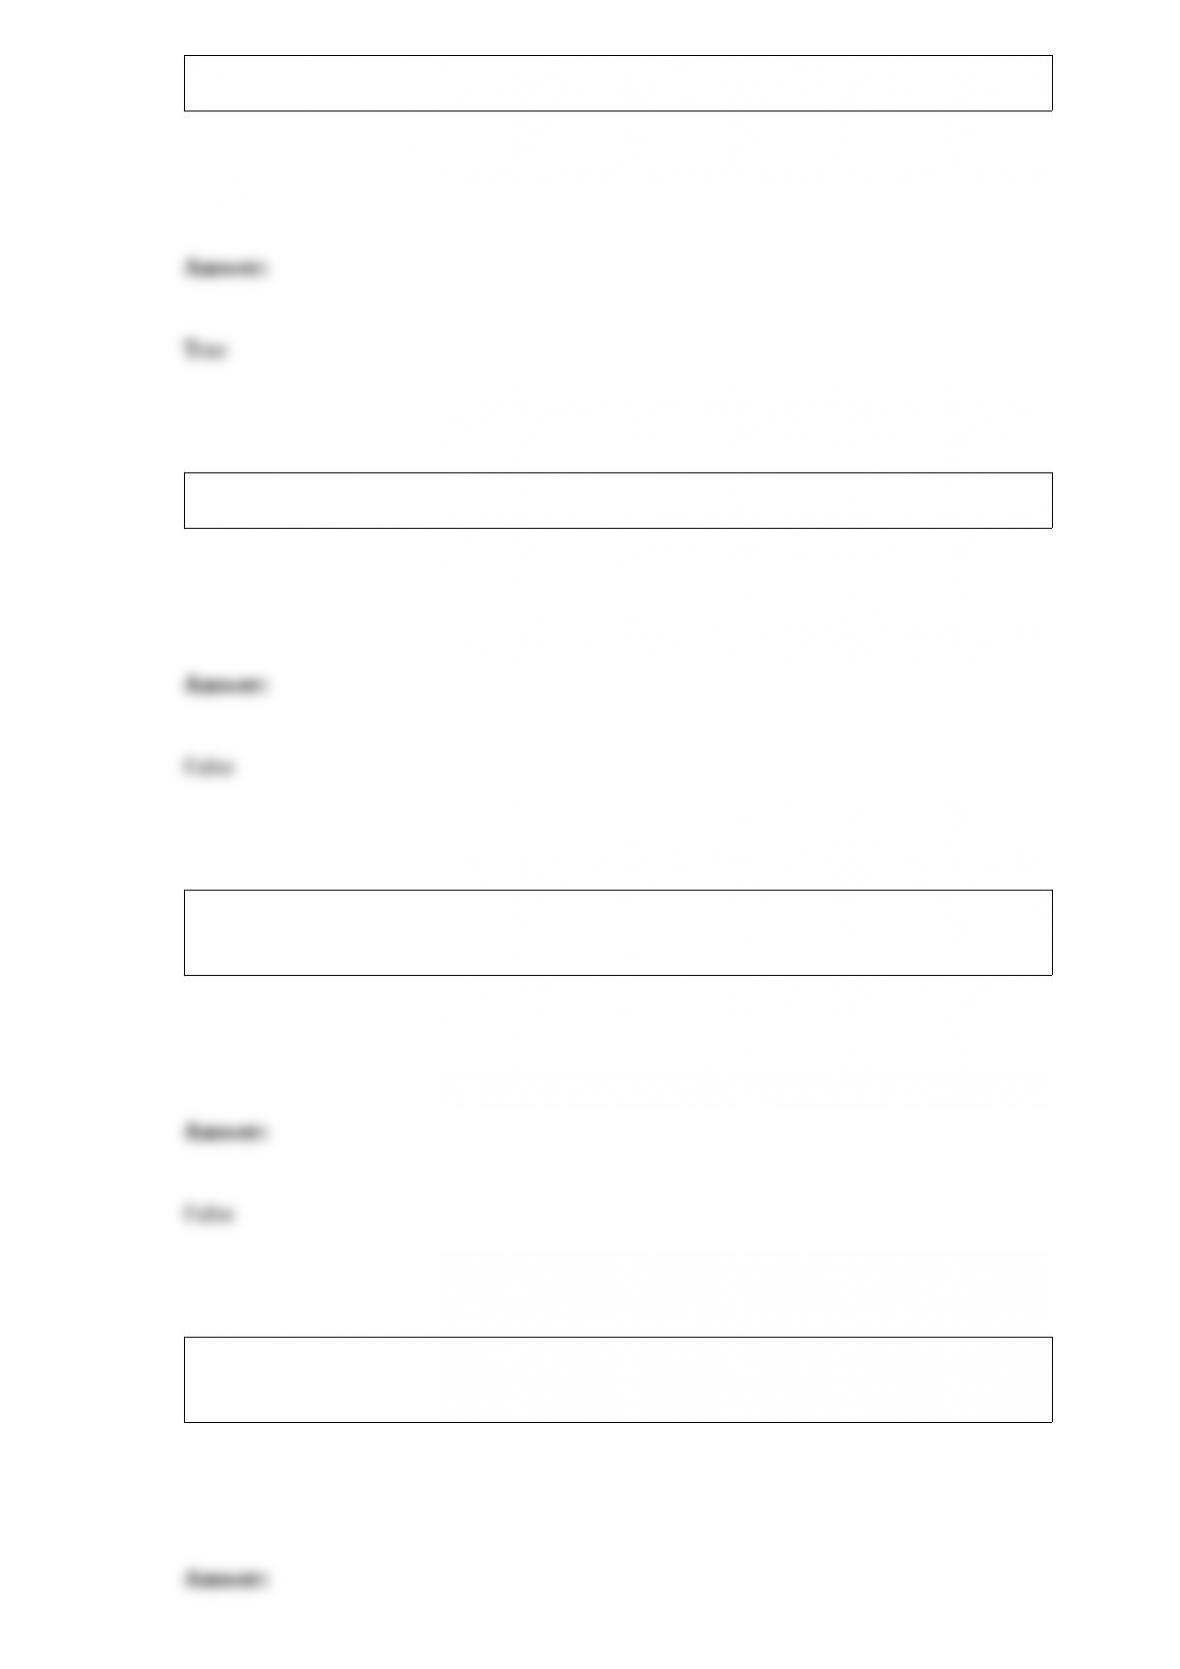
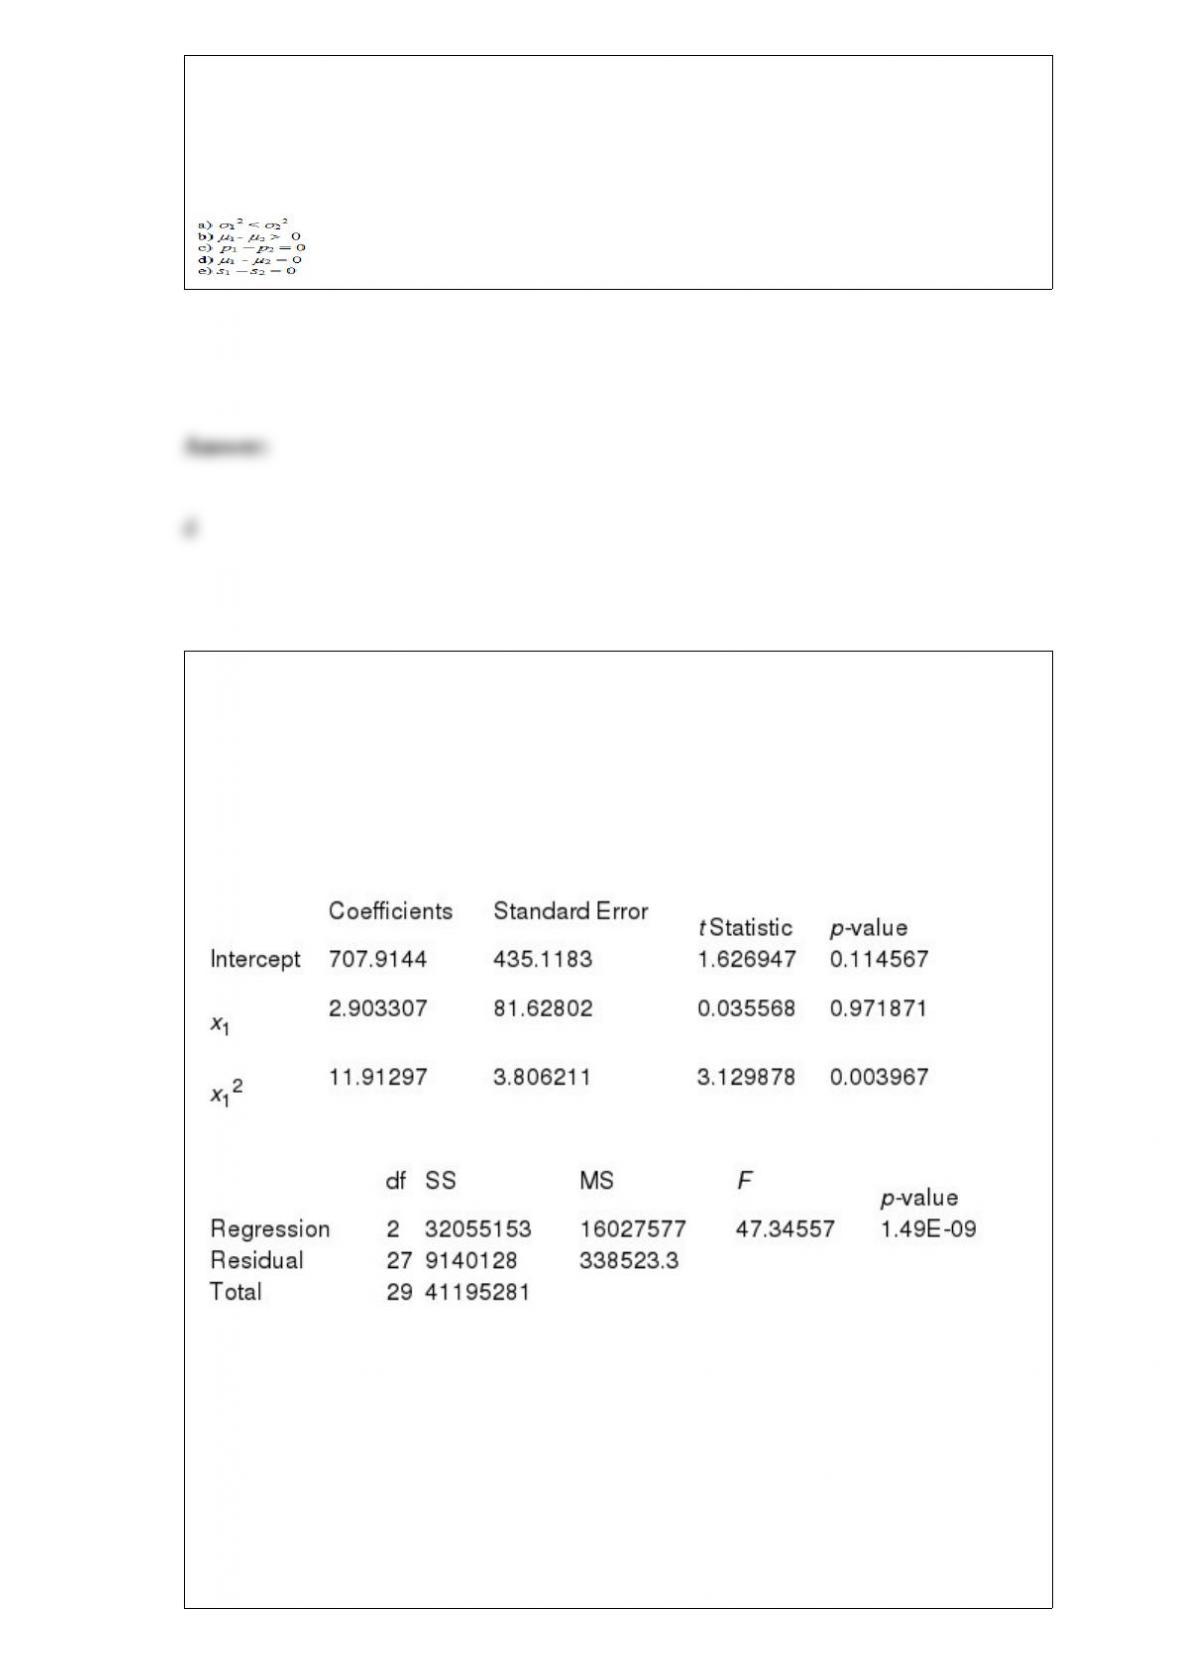
Louis Katz, a cost accountant at Papalote Plastics, Inc. (PPI), is analyzing the
manufacturing costs of a molded plastic telephone handset produced by PPI. Louis’s
independent variable is production lot size (in 1,000’s of units), and his dependent
variable is the total cost of the lot (in $100’s). Regression analysis of the data yielded
the following tables.
For a lot size of 10,000 handsets, Louis’ model predicts total cost will be _____.
a) $4,031.80
b) $757.60
c) $3,960.20
d) $354.01
e) $1873.077
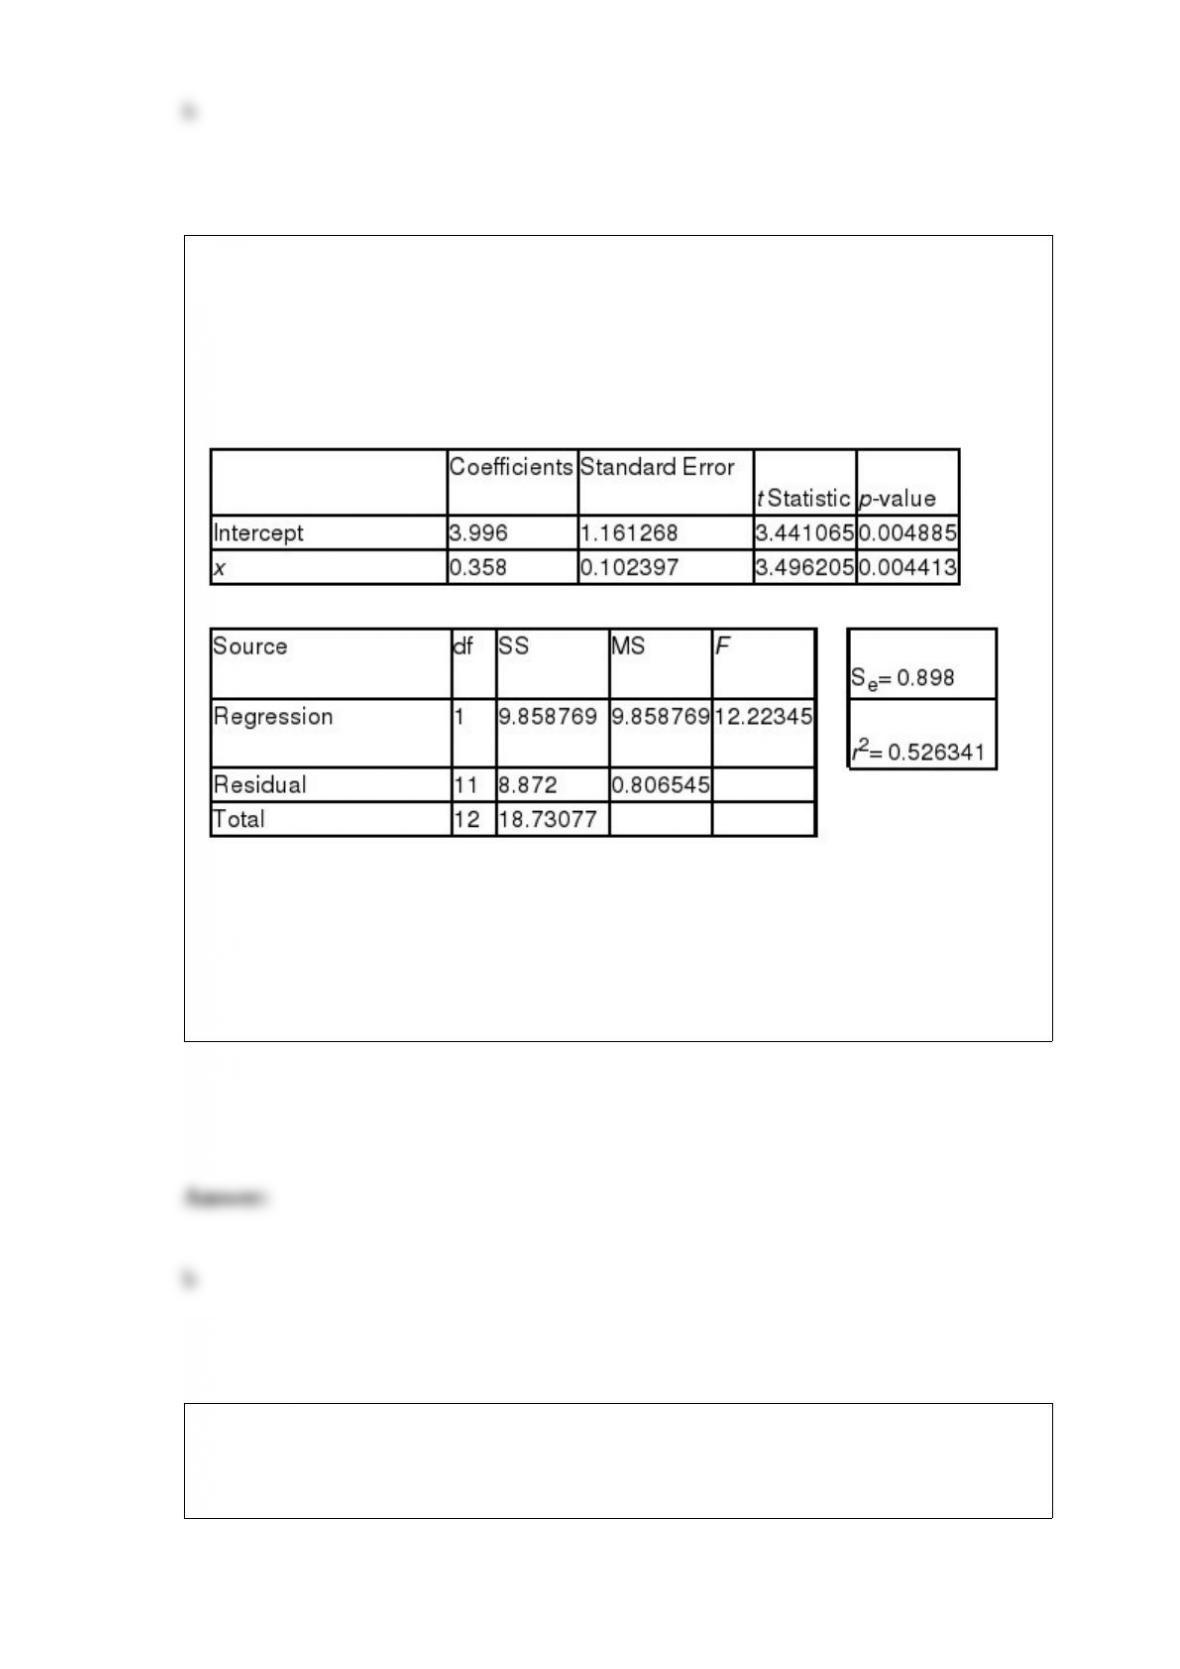
Each day, the office staff at Oasis Quick Shop prepares a frequency distribution and an
ogive of sales transactions by dollar value of the transactions. Saturday’s cumulative
frequency ogive follows.
The percentage of sales transactions on Saturday that were under $100 each was
_____________.
a) 100
b) 10
c) 80
d) 20
e) 15
Index numbers facilitate comparison of ____________.
a) means
b) data over time
c) variances
d) samples
e) deviations

According to the central limit theorem, if a sample of size 100 is drawn from a
population with a mean of 80, the mean of all sample means would equal _______.
a) 0.80
b) 8
c) 80
d) 100
e) 120
Pinky Bauer, Chief Financial Officer of Harrison Haulers, Inc., suspects irregularities in
the payroll system, and orders an inspection of “every tenth payroll voucher issued
since January 1, 2013.” Pinky is ordering a __________________.
a) statistic from the payroll vouchers
b) census of the payroll vouchers
c) sample of the payroll vouchers
d) sorting of the payroll vouchers
e) parameter of the payroll vouchers
Given P (A) = 0.45, P (B) = 0.30, P (A B) = 0.05. Find P (A|B).
a) 0.45
b) 0.135
c) 0.30
d) 0.111
e) 0.167
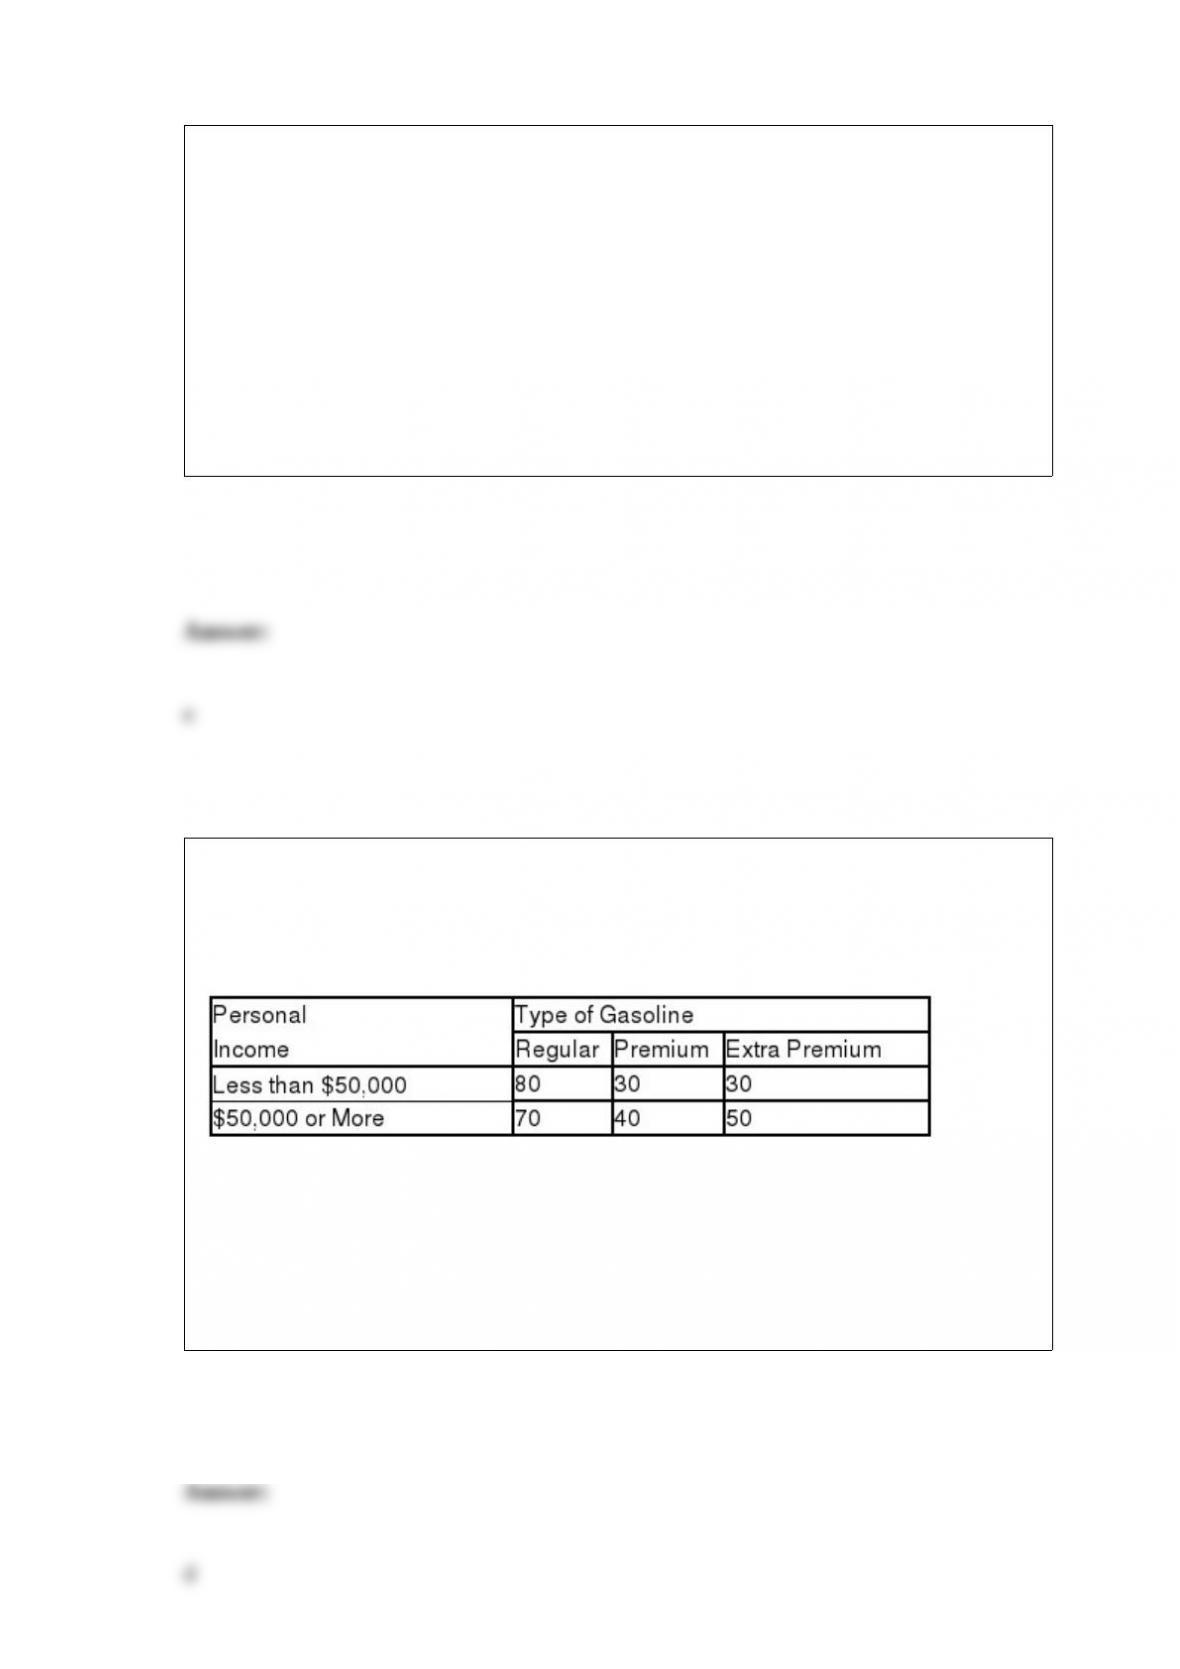
A gasoline distributor wonders whether an individual’s income level influences the
grade of gasoline purchased. The following is a contingency table from a random
sample of 300 individuals.
Using
= .05, appropriate decision is ______________.
a) reject the null hypothesis and conclude the two variables are not independent
b) reject the null hypothesis and conclude the two variables are independent
c) do not reject the null hypothesis and conclude the two variables are not independent
d) do not reject the null hypothesis and conclude the two variables are independent
e) do nothing

An insurance company is interested in conducting a study to to estimate the population
proportion of teenagers who obtain a driving permit within 1 year of their 16th birthday.
A level of confidence of 99% will be used and an error of no more than .04 is desired.
There is no knowledge as to what the population proportion will be. The size of sample
should be at least _______.
a) 1036
b) 160
c) 41
d) 259
e) 289
Completion time (from start to finish) of a building remodeling project is normally
distributed with a mean of 200 work-days and a standard deviation of 10 work-days.
The probability that the project will be completed within 185 work-days is ______.
a) 0.0668
b) 0.4332
c) 0.5000
d) 0.9332
e) 0.9950
Golf course designer Roberto Langabeer is evaluating two sites, Palmetto Dunes and
Ocean Greens, for his next golf course. He wants to prove that Palmetto Dunes
residents (population 1) play golf more often than Ocean Greens residents (population
2). Roberto plans to test this hypothesis using a random sample of 81 individuals from
each suburb. His null hypothesis is __________.
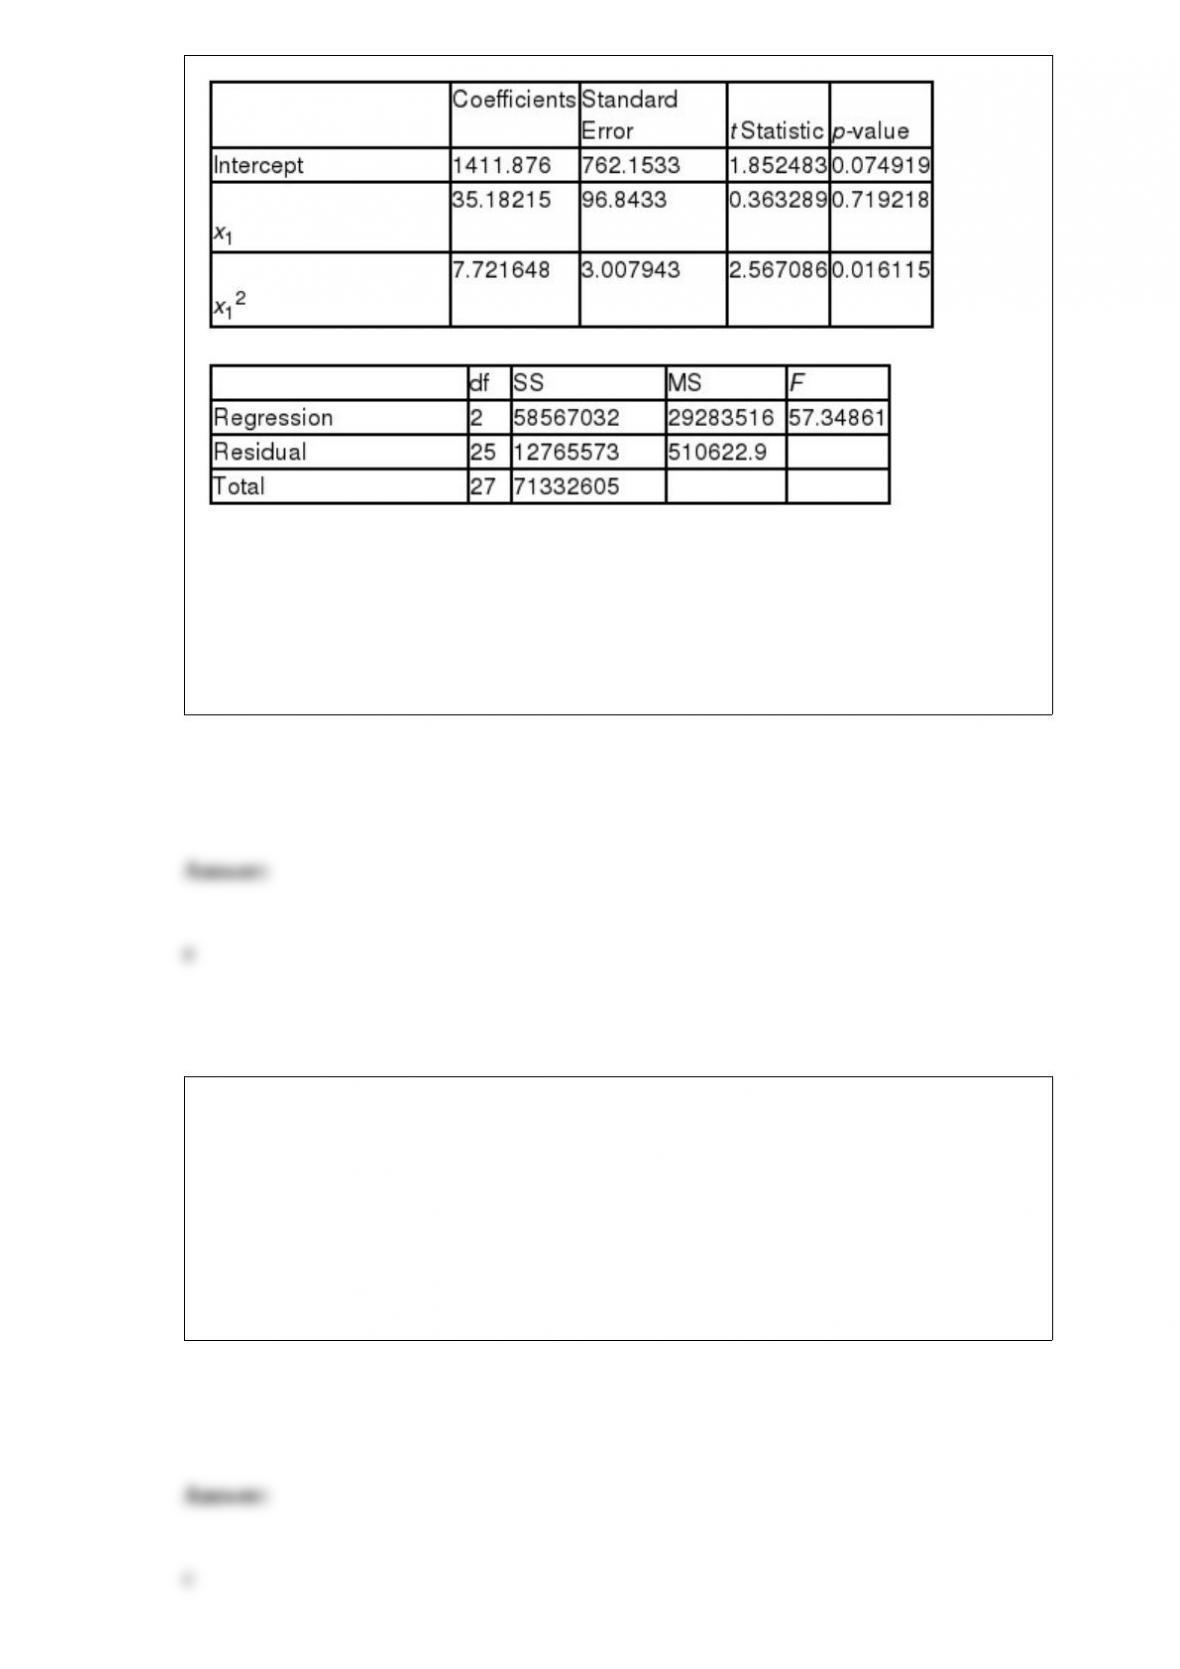
A local parent group was concerned with the increasing school cost for families with
school aged children. The parent group was interested in understanding the relationship
between the academic grade level for the child and the total costs spent per child per
academic year. They performed a multiple regression analysis using total cost as the
dependent variable and academic year (x1) as the independent variables. The multiple
regression analysis produced the following tables.
These results indicate that ____________.
a) none of the predictor variables is significant at the 5% level
b) each predictor variable is significant at the 5% level
c) x1 is the only predictor variable significant at the 5% level

d) x1
2 is the only predictor variable significant at the 5% level
e) each predictor variable is insignificant at the 5% level
Lucy Baker is analyzing demographic characteristics of two television programs,
American Idol(population 1) and 60 Minutes (population 2). Previous studies indicate
no difference in the ages of the two audiences. (The mean age of each audience is the
same.) Her staff randomly selected 100 people from each audience, and reported the
following: 1= 43 years and 2= 45 years. Assume that 1= 5 and 2=
8. With a two-tail test and a= .05, the appropriate decision is _________________.
a) do not reject the null hypothesis 1– 2= 0
b) reject the null hypothesis 1– 2>0
c) reject the null hypothesis 1– 2= 0
d) do not reject the null hypothesis 1– 2<0
e) do nothing
A multiple regression analysis produced the following tables.
For x1= 10, the predicted value of y is ____________.
a) 8.88.
b) 2,031.38
c) 2,53.86
d) 262.19
e) 2,535.86
If xis uniformly distributed over the interval 8 to 12, inclusively (8 x 12), then the
probability, P(10.0 x 11.5), is __________________.
a) 0.250
b) 0.333
c) 0.375
d) 0.500
e) 0.750

A researcher wishes to determine the difference in two population means. To do this,
she randomly samples 9 items from each population and computes a 90% confidence
interval. The sample from the first population produces a mean of 780 with a standard
deviation of 240. The sample from the second population produces a mean of 890 with
a standard deviation of 280. Assume that the values are normally distributed in each
population and that the population variances are approximately equal. The critical
tvalue used from the table for this is _______.
a) 1.860
b) 1.734
c) 1.746
d) 1.337
e) 2.342
Miguel Hernandez , Senior Vice President of Human Resources at Memorial Hospital is
exploring the usage of nursing overtime in the emergency department during the last
operating year. Staffing records and emergency department visits for 20 days between
the period of January 1, 2012 and December 31, 2012 are selected for analysis. For this
study, the group of 20 days is a __________.
a) parameter
b) sample
c) population
d) statistic
e) frame

Albert Abbasi, VP of Operations at Ingleside International Bank, is evaluating the
service level provided to walk-in customers. Accordingly, he plans a sample of waiting
times for walk-in customers. If the population of waiting times has a mean of 15
minutes and a standard deviation of 4 minutes, the probability that Albert’s sample of 64
will have a mean less than 14 minutes is ________.
a) 0.4772
b) 0.0228
c) 0.9772
d) 0.9544
e) 1.0000
Suppose a population has a mean of 400 and a standard deviation of 24. If a random
sample of size 144 is drawn from the population, the probability of drawing a sample
with a mean between 395.5 and 404.5 is _______.
a) 0.9756
b) 0.0244
c) 0.0278
d) 0.9722
e) 1.0000
Suppose a researcher sets up a design in which there are five different treatments and a
total of 32 measurements in the study. For alpha = .01, the critical table F value is
____.
a) 3.75
b) 3.78
c) 4.07
d) 4.11
e) 4.91
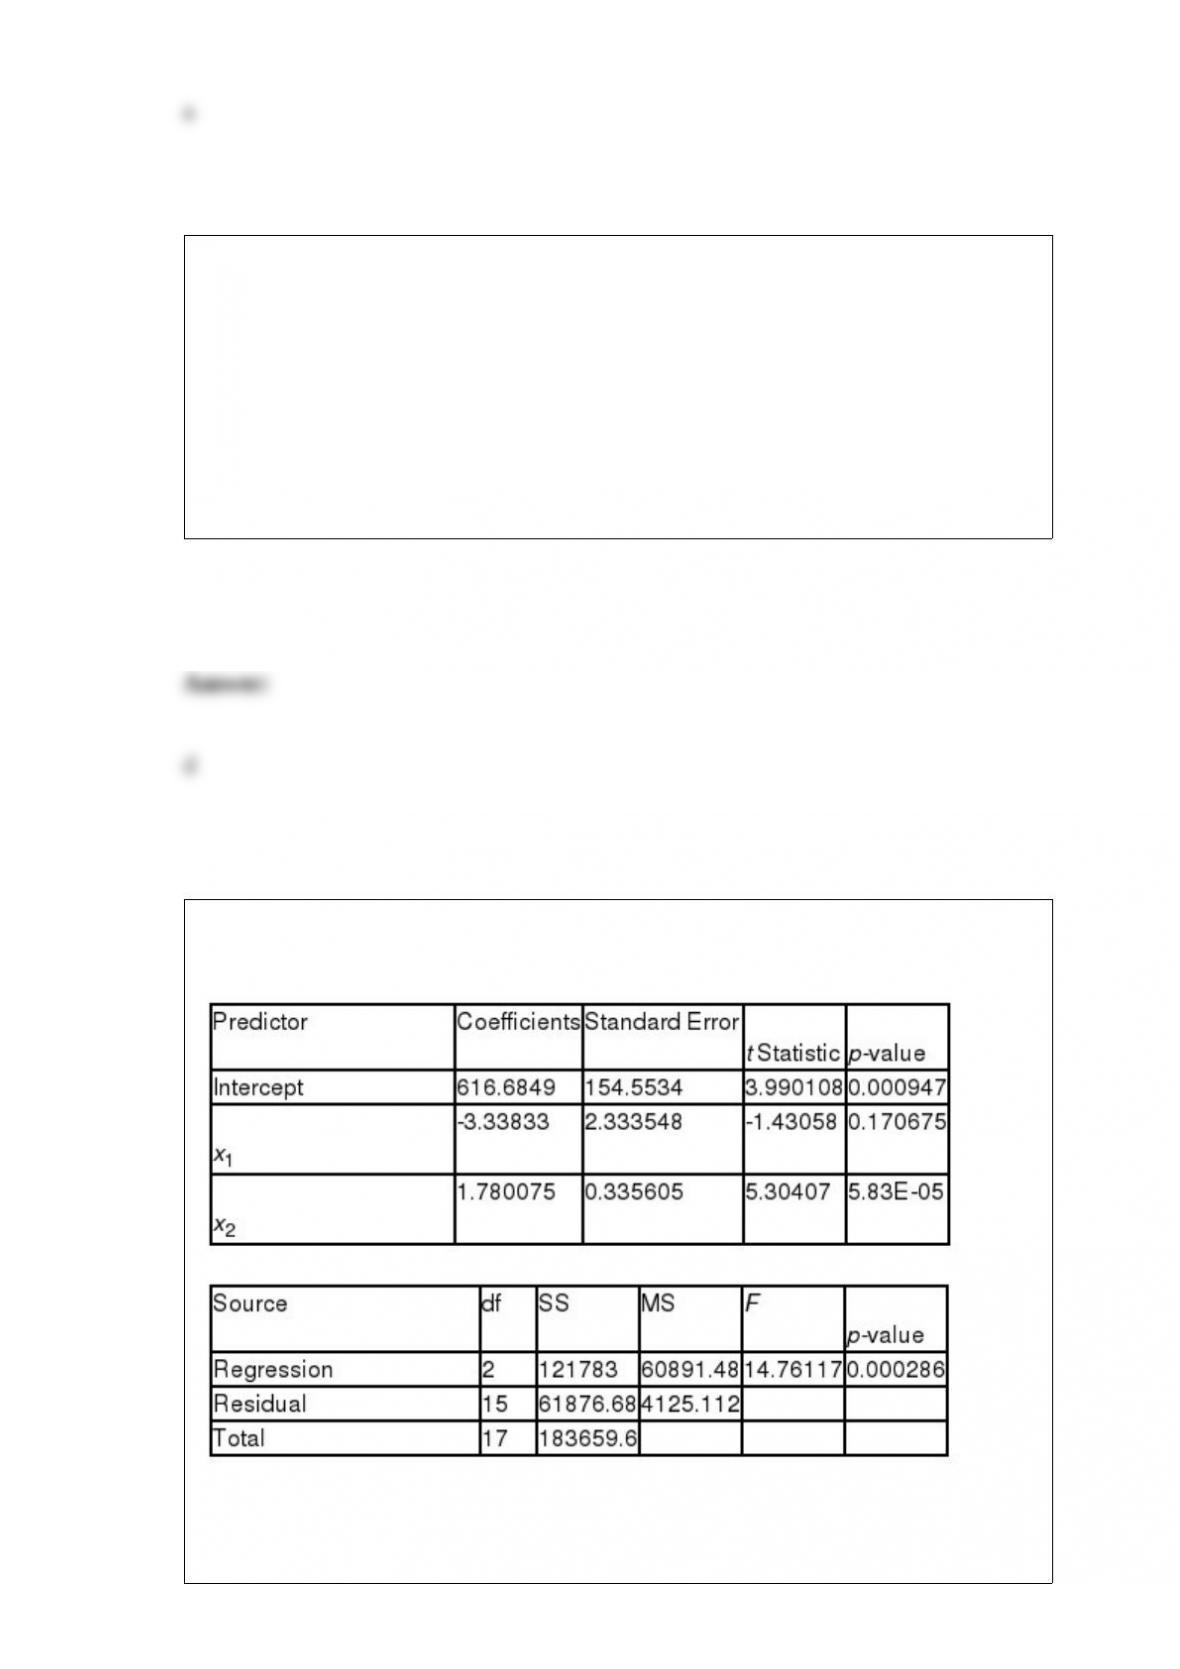
A multiple regression analysis produced the following tables.
The regression equation for this analysis is ____________.
a) y = 616.6849 + 3.33833 x1+ 1.780075 x2
b) y = 154.5535 – 1.43058 x1+ 5.30407 x2
c) y = 616.6849 – 3.33833 x1– 1.780075 x2
d) y = 154.5535 + 2.333548 x1+ 0.335605 x2
e) y = 616.6849 – 3.33833 x1+ 1.780075 x2
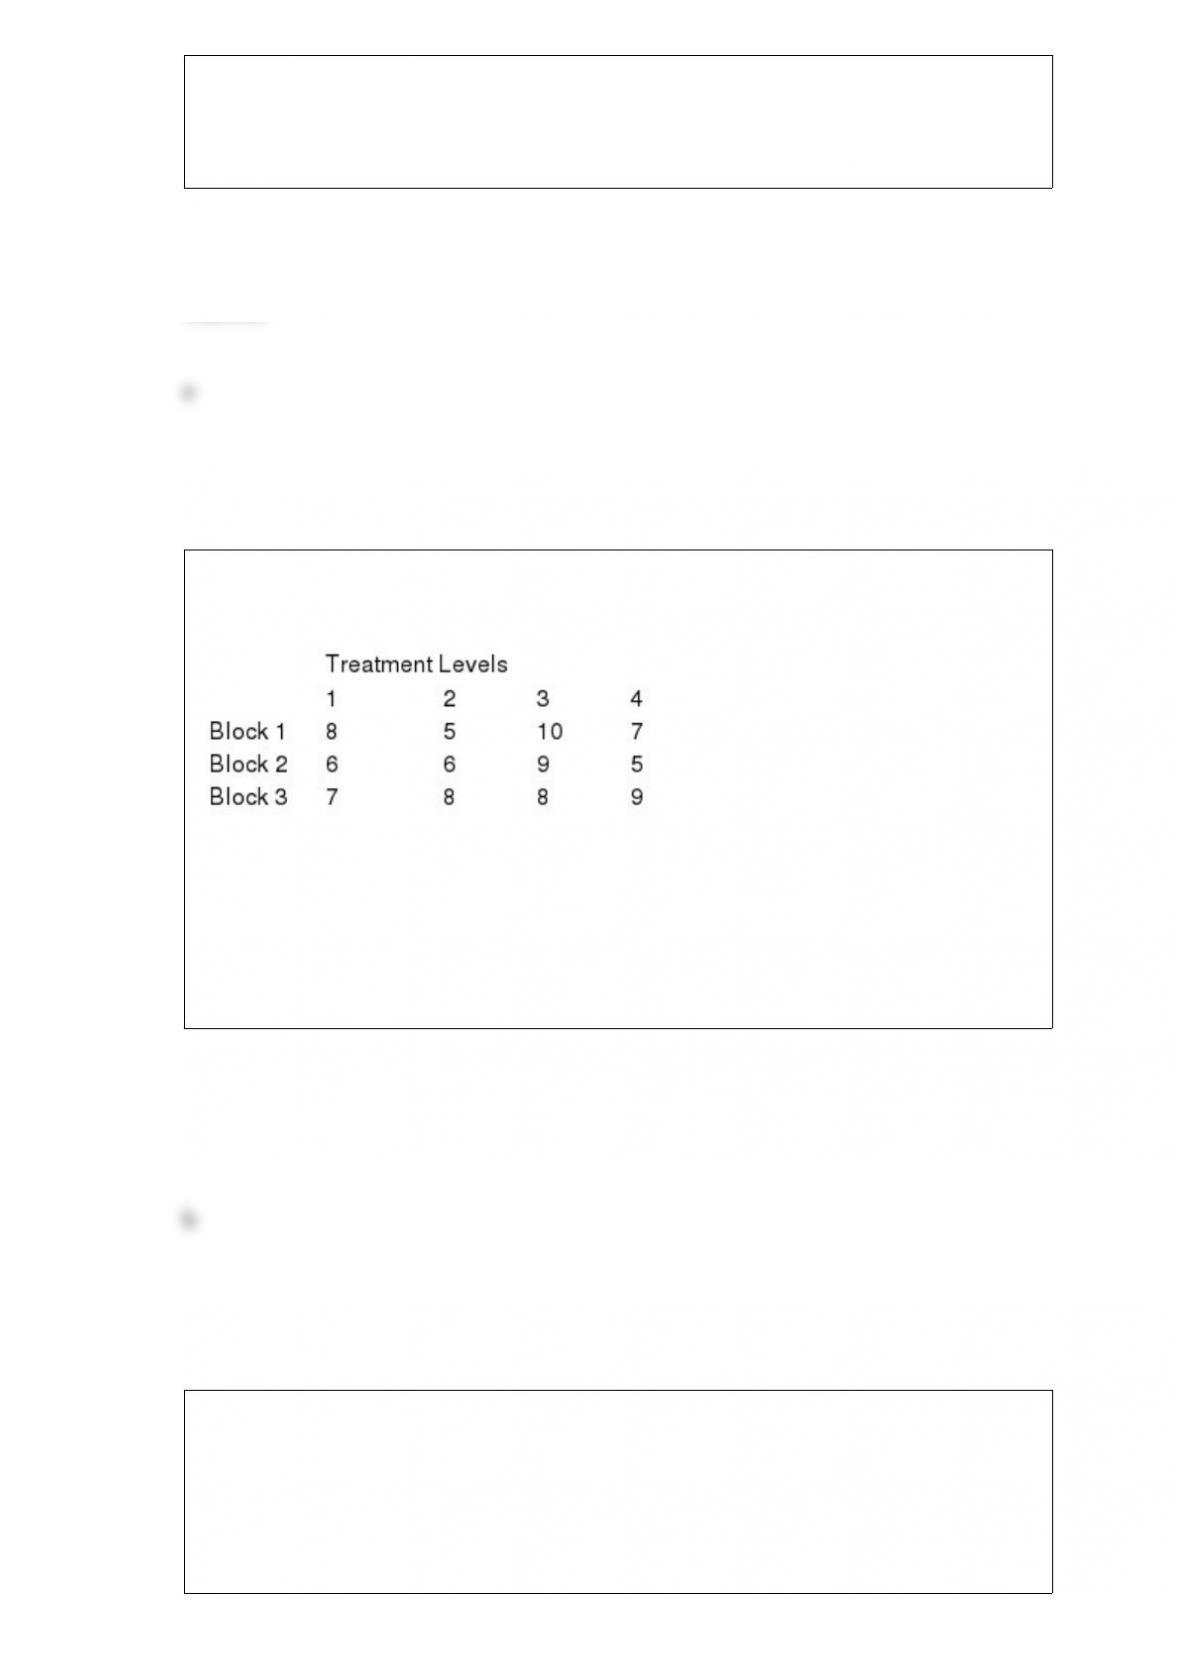
Data from a randomized block design are shown in the following table.
Using
= 0.05, the critical F value for the treatments null hypothesis is ________.
a) 3.59
b) 4.76
c) 3.98
d) 5.14
e) 9.89
It is known that 20% of all students in some large university are overweight, 20%
exercise regularly and 2% are overweight and exercise regularly. What is the
probability that a randomly selected student is either overweight or exercises regularly
or both?
a) 0.40

b) 0.38
c) 0.20
d) 0.42
e) 0.10
Use of a smoothing constant value greater than 0.5 in an exponential smoothing model
gives more weight to ___________.
a) the actual value for the current period
b) the actual value for the previous period
c) the forecast for the current period
d) the forecast for the previous period
e) the forecast for the next period
Consider the relative frequency distribution given below:

There were 60 numbers in the data set. How many numbers were in the interval
20-under 40?
a) 12
b) 20
c) 40
d) 10
e) 15
The null hypothesis for a one-sample runs test is __________________.
a) “the observations in the sample are randomly generated”
b) “the observations in the sample are not correlated”
c) “the observations in the sample are statistically independent”
d) “the observations in the sample are cross-linked”
e) “the observations are systematically generated”
In performing a hypothesis test where the null hypothesis is that the population mean is
4.8 against the alternative hypothesis that the population mean is not equal to 4.8, a
random sample of 25 items is selected. The sample mean is 4.1 and the sample standard
deviation is 1.4. It can be assumed that the population is normally distributed. The level
of significance is selected to be 0.10. The table “t” value for this problem is _______.

a) 1.318
b) 1.711
c) 2.492
d) 2.797
e) 3.227
Sure Stone Tire Company has established that the useful life of a particular brand of its
automobile tires is normally distributed with a mean of 40,000 miles and a standard
deviation of 5000 miles. What is the probability that a randomly selected tire of this
brand has a life between 30,000 and 50,000 miles?
a) 0.5000
b) 0.4772
c) 0.9544
d) 0.9772
e) 1.0000