
A larger sample size reduces the potential for large sampling error.
In a study of employees at a local company, the human resource manager wants to
develop a multiple regression model to explain the difference in employee wage rates.
She is thinking of including a variable, degree status, in which the following categories
exist: no degree, H.S. degree, junior college degree, bachelor degree, graduate degree.
Two other variables are being considered; Age and Years With the Company. Given
this, the appropriate number of variables in the model will be six.
Based on the empirical rule we can expect about 95 percent of the values in bell-shaped
distributions to be within one standard deviation of the mean.
In estimating a population mean, increasing the confidence level will result in a higher
margin of error for a given sample size.
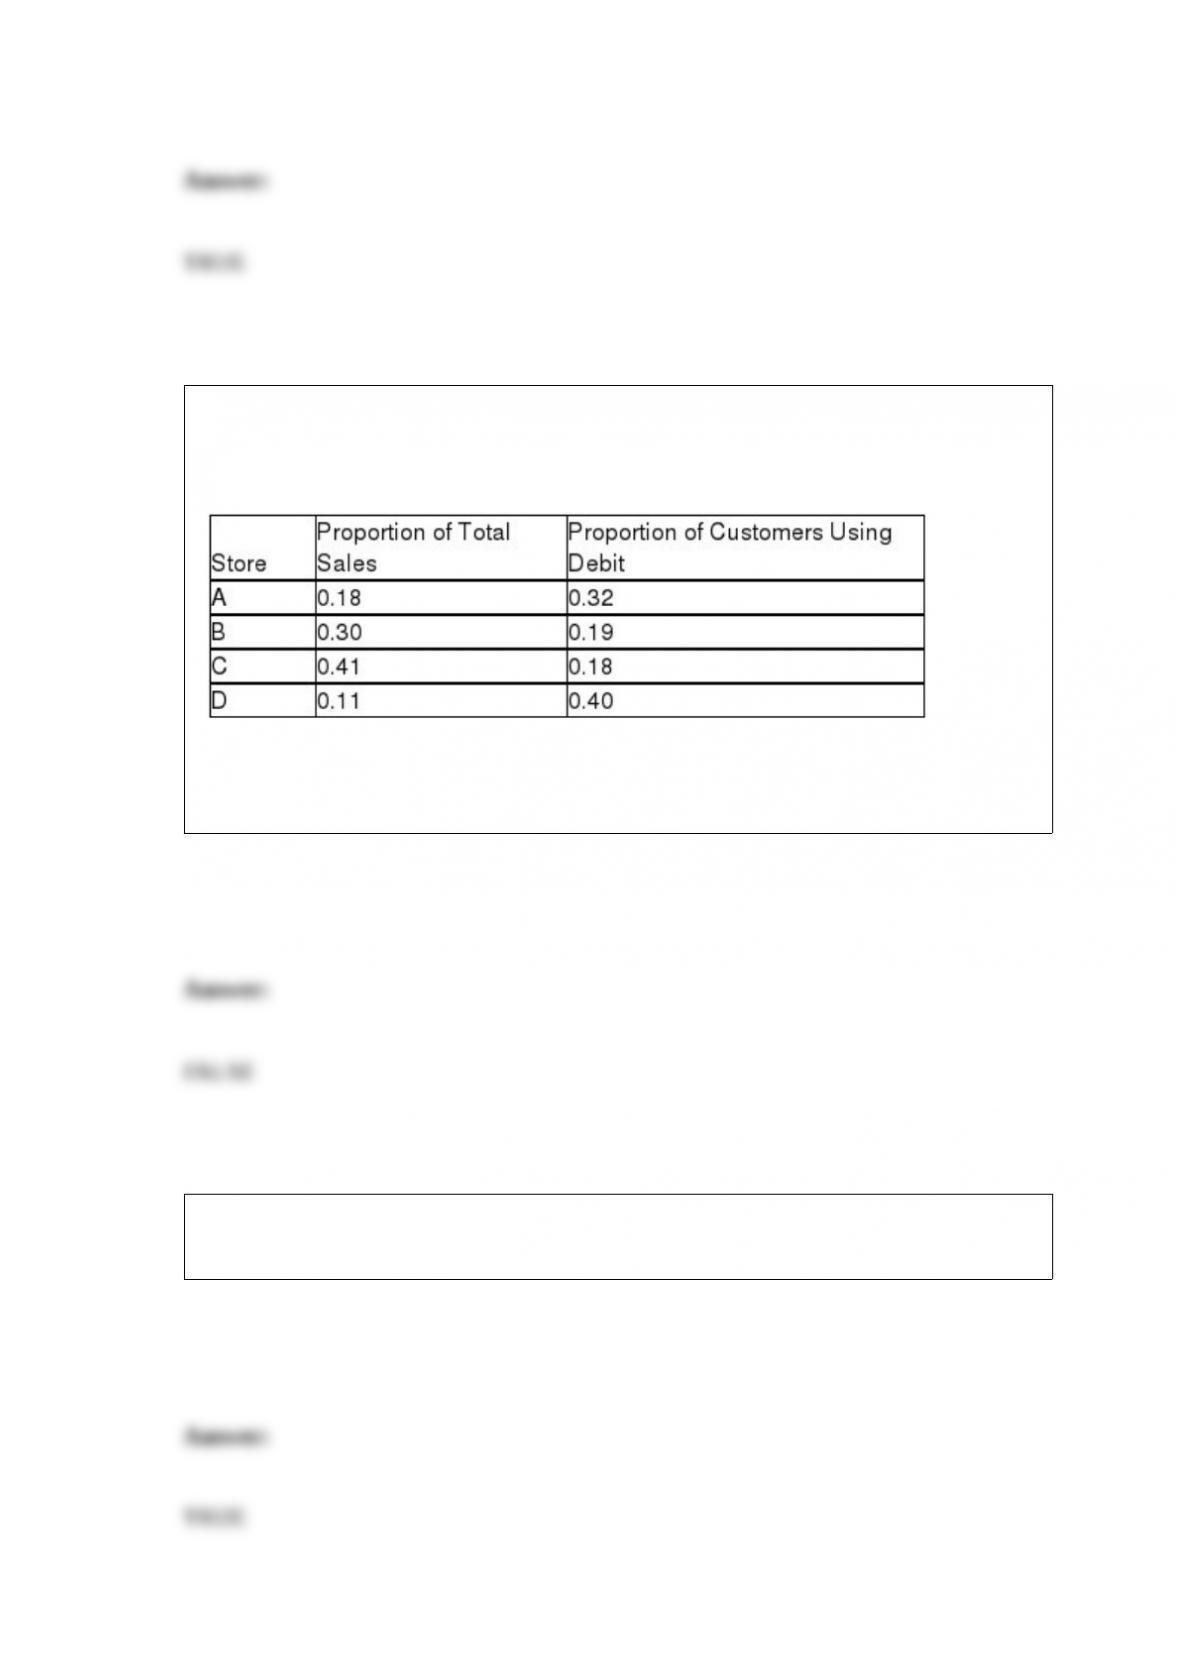
The Baker Oil and Gas Company has four retail locations, code-named A, B, C, and D.
The following table illustrates the percentage of total company sales at each store and
also the percentage of customers at that store who make purchases with debit cards:
Based on this information, given that a customer has used a debit card to make the
purchase, the sale was most likely made at store D.
If a manager is planning for an expansion of the factory, a forecast model with a
long-term planning horizon would probably be used. ”

The term one-way analysis of variance refers to the fact that in conducting the test,
there is only one way to set up the null and alternative hypotheses.
A box and whisker plot shows where the mean value falls relative to the median for a
variable.
A manufacturing manager has developed a table that shows the average production
volume each day for the past three weeks. The average production level is an example
of a numerical measure.
Two placement exams are available that students can take to determine which math
class they should begin with in their freshman year. It is believed that there is no
difference in the mean scores that would be received for the two tests. To test this using
a 0.05 level of significance, a randomly selected group of students took both tests and
had their scores recorded. The following data were obtained:
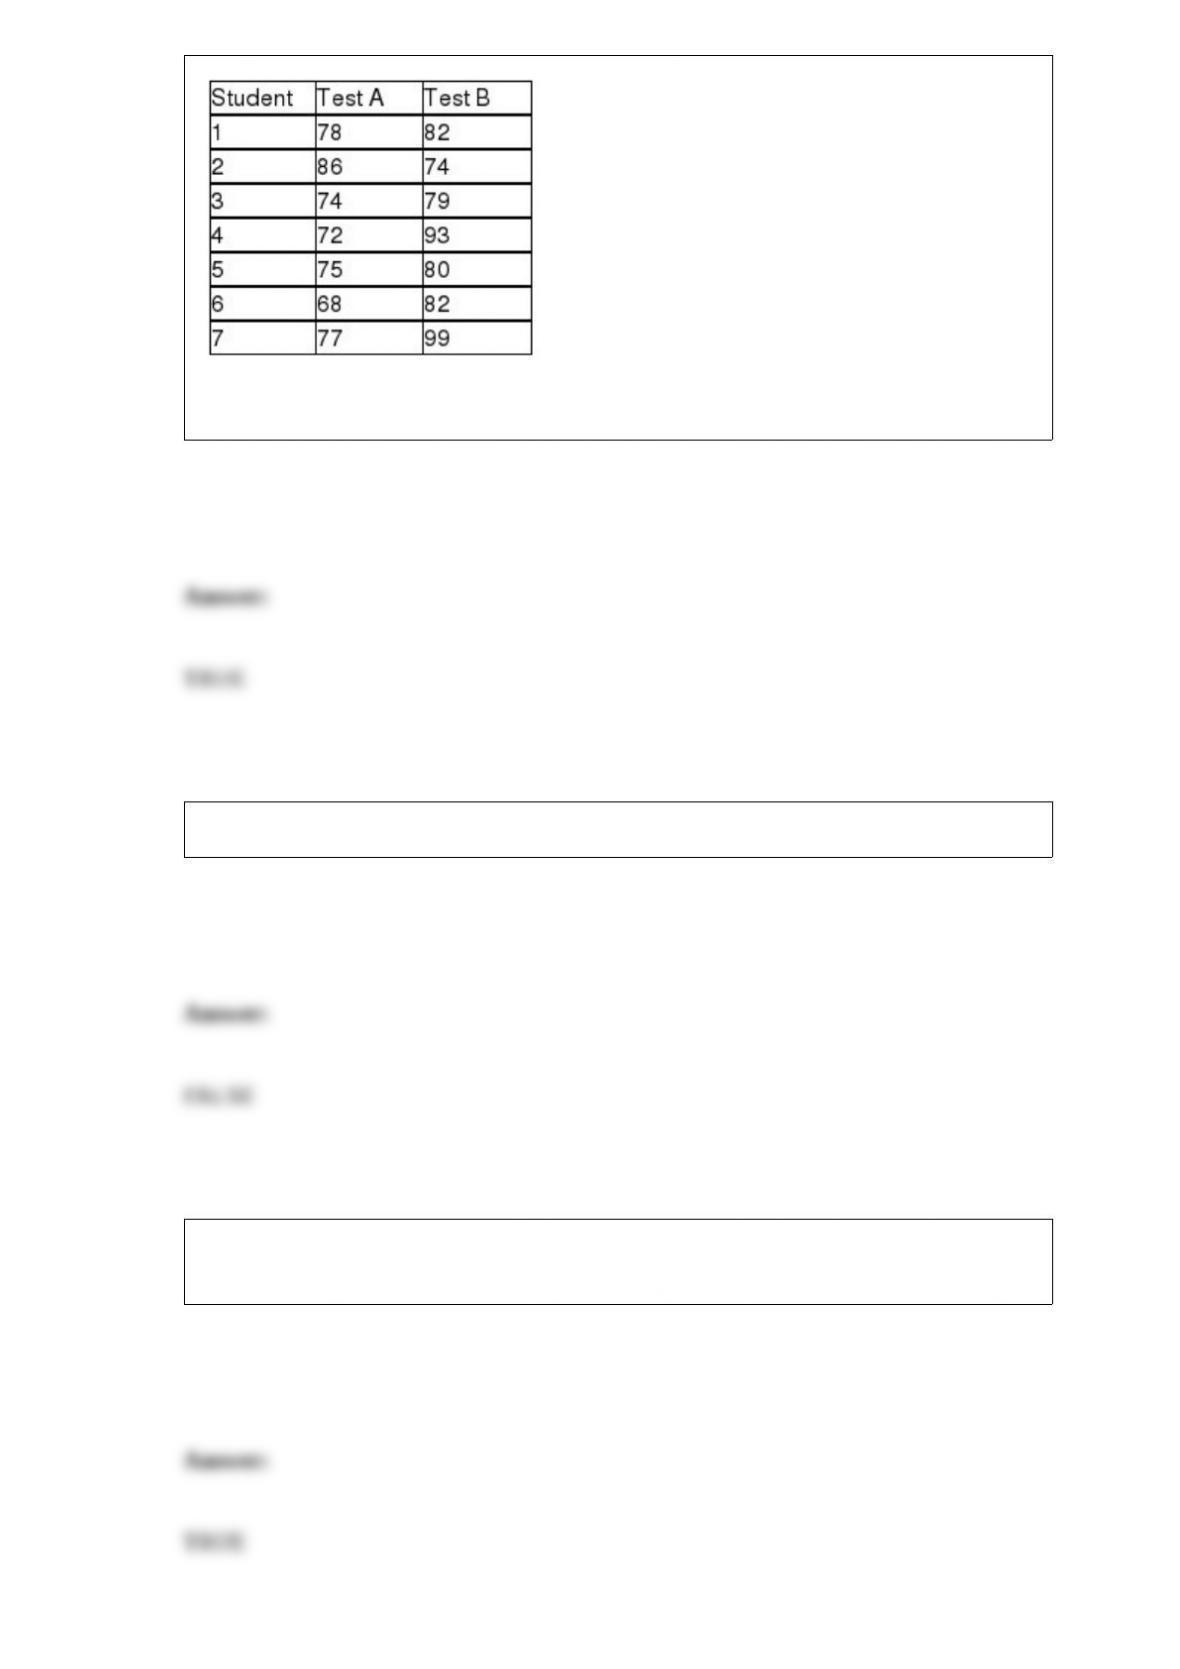
Based on these data, the test statistic is approximately t = -1.892.
A histogram is an effective tool for graphically describing a joint frequency distribution.
One way to develop a frequency distribution using Excel is to use the Frequency
function.

The credit card balances for customers at State Bank and Trust has a mean equal to
$800 and a standard deviation equal to $60.00. Kevin Smith’s balance is $1,352. Based
on this, his standardized value is 9.20.
Total process variation is made up of the sum of common cause variation and special
cause variation.
A short survey with closed-end questions is likely to have a better response rate than a
long survey with open-ended questions.
When a single value is randomly chosen from a discrete distribution, the different
possible values are mutually exclusive.
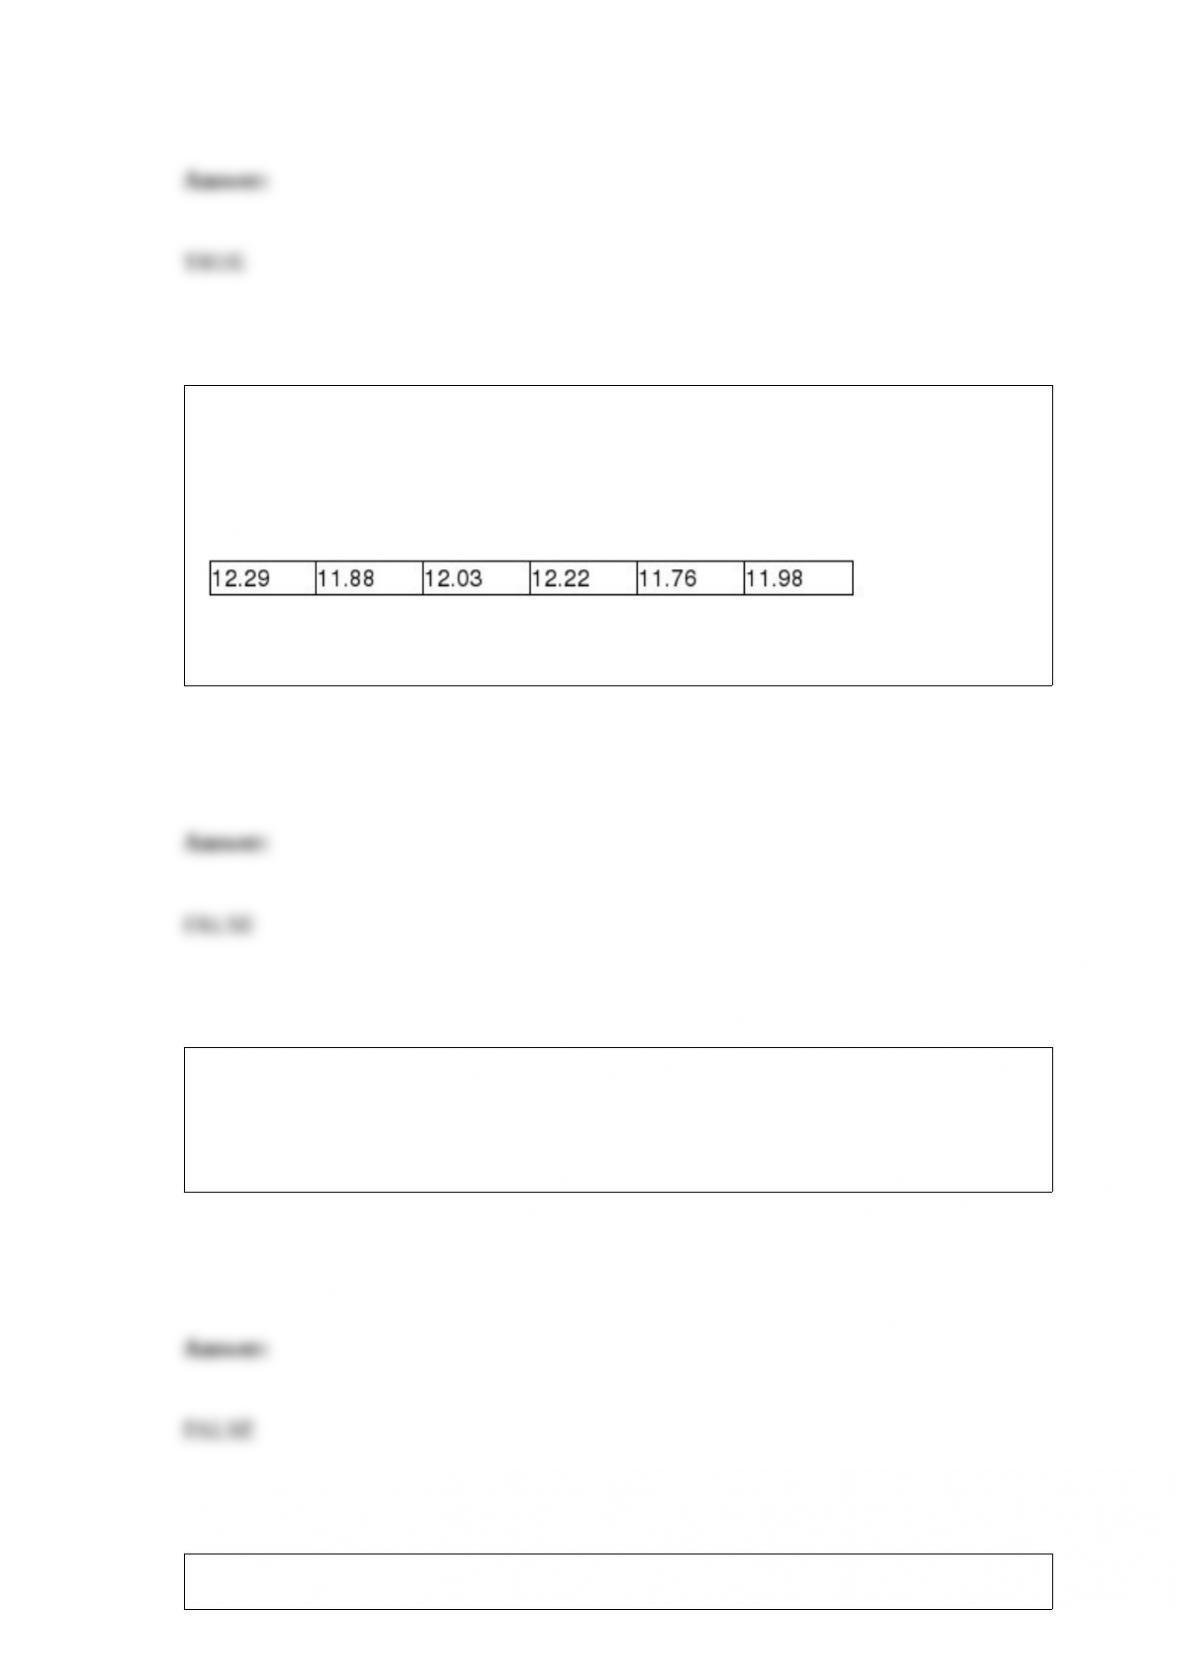
A machine that is used to fill soda pop cans with pop has an adjustable mean fill setting,
but the standard deviation is not supposed to exceed 0.18 ounces. To make sure that this
is the case, the managers at the beverage company each day select a random sample of
n = 6 cans and measure the fill volume carefully. In one such case, the following data
(ounces per can) were observed.
Based on these sample data, the test statistic is approximately χ2 = 5.01.
One of the variables that are being considered for inclusion in a multiple regression
model is marital status of the customer. There are four possible responses listed for this
variable. Based on this, four dummy variables will need to be created and incorporated
into the regression model.
In preparing a line chart, the horizontal axis shows time and the vertical axis shows the
value of the variable of interest.
A correlation of -0.9 indicates a weak linear relationship between the variables.
Suppose it is known that 93 percent of all parts in an inventory of 18,900 parts are in
workable order. If a sample of n = 100 parts were selected from the inventory, based on
the concept of sampling distributions of proportions, it can be assumed that the sample
proportion of workable parts will also be 0.93.
When the hypothesized proportion is close to 0.50, the spread in the sampling
distribution of is greater than when the hypothesized proportion is close to 0.0 or 1.0.

The forward selection method and the backward elimination method will always lead to
choosing the same final regression model.
Aceco has a contract with a supplier to ship parts that contain no more than three
percent defects. When a large shipment of parts comes in, Aceco samples n = 150.
Based on the results of the sample, they either accept the shipment or reject it. If Aceco
wants no more than a 0.10 chance of rejecting a good shipment, the cut-off between
accepting and rejecting should be 0.0478 or 4.78 percent of the sample.
The Sergio Lumber Company manufactures plywood. One step in the process is the one
where the veneer is dried by passing through a huge dryer (similar to an oven) where
much of the moisture in the veneer is extracted. At the end of this step, samples of
veneer are tested for moisture content. It is believed that pine veneer will be less moist
on average than will fir veneer. The following data were reported recently where the
values represent the percent of moisture in the wood:
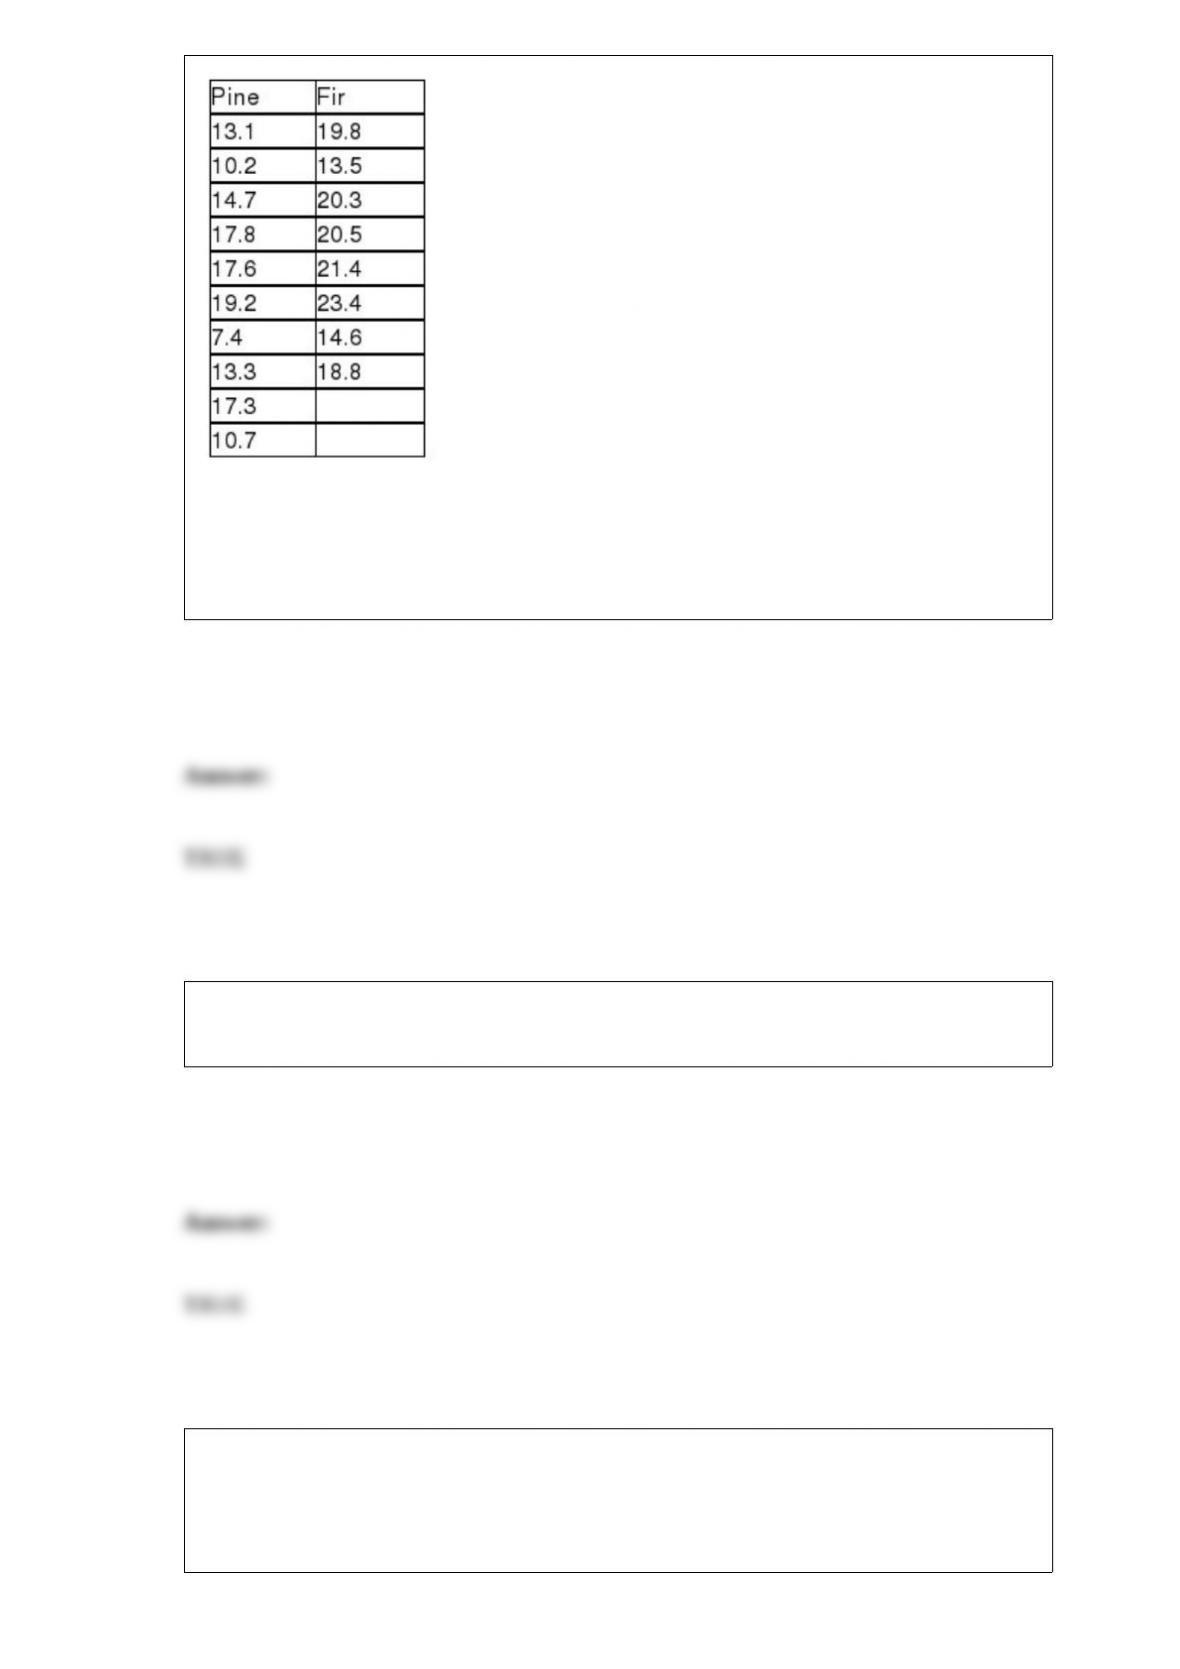
The null and alternative hypotheses to be tested are
H0 : μp ≥ μf
Ha : μp < μf
Open-end questions are typically included in a survey when the objective is to provide
the maximum opportunity for the respondent to express his or her opinion.
Three brands of running shoes are each tested by 10 different runners. The amount of
wear on the sole of the shoes is then measured. The objective is to determine if there is
any difference among the three brands of shoes based on how long the soles last. This
means that there is one factor with 10 levels and 3 blocks.
The primary purpose of performing a pre-test when developing a telephone or mail
survey is to make sure that the respondents can understand the questions and are able to
provide meaningful responses.
If a six-sided die is tossed two times and “4” shows up both times, the probability of “4”
on the third trial is much larger than any other outcome.
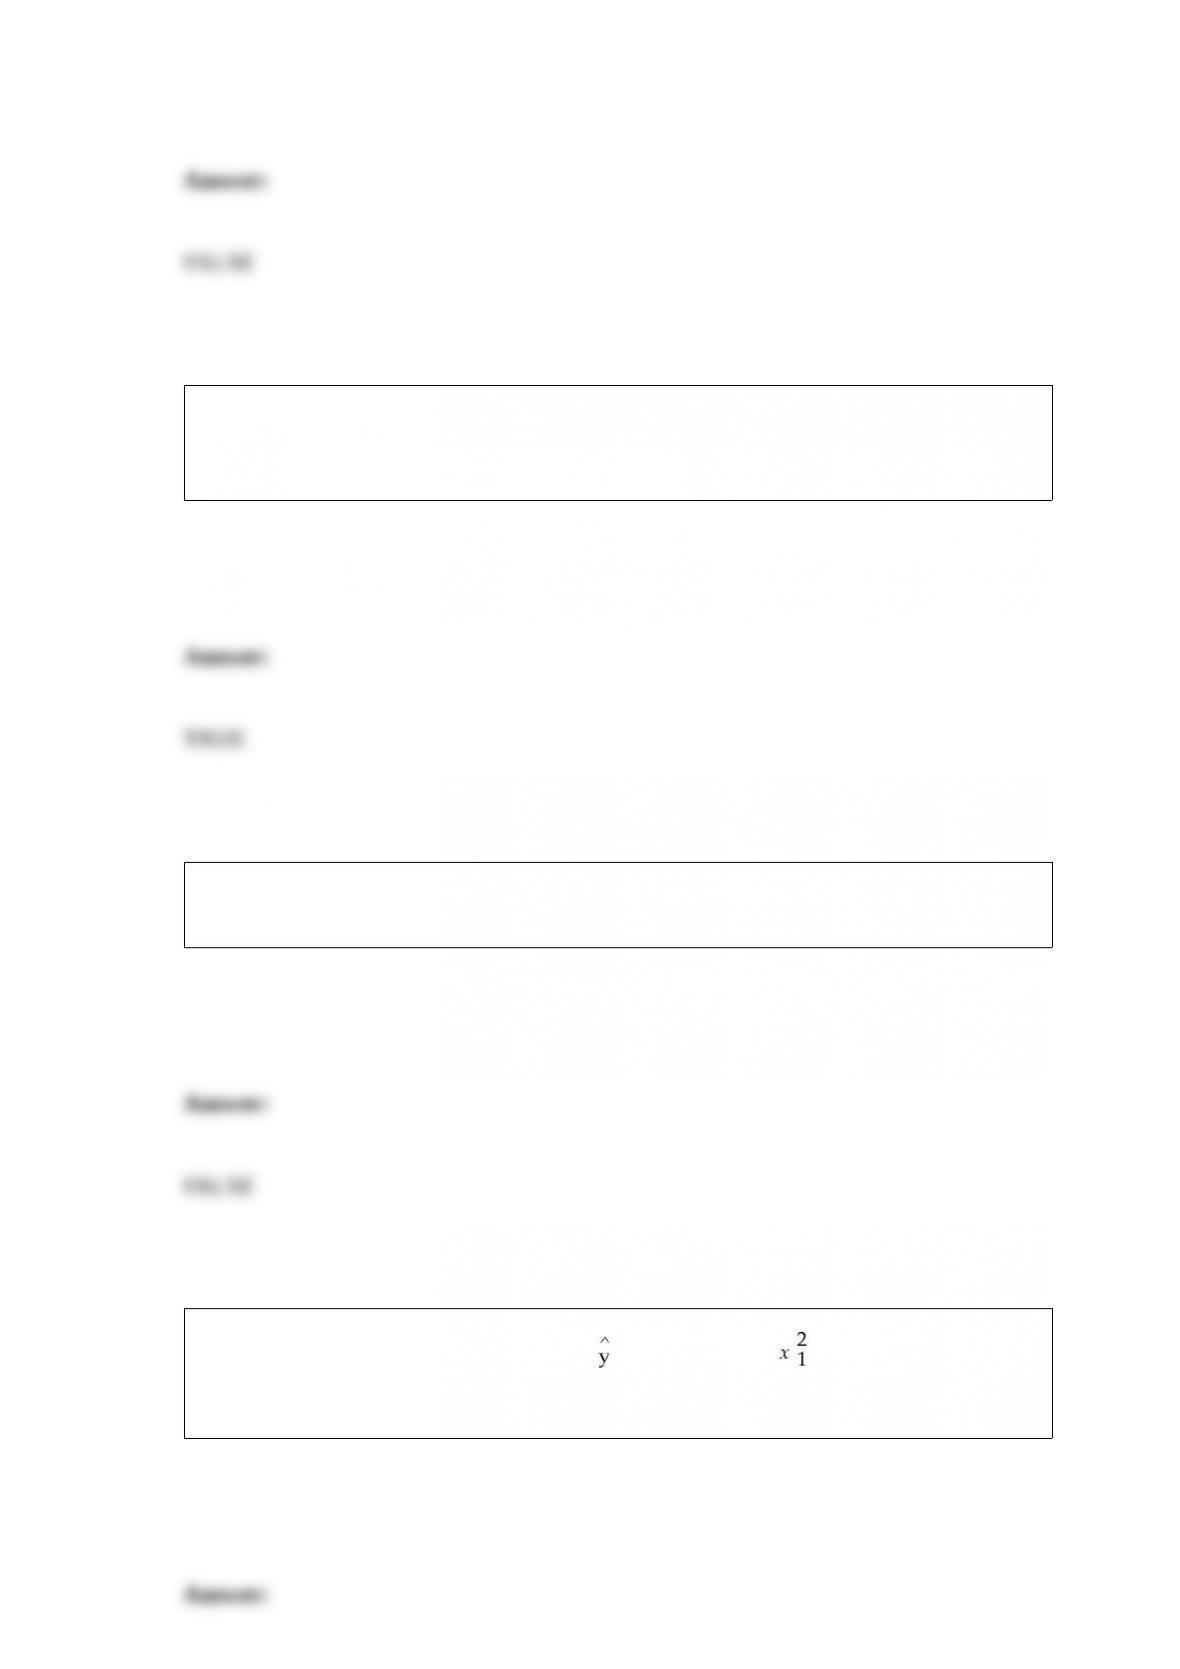
Consider the following regression model: = B0 + B1x1 + B1 + ε. If B2 > 0, then the
parabola will open downward and if B2< 0, then the parabola will open downward.
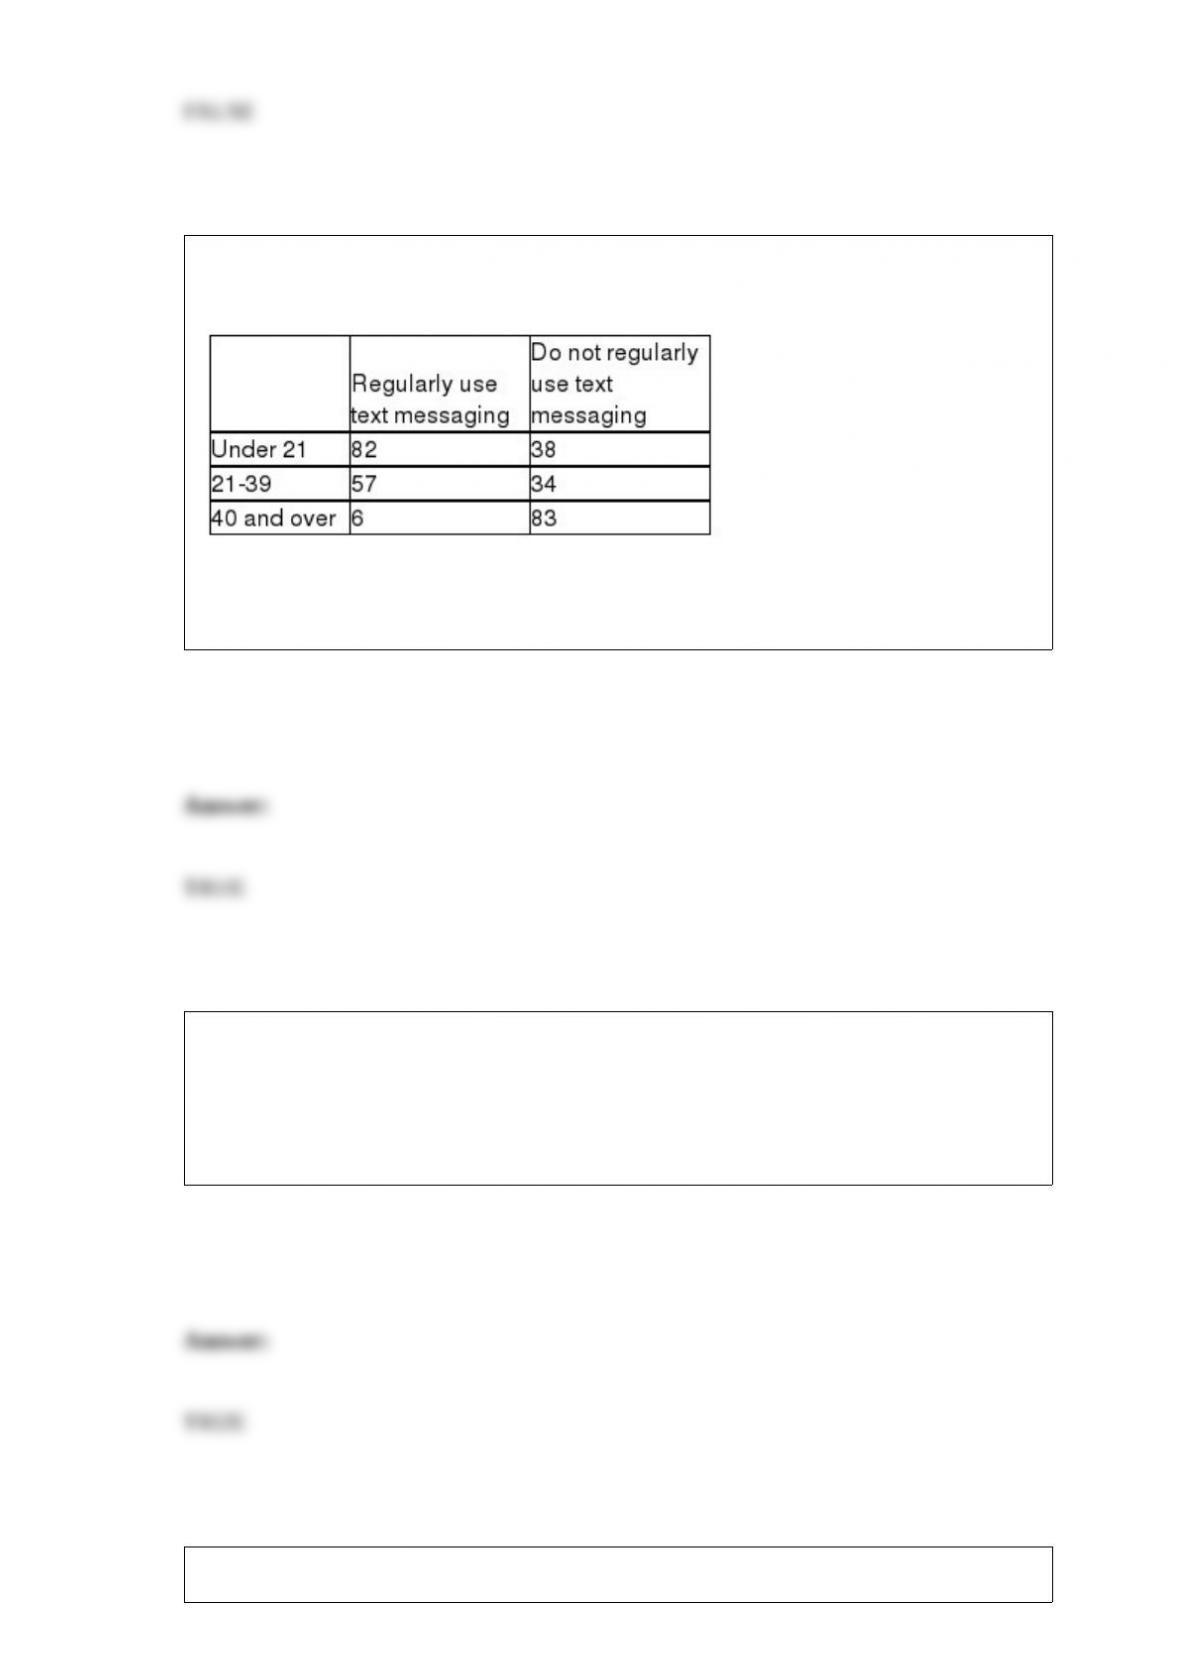
A cell phone company wants to determine if the use of text messaging is independent of
age. The following data has been collected from a random sample of customers.
To conduct a test of independence, the difference expected value for the “40 and over
and regularly use text messaging” cell is just over 43 people.
The Nationwide Motel Company has determined that 70 percent of all calls for motel
reservations request nonsmoking rooms. Recently, the customer service manager for the
company randomly selected 25 calls. Assuming that the distribution of calls requesting
nonsmoking rooms is described by a binomial distribution, the probability that fewer
than 5 customers will request smoking rooms is approximately 0.09.
An annual time series cannot exhibit a seasonal component.

A small company has 7 employees. The numbers of years these employees have worked
for this company are shown as follows:
Based upon this information, the mode number of years that employees have been with
this company is:
A) 16
B) 2
C) 9
D) 10
Consider the following chart. Which of the following statements is most correct?
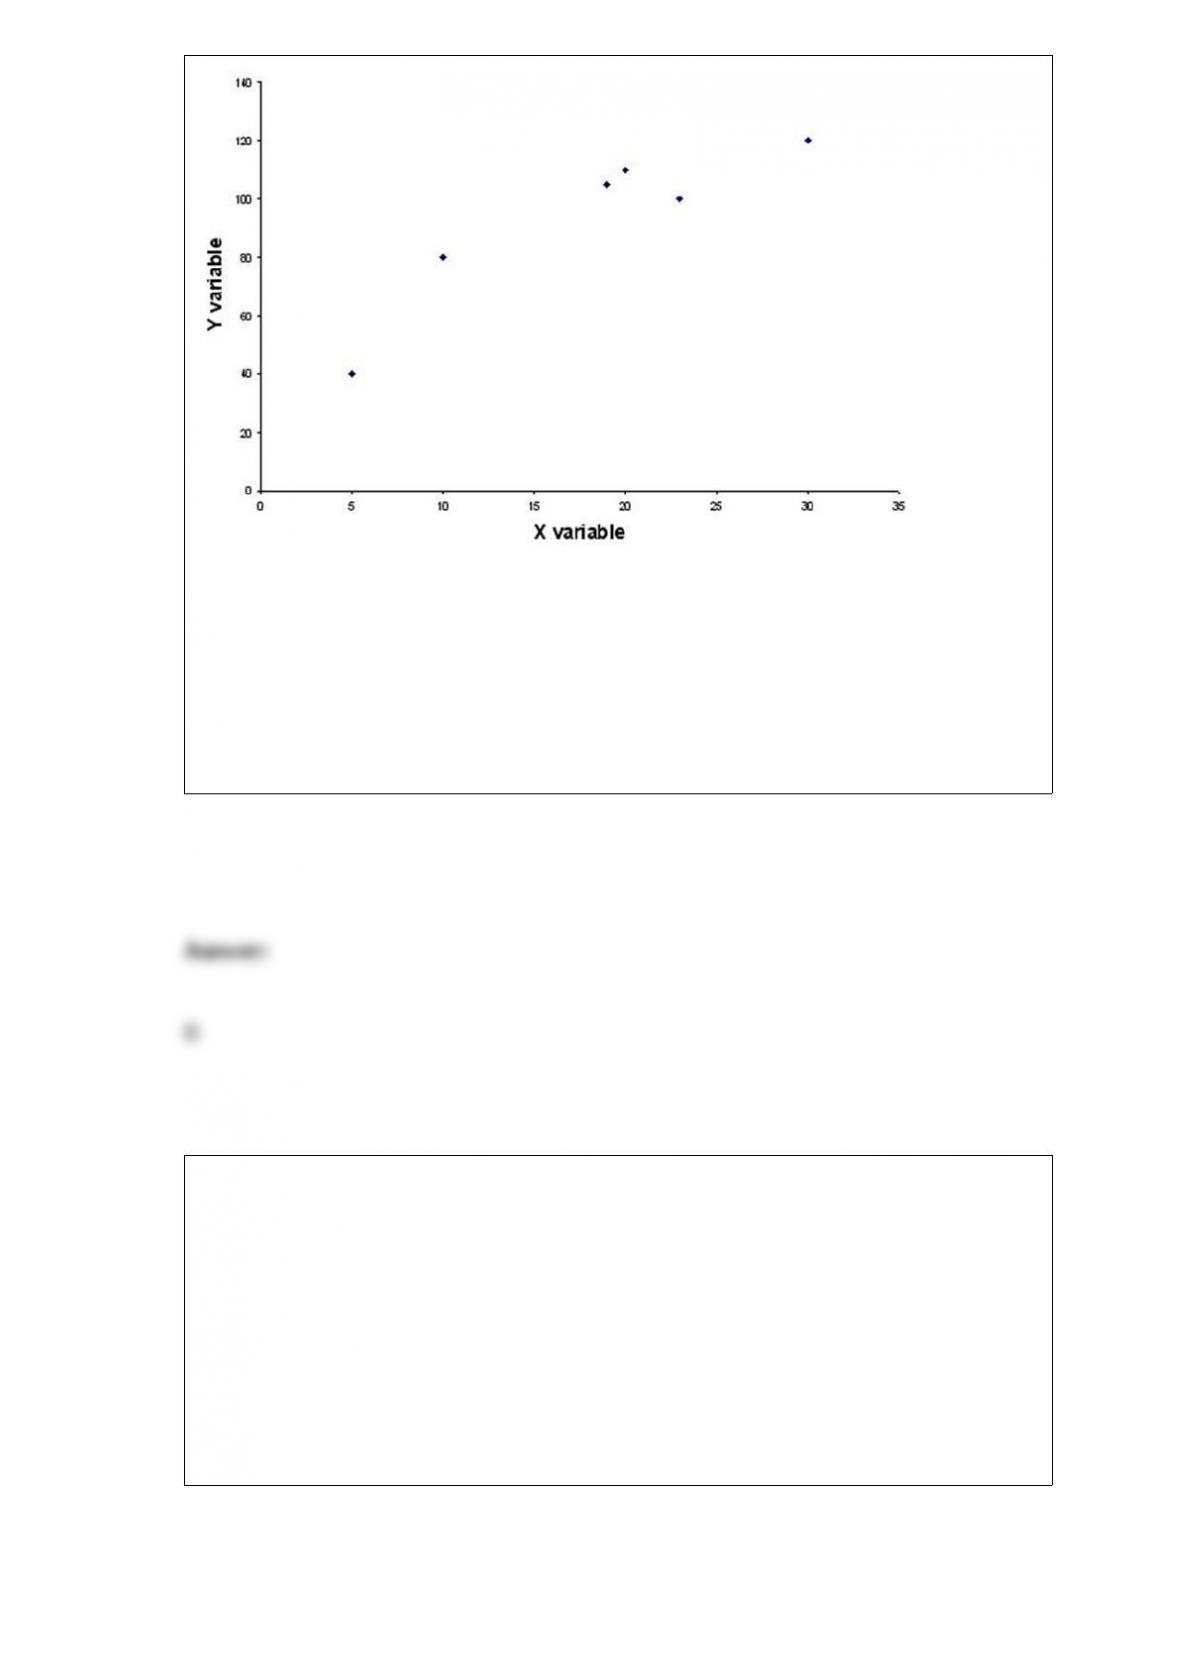
A) There is a negative linear relationship between the two variables.
B) There is a positive linear relationship between the two variables.
C) There is a perfect linear relationship between the two variables.
D) There is no apparent relationship between the two variables.
A random variable, x, has a normal distribution with μ = 13.6 and σ = 2.90. Determine a
value, x0, so that P(μ – x0 ≤ x ≤ μ + x0) = 0.95.
A) 7.916
B) 4.535
C) 3.178
D) 9.425
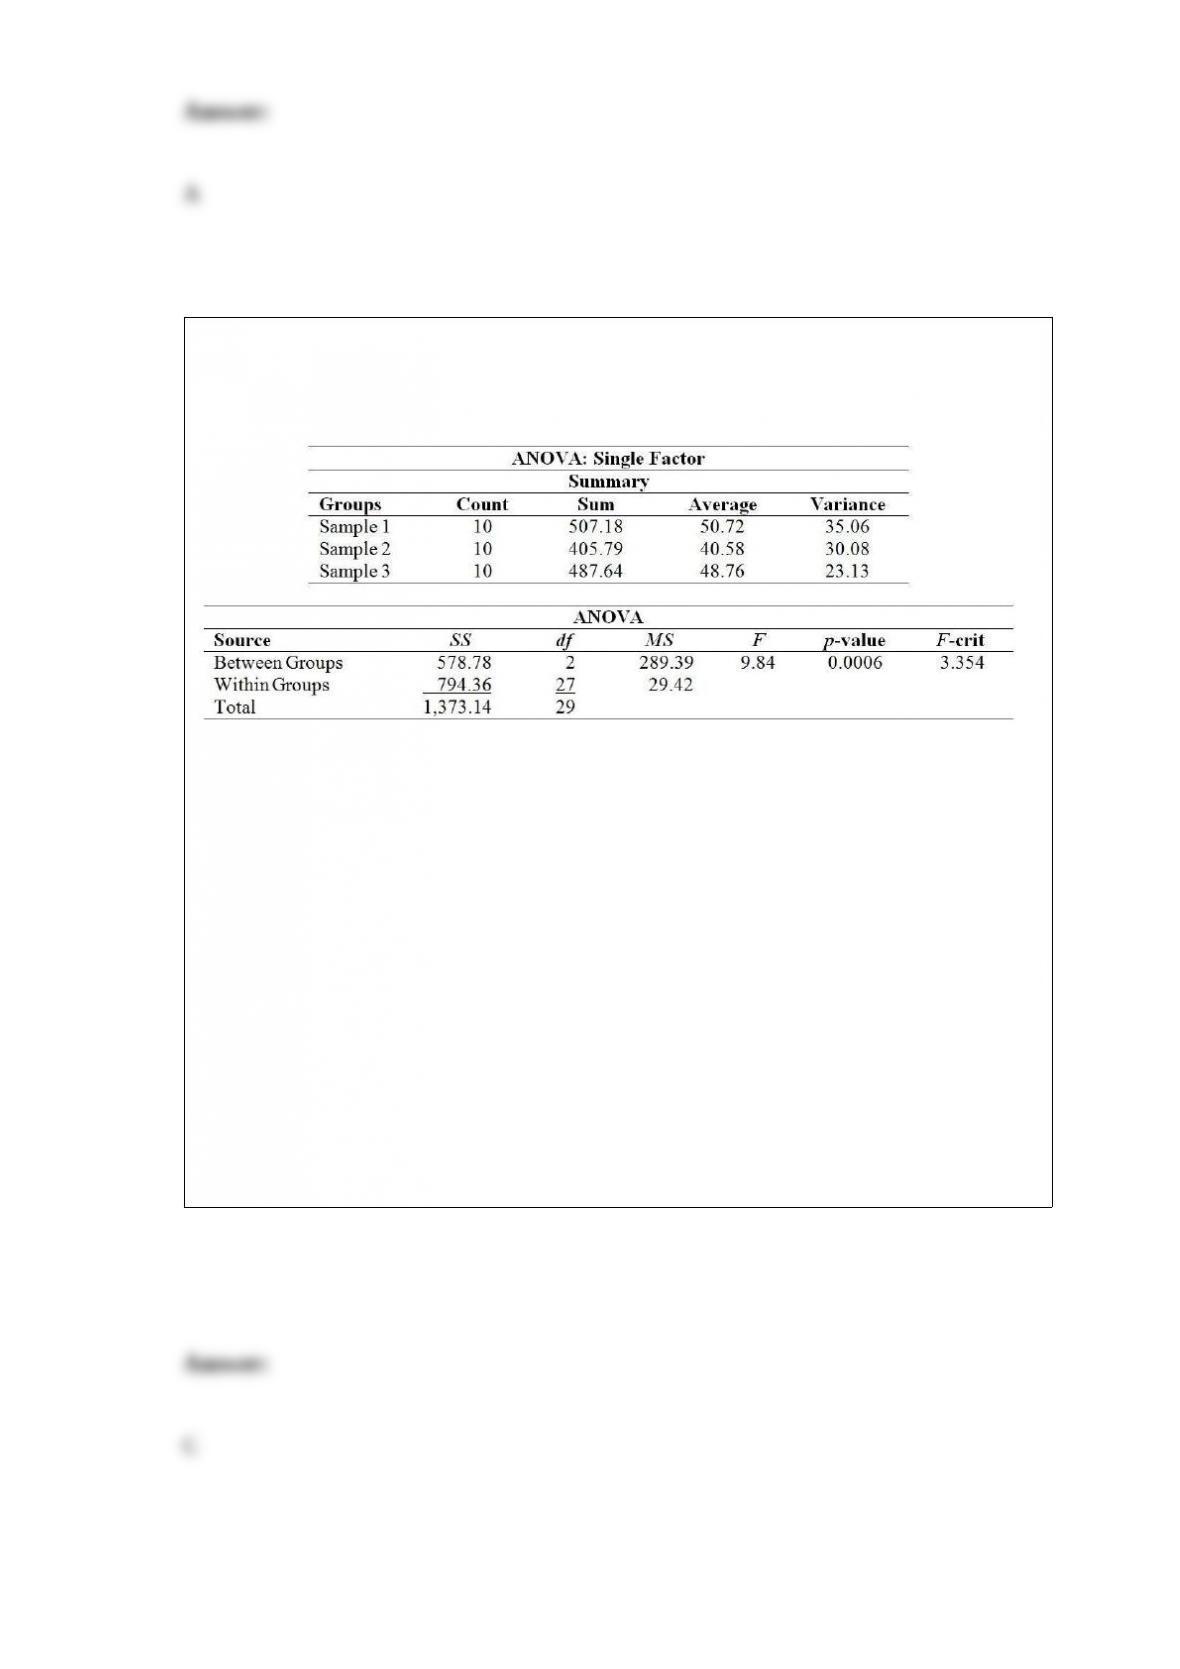
A manager is interested in testing whether three populations of interest have equal
population means. Simple random samples of size 10 were selected from each
population. The following ANOVA table and related statistics were computed:
Conduct the appropriate test of the null hypothesis assuming that the populations have
equal variances and the populations are normally distributed. Use a 0.05 level of
significance.
A) Using the F test approach, because F = 3.354 < critical F = 9.84, we reject the null
hypothesis and conclude that the population means are not all equal.
B) Using the F test approach, because F = 3.354 < critical F = 9.84, we do not reject the
null hypothesis and conclude that the population means are all equal.
C) Using the F test approach, because F = 9.84 > critical F = 3.35, we reject the null
hypothesis and conclude that the population means are not all equal.
D) Using the F test approach, because F = 9.84 > critical F = 3.35, we do not reject the
null hypothesis and conclude that the population means are all equal.
Suppose that an internal report submitted to the managers at a bank in Boston showed
that with 95 percent confidence, the proportion of the bank’s customers who also have
accounts at one or more other banks is between .45 and .51. Given this information,
what sample size was used to arrive at this estimate?
A) About 344
B) Approximately 1,066
C) Just under 700
D) Can’t be determined without more information.
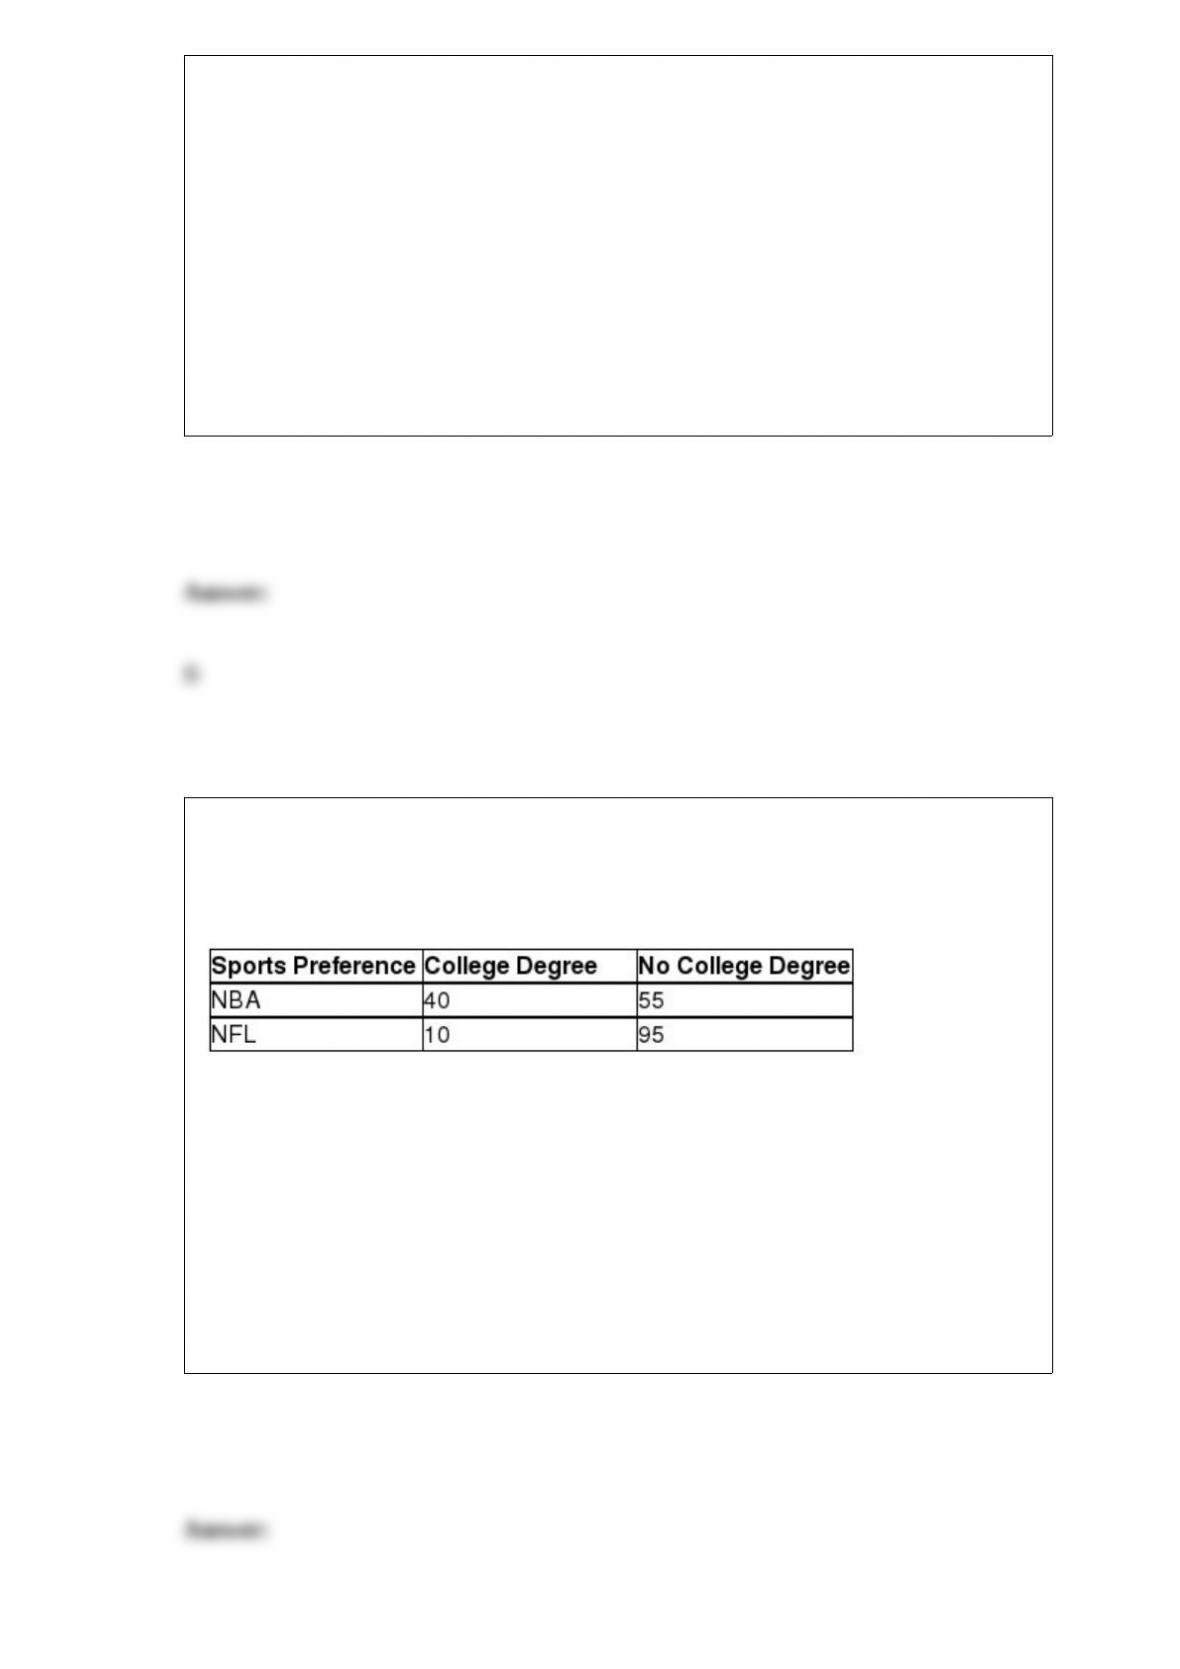
Drake Marketing and Promotions has randomly surveyed 200 men who watch
professional sports. The men were separated according to their educational level
(college degree or not) and whether they preferred the NBA or the National Football
League (NFL). The results of the survey are shown:
What is the probability that a randomly selected survey participant prefers the NFL?
A) 0.5250
B) 0.2000
C) 0.6050
D) 0.5880

A small business owner has two fast food restaurants. The owner wants to determine if
there is any difference in the variability of service times at the drive-thru window of
each restaurant. A sample of size n = 9 is taken from each restaurant’s drive-thru
window. To perform a hypothesis test using the 0.05 level of significance the critical
value is:
A) 3.438
B) 3.197
C) 4.026
D) 4.433
Most companies that make golf balls and golf clubs use a one-armed robot named “Iron
Byron” to test their balls for length and accuracy, but because of swing variations by
real golfers, these test robots don’t always indicate how the clubs will perform in actual
use. One company in the golfing industry is interested in testing its new driver to see
how it compares with the best-selling driver. To do this, it has selected a group of
golfers of differing abilities and ages. Its plan is to have each player use each of the two
clubs and hit five balls. It will record the average length of the drives with each club for
each player. Given this description of the planned test, which of the following
statements is true?
A) The test won’t be meaningful if only five balls are hit by each player with each club.
B) The samples in this case are called paired samples since the same players are hitting
both golf clubs.
C) The test will be invalid unless different players are used to hit each club so that the
samples will be independent.
D) The samples are independent because each player is independent of the other
players.

A small city has two taxi companies (A and B). Each taxi company has 5 taxis. A motel
has told these companies that they will randomly select a taxi company when one of its
customers needs a cab. This morning 3 cabs were needed. Assuming that no one
individual taxi can be used more than once, what is the probability that 2 of the cabs
selected will be from Company A and the other will be from B?
A) 0.417
B) 0.25
C) 0.583
D) 0.5
Which of the following statements is true?
A) The decision maker controls the probability of making a Type I statistical error.
B) Alpha represents the probability of making a Type II error.
C) Alpha and beta are directly related such that when one is increased the other will
increase also.
D) The alternative hypothesis should contain the equality.
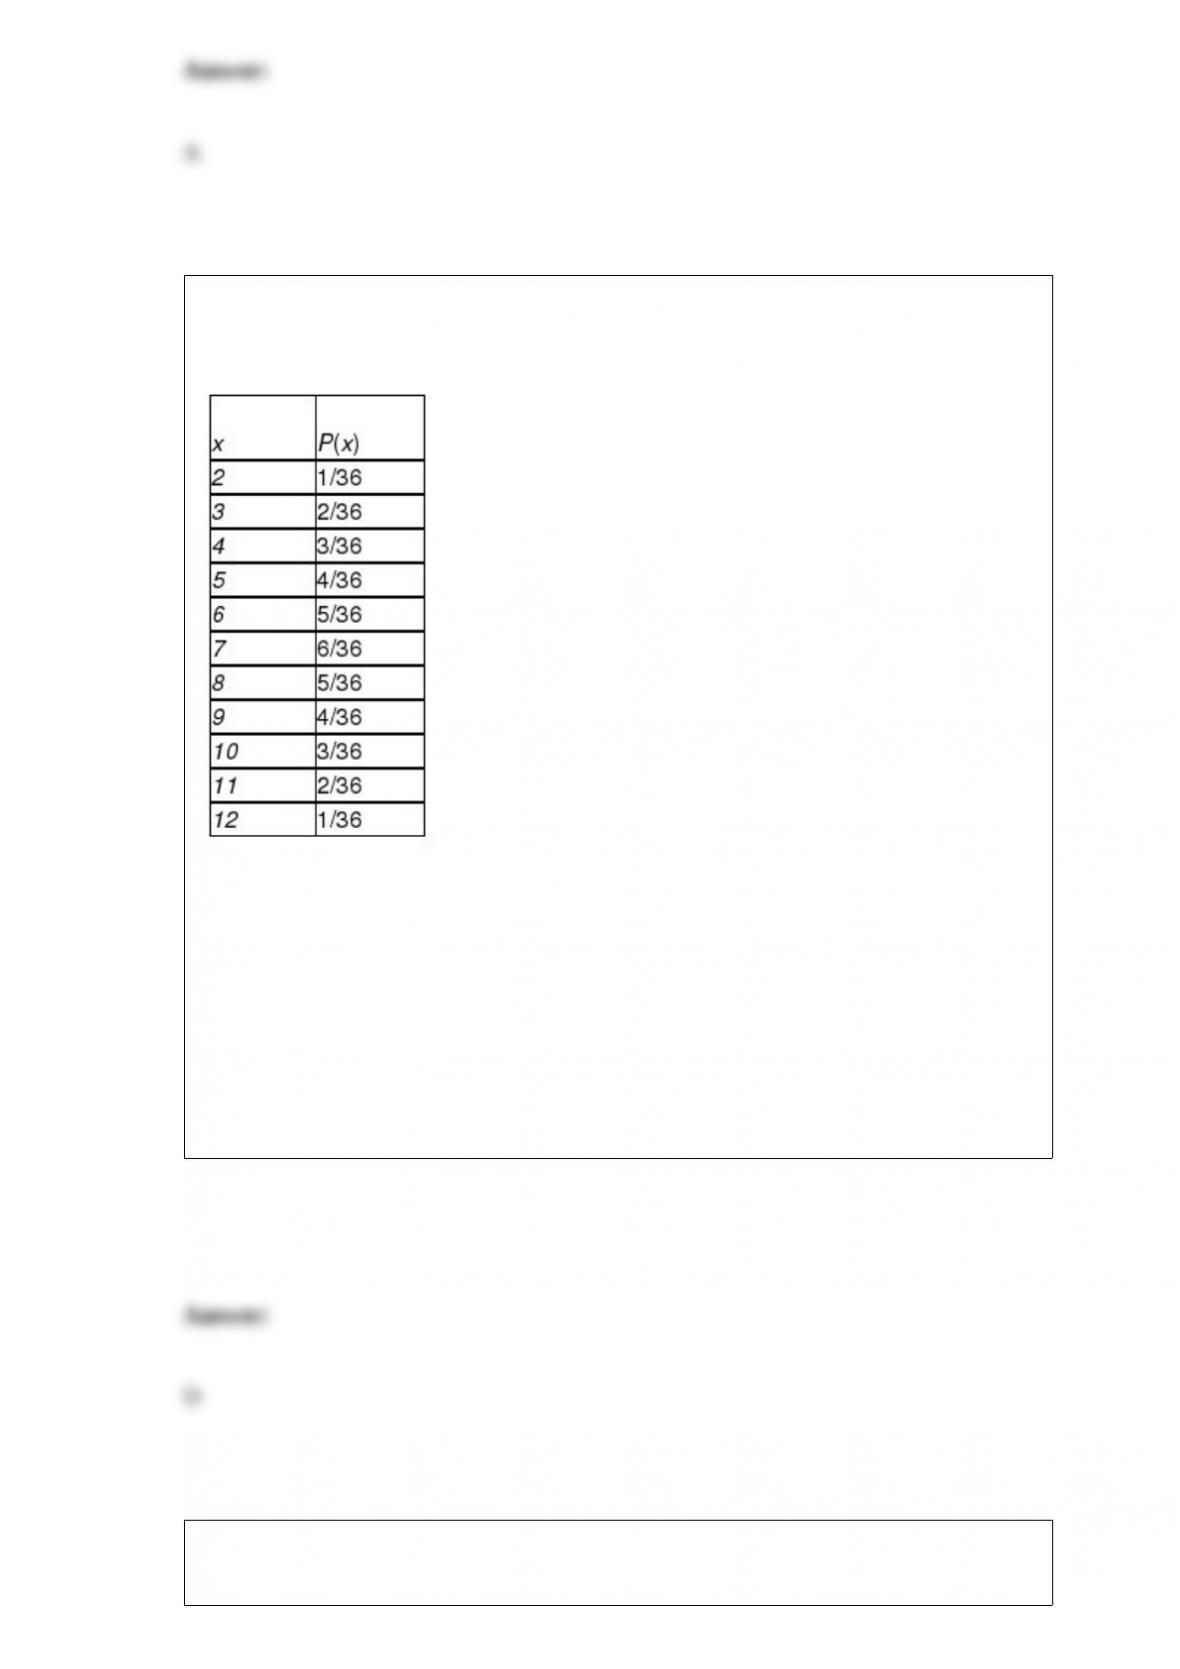
The roll of a pair of dice has the following probability distribution, where the random
variable is the sum of the values produced by each die:
Calculate the standard deviation of x.
A) 3.415
B) 2.333
C) 3.125
D) 2.415
An advertising company wishes to estimate the mean household income for all single
working professionals who own a foreign automobile. If the advertising company wants

a 90% confidence interval estimate with a margin of error of $2,500, what sample size
is needed if the population standard deviation is known to be $27,500?
A) 156
B) 328
C) 251
D) 415
A distributor of outdoor yard lights has four suppliers. This past season she purchased
40% of the lights from Franklin Lighting, 30% from Wilson & Sons, 20% from
Evergreen Supply, and the rest from A. L. Scott. In prior years, 3% of Franklin’s lights
were defective, 6% of the Wilson lights were defective, 2% of Evergreen’s were
defective, and 8% of the Scott lights were defective. When the lights arrive at the
distributor, she puts them in inventory without identifying the supplier. Suppose that a
defective light string has been pulled from inventory; what is the probability that it was
supplied by Franklin Lighting?
A) 0.33
B) 0.45
C) 0.18
D) 0.29
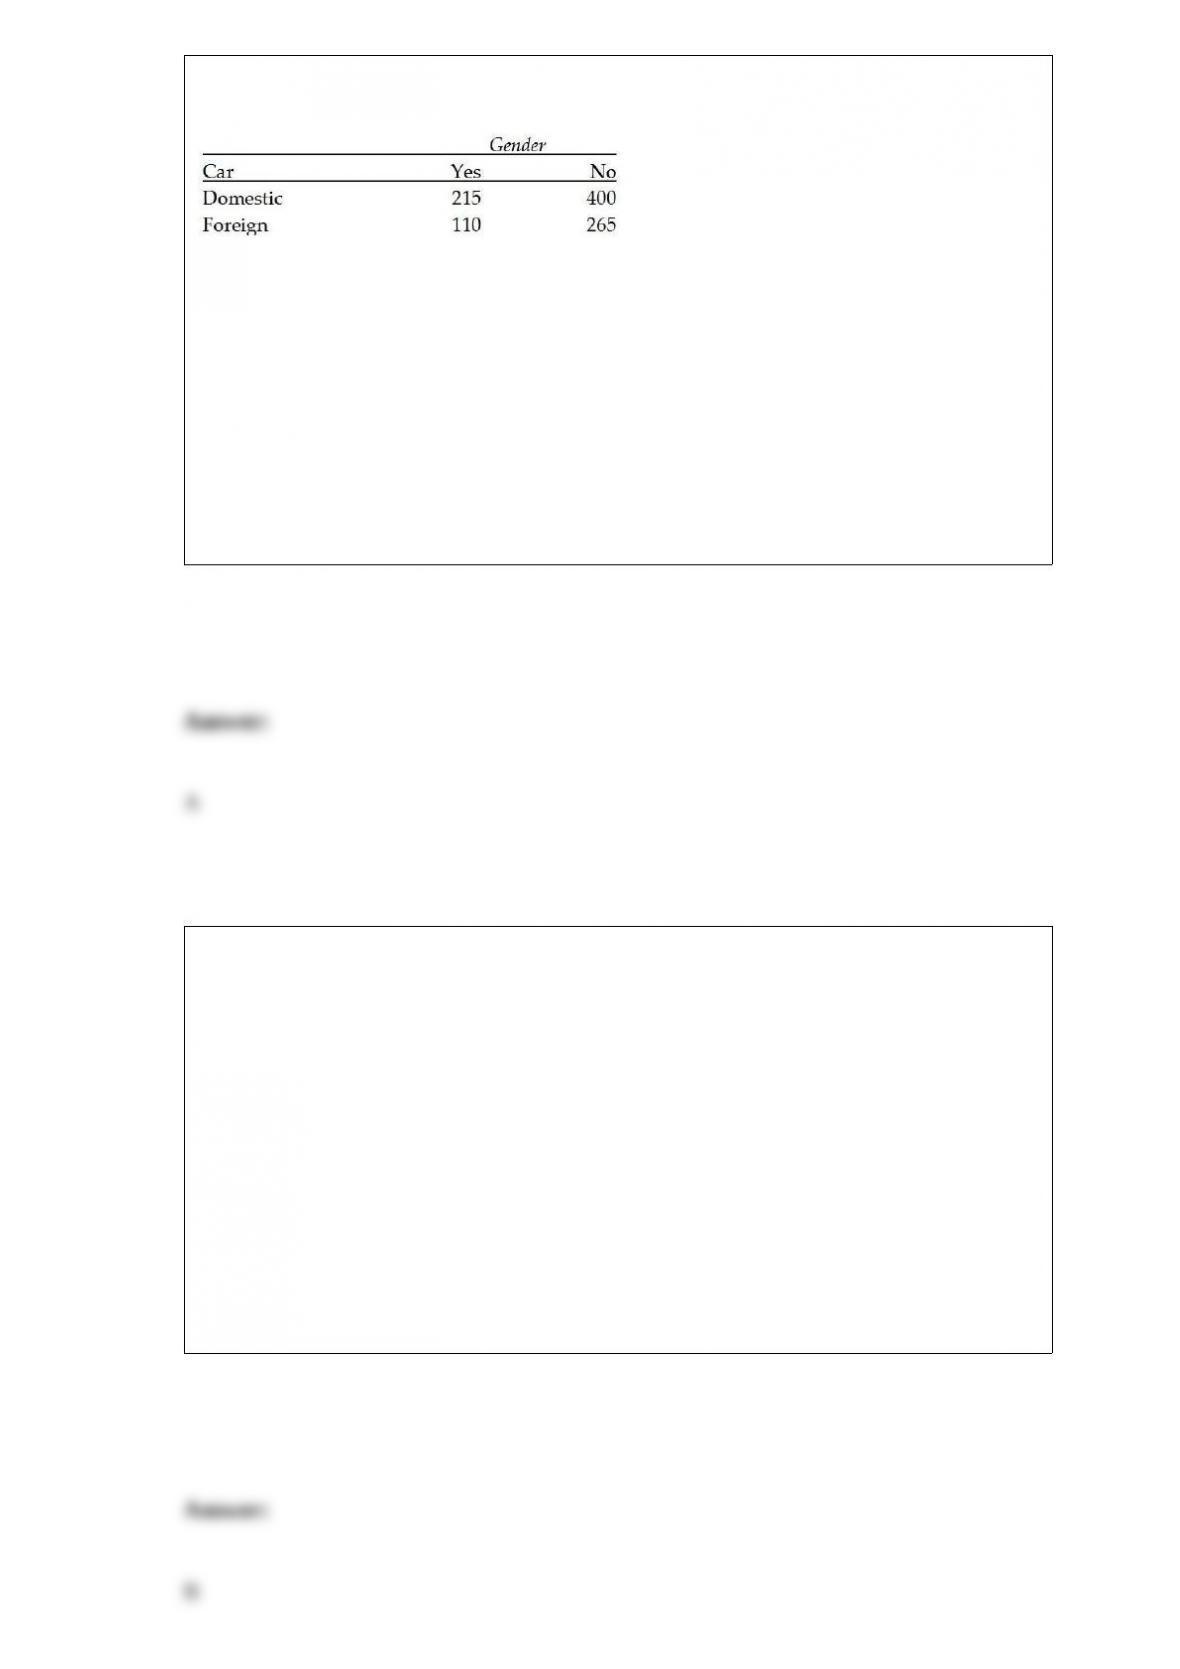
We want to test whether type of car owned (domestic or foreign) is independent of
gender. A contingence table is obtained from a sample of 990 people as
At alpha = 0.05 level, we conclude that:
A) x2= 3.34 and type of car owned is independent of gender.
B) x2 = 3.34 and type of car owned is dependent of gender.
C) x2 = 3.84 and type of car owned is independent of gender.
D) x2 = 3.84 and type of car owned is dependent of gender.
When someone is on trial for suspicion of committing a crime, the hypotheses are:
H0 : innocent
HA : guilty
Which of the following is correct?
A) Type I error is acquitting a guilty person.
B) Type I error is convicting an innocent person.
C) Type II error is acquitting an innocent person.
D) Type II error is convicting an innocent person.

Which of the following would be an appropriate null hypothesis?
A) The mean of a population is equal to 55.
B) The mean of a sample is equal to 55.
C) The mean of a population is greater than 55.
D) The mean of a sample is greater than 55.
Which of the following will result in a larger margin of error in an application involving
the estimation of a population mean?
A) Increasing the sample size
B) Decreasing the confidence level
C) Increasing the sample standard deviation
D) All of the above
Consider the following:
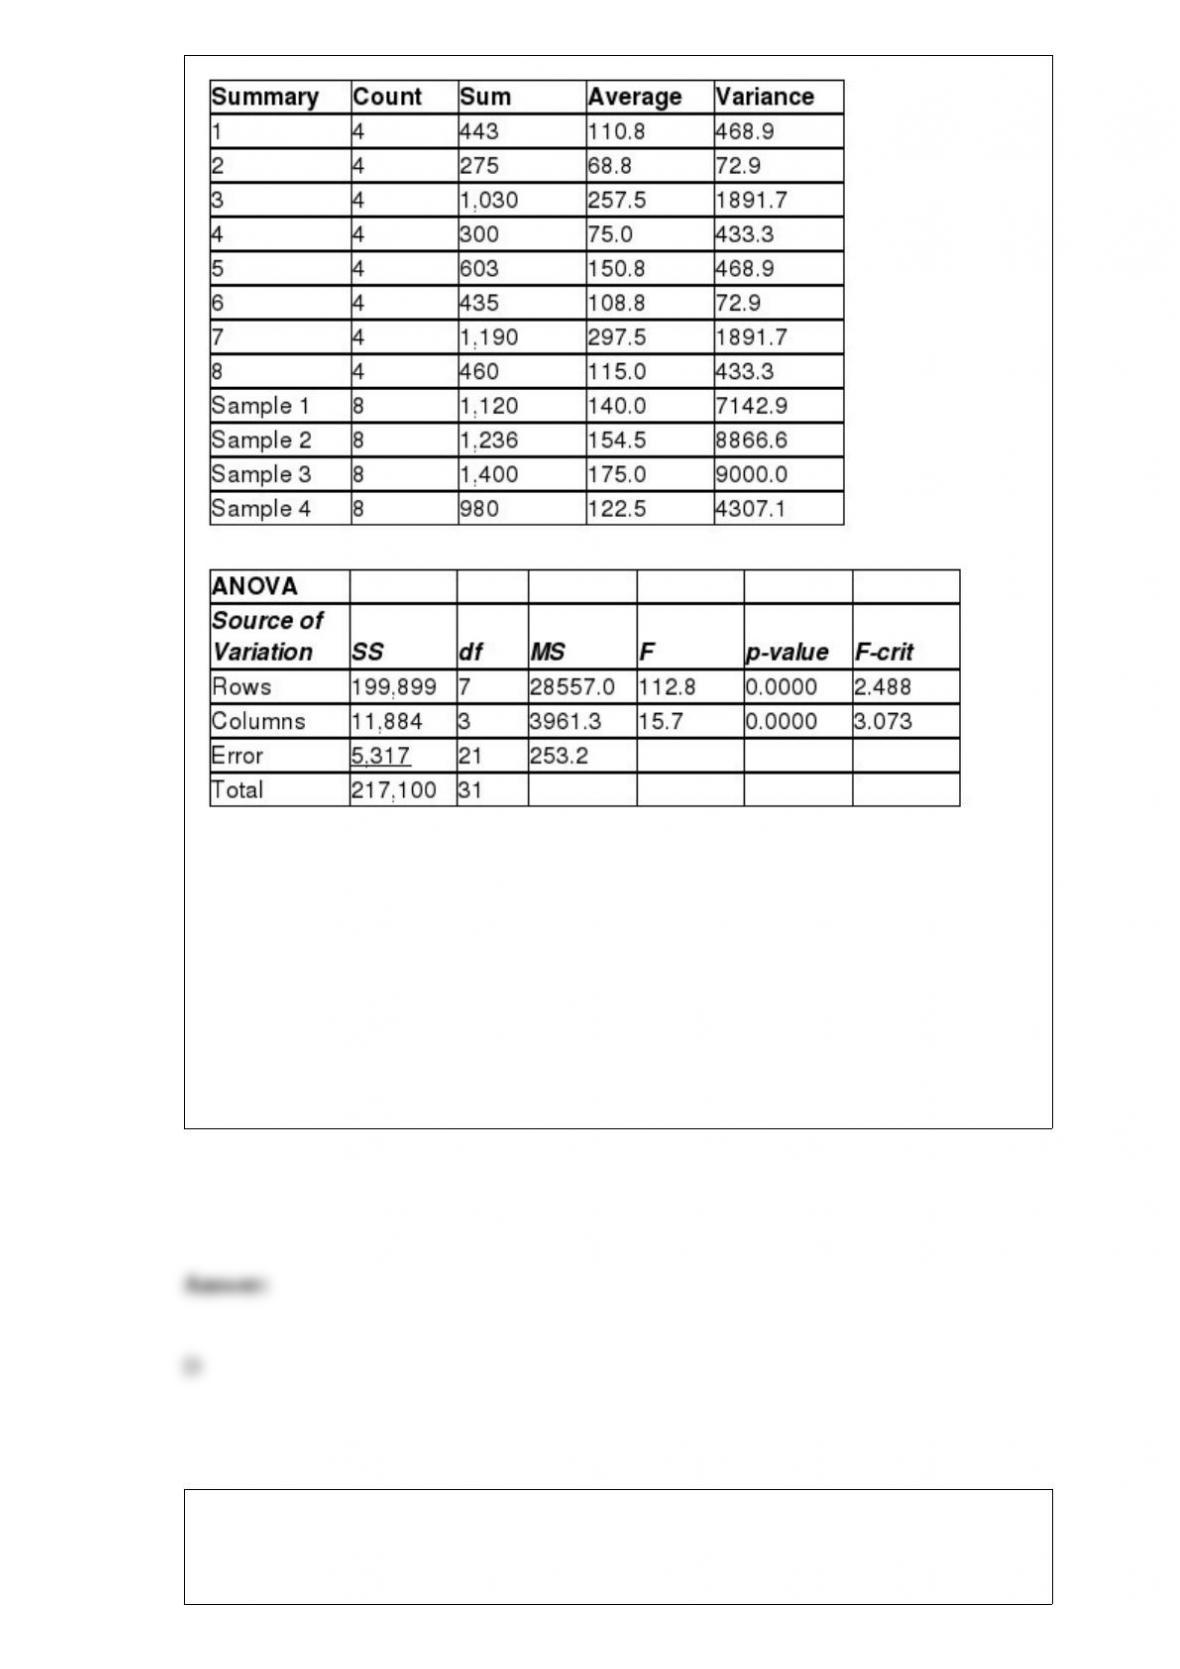
How many blocks were used in this study?
A) 10
B) 9
C) 7
D) 8
The city counsel has just voted to pass the city’s budget for next year. If you were
writing a report describing the budget so the citizens could understand how the total tax
dollars will be spent, which of the following graphs might be most appropriate?

A) Pie chart
B) Scatter diagram
C) Histogram
D) Ogive
If the population correlation between two variables is determined to be -0.70, which of
the following is known to be true?
A) There is a positive linear relationship between the two variables.
B) There is a fairly strong negative linear relationship between the two variables.
C) An increase in one of the variables will cause the other variable to decline by 70
percent.
D) The scatter diagram for the two variables will be upward sloping from left to right.
The manager of a computer help desk operation has collected enough data to conclude
that the distribution of time per call is normally distributed with a mean equal to 8.21
minutes and a standard deviation of 2.14 minutes. What is the probability that three
randomly monitored calls will each be completed in 4 minutes or less?
A) 0.4756

B) Approximately 0.1076
C) About 0.00001
D) Can’t be determined without more information.
In a standard normal distribution, the probability that z is greater than 0 is:
A) 0.5
B) equal to 1
C) at least 0.5
D) 1.96
In a local community there are three grocery chain stores. The three have been carrying
out a spirited advertising campaign in which each claims to have the lowest prices. A
local news station recently sent a reporter to the three stores to check prices on several
items. She found that for certain items each store had the lowest price. This survey
didn’t really answer the question for consumers. Thus, the station set up a test in which
20 shoppers were given different lists of grocery items and were sent to each of the
three chain stores. The sales receipts from each of the three stores are recorded in the
data file Groceries.
Based on the sample data, which store has the highest average prices? Use Fisher’s LSD

test if appropriate.
A) Store 1
B) Store 2
C) Store 3
D) There is no difference between the average prices.
If an economist wishes to determine whether there is evidence that average family
income in a community exceeds $25,000. The best null hypothesis is:
A) μ = 25,000.
B) μ > 25,000.
C) μ ≤ 25,000.
D) μ ≥ 25,000.
The editors of a national automotive magazine recently studied 30 different automobiles
sold in the United States with the intent of seeing whether they could develop a multiple
regression model to explain the variation in highway miles per gallon. A number of
different independent variables were collected. The following regression output is the
result of using a forward selection stepwise regression approach.
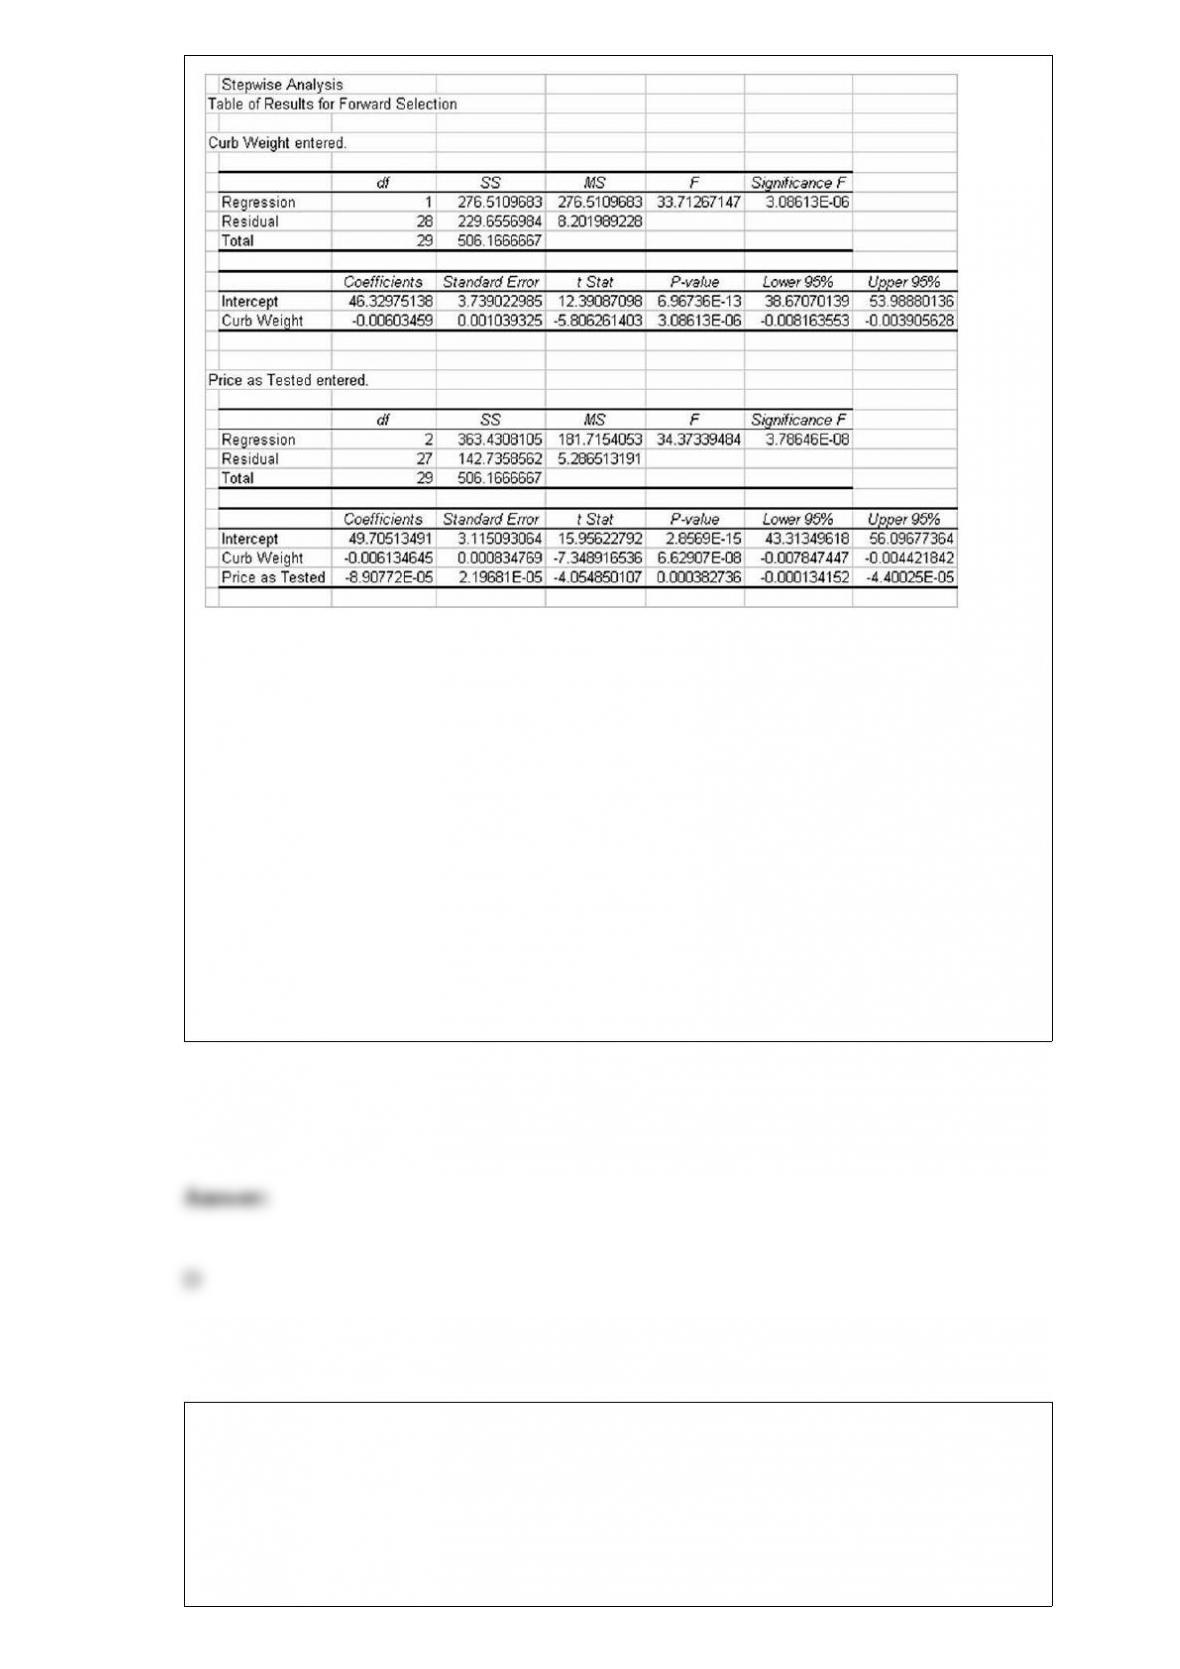
Which of the following might explain why no other independent variables entered the
model?
A) No other variable had a correlation with the dependent variable that was close to 1.0.
B) None of the remaining variables had a positive correlation with y.
C) The remaining variables must be nearly perfectly correlated with the two variables
already in the model.
D) Given the two variables already in the model, none of the others could add
significantly to the percentage of variation in the y variable that would be explained by
the model.
Arrivals to a bank automated teller machine (ATM) are distributed according to a
Poisson distribution with a mean equal to three per 15 minutes.
What is the probability that fewer than four customers will arrive in a 30-minute
segment?
A) 0.1512
B) 0.1889
C) 0.2515
D) 0.2576
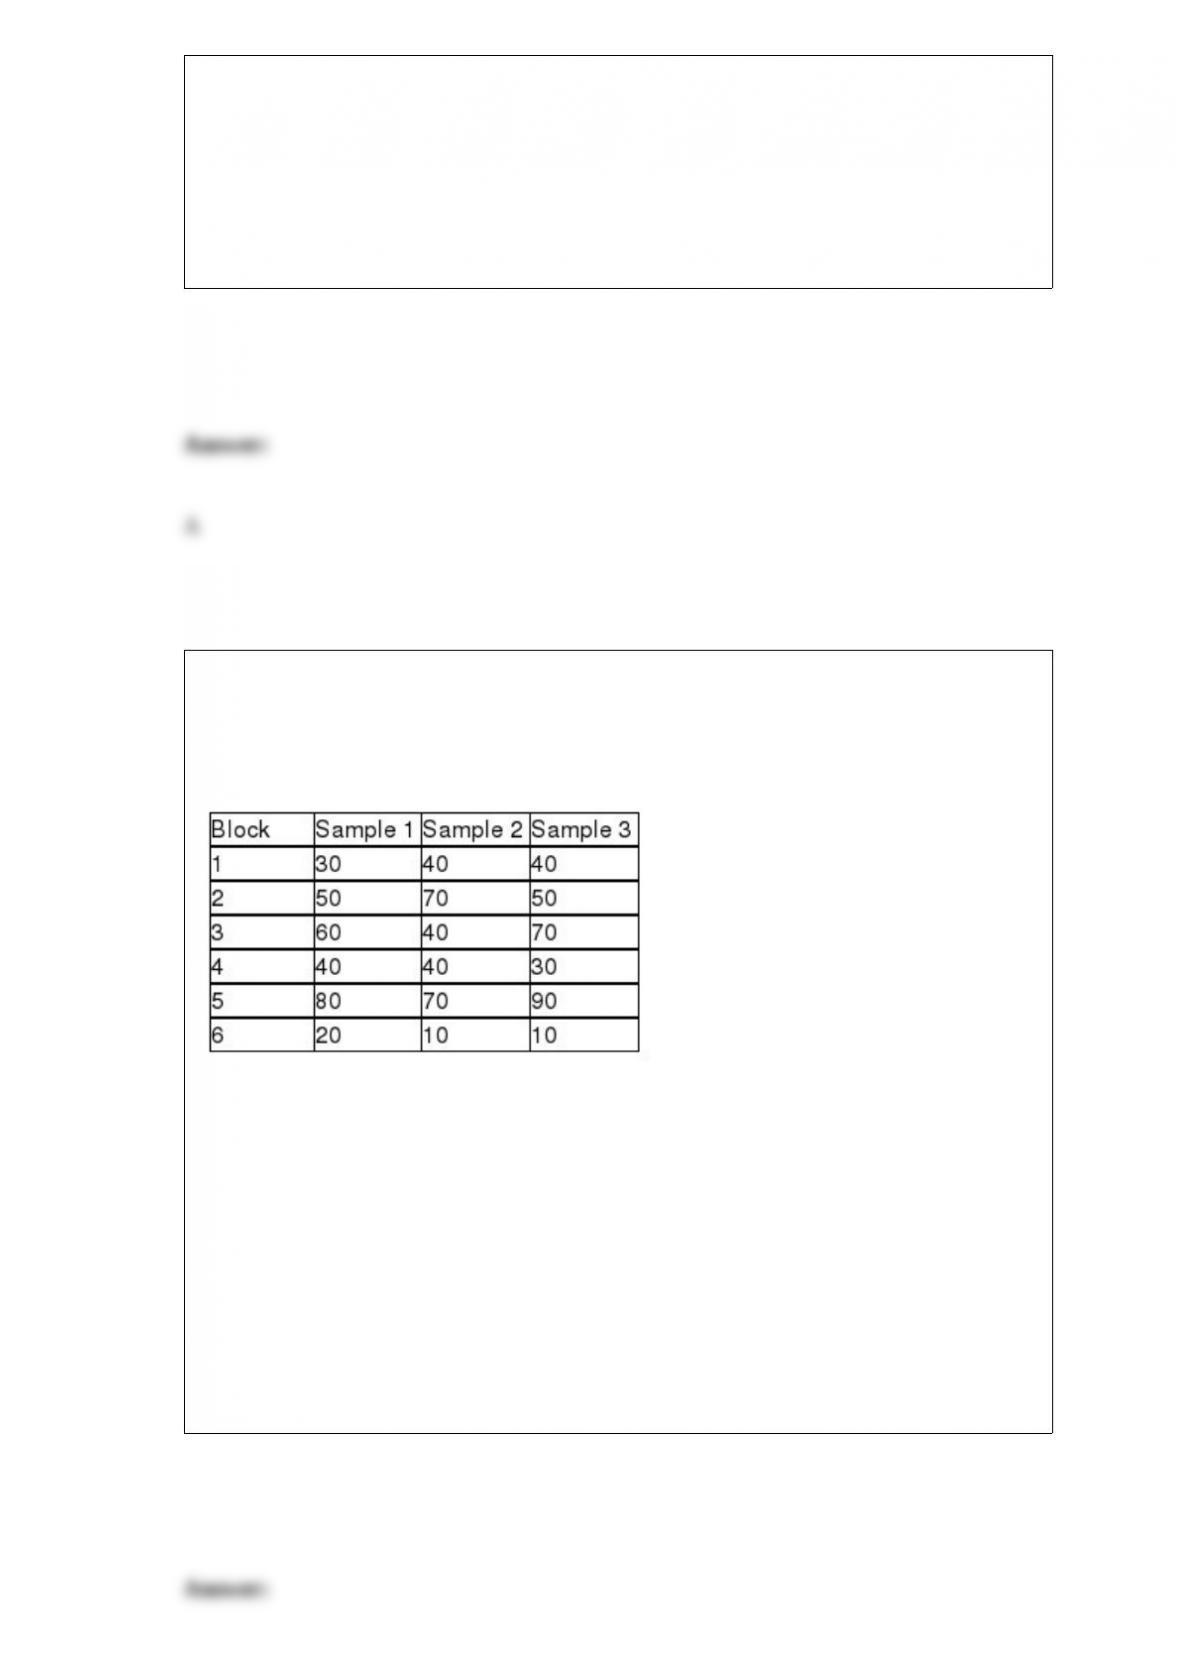
The following sample data were recently collected in the course of conducting a
randomized block analysis of variance. Based on these sample data, what conclusions
should be reached about blocking effectiveness and about the means of the three
populations involved? Test using a significance level equal to 0.05.
A) Because F = 0.4195 < critical F = 4.103, we do not reject the null hypothesis and
conclude that the three populations may have the same mean value.
B) Because F = 0.4195 < critical F = 4.103, we reject the null hypothesis and conclude
that the three populations do not have the same mean value.
C) Because F = 0.1515 < critical F = 4.103, we do not reject the null hypothesis and
conclude that the three populations may have the same mean value.
D) Because F = 0.1515 < critical F = 4.103, we reject the null hypothesis and conclude
that the three populations do not have the same mean value.

Which of the following types of questions provide the respondent with the greatest
choice in responding to a question?
A) Open-end questions
B) Close-end questions
C) Multiple choice questions
D) True/false questions
A package delivery service claims that no more than 5 percent of all packages arrive at
the address late. Assuming that the conditions for the binomial hold, if a sample of size
10 packages is randomly selected and the 5 percent rate holds, what is the probability
that more than 2 packages will be delivered late?
A) 0.0115
B) 0.0105
C) 0.0862
D) 0.0746

Nominal data is the highest level of data.
Residual analysis is conducted to check whether regression assumptions are met. Which
of the following is not an assumption made in simple linear regression?
A) Errors are independent of each other.
B) Errors are normally distributed.
C) Errors are linearly related to x.
D) Errors have constant variance.
In discussing a confidence interval estimate for a population mean, is it acceptable to
provide an interpretation like the following: “There is a 95 percent chance that μ lies in
the range 20 to 40″?
Explain why a relative frequency histogram is sometimes preferable to a regular
frequency histogram.
Discuss the steps involved in developing and carrying out a written survey.
Explain what is meant by interaction between two factors in a two-way analysis of
variance study.
Explain how to determine whether the binomial distribution can be used in a particular
application.
In comparing a uniform distribution with a normal distribution where both distributions
have the same mean and the same range, explain which distribution will have the larger
standard deviation.
Explain what is meant by the term mutually exclusive events. Cite an example.
Explain the basic logic behind the chi-square goodness-of-fit test.
What are the advantages and disadvantages of open-end questions in either a written
survey or a personal interview?
A small city has 2 ambulances. Emergency calls for ambulances arrive randomly with
an average of 0.2 calls per hour. They are concerned about the possibility of both
ambulances being busy when an additional call comes in. What is the probability of
more than 2 calls in a 1-hour period? Determine the correct distribution, explain why it
is the best distribution to use, and find the probability.
What factors are of importance to an analyst when linear regression analysis is used for
descriptive purposes?
What is meant by the concept, standardizing the data? Explain why a decision maker
may wish to compute a standardized value.
A major U.S. oil company has developed two blends of gasoline. Managers are
interested in determining whether a difference in mean gasoline mileage will be
obtained from using the two blends. As part of their study, they have decided to run a
test using the Chevrolet Impala automobile with automatic transmissions. They selected
a random sample of 100 Impalas using Blend 1 and another 100 Impalas using Blend 2.
Each car was first emptied of all the gasoline in its tank and then filled with the
designated blend of the new gasoline. The car was then driven 200 miles on a specified
route involving both city and highway roads. The cars were then filled and the actual
miles per gallon were recorded. The following summary data were recorded:
Blend 1 Blend 2
Sample Size 100 100
Sample Mean 23.4 mpg 25.7 mpg
Sample St. Dev. 4.0 mpg 4.2 mpg
Based on the sample data, using a 0.05 level of significance, what conclusion should the
company reach about whether the population mean mpg is the same or different for the
two blends? Use the test statistic approach to test the null hypothesis.
Explain what the correlation coefficient measures and some detail of the key issues
associated with it. Be sure to also discuss the concept of spurious correlation.
The weight of sacks of potatoes is normally distributed with a mean of 20 pounds and a
standard deviation of 2 pounds. The weight of sacks of onions is also normally
distributed with a mean of 20 pounds and a standard deviation of 0.50 pounds. Based on
this information, which product will yield the highest probability of getting a very
heavy sack?
What is the difference between a normal distribution and the standard normal
distribution?