If two variables are spuriously correlated, it means that the correlation coefficient
between them is near zero.
If the correlation coefficient for two variables is computed to be a -0.70, the scatter plot
will show the data to be downward sloping from left to right.
A scatter diagram can show whether a pair of variables has a strong or weak
relationship, and also whether it is linear or curved.
A dummy variable is a dependent variable whose value is set at either zero or one.

When using the Histogram tool in Excel to construct a frequency distribution and
histogram, if the first bin value is 10 and the second bin value is 20, the frequency count
for the second class will include all values from 10 up to, but not including, 20.
Suppose a player is dealt 2 cards from a standard deck of 52 playing cards. To
determine the probability of having a blackjack would involve classical probability.
When σ is unknown, one should use an estimate that is considered to be at least as large
as the true σ. This will provide a conservative sample size to be on the safe side.
If after graphing the data for a quantitative variable of interest, you notice that the
distribution is highly skewed in the positive direction, the measure of central location
that would likely provide the best assessment of the center would be the median.
When a battery company claims that their batteries last longer than 100 hours and a
consumer group wants to test this claim, the hypotheses should be:
H0: μ ≤ 100
HA : μ > 100
The procurement manager for a large company wishes to estimate the proportion of
parts from a supplier that are defective. She has selected a random sample of n = 200
incoming parts and has found 11 to be defective. Based on a 95 percent confidence
level, the upper and lower limits for the confidence interval estimate are approximately
0.0234 to 0.0866.
The population of incomes in a particular community is thought to be highly
right-skewed with a mean equal to $36,789 and a standard deviation equal to $2,490.
Based on this, if a sample of size n = 36 is selected, the highest sample mean that we
would expect to see would be approximately $38,034.
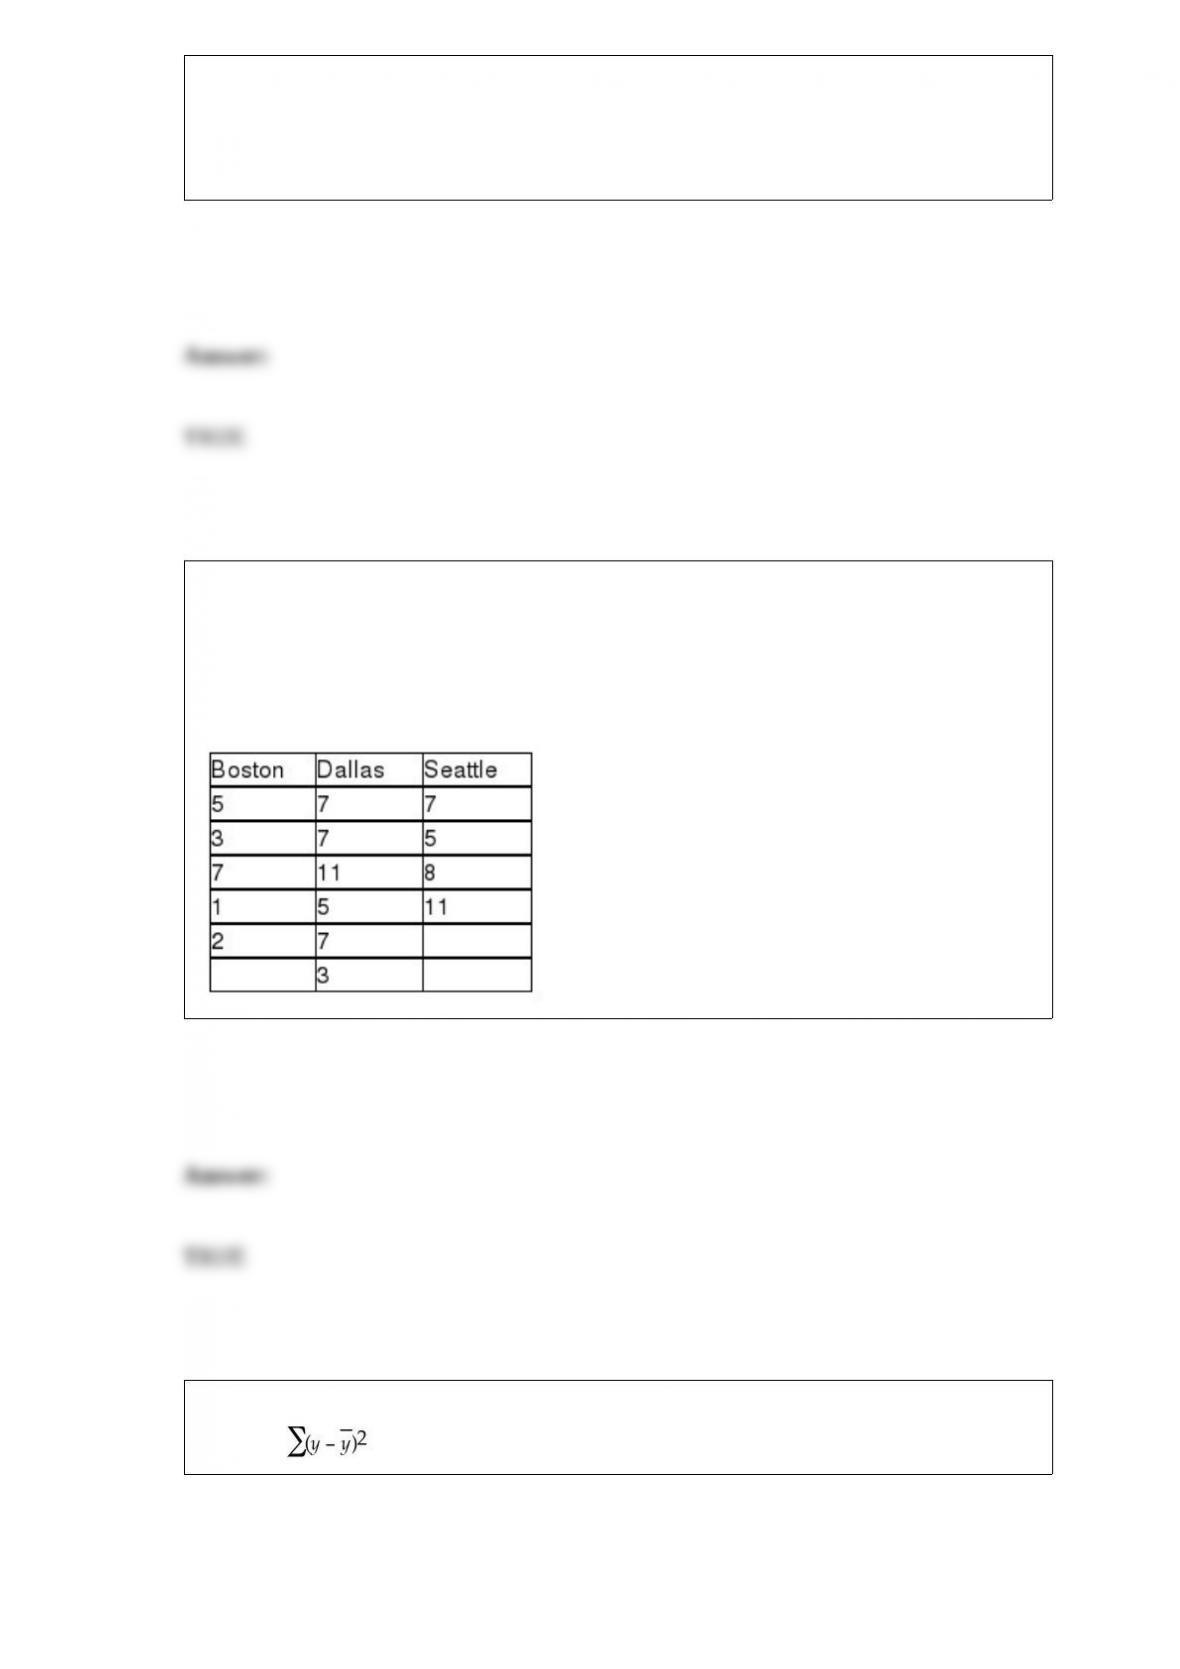
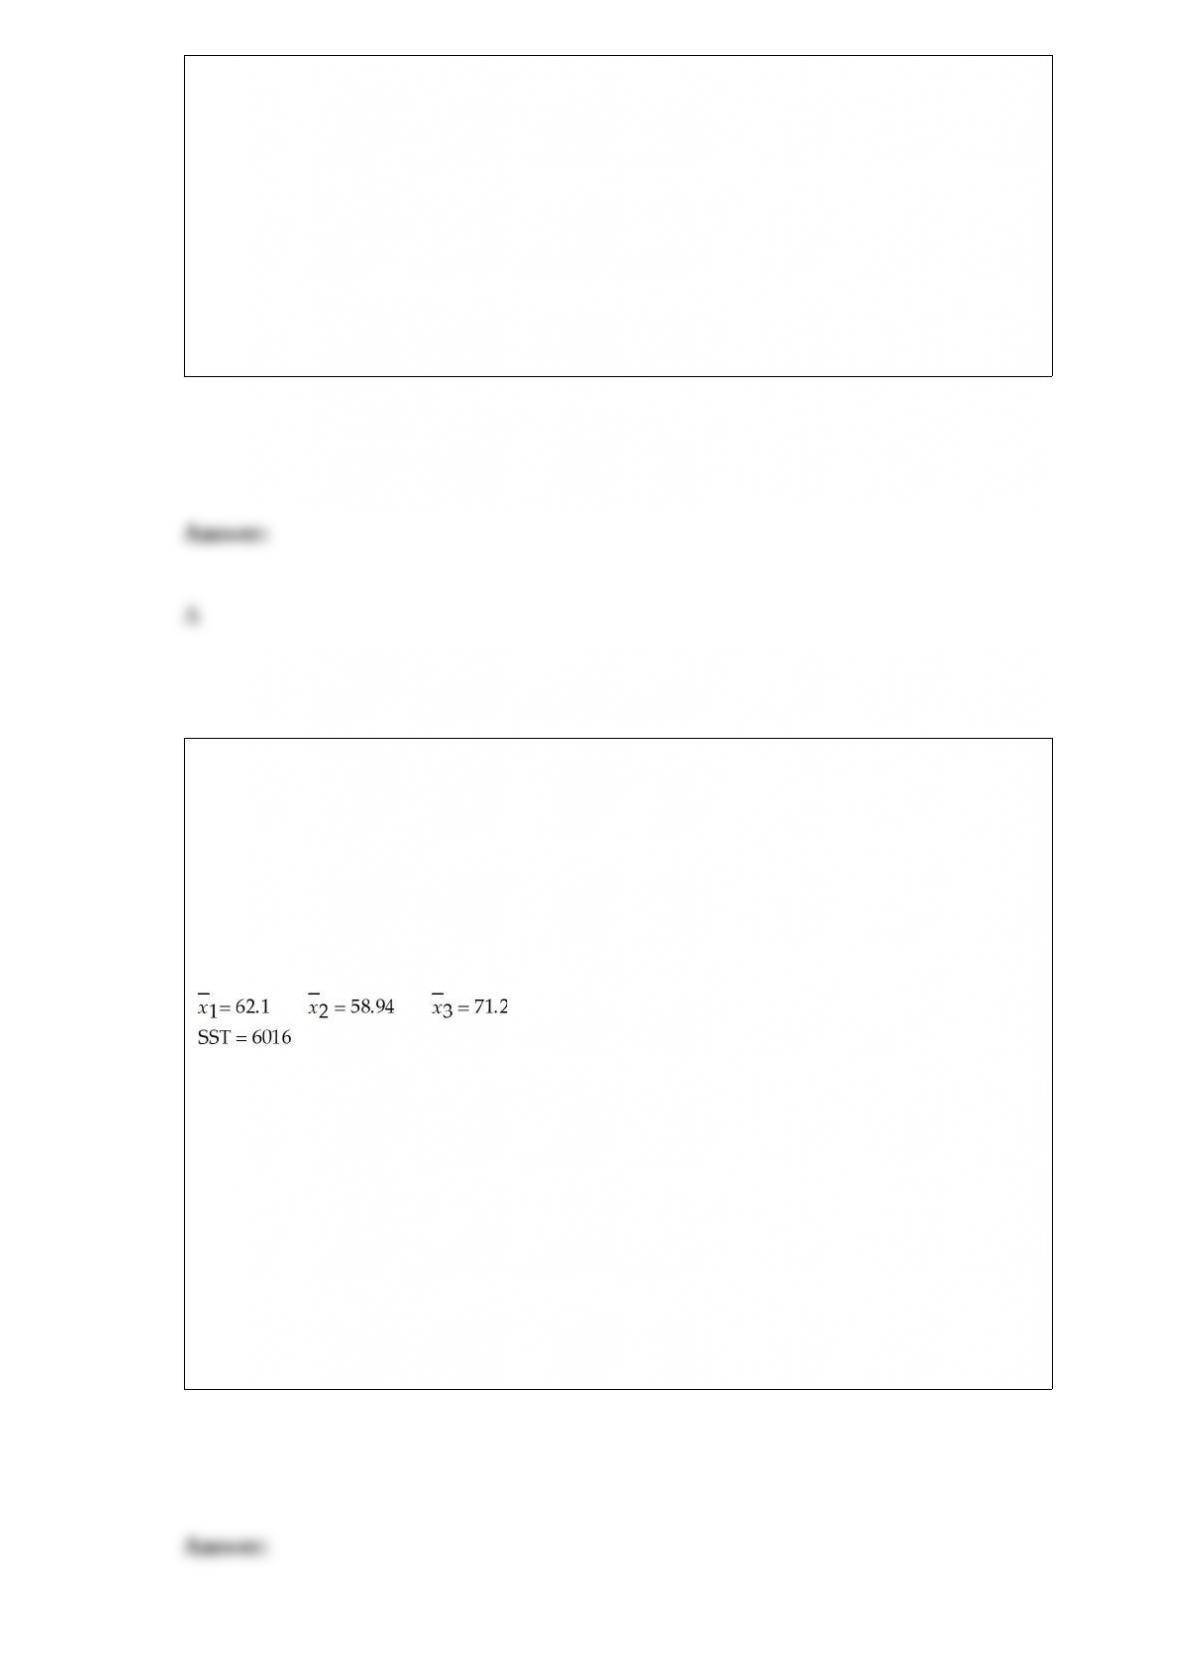
A national car rental agency is interested in determining whether the mean days that
customers rent cars is the same between three of its major cities. The following data
reflect the number of days people rented a car for a sample of people in each of three
cities. Assuming that a one-way analysis of variance is to be performed, the value of the
test statistic is approximately F = 3.4.
In a multiple regression model, the regression coefficients are calculated such that the
quantity, , is minimized.

A local medical center has advertised that the mean wait for services will be less than
15 minutes. Given this claim, the hypothesis test for the population mean should be a
one-tailed test with the rejection region in the lower (left-hand) tail of the sampling
distribution.
In a goodness-of-fit test, when the null hypothesis is true, the expected value for the
chi-square test statistic is zero.
In situations involving two or more variables, both histograms and bar charts can be
used for multiple variables on the same graph.

You are given the following linear trend model: Ft = 345.60 – 200.5(t). The forecast for
period 15 is approximately -2,662.
When regression analysis is used for descriptive purposes, two of the main items of
interest are whether the sign on the regression slope coefficient is positive or negative
and whether the regression slope coefficient is significantly different from zero.
Stepwise selection will always find the best regression model.
In comparing two populations using paired differences, after the difference is found for
each pair, the method for testing whether the mean difference is equal to 0 becomes the
same as was used for a one-sample hypothesis test with unknown standard deviation.
The standard error of the estimate is a term that is used for the standard deviation of the
residuals in a multiple regression model.
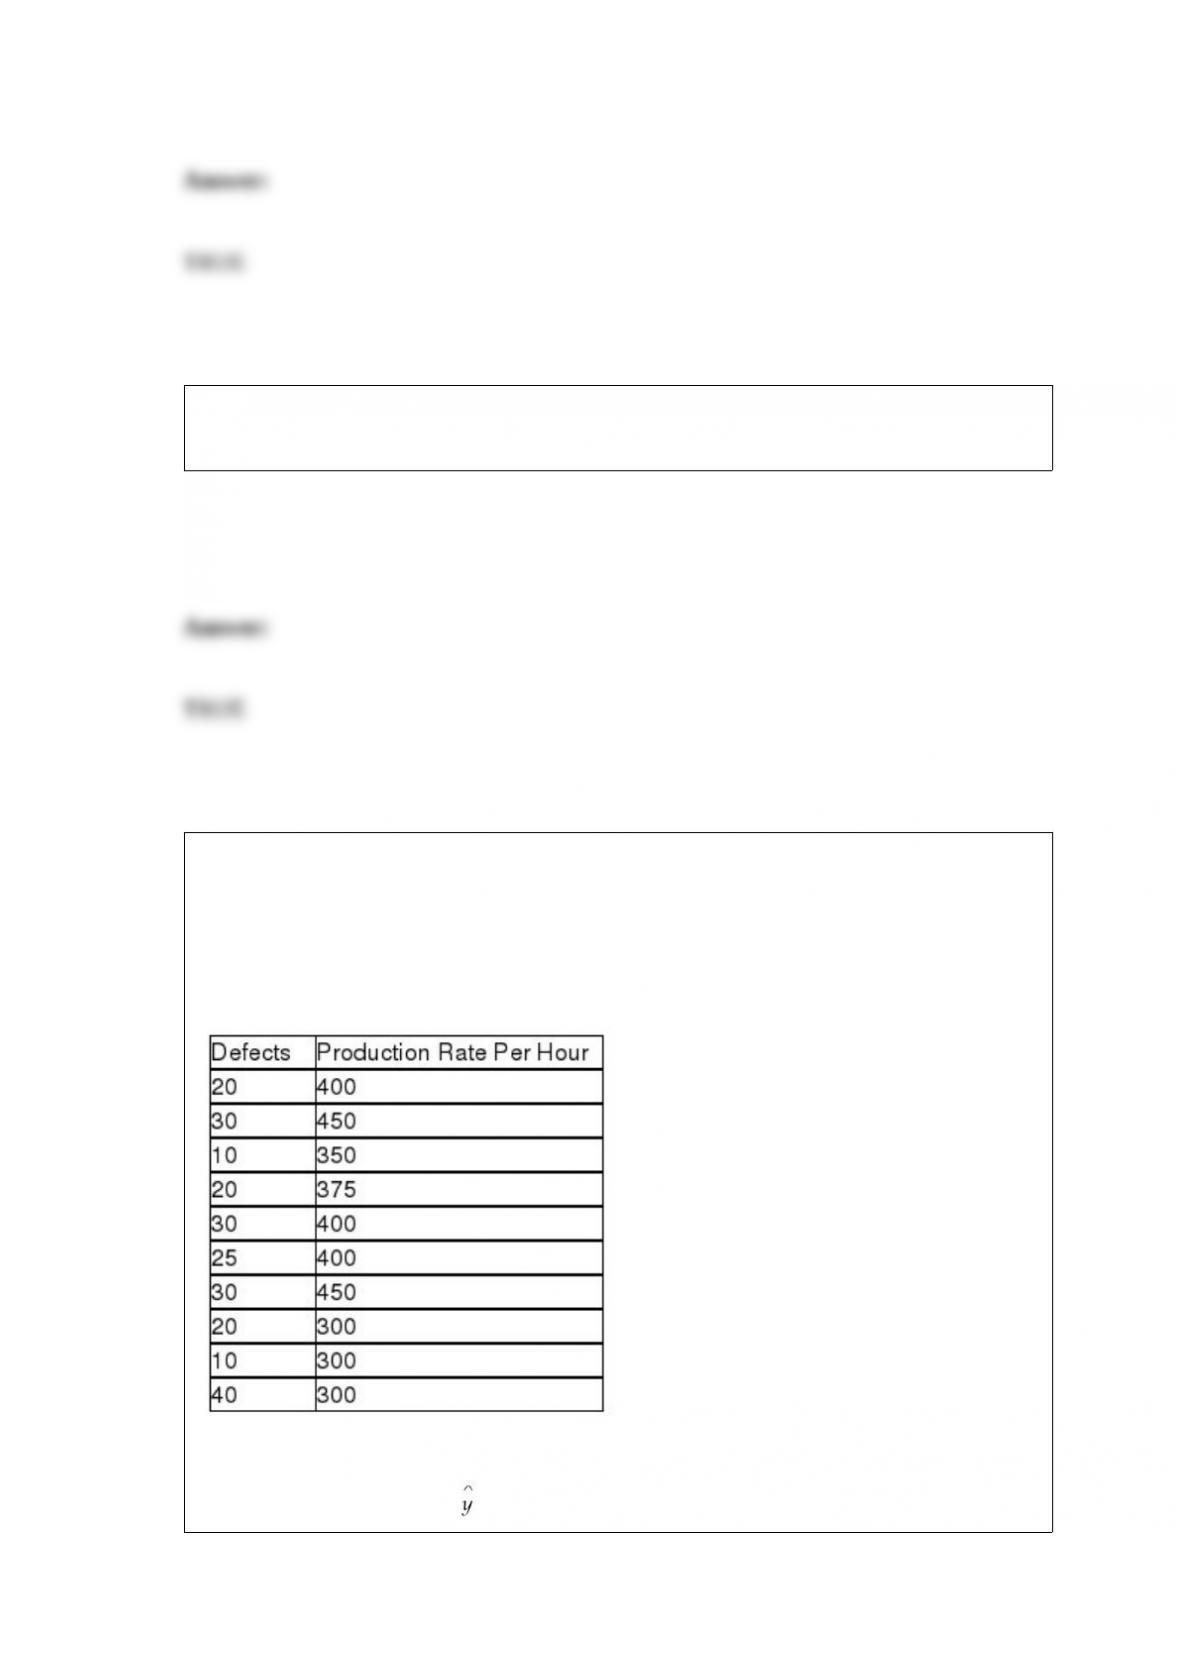
A manufacturing company is interested in predicting the number of defects that will be
produced each hour on the assembly line. The managers believe that there is a
relationship between the defect rate and the production rate per hour. The managers
believe that they can use production rate to predict the number of defects. The
following data were collected for 10 randomly selected hours.
Given these sample data, the simple linear regression model for predicting the number
of defects is approximately = 5.67 + 0.048x.
When surveyed, a sample of 1,250 patients at a regional hospital provided interviewers
with the following summary statistics pertaining to the hospital charges:
Minimum = $278.00 Q1 = $1,245 Q2 = $3,567 Q3= $4,702.
Based on these data, if you were to construct a box and whisker plot, the value $278
would be considered an outlier.
A randomized complete block analysis of variance allows the analyst to control for
sources of variation that might adversely affect the analysis by using the concept of
paired samples.
In a forward stepwise regression process, it is actually possible for the R-square value
to decline if variables are added to the regression model that do not help to explain the
variation in the dependent variable.
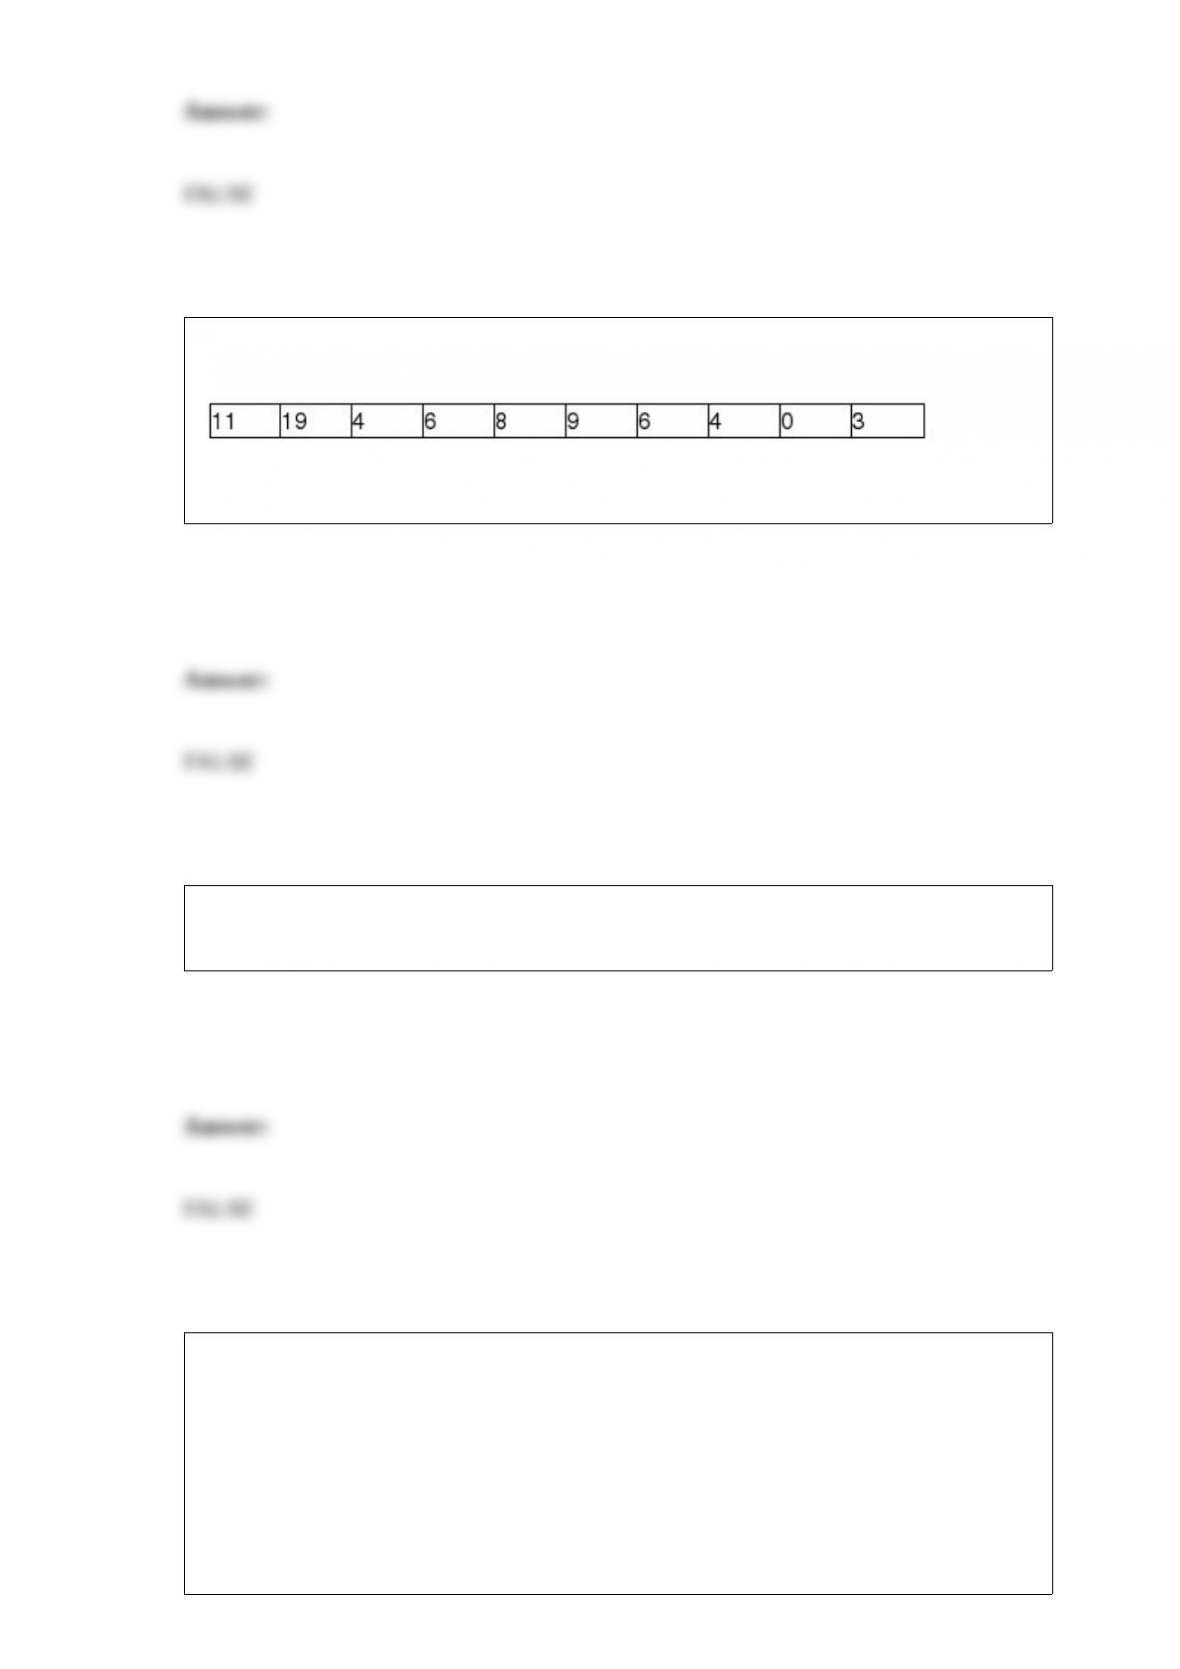
A store manager tracks the number of customer complaints each week. The following
data reflect a random sample of ten weeks.
The standard deviation for these data is approximately 27.78.
Descriptive statistics allow a decision maker to reach a conclusion about a population
based on a subset from the population.
Lube-Tech is a major chain whose primary business is performing lube and oil changes
for passenger vehicles. The national operations manager has stated in an industry
newsletter that the mean number of miles between oil changes for all passenger cars
exceeds 4,200 miles. To test this, an industry group has selected a random sample of
100 vehicles that have come into a lube shop and determined the number of miles since
the last oil change and lube. The sample mean was 4,278 and the standard deviation
was known to be 780 miles. Based on this information, the p-value for the hypothesis
test is less than 0.10.
A seafood shop sells salmon fillets where the weight of each fillet is normally
distributed with a mean of 1.6 pounds and a standard deviation of 0.3 pounds. Based on
this information we can conclude that 90 percent of the fillets weight more than 1.0
pound.
When a survey is done you can always assume that non-respondents would have
answered the same way as those who did respond.
According to the local real estate board, the average number of days that homes stay on
the market before selling is 78.4 with a standard deviation equal to 11 days. A
prospective seller selected a random sample of 36 homes from the multiple listing
service. Above what value for the sample mean should 95 percent of all possible sample
means fall?
A) About 79.3 days

B) About 64 days
C) Approximately 75.4 days
D) Can’t be determined without knowing whether the population is normally
distributed.
A population has a proportion equal to 0.30. Calculate the following probabilities with
n = 100. Find P(0.25 < ≤ 0.40).
A) 0.8121
B) 0.7415
C) 0.8475
D) 0.5612
The following samples are observations taken from the same elements at two different
times:
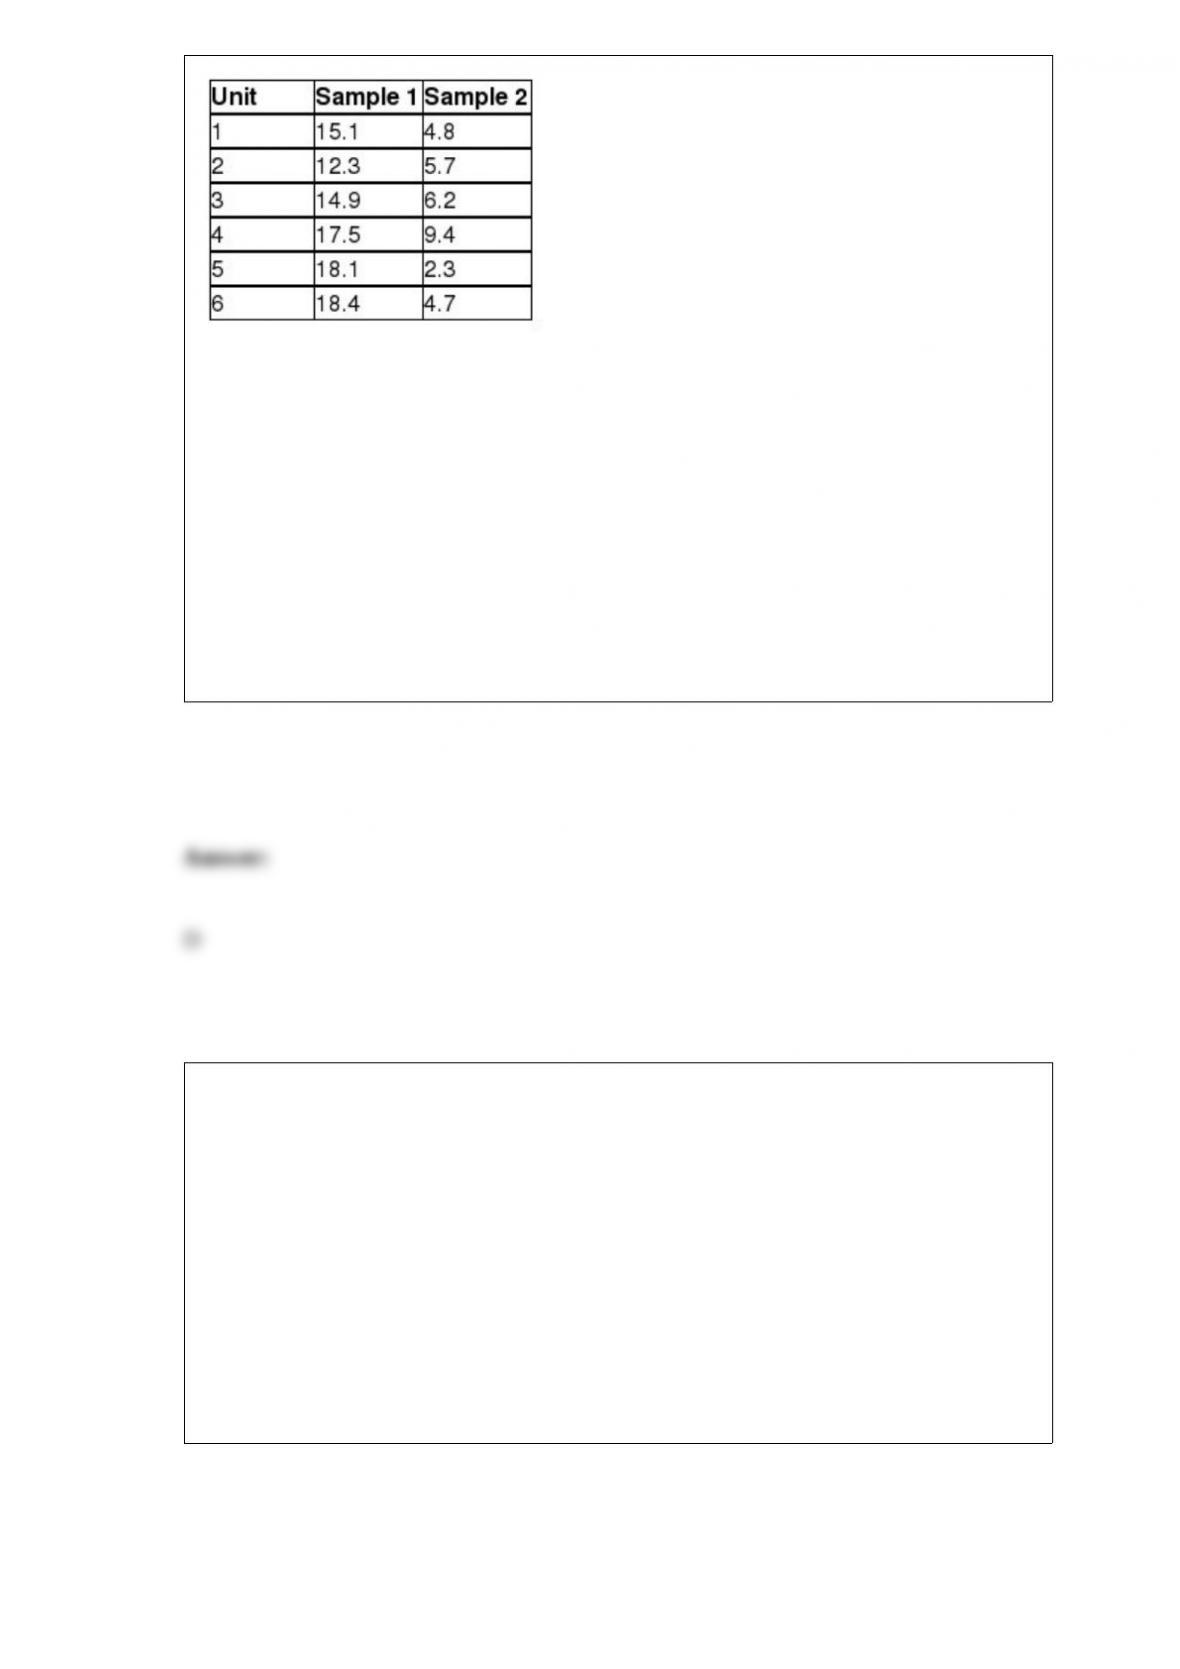
Perform a test of hypothesis to determine if the difference in the means of the
distribution at the first time period is 10 units larger than at the second time period. Use
a level of significance equal to 0.10.
A) Because t = 1.98 > 2.0150, the null hypothesis must be rejected.
B) Because t = 1.67 > 2.0150, the null hypothesis must be rejected
C) Because t = 1.02 < 2.0150, the null hypothesis cannot be rejected.
D) Because t = 0.37 < 2.0150, the null hypothesis cannot be rejected.
According to the most recent Labor Department data, 10.5% of engineers (electrical,
mechanical, civil, and industrial) were women. Suppose a random sample of 50
engineers is selected. How likely is it that the random sample will contain fewer than 5
women in these positions?
A) 0.4522
B) 0.3124
C) 0.5121
D) 0.5512
The Canyon Water Company collects data on the number of gallons of water consumed
during a month for each customer. The production manager has divided the usage into 6
classes. To display these data effectively, she could use which of the following types of
graphs to convey information about the water usage?
A) A stem and leaf diagram
B) A bar chart
C) A histogram
D) Either a histogram or a pie chart
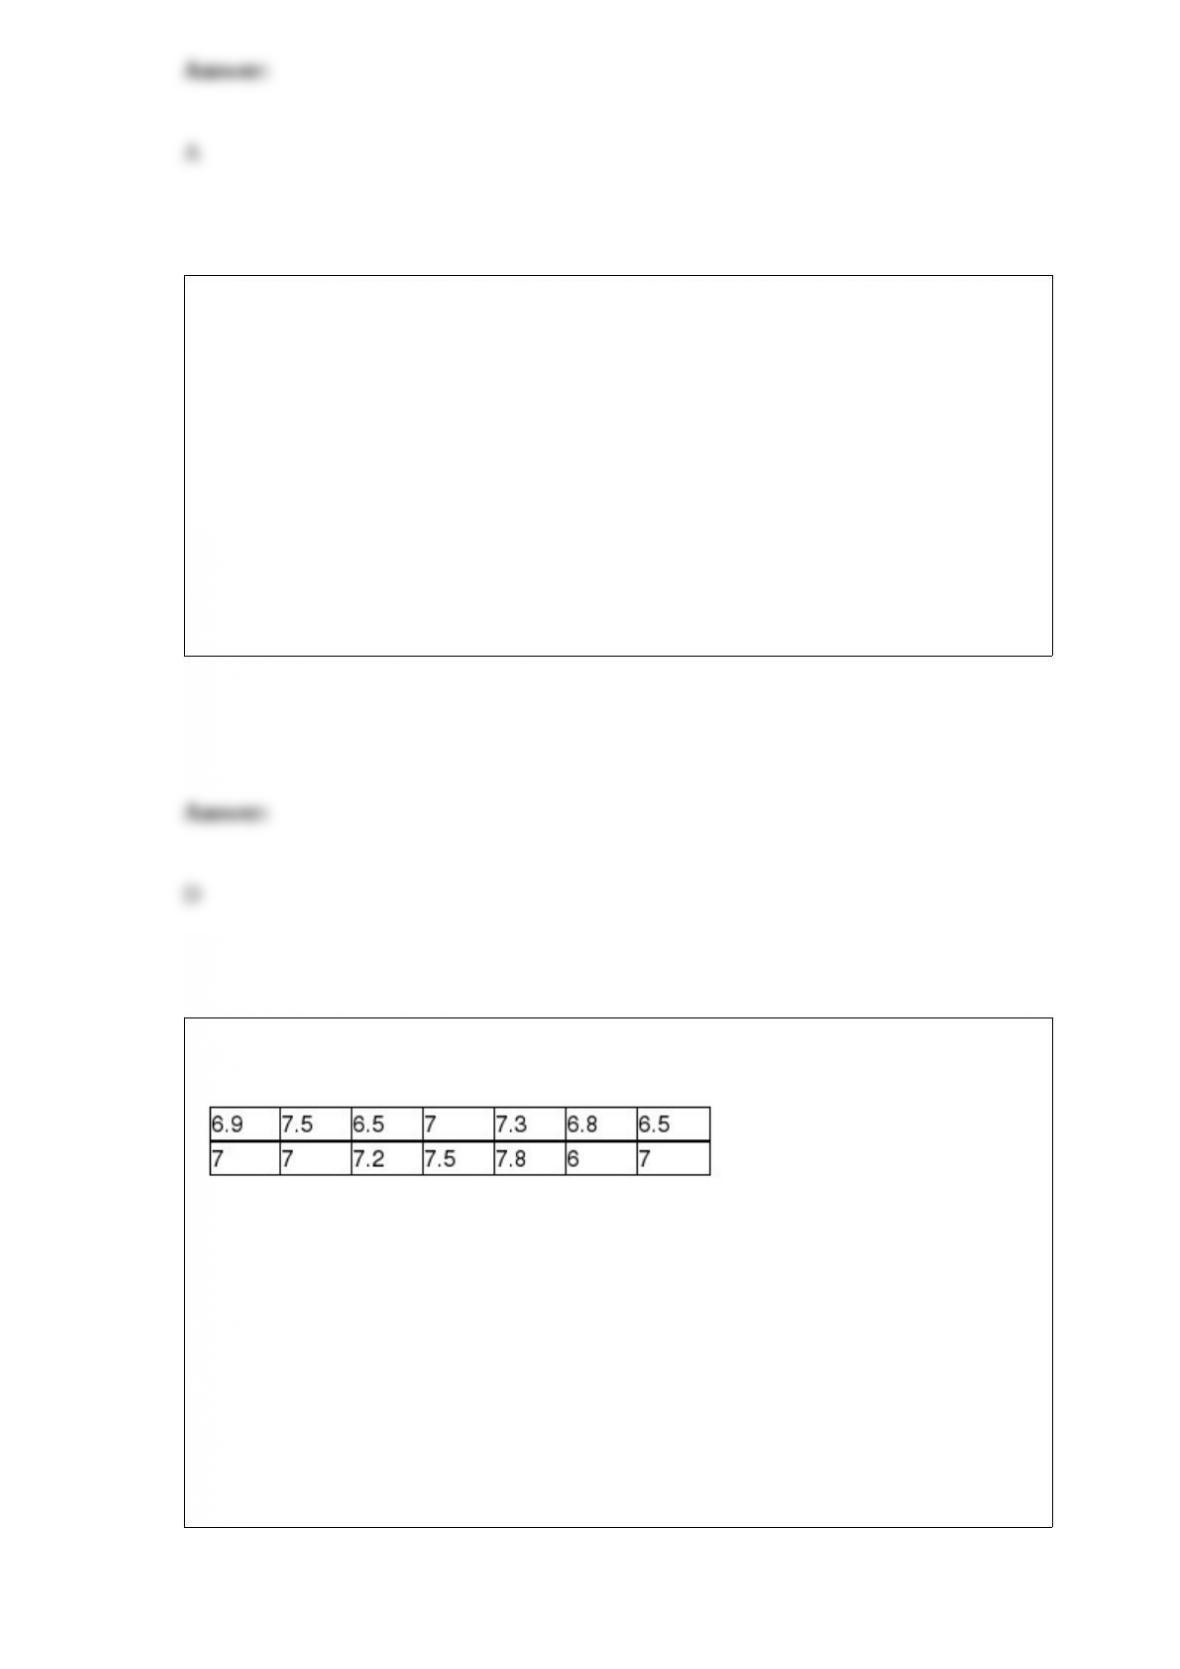
The following values represent the population of home mortgage interest rates (in
percents) being charged by the banks in a particular city:
Given this information, what is the most extreme amount of sampling error possible if a
random sample of n = 4 banks is surveyed and the mean loan rate is calculated?
A) -0.55 percent
B) 0.52 percent
C) 1.08 percent
D) Can’t be determined without more information.
For a standardized normal distribution, calculate P(1.78 < z < 2.34).
A) 0.0124
B) 0.0341
C) 0.0412
D) 0.0279
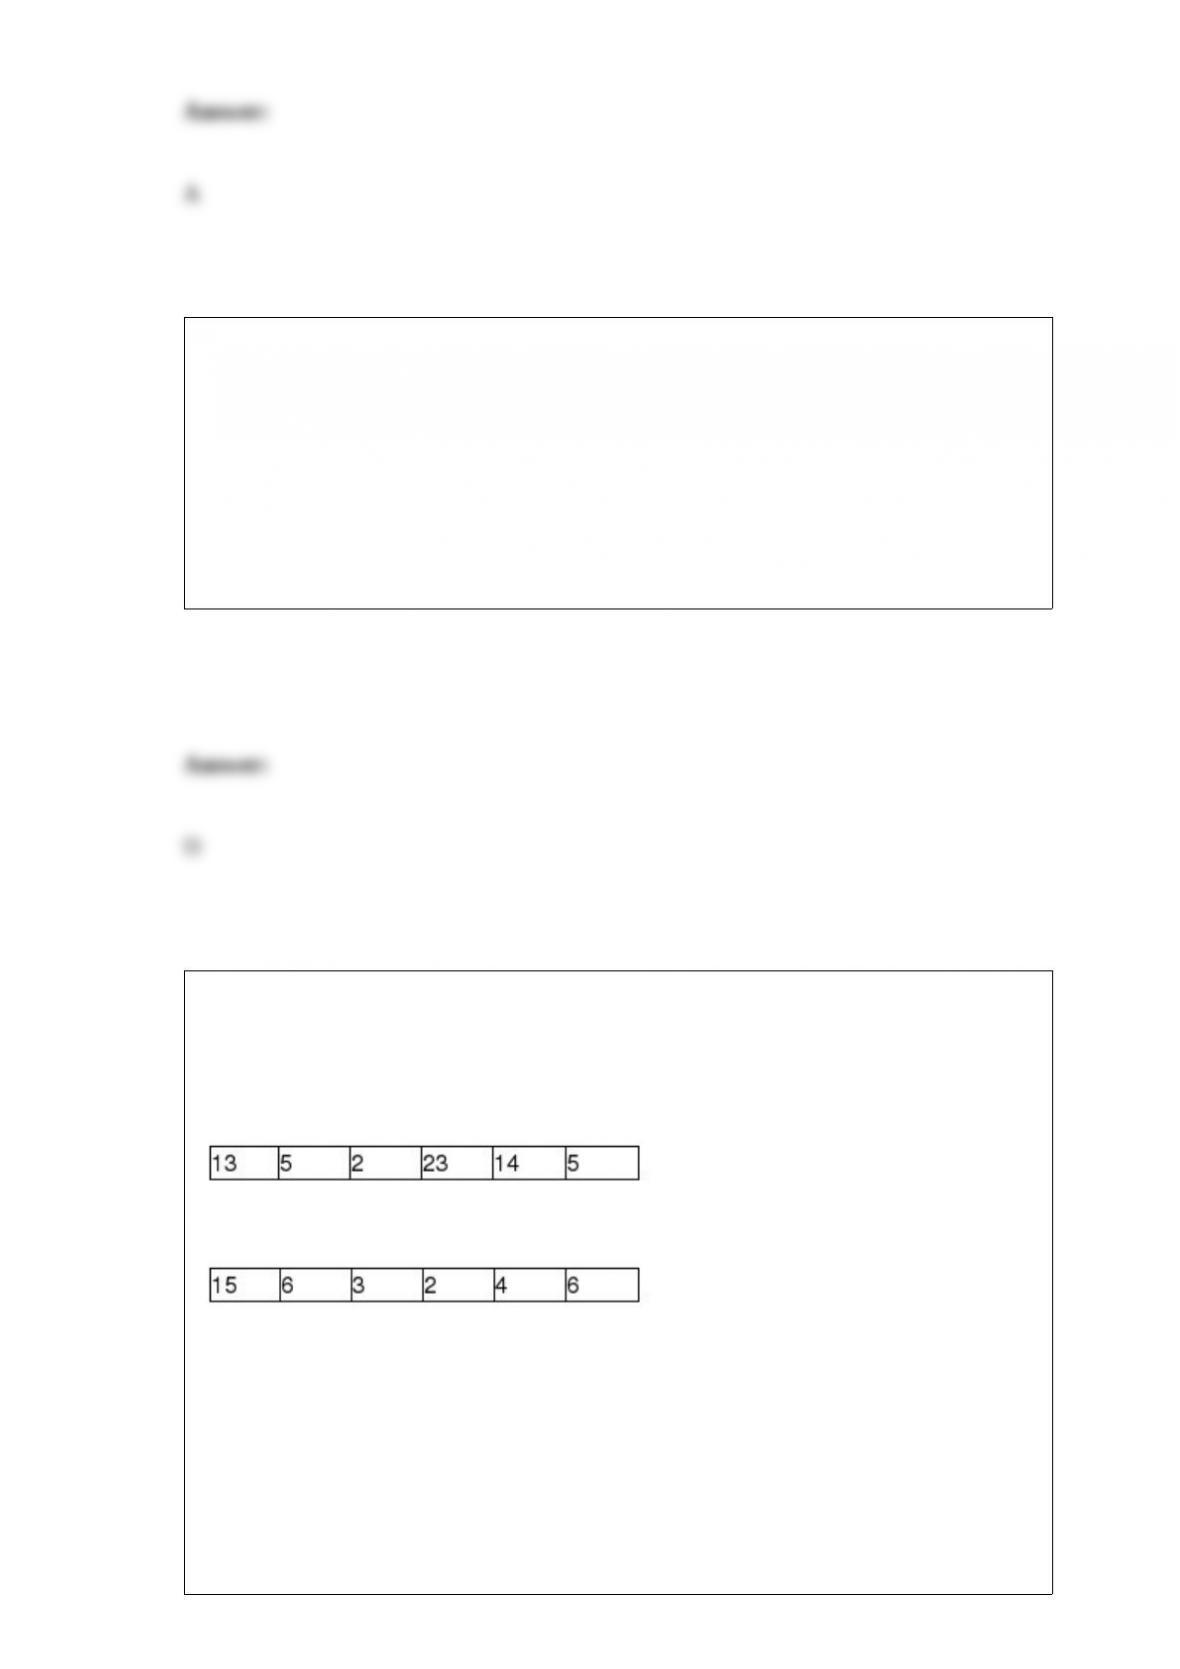
Consider the following data, which represent the number of miles that employees
commute from home to work each day. There are two samples: one for males and one
for females.
Males:
Females:
Which of the following statements is true?
A) The female distribution is more variable since the range for the females is greater
than for the males.
B) Females in the sample commute farther on average than do males.
C) The males in the sample commute farther on average than the females.
D) Males and females on average commute the same distance.
Which of the following questions CANNOT be answered using a scatter diagram?
A) What is the trend over time of each of the 2 variables?
B) Is there a curved or linear relation between the 2 variables?
C) Is there a weak or strong relation between the 2 variables?
D) Is there a positive or negative relation between the 2 variables?
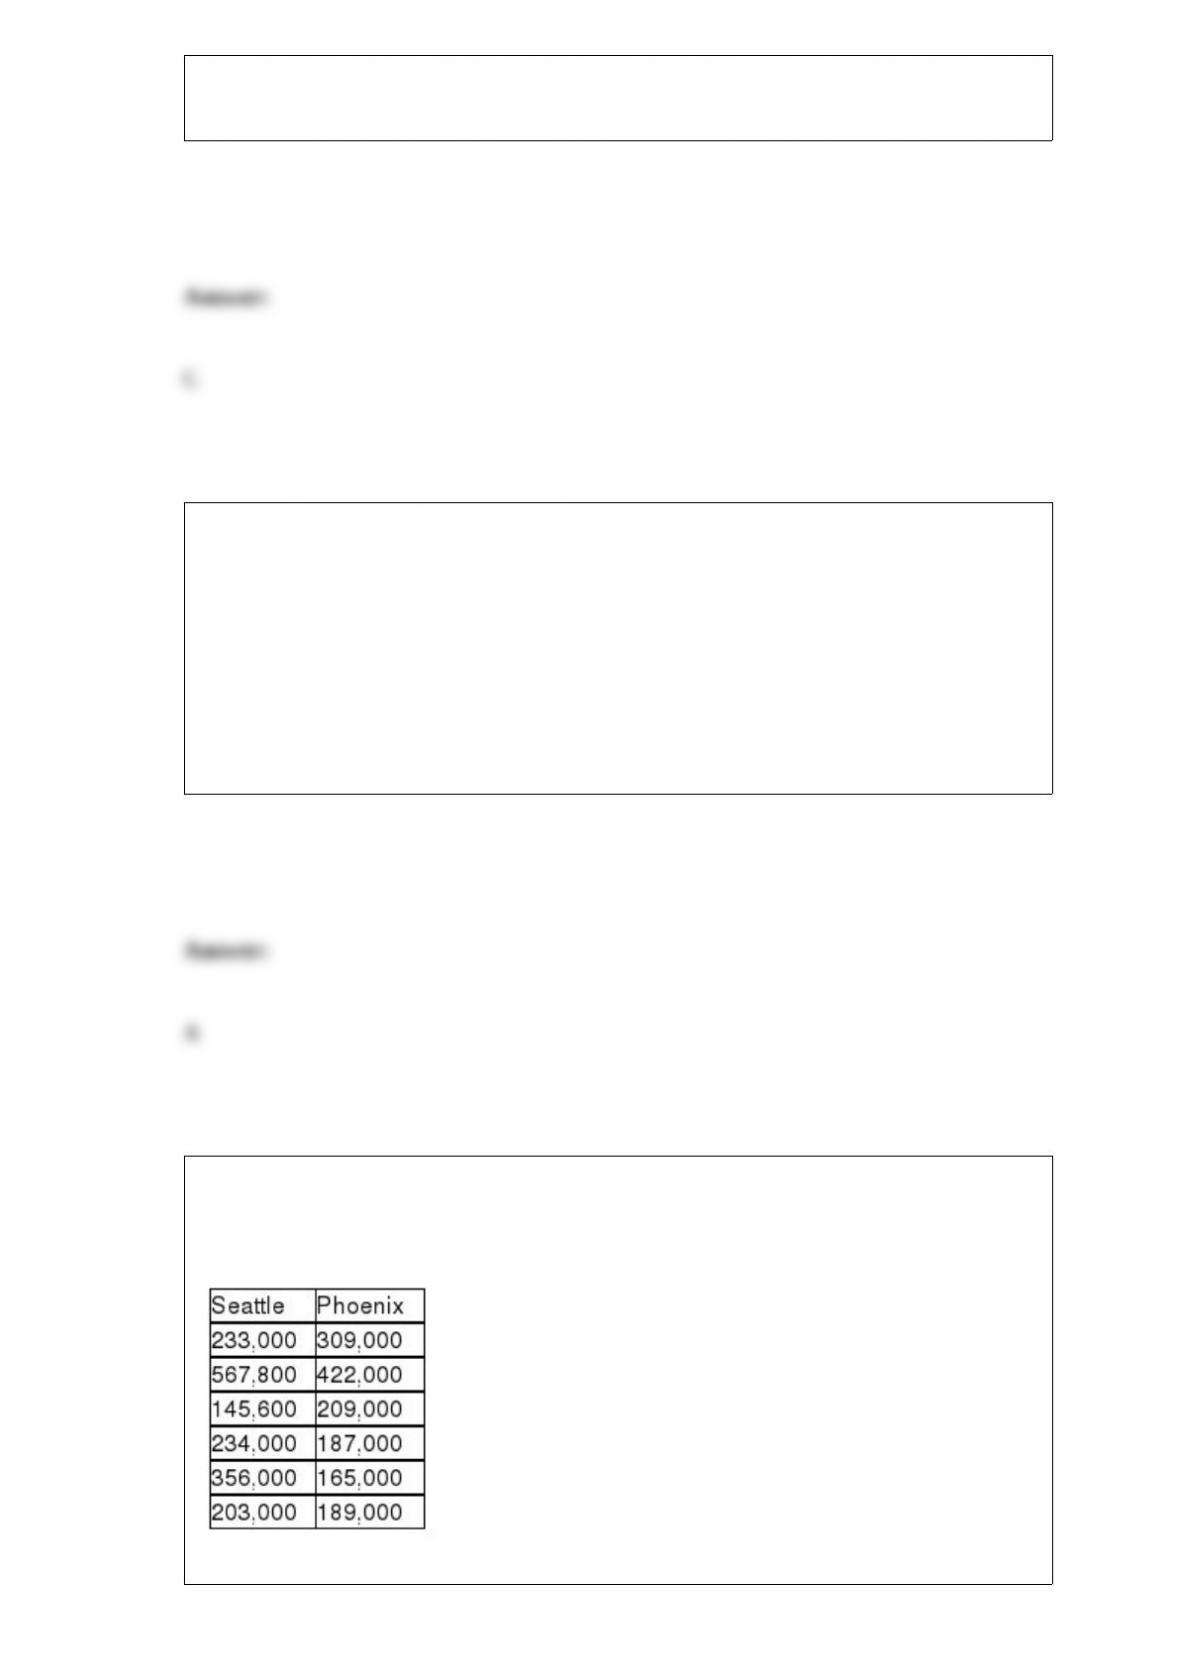
Consider the situation in which a study was recently conducted to determine whether
the median price of houses is the same in Seattle and Phoenix. The following data were
collected.

Given these data, if a Mann-Whitney U test is to be used, the U statistic for Phoenix is:
A) 14
B) 22
C) 35
D) 27
A tire manufacturing company is interested in obtaining data on stopping distances for
each of the three main tread types made by the company. The data collection method
that would be most likely used in this case would be:
A) telephone survey.
B) written questionnaire.
C) demographic surveying.
D) experiments.
The Center on Budget and Policy Priorities (www.cbpp.org) reported that average
out-of-pocket medical expenses for prescription drugs for privately insured adults with
incomes over 200% of the poverty level was $173 in 2002. Suppose an investigation
was conducted in 2012 to determine whether the increased availability of generic drugs,
Internet prescription drug purchases, and cost controls have reduced out-of-pocket drug

expenses. The investigation randomly sampled 196 privately insured adults with
incomes over 200% of the poverty level, and the respondents’ 2012 out-of-pocket
medical expenses for prescription drugs were recorded. These data are in the file Drug
Expenses. Based on the sample data, can it be concluded that 2012 out-of-pocket
prescription drug expenses are lower than the 2002 average reported by the Center on
Budget and Policy Priorities? Use a level of significance of 0.01 to conduct the
hypothesis test.
A) Because t = -2.69 is less than -2.3456, do not reject H0
Conclude that 2012 average out-of-pocket prescription drug expenses are not lower
than the 2002 average.
B) Because t = -2.69 is less than -2.3456, reject H0
Conclude that 2012 average out-of-pocket prescription drug expenses are lower than the
2002 average.
C) Because t = -1.69 is less than -0.8712, reject H0
Conclude that 2012 average out-of-pocket prescription drug expenses are lower than the
2002 average.
D) Because t = -1.69 is less than -0.8712, do not reject H0
Conclude that 2012 average out-of-pocket prescription drug expenses are not lower
than the 2002 average.
Most companies that make golf balls and golf clubs use a one-armed robot named “Iron
Mike” to test their balls for length and accuracy, but because of swing variations by real
golfers, these test robots don’t always indicate how the clubs will perform in actual use.
One company in the golfing industry is interested in testing its new driver to see if it has
greater length off the tee than the best-selling driver. To do this, it has selected a group
of golfers of differing abilities and ages. Its plan is to have each player use each of the
two clubs and hit five balls. It will record the average length of the drives with each
club for each player. The resulting data for a sample of 10 players are:
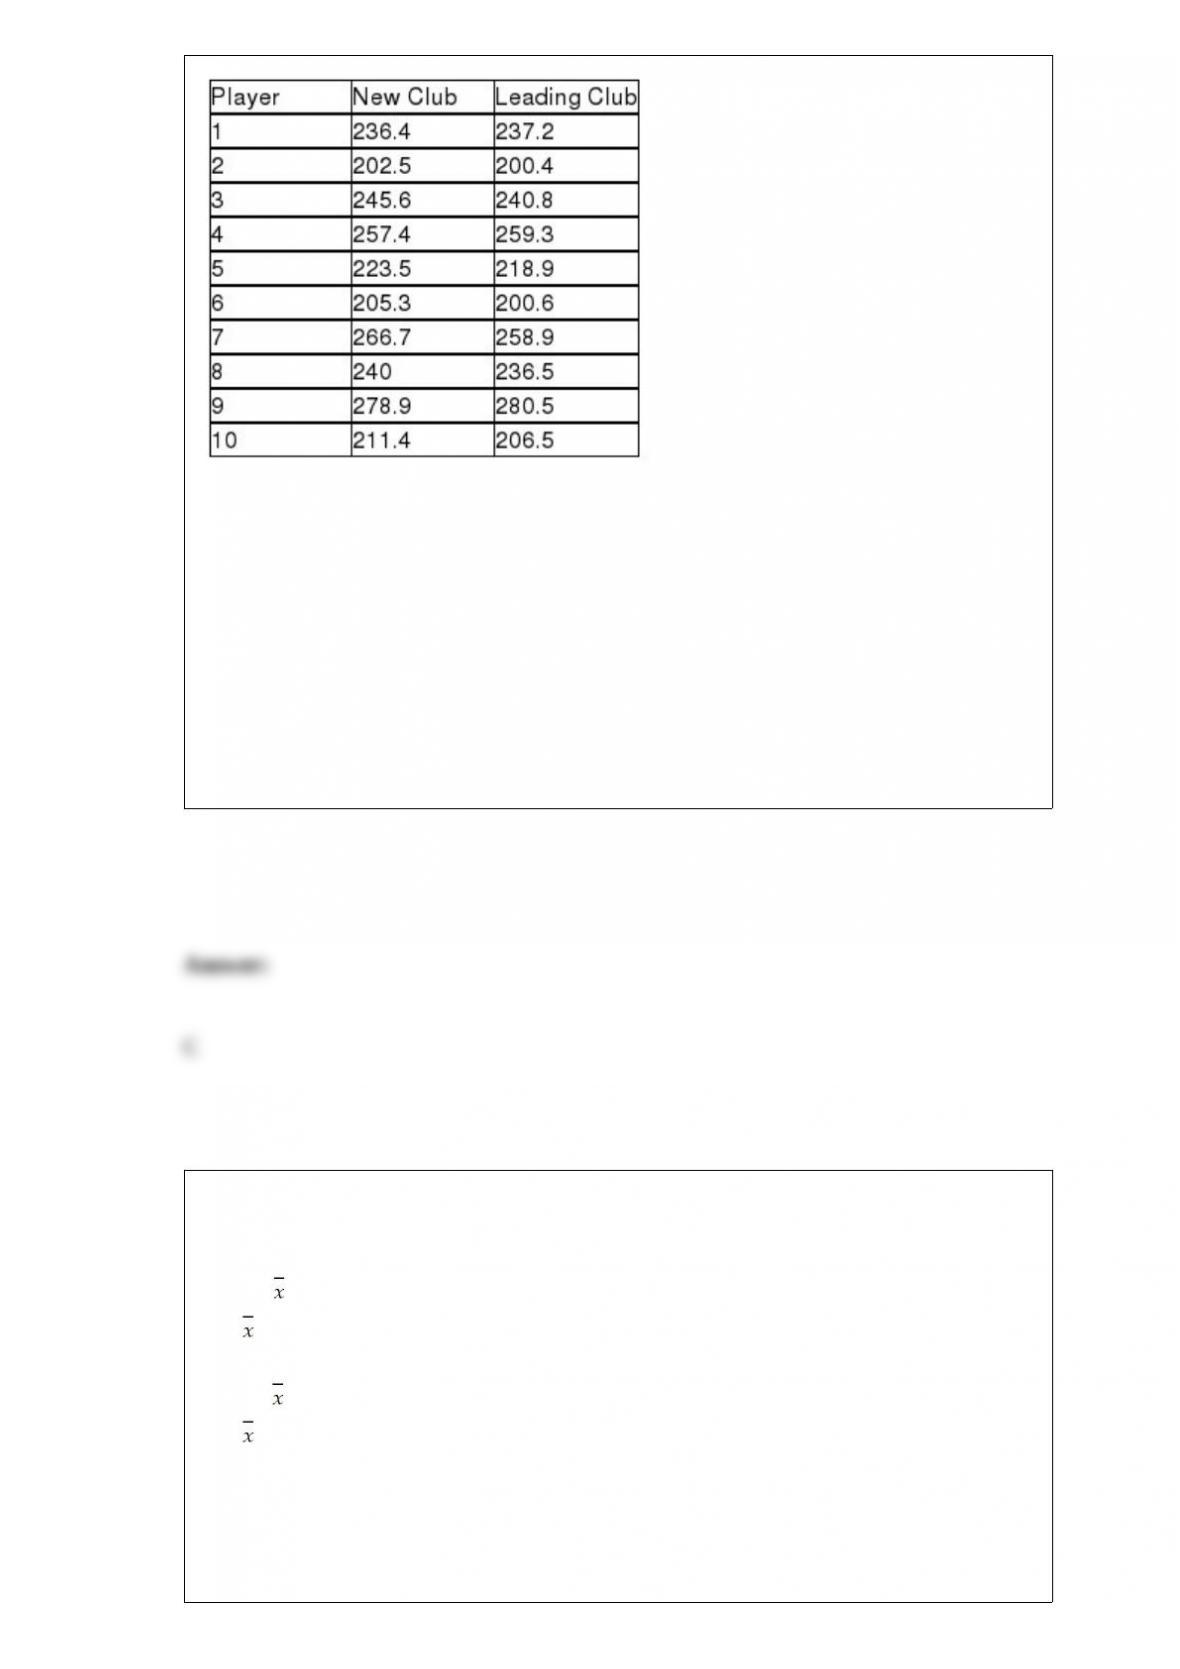
What is the critical value for the appropriate hypothesis test if the test is conducted
using a 0.05 level of significance?
A) z = 1.645
B) t = 1.7341
C) t = 1.8331
D) t = 2.2622
In a hypothesis test involving a population mean, which of the following would be an
acceptable formulation?
A) H0 : ≤ $1,700
Ha : > $1,700
B) H0 : > $1,700
Ha : ≥ $1,700
C) H0 : μ ≤ $1,700
Ha : μ > $1,700

D) None of the above is a correct formulation.
Many people believe that they can tell the difference between Coke and Pepsi. Other
people say that the two brands can’t be distinguished. To test this, a random sample of
20 adults was selected to participate in a test. After being blindfolded, each person was
given a small taste of either Coke or Pepsi and asked to indicate which brand soft drink
it was. Suppose 14 people correctly identified the soft drink brand. Which of the
following conclusions would be warranted under the circumstance?
A) Since the chance of getting 14 correct is 0.0370, which is quite small, the study
shows that people are not able to identify brands effectively.
B) Since the probability of getting 14 or more correct is 0.0577, which is quite low, this
means that people are not effective in identifying the soft drink brand.
C) Since the probability of getting 14 or more correct is 0.0577, which is quite low, the
conclusion could be that people are effective at identifying soft drink brands.
D) The expected value for this binomial distribution is very close to 14 so this supports
that people cannot tell the difference.
There are a number of highly touted search engines for finding things of interest on the
Internet. Recently, a consumer rating system ranked two search engines ahead of the
others. Now, a computer user’s magazine wishes to make the final determination
regarding which one is actually better at finding particular information. To do this, each
search engine was used in an attempt to locate specific information using specified
keywords. Both search engines were subjected to 100 queries. Search engine 1

successfully located the information 88 times and search engine 2 located the
information 80 times. Using a significance level equal to 0.05, which of the following is
true?
A) Based the sample data, the null hypothesis of equal population proportions is
rejected since the test statistic exceeds the critical value.
B) Based on the sample data, the null hypothesis should not be rejected since the test
statistic of z = 2.04 exceeds the critical value of z = 1.96.
C) According to the test results, the hypothesis should be rejected since the test statistic
value, z = 1.54, falls in the rejection region.
D) Based on the sample data, there is not sufficient evidence to conclude that a
difference exists between the proportion of search hits since the test statistic, z = 1.54,
does not fall in the rejection region.
Which of the following would best describe the situation that a second-degree
polynomial regression equation would be used to model?
A) An exponential growth trend
B) A cosine function
C) A parabola
D) It depends on the number of independent variables.
Which of the following statements is not consistent with the Central Limit Theorem?
A) The Central Limit Theorem applies without regard to the size of the sample.
B) The Central Limit Theorem applies to non-normal distributions.
C) The Central Limit Theorem indicates that the sampling distribution will be
approximately normal when the sample size is sufficiently large.
D) The Central Limit Theorem indicates that the mean of the sampling distribution will
be equal to the population mean.
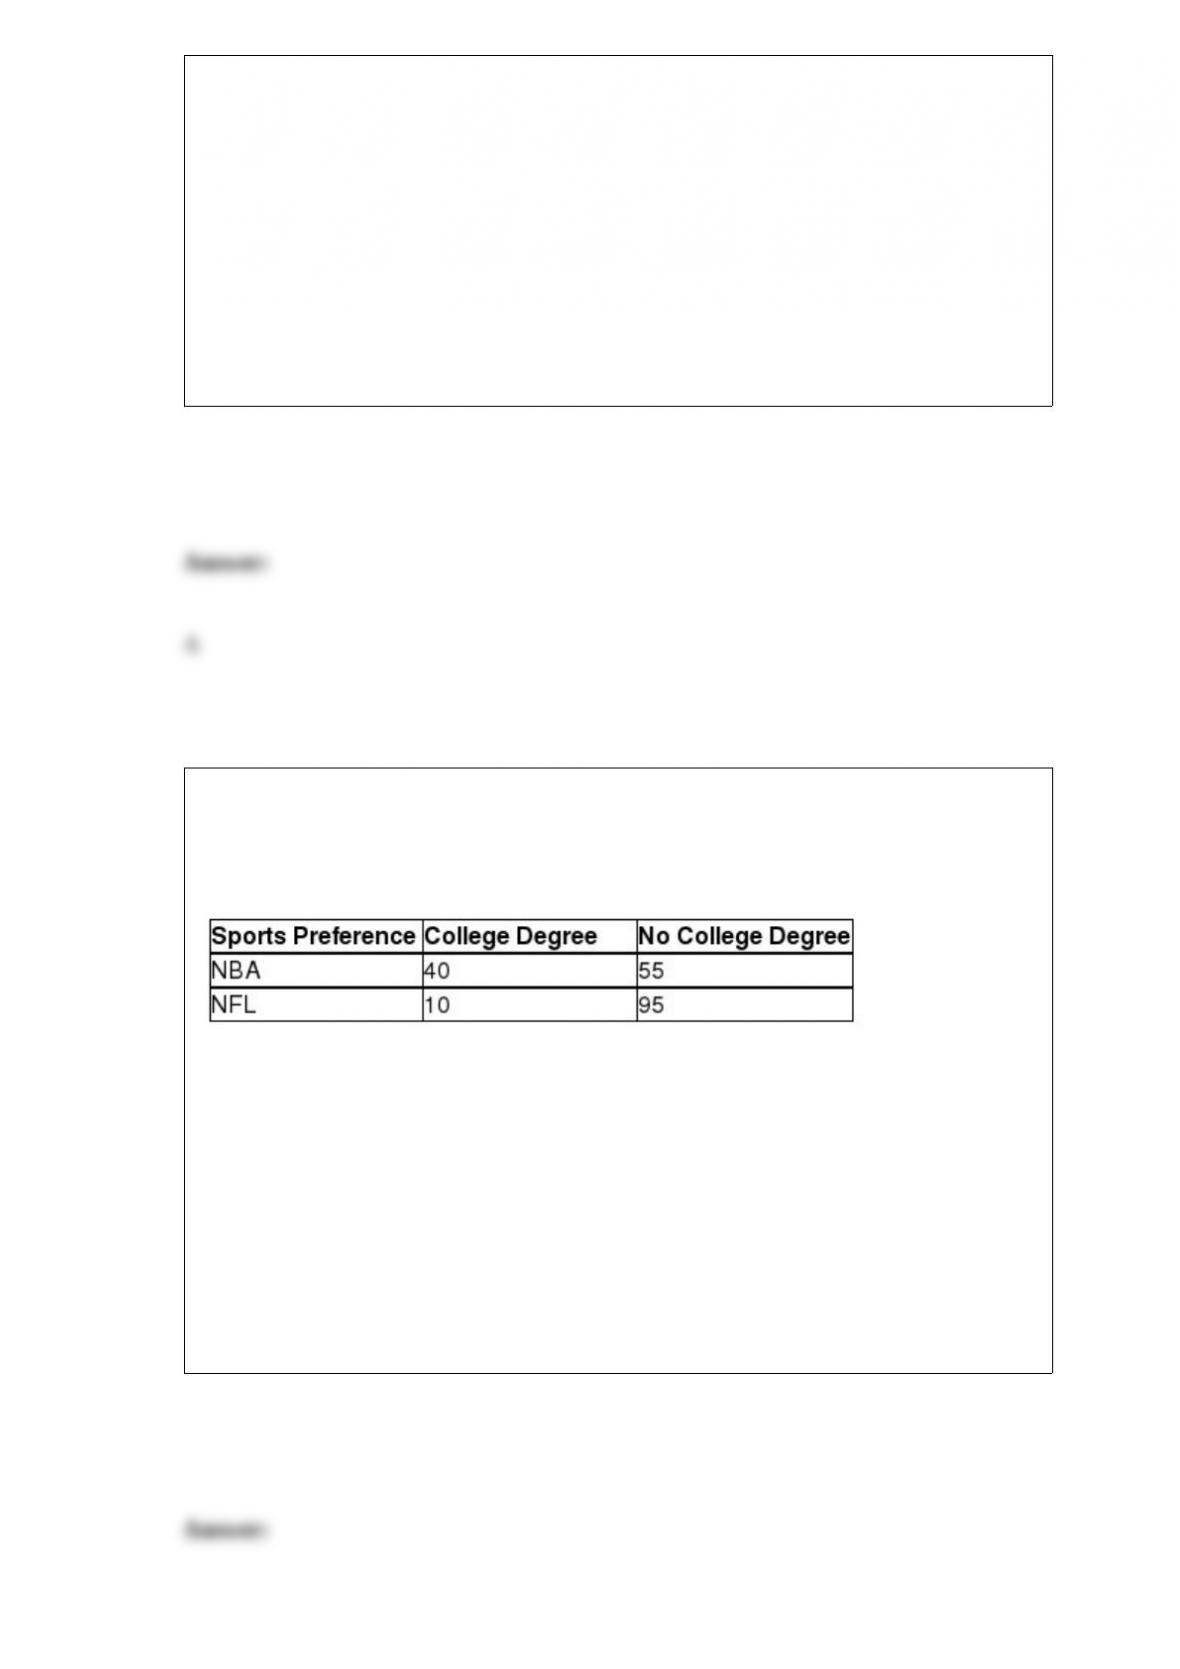
Drake Marketing and Promotions has randomly surveyed 200 men who watch
professional sports. The men were separated according to their educational level
(college degree or not) and whether they preferred the NBA or the National Football
League (NFL). The results of the survey are shown:
What is the probability that a randomly selected survey participant has a college degree
and prefers the NBA?
A) 0.5250
B) 0.2000
C) 0.6050
D) 0.5880
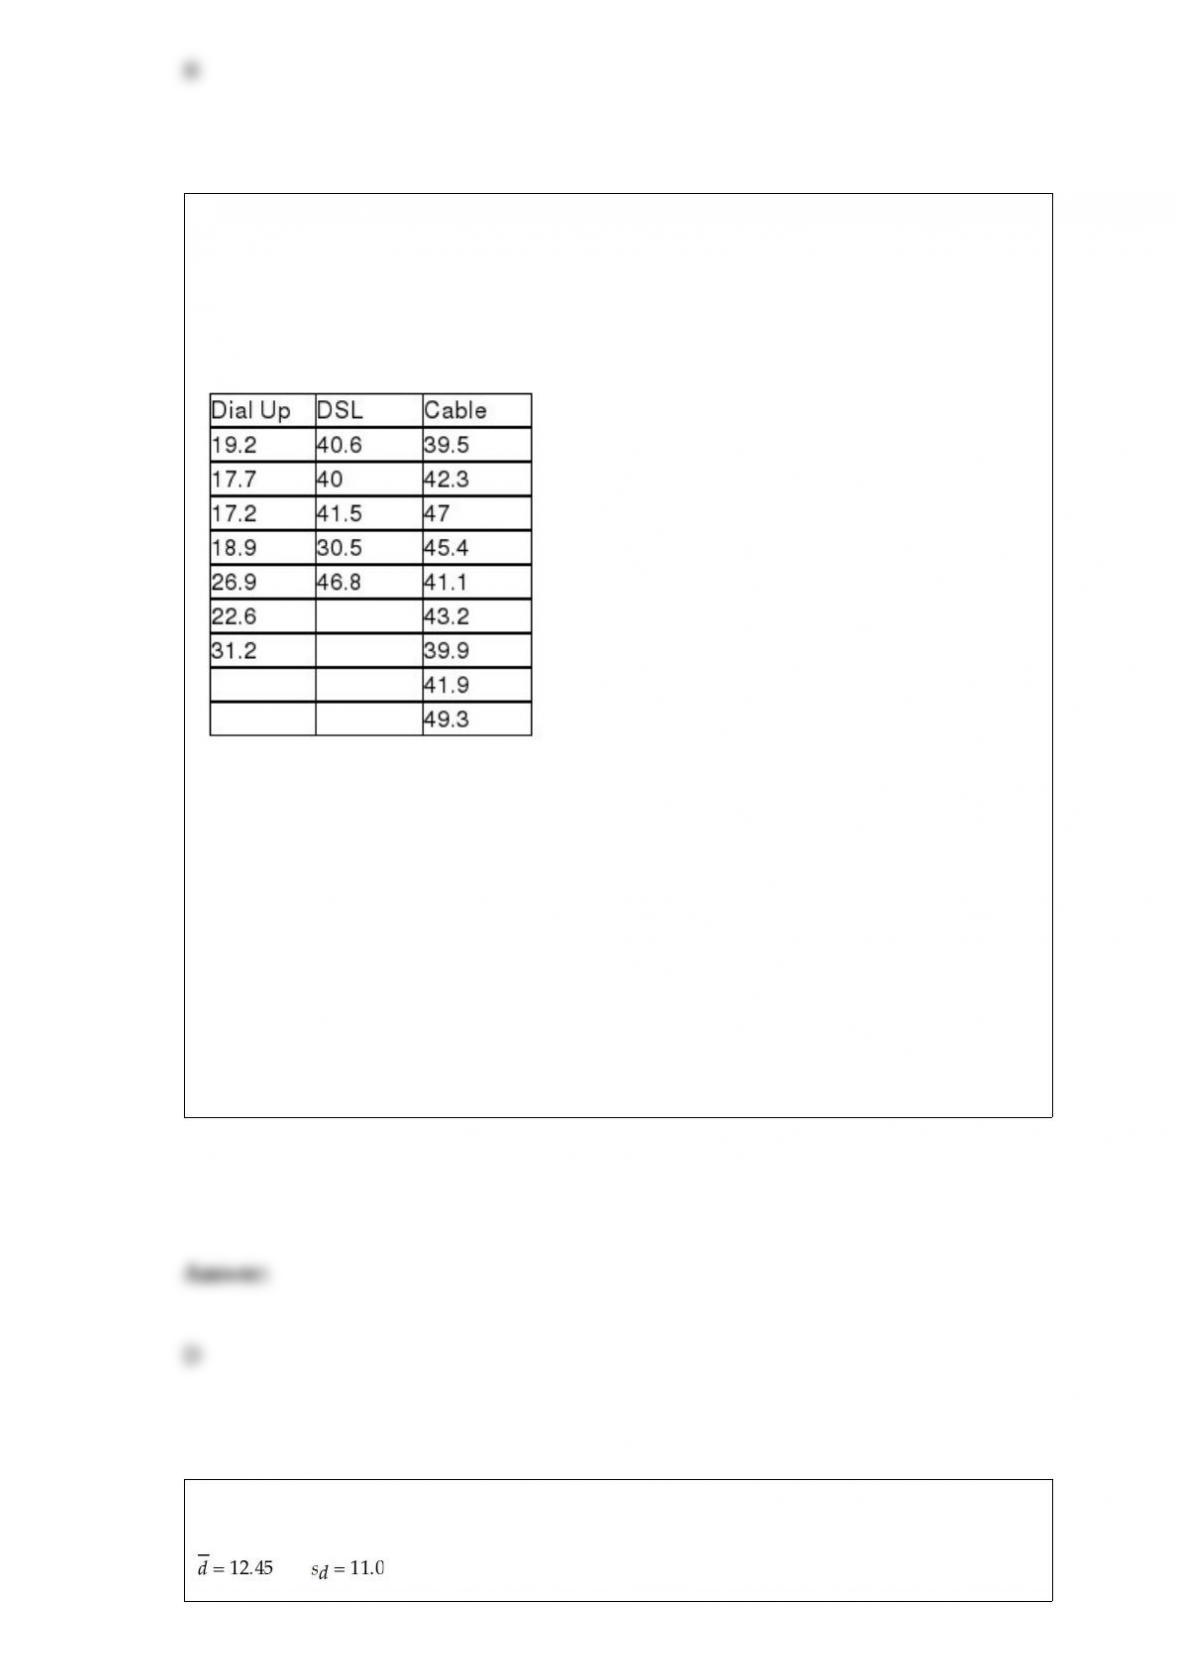
An Internet service provider is interested in testing to see if there is a difference in the
mean weekly connect time for users who come into the service through a dial-up line,
DSL, or cable Internet. To test this, the ISP has selected random samples from each
category of user and recorded the connect time during a week period. The following
data were collected:
Based upon these data and a significance level of 0.05, which of the following
statements is true?
A) The F-critical value for the test is 3.555
B) The test statistic is approximately 43.9
C) The null hypothesis should be rejected and conclude that the mean connect times for
the three user categories are not all equal.
D) All of the above are true.
A paired sample study has been conducted to determine whether two populations have
equal means. Twenty paired samples were obtained with the following sample results:

Based on these sample data and a significance level of 0.05, what conclusion should be
made about the population means?
A) Because t = 5.06 > 2.0930, reject the null hypothesis.
B) Because t = 3.41 > 2.0930, reject the null hypothesis.
C) Because t = 1.82 < 2.0930, do not reject the null hypothesis.
D) Because t = 2.02 < 2.0930, do not reject the null hypothesis.
Consider a random variable, z, that has a standardized normal distribution. Determine P
(1.28 < z < 2.33).
A) 0.0126
B) 0.3997
C) 0.0904
D) 0.4901
A major cell phone service provider has determined that the number of minutes that its
customers use their phone per month is normally distributed with a mean equal to 445.5
minutes with a standard deviation equal to 177.8 minutes. The company is thinking of
charging a lower rate for customers who use the phone less than a specified amount. If
it wishes to give the rate reduction to no more than 12 percent of its customers, what
should the cut-off be?
A) About 237 minutes
B) About 654 minutes
C) About 390 minutes
D) About 325 minutes
The State Transportation Department is thinking of changing its speed limit signs. It is
considering two new options in addition to the existing sign design. At question is
whether the three sign designs will produce the same mean speed. To test this, the
department has conducted a limited test in which a stretch of roadway was selected.
With the original signs up, a random sample of 30 cars was selected and the speeds
were measured. Then, on different days, the two new designs were installed, 30 cars
each day were sampled, and their speeds were recorded. Suppose that the following
summary statistics were computed based on the data:
Based on these sample results and a significance level equal to 0.05, assuming that the
null hypothesis of equal means has been rejected, the Tukey-Kramer critical range is:
A) 1.96.
B) approximately 4.0.
C) Can’t be determined without more information
D) None of the above

Which of the following is true with respect to the binomial distribution?
A) As the sample size increases, the expected value of the random variable decreases.
B) The binomial distribution becomes more skewed as the sample size is increased for a
given probability of success.
C) The binomial distribution tends to be more symmetric as p approaches 0.5.
D) In order for the binomial distribution to be skewed, the sample size must be quite
large.
For a standardized normal distribution, determine a value, say z0, so that P(0 < z < z0) =
0.4772.
A) 2.00
B) 2.33
C) 1.85
D) 1.66

Frequency distributions can be formed from which of the following types of data?
A) Both discrete and continuous
B) Discrete only
C) Continuous only
D) Only qualitative data
A random variable, x, has a normal distribution with μ = 13.6 and σ = 2.90. Determine a
value, x0, so that P(x ≤ x0) = 0.975.
A) 16.678
B) 19.284
C) 23.360
D) 14.475
The U.S. Census Bureau (Annual Social & Economic Supplement) collects
demographics concerning the number of people in families per household. Assume the
distribution of the number of people per household is shown in the following table:
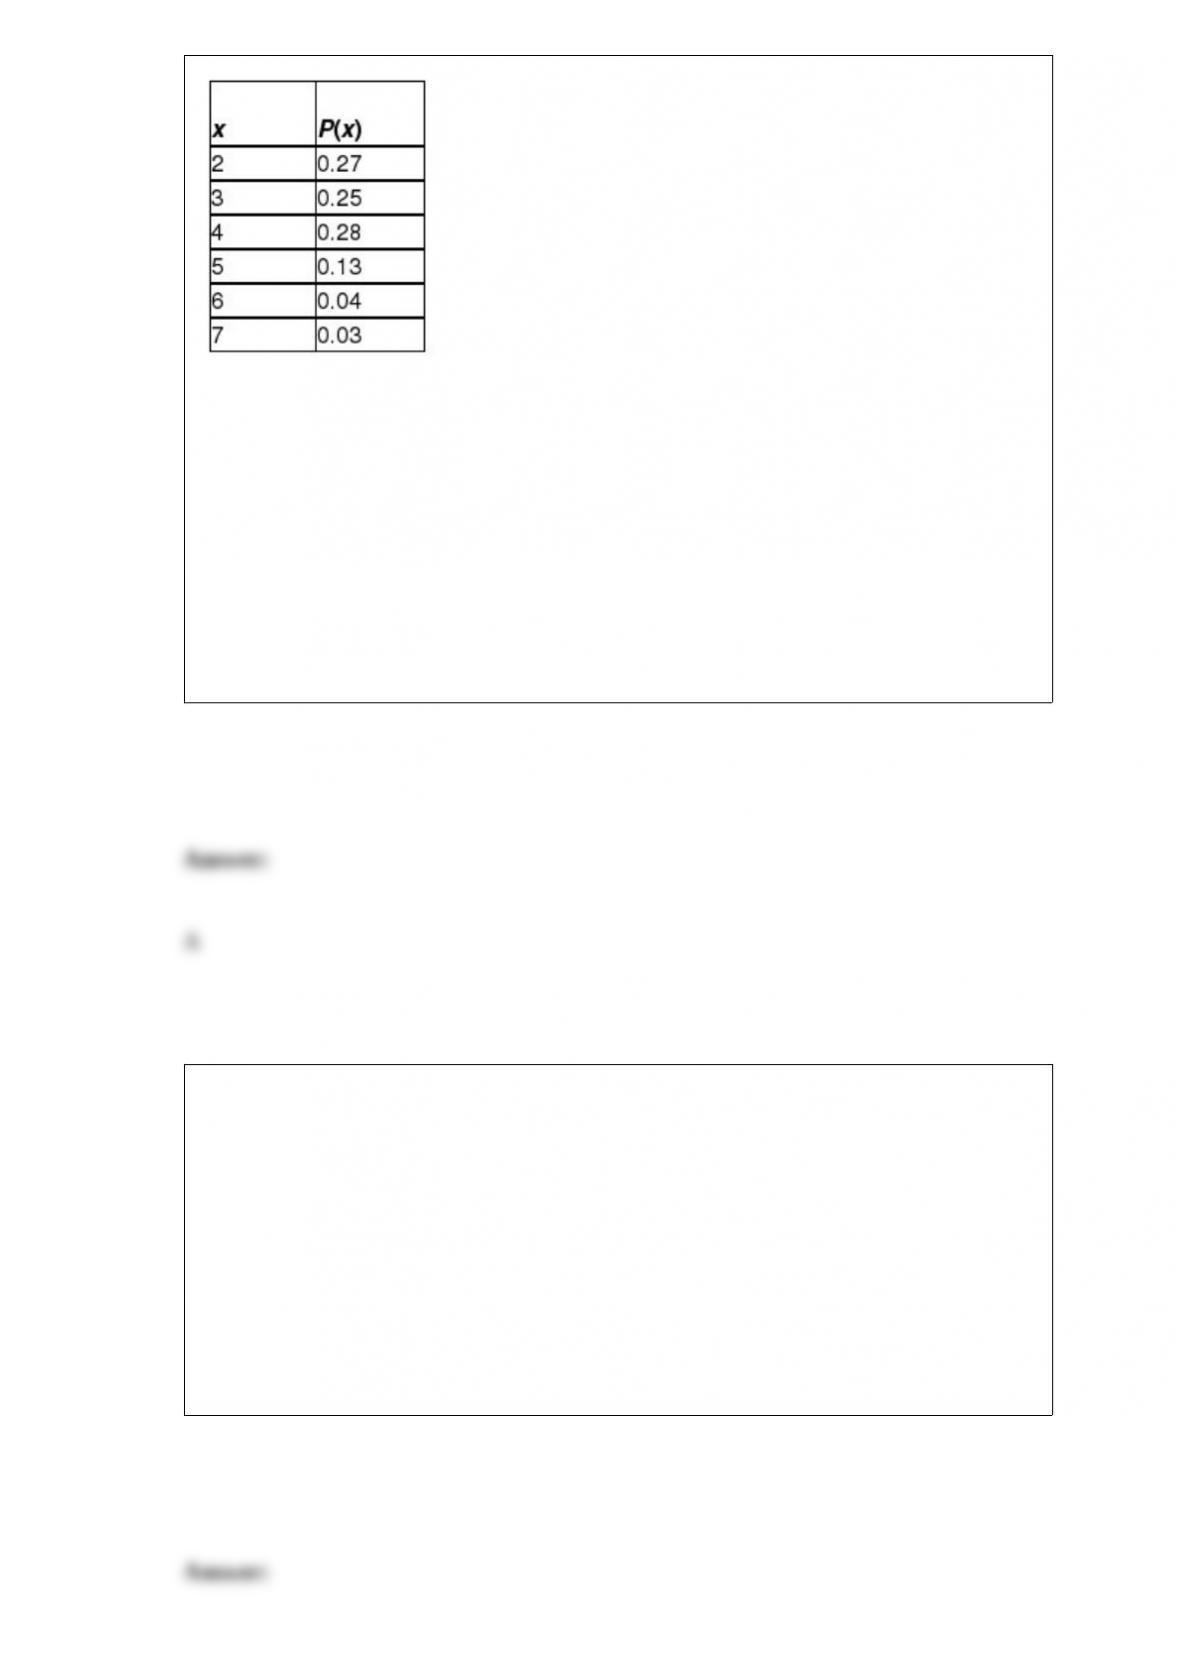
Compute the variance and standard deviation of the number of people in families per
household.
A) Variance=1.6499, standard deviation=1.2845
B) Variance=1.2845, standard deviation=1.6499
C) Variance=6.7182, standard deviation=2.5919
D) Variance=2.5919, standard deviation=6.7182
If the number of defective items selected at random from a parts inventory is considered
to follow a binomial distribution with n = 50 and p = 0.10, the expected number of
defective parts is:
A) 5
B) approximately 2.24
C) more than 10
D) 0.5

Suppose the life of a particular brand of calculator battery is approximately normally
distributed with a mean of 75 hours and a standard deviation of 10 hours. If the
manufacturer of the battery is able to reduce the standard deviation of battery life from
10 to 9 hours, what would be the probability that 16 batteries randomly sampled from
the population will have a sample mean life of between 70 and 80 hours?
A) 0.6127
B) 0.8124
C) 0.9736
D) 0.8812
Both p-charts and c-charts are designed for use when the data we are working with are
referred to as attribute data.
Use the following regression results to answer the question below.
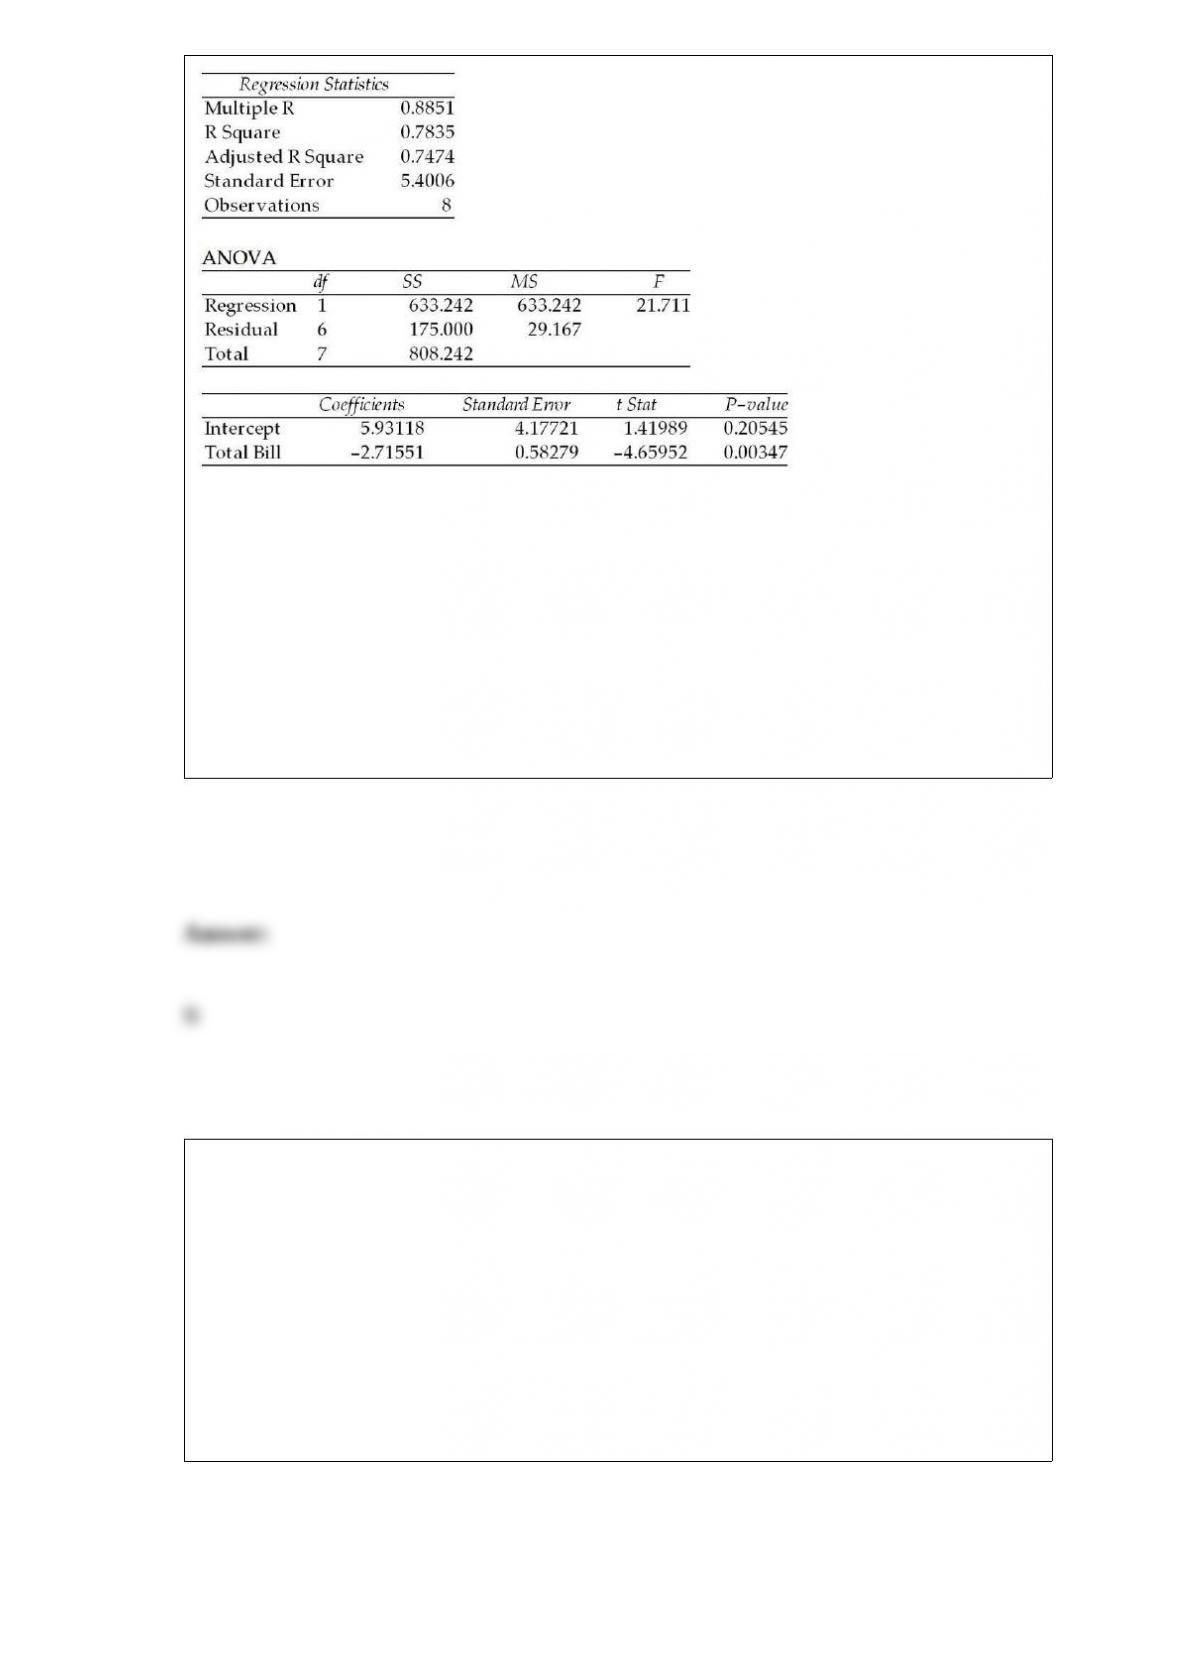
How many observations were involved in this regression?
A) 7
B) 8
C) 9
D) 10
If a binomial distribution applies with a sample size of n = 20, find the probability of 5
successes if the probability of a success is 0.40.
A) 0.1246
B) 0.1286
C) 0.0746
D) 0.0866
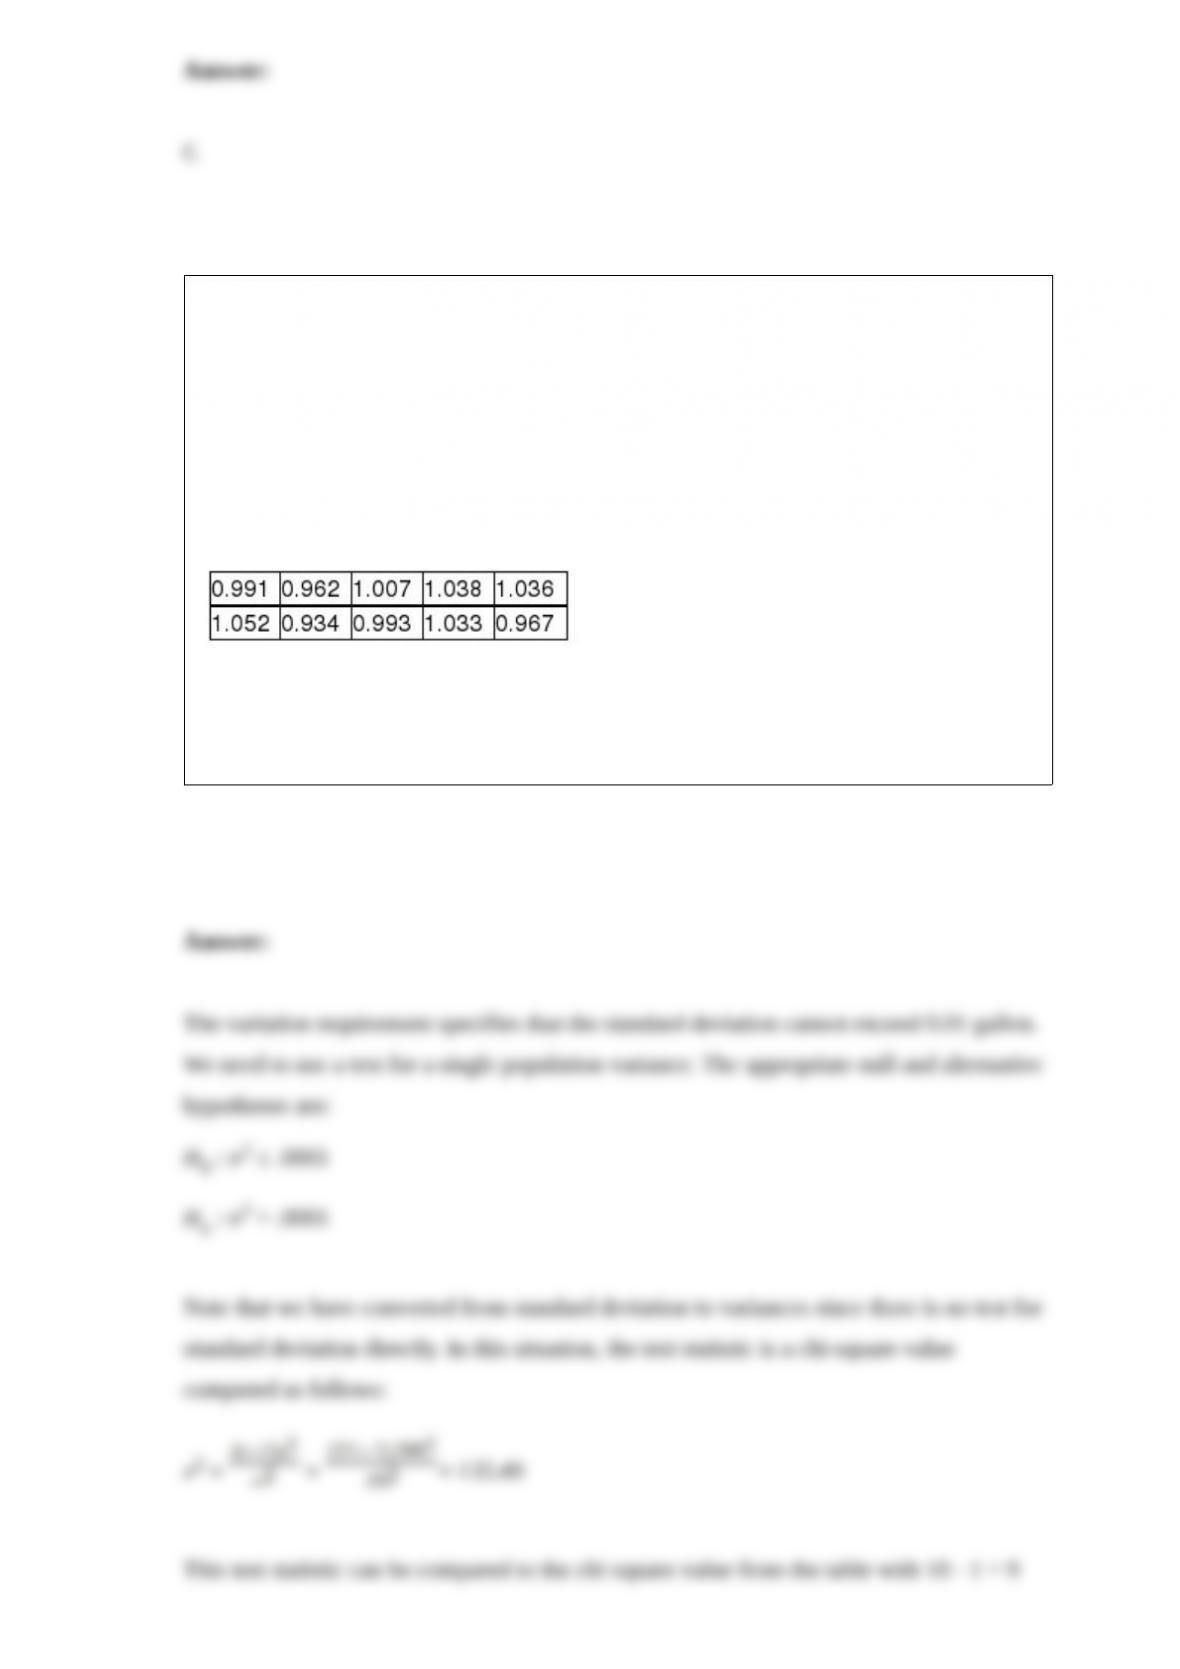
The Department of Weights and Measures in a southern state has the responsibility for
making sure that all commercial weighing and measuring devices are working properly.
For example, when a gasoline pump indicates that 1 gallon has been pumped, it is
expected that 1 gallon of gasoline will actually have been pumped. The problem is that
there is variation in the filling process. The state’s standards call for the mean amount of
gasoline to be 1.0 gallon with a standard deviation not to exceed 0.010 gallons.
Recently, the department came to a gasoline station and filled 10 cans until the pump
read 1.0 gallon. It then measured precisely the amount of gasoline in each can. The
following data were recorded:
Based on these data, what should the Department of Weights and Measures conclude if
it wishes to test whether the standard deviation exceeds 0.010 gallons or not, using a
0.05 level of significance?
If a continuous random variable is said to be exponentially distributed, what would be
the easiest way to reduce the standard deviation?
At the West-Side Drive-Inn, customers arrive at the rate of 10 every 30 minutes. The
time between arrivals is exponentially distributed. Based on this information, what is
the probability that the time between two customers arriving will exceed 6 minutes?
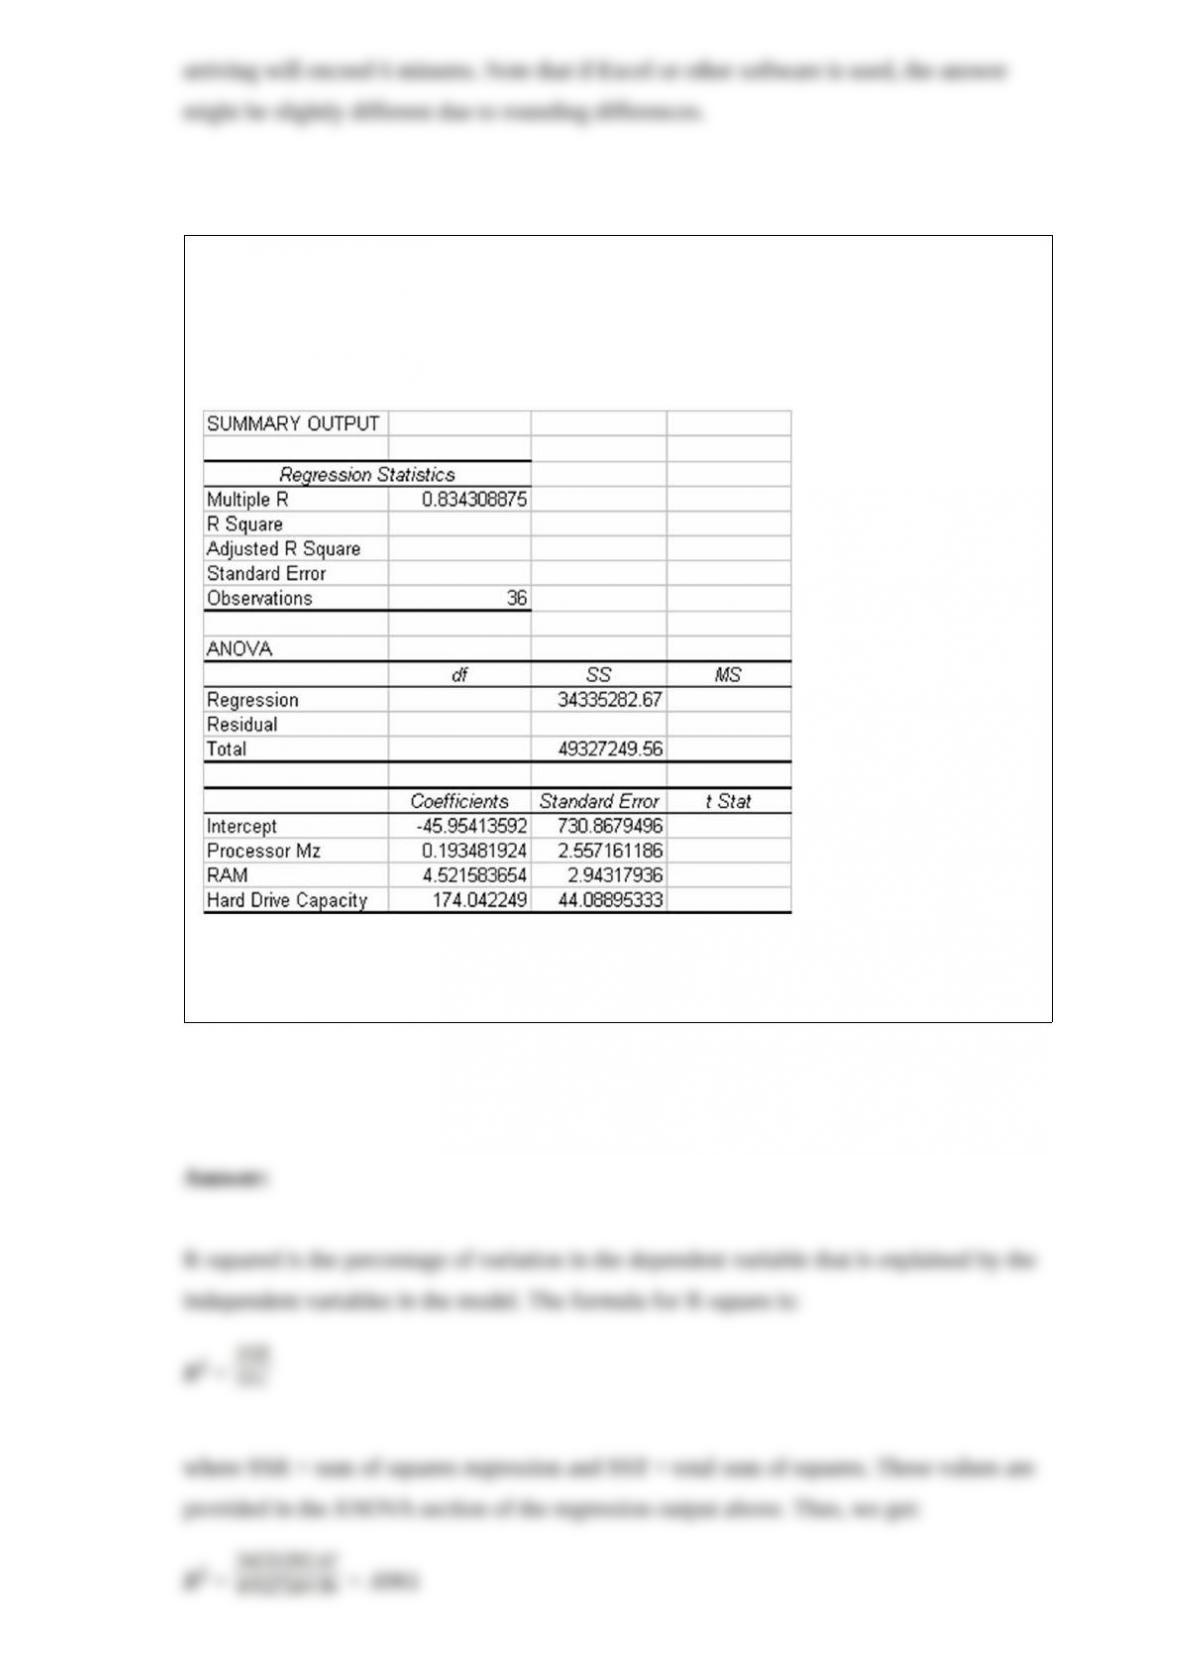
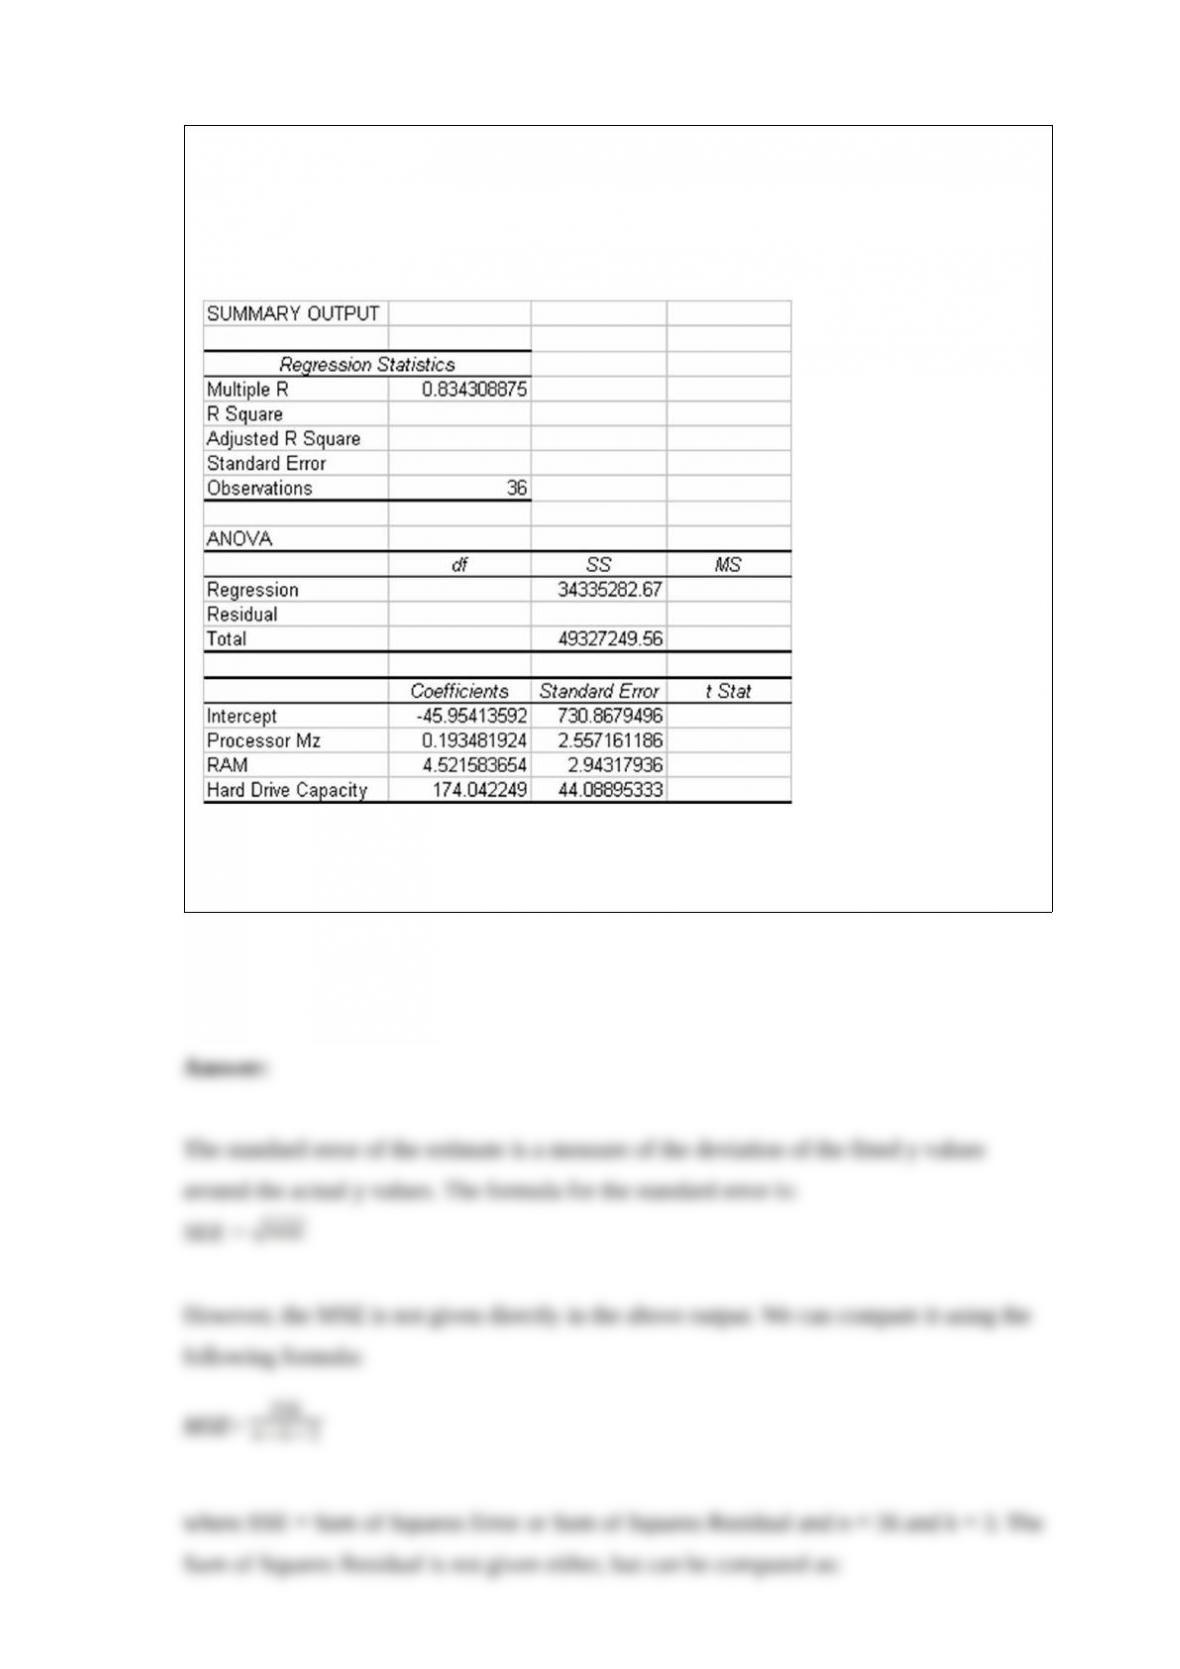
The following regression output is the result of a multiple regression application in
which we are interested in explaining the variation in retail price of personal computers
based on three independent variables, CPU speed, RAM, and hard drive capacity.
However, some of the regression output has been omitted.
Given this information and your knowledge of multiple regression, what is the adjusted
R-square value?
Explain what is meant by the concept of sampling distribution.
The following regression output is the result of a multiple regression application in
which we are interested in explaining the variation in retail price of personal computers
based on three independent variables, CPU speed, RAM, and hard drive capacity.
However, some of the regression output has been omitted.
Given this information and your knowledge of multiple regression, what is the value for
the standard error of the estimate?
Explain the difference between forward stepwise regression (standard stepwise),
forward selection, and all possible subsets regression approaches.
The produce manager for a large retail grocery store believes that an average head of
lettuce weighs more than 1.7 pounds. If she were to test this statistically, what would
the null and alternative hypotheses be and what is the research hypothesis?
Explain how to use the binomial distribution table when p, the probability of a success,
exceeds 0.50.
Consumer products are required by law to contain at least as much as the amount
printed on the package. For example a bag of potato chips that is labeled as 10 ounces
should contain at least 10 ounces. Assume that the standard deviation of the packaging
equipment yields a bag weight standard deviation of 0.2 ounces. Explain what average
bag weight must be used to achieve at least 97.5 percent of the bags having 10 or more
ounces in the bag. Assume the bag weight distribution is bell-shaped.
Explain the impact of the size of the sample on the shape of the sampling distribution.
Is there ever a reason why we might prefer to work with a sample rather than with an
entire population? Discuss.
Open the data file provided with the text called AirlinePassengers. Indicate the level of
data measurement for each variable in the data set.
Suppose it is known that the ages of all employees working for a very large computer
company is normally distributed with a mean of 44.2 and a standard deviation of 5.6
years. Given this information, discuss what the sampling distribution for looks like?
What is meant by the term balanced design in an analysis of variance application?