
The proportion of customers that rate their latest airline experience as “excellent” is an
example of _______________.
A) secondary data
B) qualitative data
C) descriptive statistics
D) inferential statistics
Increasing the number of periods in a simple moving average forecast causes the
forecasting technique to be less responsive to changes in the historical data.
The ________ indicates both the strength and direction of the linear relationship
between the independent and dependent variables.
A) regression intercept
B) regression slope
C) coefficient of determination
D) correlation coefficient
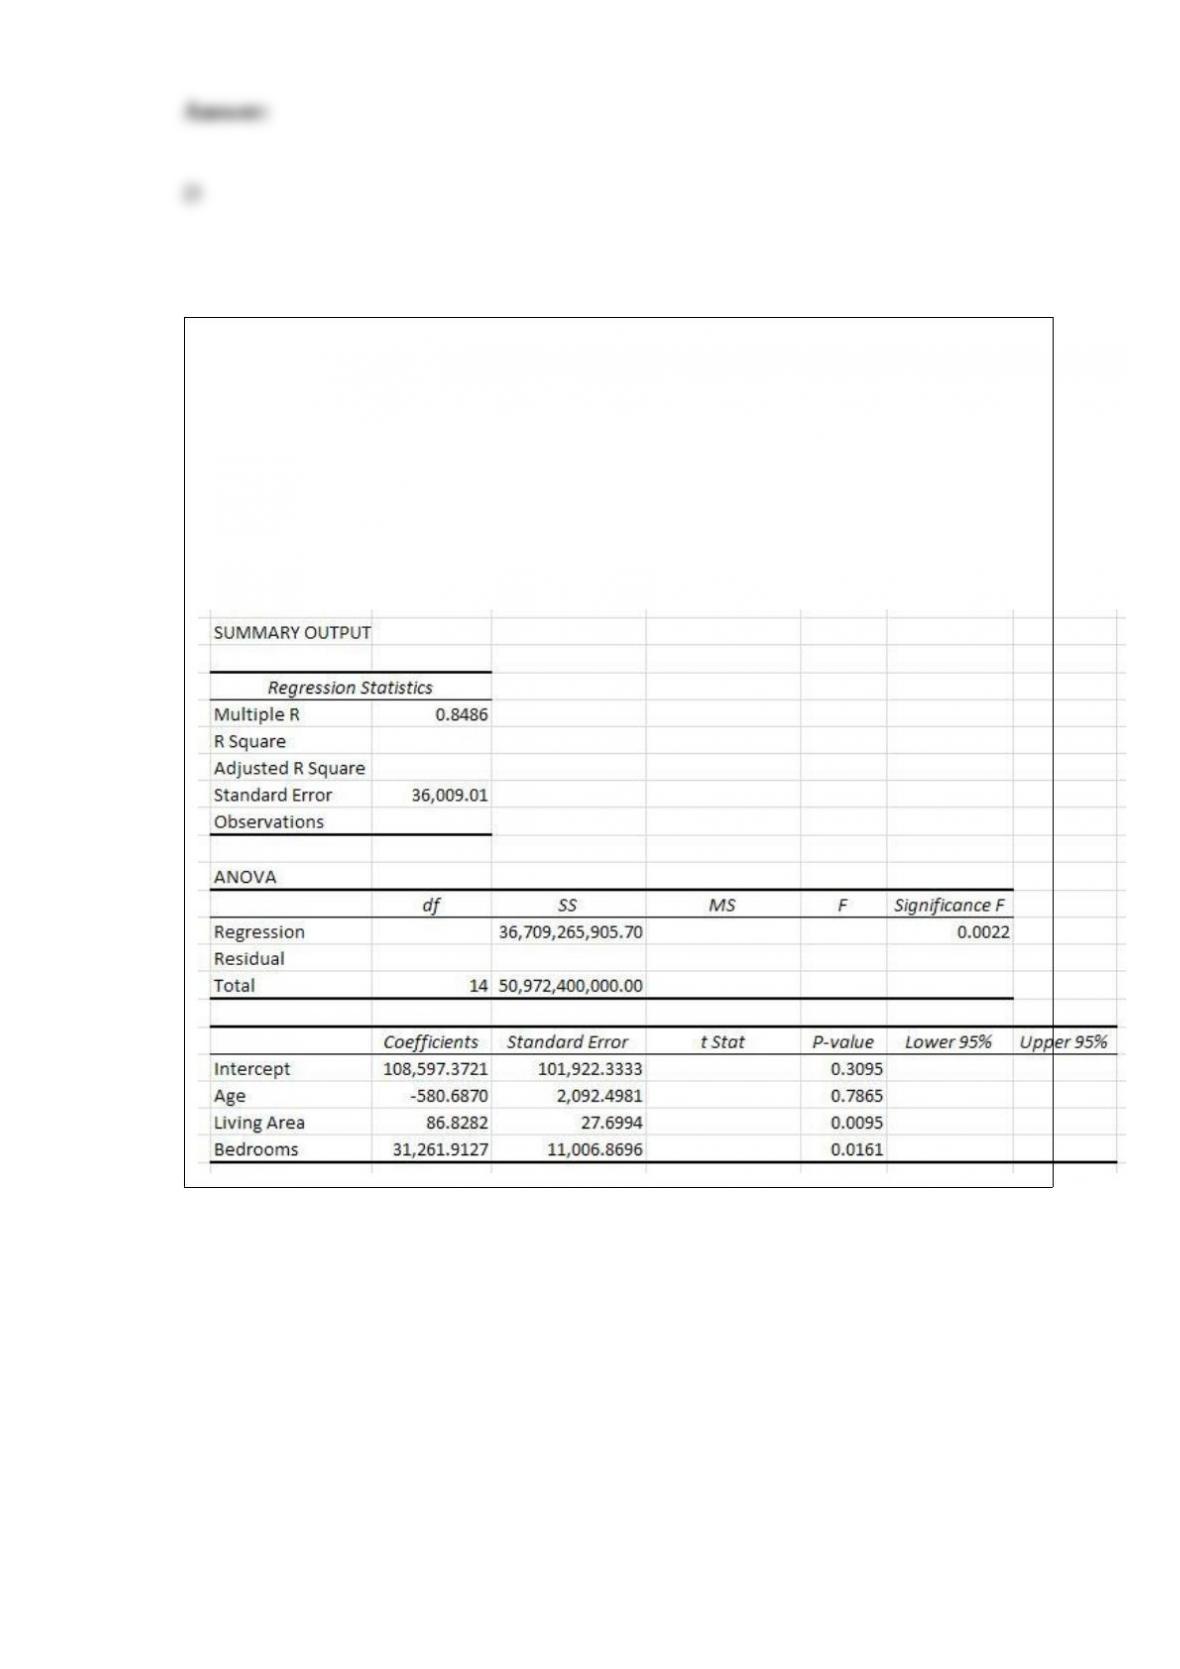
Use the following information to answer the question(s) below.
A home appraisal company would like to develop a regression model that would predict
the selling price of a house based on the age of the house in years (Age), the living area
of the house in square feet (Living Area) and the number of bedrooms (Bedrooms). The
following Excel output shows the partially completed regression output from a random
sample of homes that have recently sold.
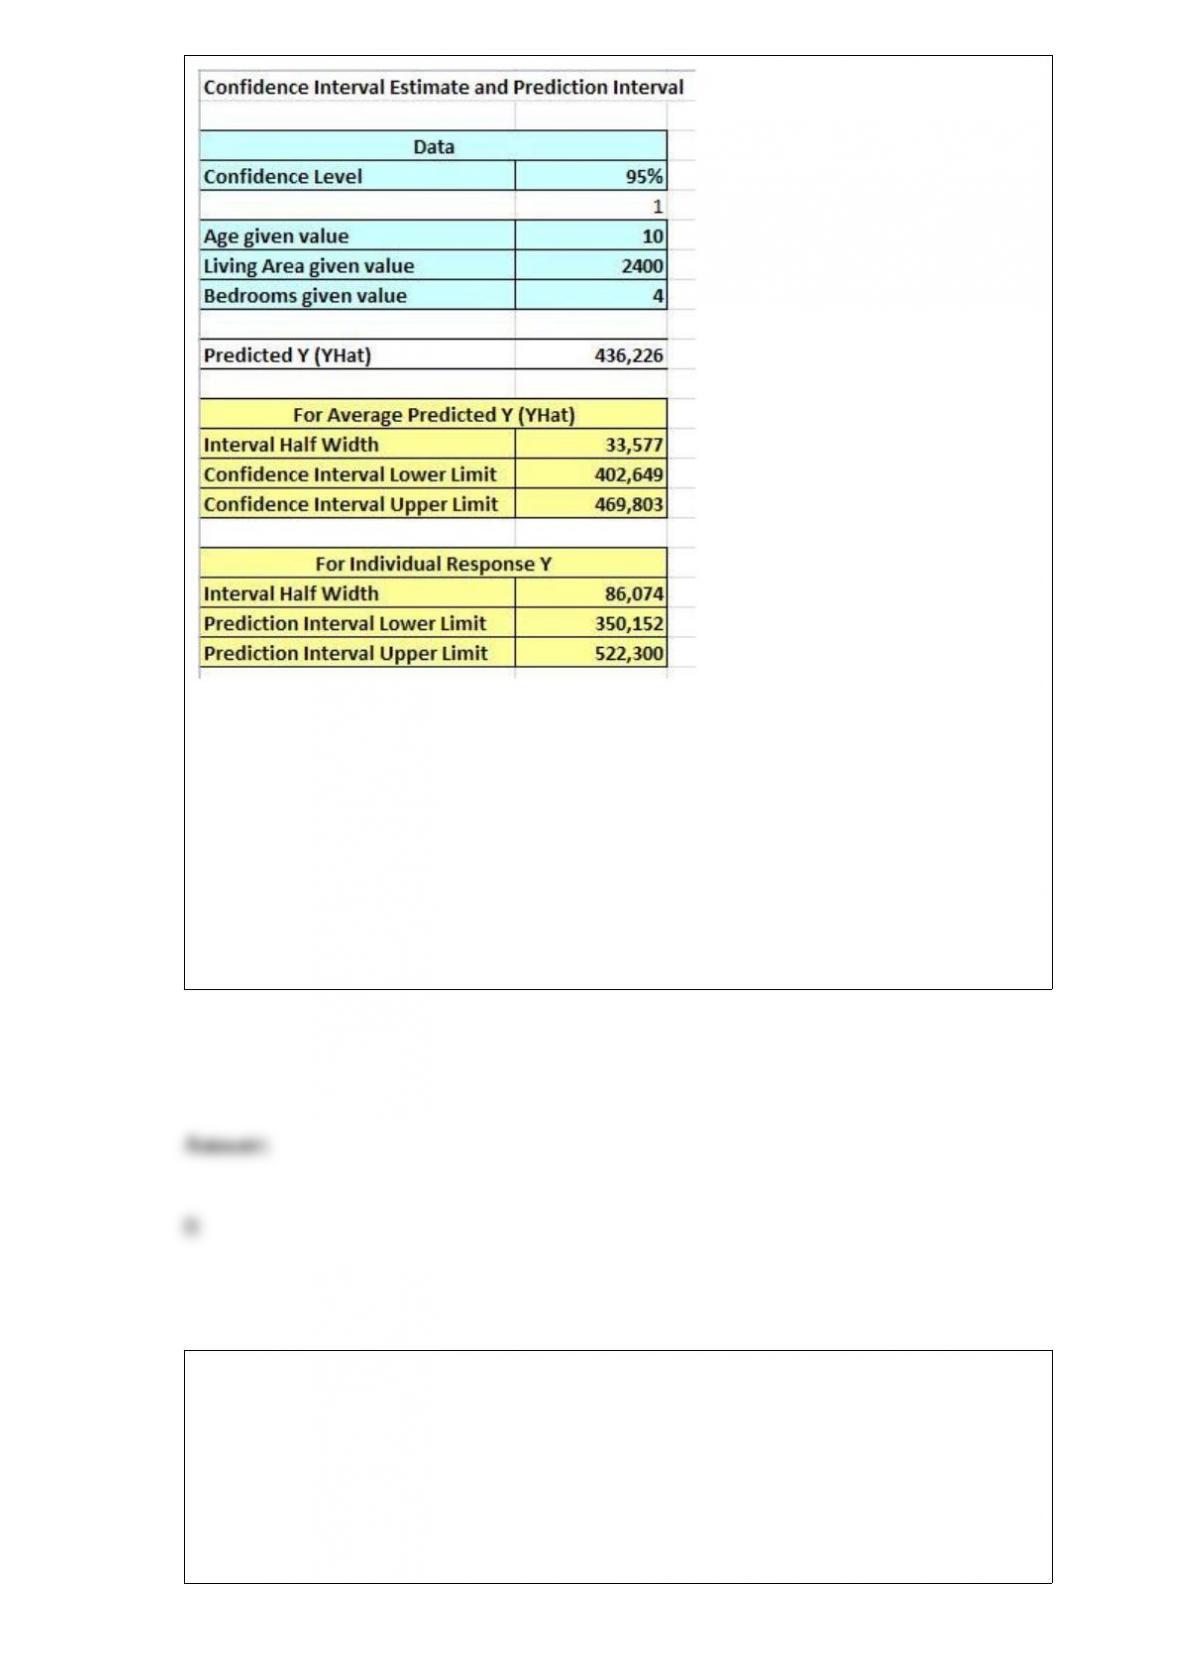
The mean square regression for this model is ________.
A) 1,296,648,554
B) 12,236,421,969
C) 14,263,134,094
D) 36,709,265,906
________ regression begins with all of the independent variables in the model.
Variables that are not significant leave the model one at a time and are never allowed to
return.
A) Best subsets
B) General stepwise

C) Backward elimination
D) Forward selection
A survey conducted last year asked employed adults from age 25 to 70 if they plan to
keep a foot in the working world after retirement. Thirty-three percent of the
respondents answered “very likely”. A random sample of 75 adults from this age group
was asked the same question. Using the normal approximation to the binomial
distribution, what is the probability that 21 or fewer adults from this sample would very
likely plan to keep a foot in the working world after retirement?
A) 0.1075
B) 0.2119
C) 0.3192
D) 0.4721
The ________ graphs the midpoint of each class as a line rather than a column.
A) bar chart
B) histogram
C) scatter plot
D) percentage polygon
Use the following information to answer the question(s) below.
Ford would like to develop a regression model that would predict the number of cars
sold per month by a dealership employee based on the employee’s number of years of
sales experience (Exp), the employee’s weekly base salary before commissions (Salary),
and the education level of the employee. There are three levels of education in the sales
forcehigh school degree, associate’s degree, and bachelor’s degree. The following
dummy variables have been defined.
The following Excel output shows the partially completed regression output from a
random sample of employees from the previous month.
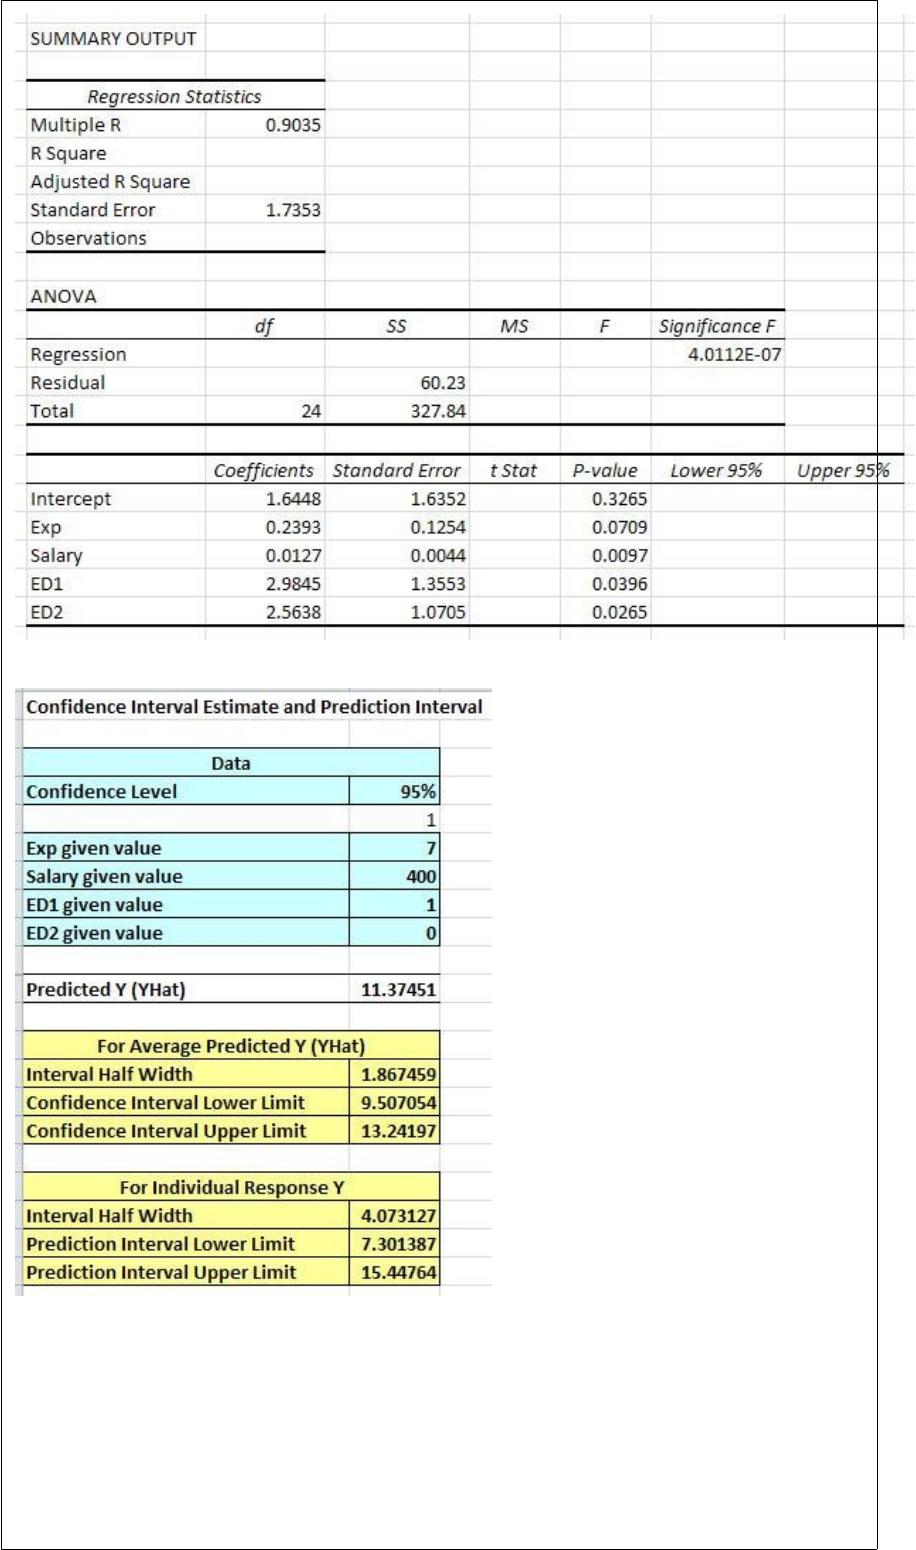
The degrees of freedom for the sum of squares error are ________.
A) 4
B) 20
C) 24

D) 25
A professor would like to test the hypothesis that the average number of minutes that a
student needs to complete a statistics exam is equal to 45 minutes. A random sample of
40 students was selected and the number of minutes needed to complete the exam was
recorded. Assume that the standard deviation for the population of students taking the
exam is 5.7 minutes and the true population mean for taking an exam is 45.8 minutes.
Using α = 0.05, beta equals ________.
A) 0.1987
B) 0.4215
C) 0.6670
D) 0.8577
Which one of the following statements is not true regarding the characteristics of the
Student’s t-distribution?
A) It is bell-shaped and symmetrical around the mean of the distribution.
B) The area under the curve is equal to 1.0.
C) The shape of the Student’s t-distribution is narrower than the shape of the normal
distribution.
D) As the number of degrees of freedom increases, the shape of the
Student’st-distribution becomes similar to the normal distribution.
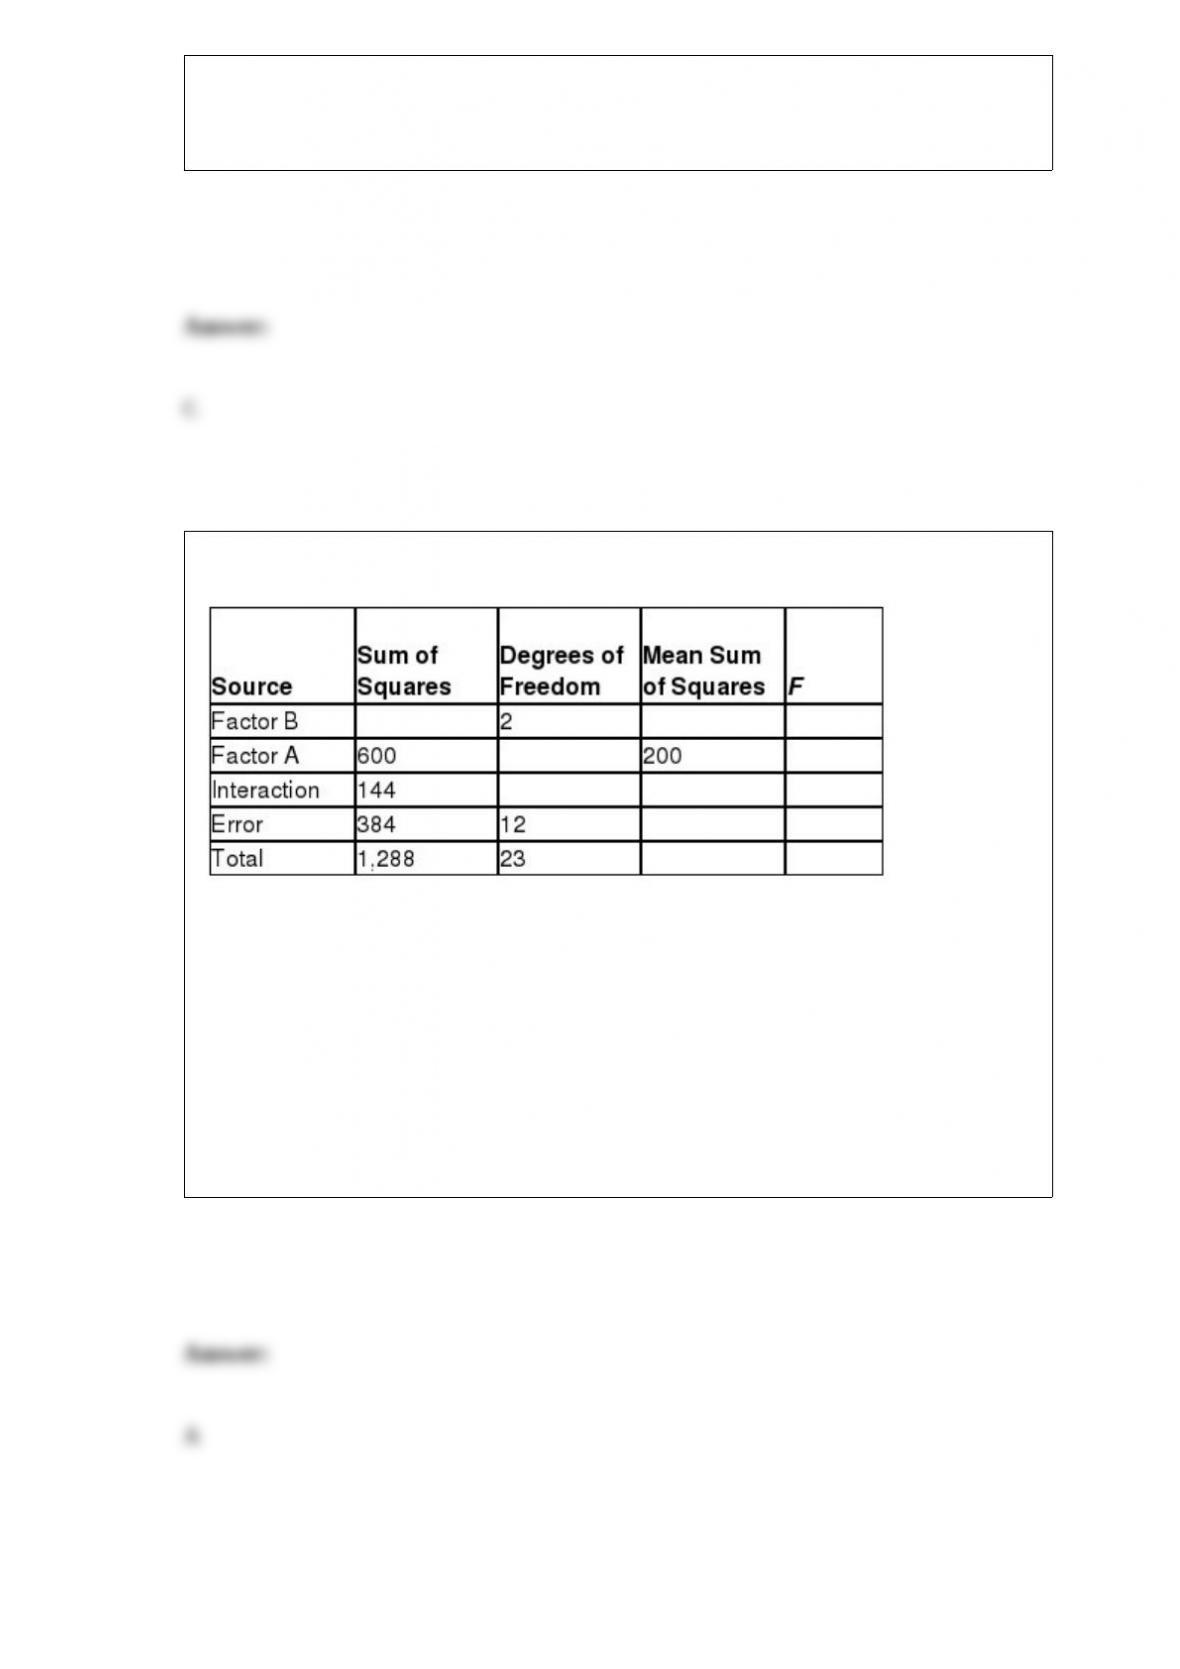
Consider the partially completed two-way ANOVA summary table.
The interaction test statistic for this ANOVA procedure is ________.
A) 0.75
B) 2.56
C) 4.19
D) 4.80
The number on baseball players’ uniforms would be an example of _________ data.
A) nominal
B) ordinal
C) interval
D) ratio
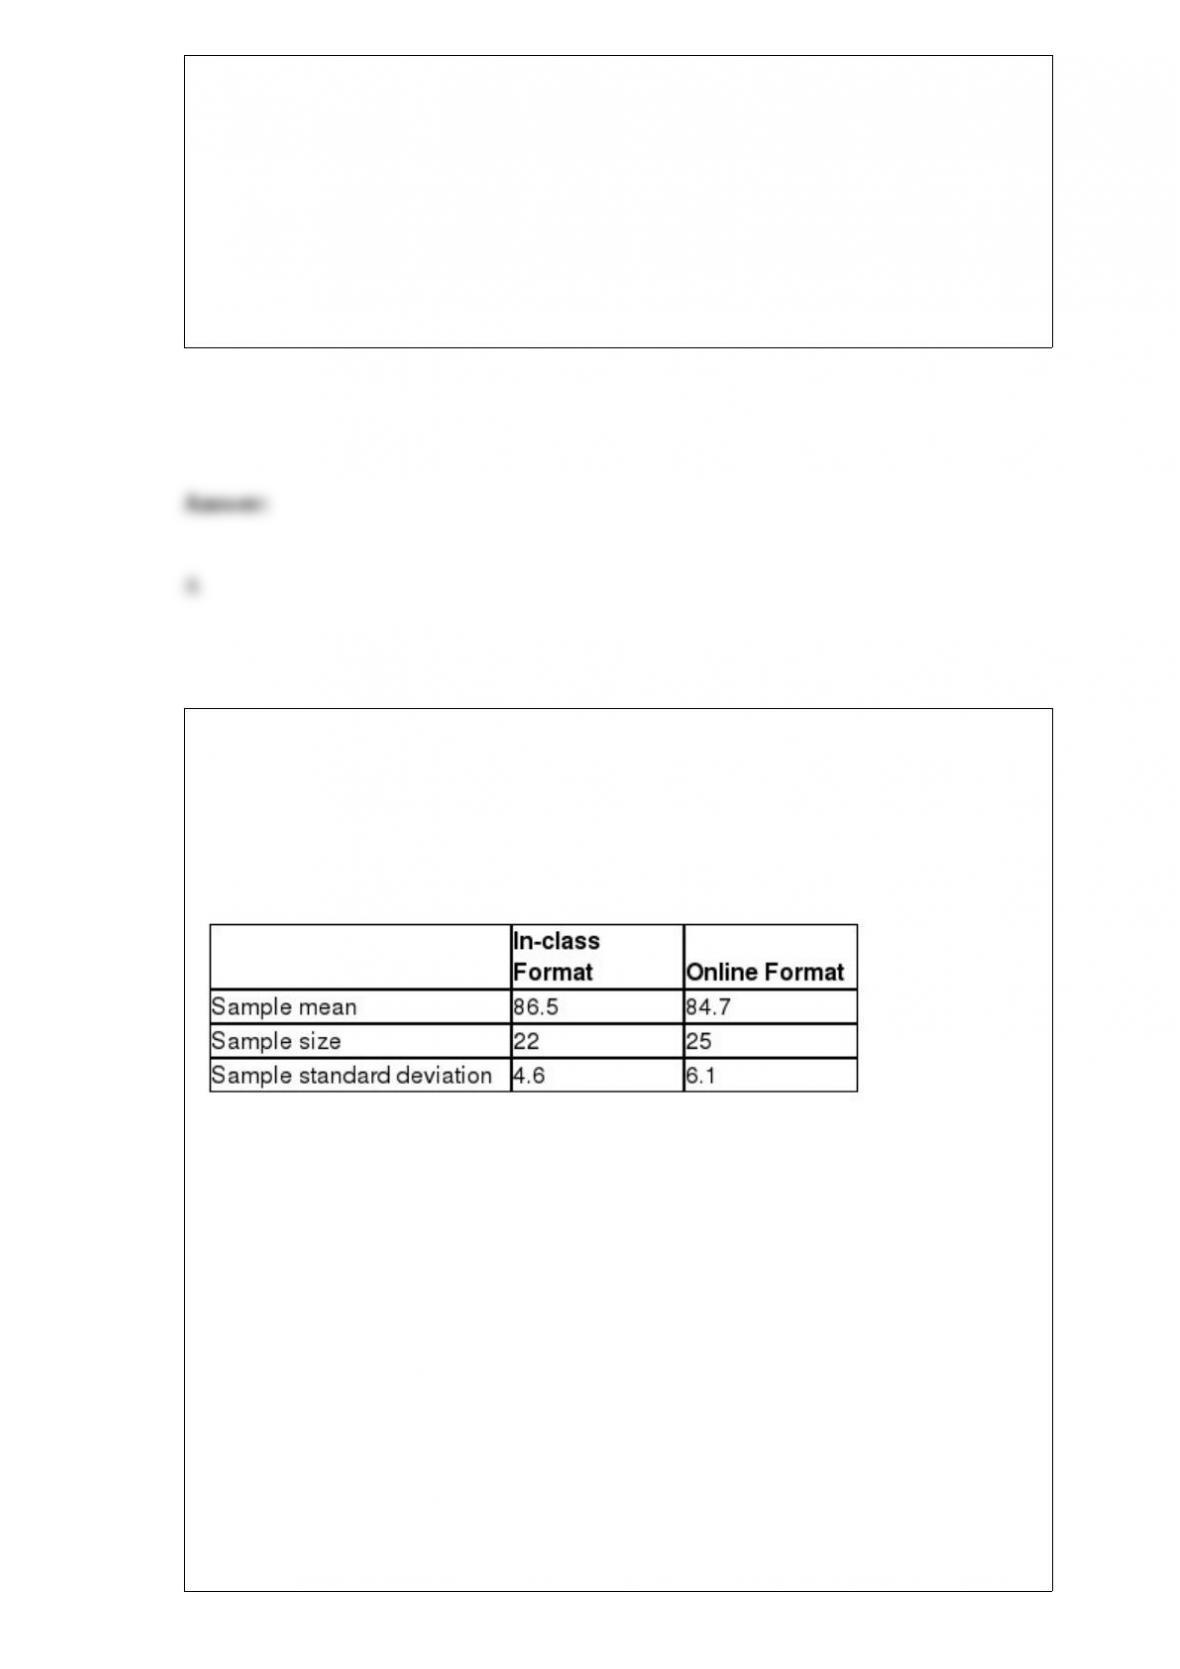
State University offers several sections of a Business Statistics course in an in-class and
online format. Both formats are administered the same final exam each year. You have
been assigned to test the hypothesis that the average final exam score of in-class
students is different from the average final exam score of online students. The following
data summarizes the sample statistics for the final exam scores for students from each
format. Assume that the population variances are unequal.
If Population 1 is defined as in-class format and Population 2 is defined as online
format, and using α = 0.05, which one of the following statements is true?
A) Because the p-value is less than α, you can conclude that the average final exam
score of in-class students is equal to the average final exam score of online students.
B) Because the p-value is greater than α, you can conclude that the average final exam
score of in-class students is different from the average final exam score of online
students.
C) Because the p-value is greater than α, you cannot conclude that the average final
exam score of in-class students is different from the average final exam score of online
students.
D) Because the p-value is less than α, you cannot conclude that the average final exam
score of in-class students is different from the average final exam score of online
students.
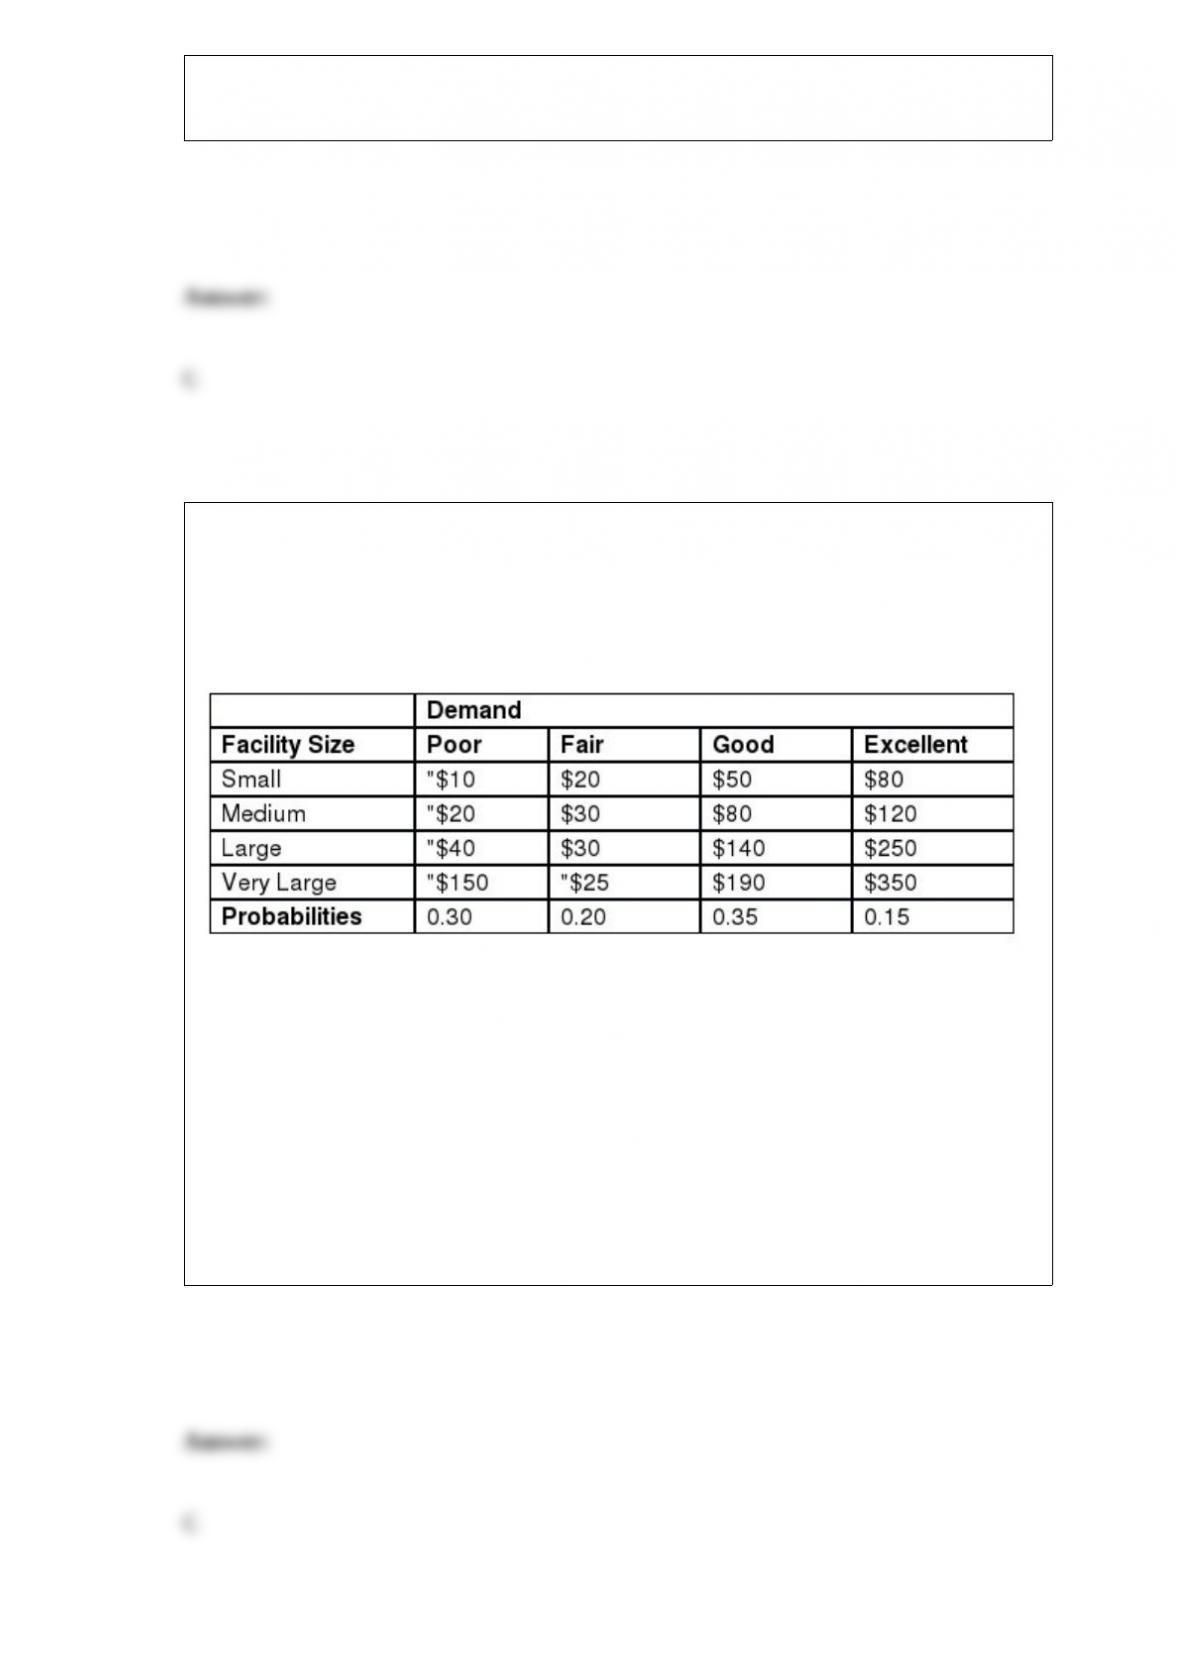
Scott has decided to invest in constructing and operating a new sandwich shop and
needs to decide how large to build this new facility. The annual profit, including the
depreciated investment, will depend on the demand for his products. The following
decision table shows the payoffs, in thousands of dollars, for various combinations of
facility size and demand along with Scott’s estimates for each demand level.
The expected value under perfect information (EVPI), in thousands of dollars, is
_________.
A) $29.00
B) $34.00
C) $41.50
D) $48.50

Travelocity would like to test if the average roundtrip airfare between New York and
London is less than $1,400. A Type I error would occur if Travelocity concludes that the
average airfare is __________________________________________.
A) equal to $1,400 when, in reality, the average airfare is not equal $1,400 or more
B) not equal to $1,400 when, in reality, the average airfare is equal to $1,400
C) $1,400 or more when, in reality, the average airfare is less than $1,400
D) less than $1,400 when, in reality, the average airfare is $1,400 or more
________ data use numerical values to describe something of interest either by
measuring it or counting it.
A) Primary
B) Secondary
C) Quantitative
D) Qualitative
Use the information below to answer the following question(s).
The following decision tree is partially completed for a company that is deciding to
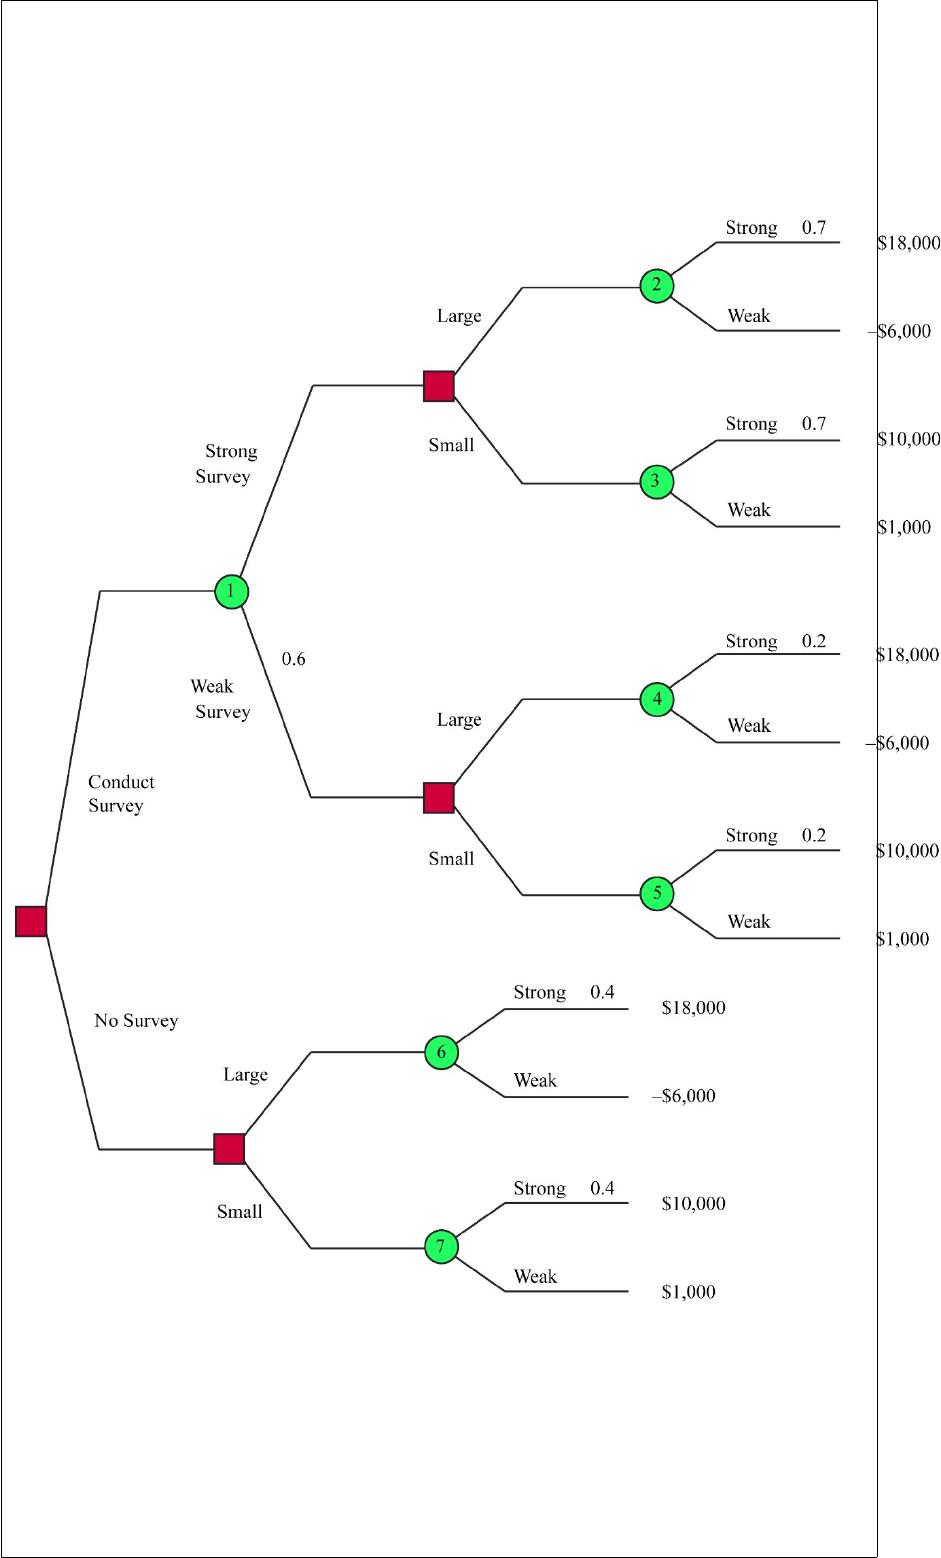
build a large or small facility for a new product that will face demand that is strong or
weak. The company has an option to perform a market survey that will cost $4,000 that
will predict a strong or weak market. The payoffs for each combination of facility size
and demand are also shown.
Given the survey will predict a strong market, the expected monetary value of building
a large facility is ________.
A) $2,800
B) $7,300
C) $10,800
D) $12,300
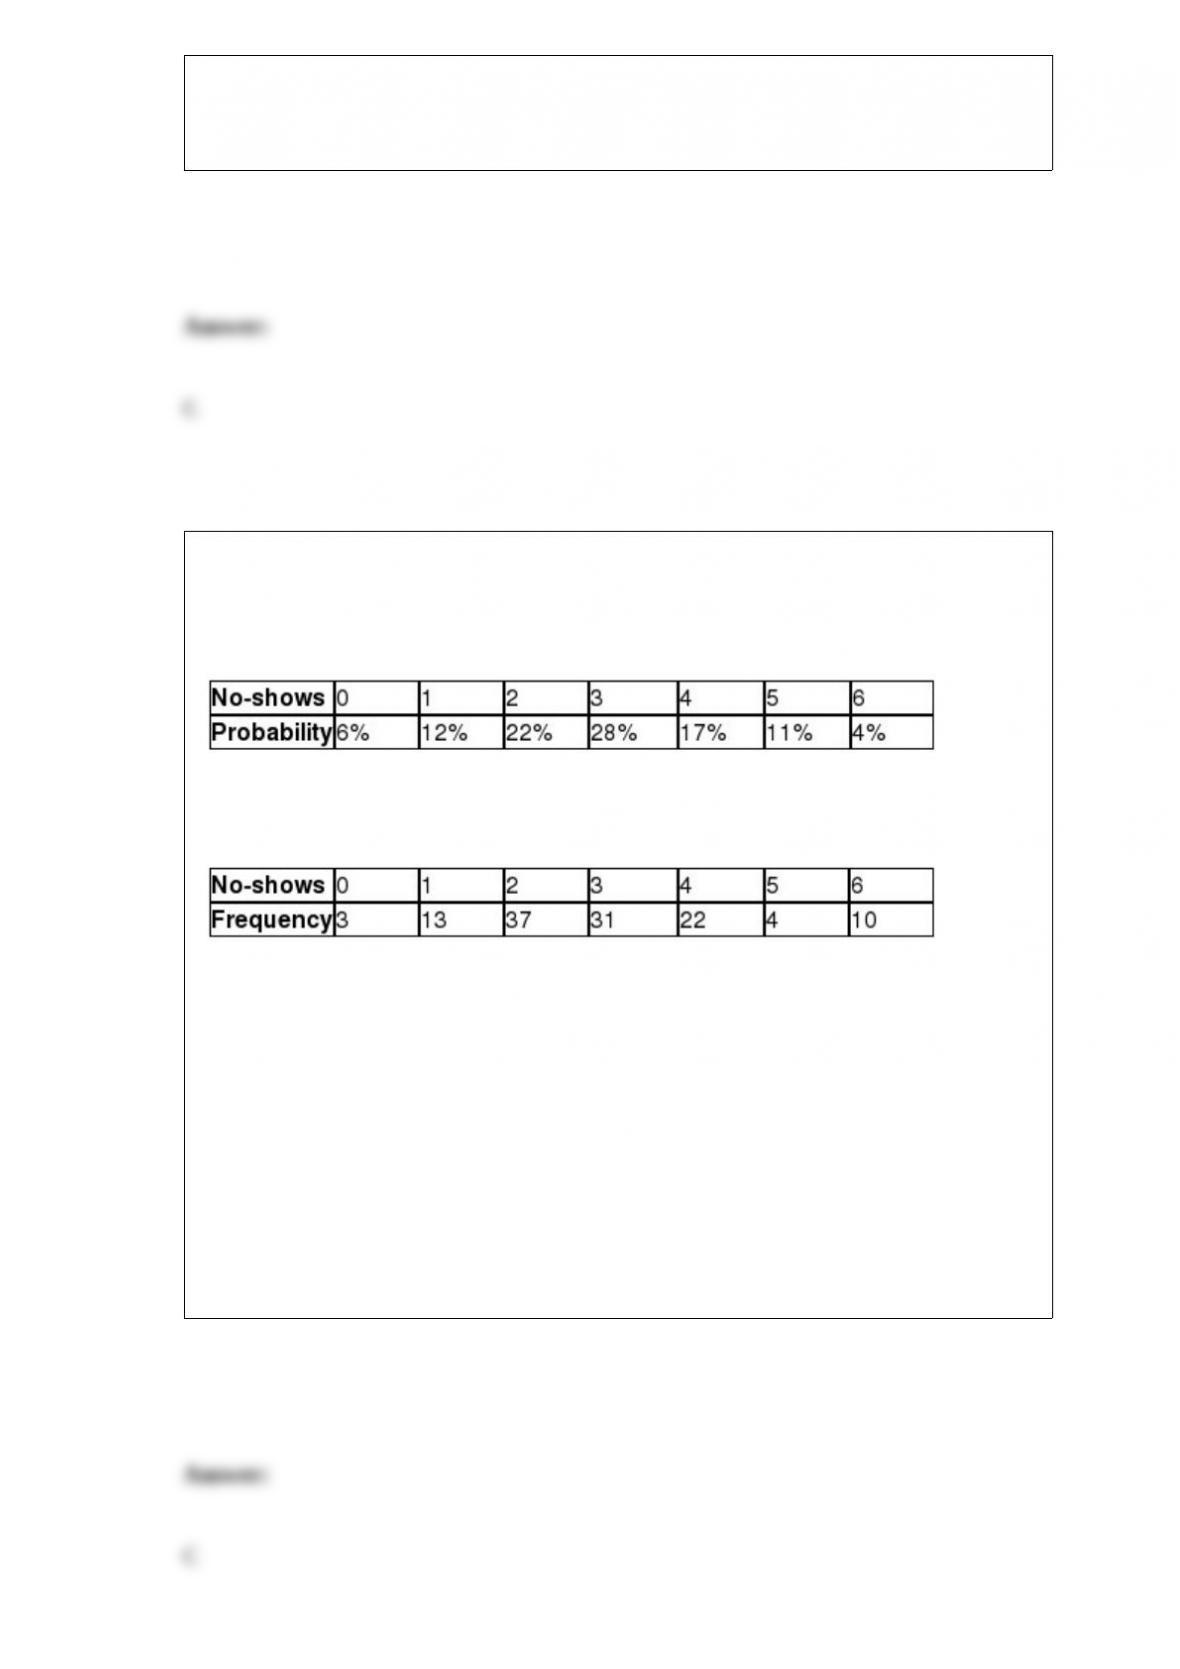
The airline industry defines no-shows as passengers who have purchased a ticket but
fail to arrive at the gate on time for departure. Southwest Airlines operates many flights
from Philadelphia to Dallas and experienced the following no-show probability
distribution last year.
The following data represent the number of no-shows that occurred on a random sample
of 120 flights between these two cities this year.
Southwest Airlines would like to know if the probability distribution of no-shows has
changed between last year and this year on flights between these two cities using α =
0.05. The expected frequency of one no-show for this sample is ________.
A) 5.0
B) 11.3
C) 14.4
D) 23.9

Scotland has been a member of the United Kingdom since the 1707 Act of Union. In a
recent poll, 38% of Scots would vote in favor of leaving the U.K. A random sample of
135 Scots was selected. What is the probability that between 50 and 60 of them were in
favor of leaving the U.K.?
A) 0.3066
B) 0.5318
C) 0.7245
D) 0.8810
Use the following information to answer the question(s) below.
The National Football League has developed a regression model to predict the number
of wins during a season for a team using the following independent variables:
•Average points per game during the season (PPG)
•Average number of penalties committed per game during the season (PEN)
•Turnover differential during the season (TO)
Turnover differential is defined as the number of times the team took the ball away from
their opponent with a turnover minus the number of times the team gave the ball away to
their opponent with a turnover. For example, if TO = +5, the team had five more
takeaways than giveaways. If TO = “7, the team had seven more giveaways than
takeaways during the season.
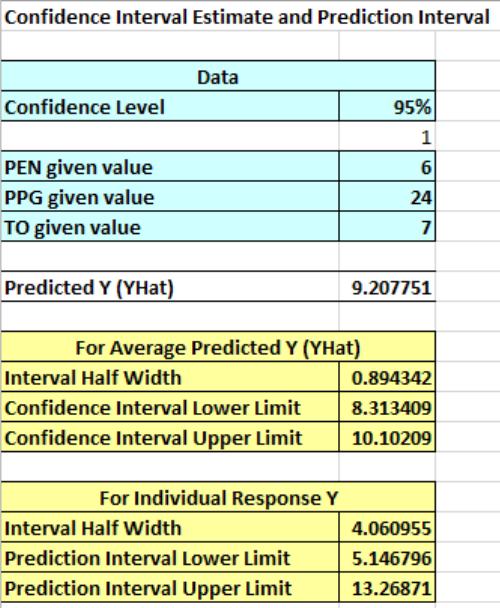
The following Excel output shows the partially completed regression output from a
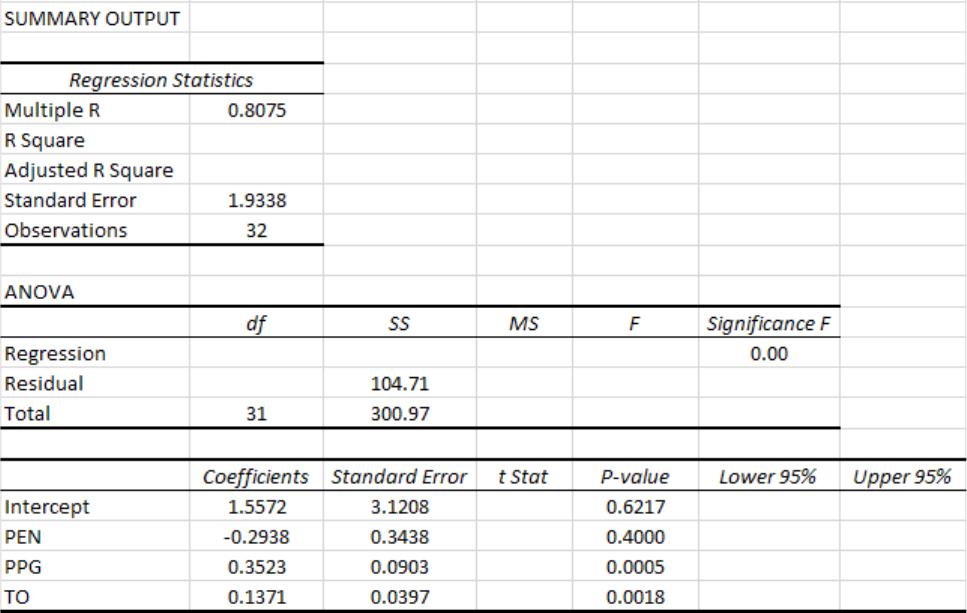
random season.
Which one of the following statements describes the results of the hypothesis test for the
overall regression model using α = 0.05?
A) Because the test statistic is greater than the critical value, we reject the null hypothesis
and conclude that there is a relationship between the dependent variable and the
independent variables.
B) Because the test statistic is greater than the critical value, we fail to reject the null
hypothesis and conclude that there is a relationship between the dependent variable and the
independent variables.
C) Because the test statistic is less than the critical value, we fail to reject the null
hypothesis and conclude that there is no relationship between the dependent variable and
the independent variables.
D) Because the test statistic is less than the critical value, we reject the null hypothesis and
conclude that there is no relationship between the dependent variable and the independent
variables.
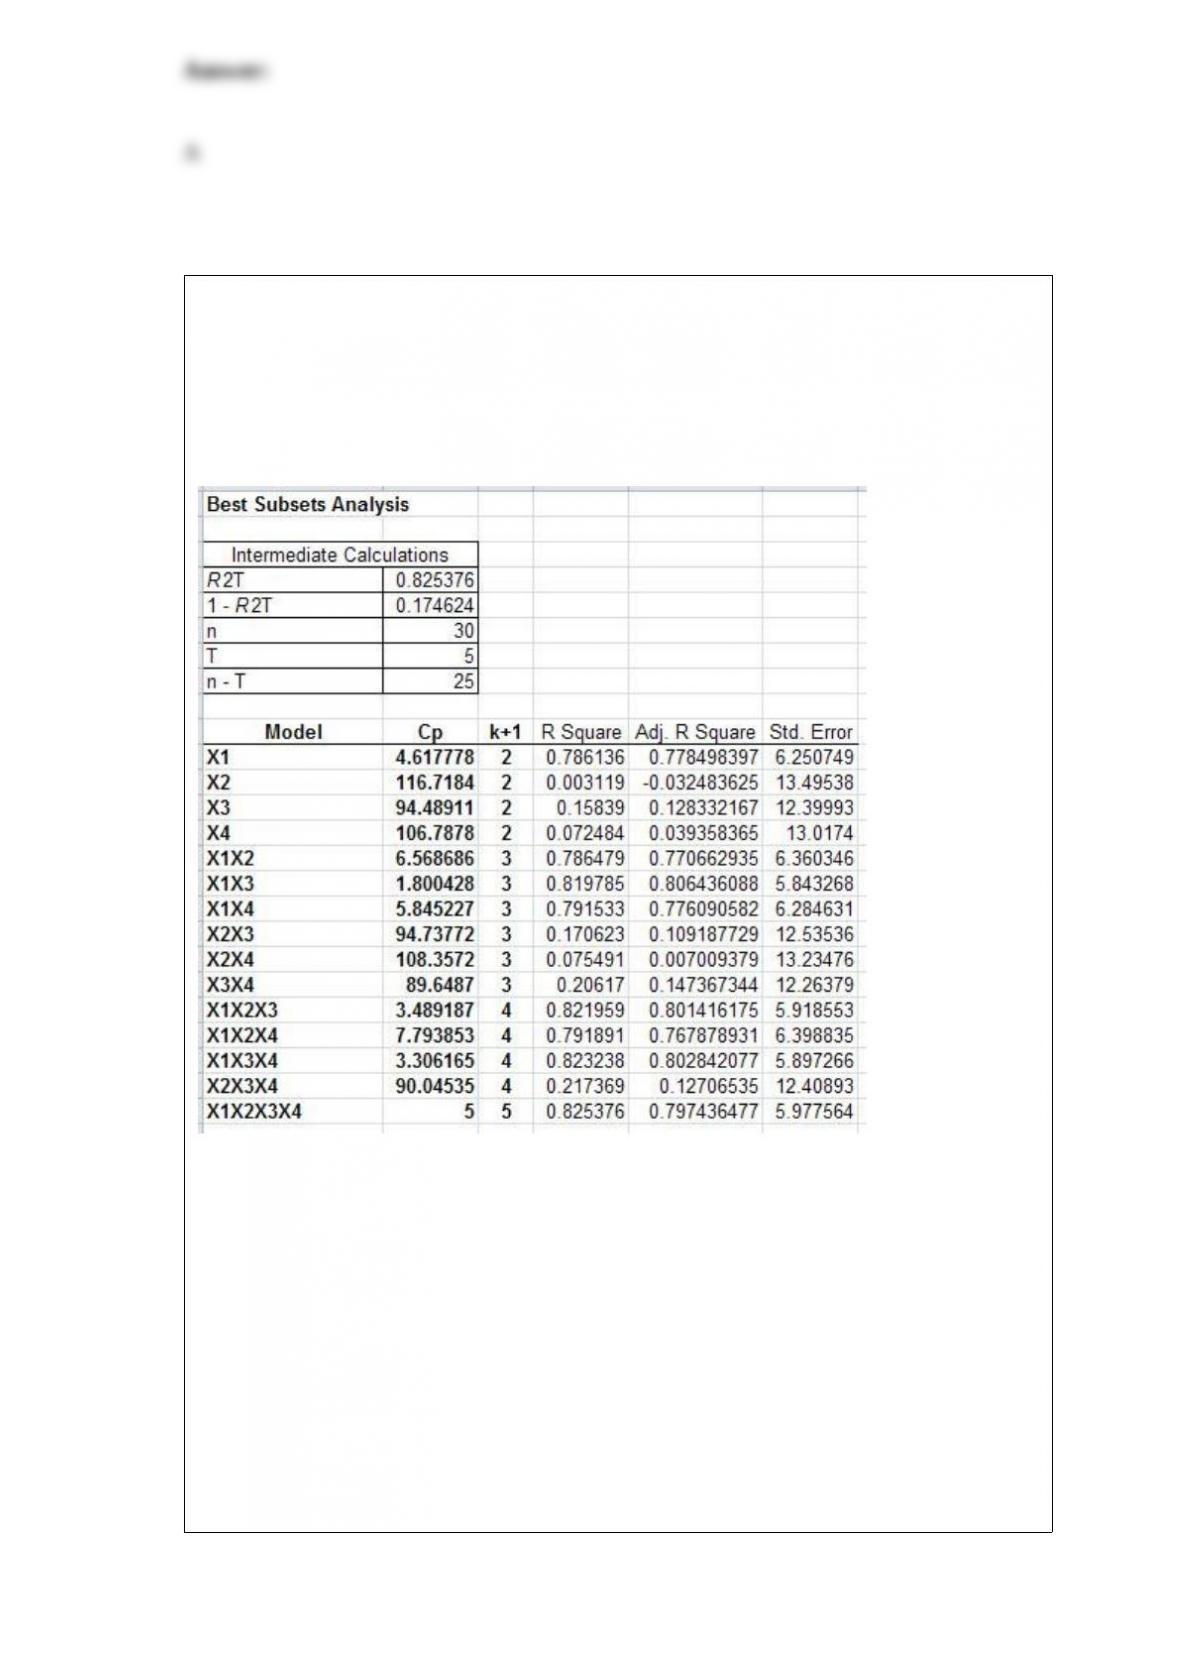
The National Basketball Association (NBA) would like to develop a multiple regression
model that would predict the number of wins for a team during the season. The
following independent variables were considered for the model: points scored per game
(X1), turnovers per game (X2), rebounds per game (X3), and steals per game (X4). The
following table shows the results of a best subsets regression procedure.
The set of independent variables that would be the most appropriate to predict wins per
season is
__________________________________________________.
A) points scored per game, turnovers per game, rebounds per game, and steals per game
B) points scored per game and rebounds per game
C) turnovers per game and rebounds per game
D) turnovers per game and steals per game
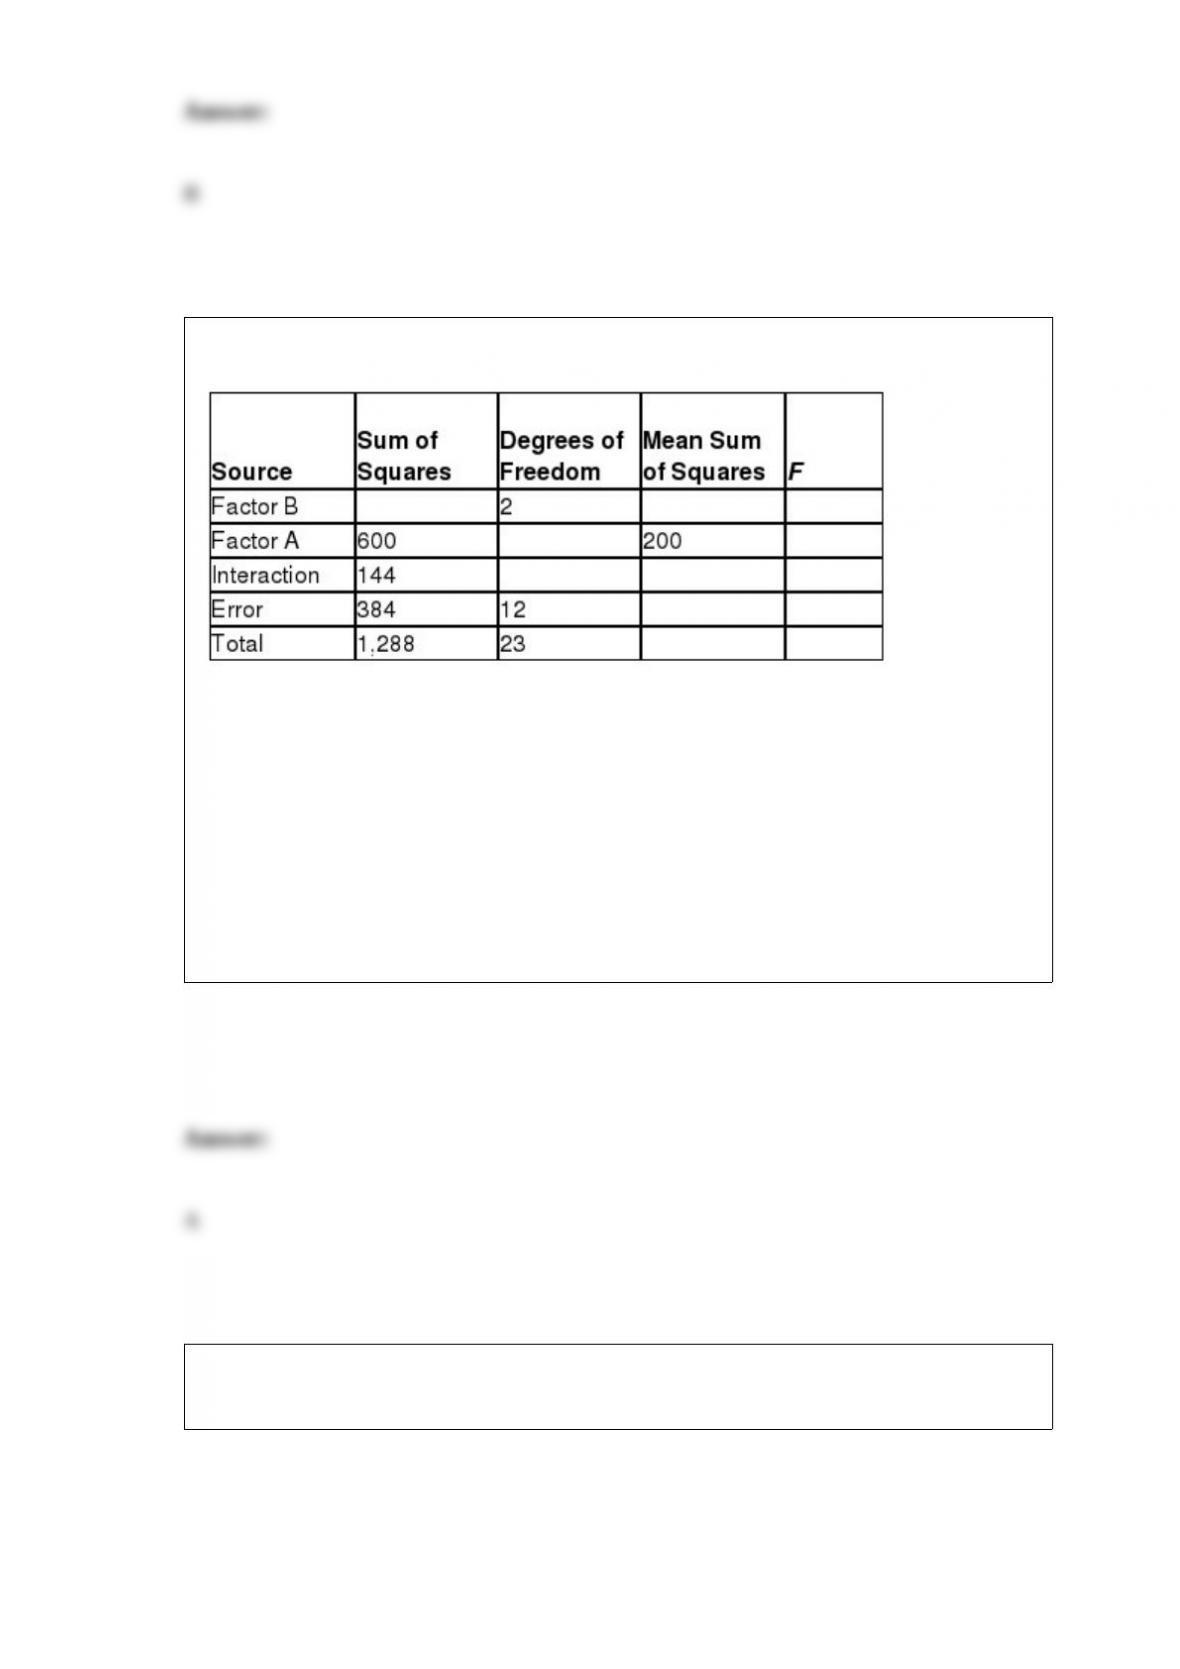
Consider the partially completed two-way ANOVA summary table.
The mean sum of squares for Factor B for this ANOVA procedure is _____.
A) 80
B) 150
C) 220
D) 270
The following distribution shows the frequency of daily revenue for an Italian
restaurant in Wilmington, Delaware.
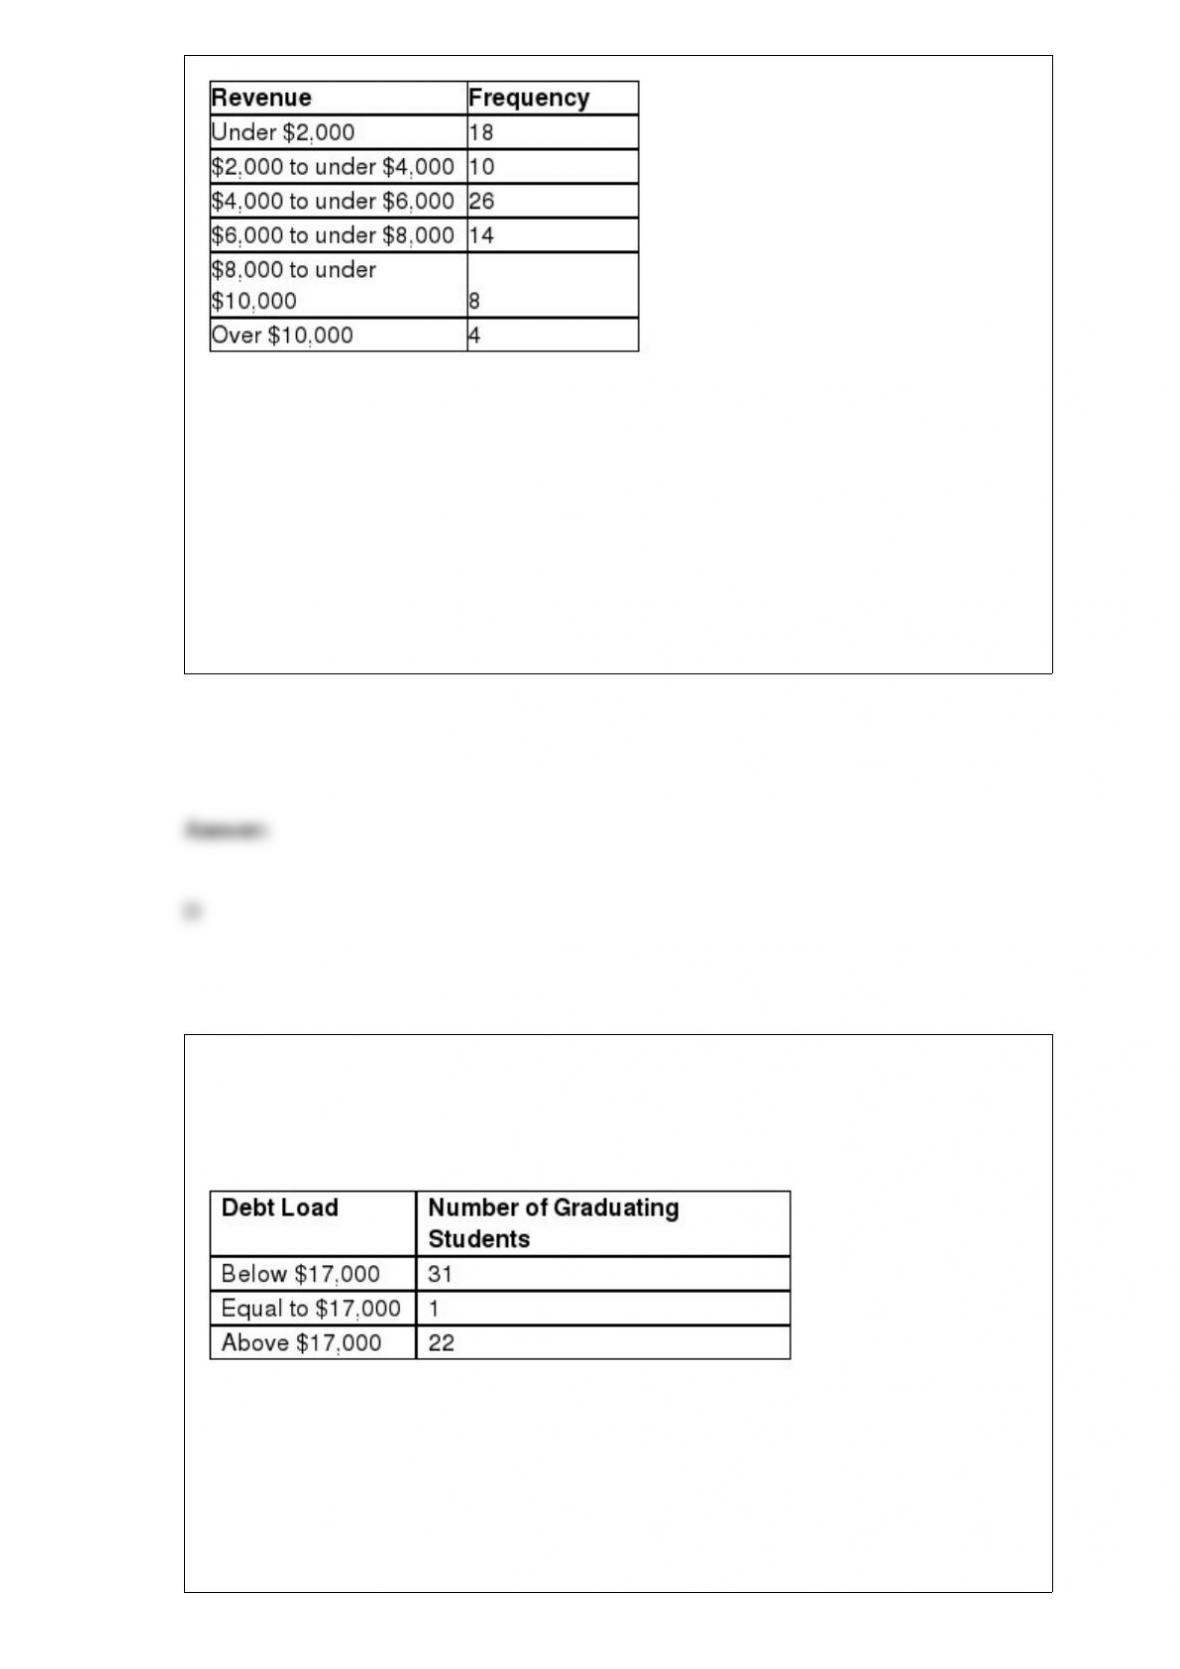
What is the width of each class for this distribution?
A) $10,000
B) $8,000
C) $5,000
D) $2,000
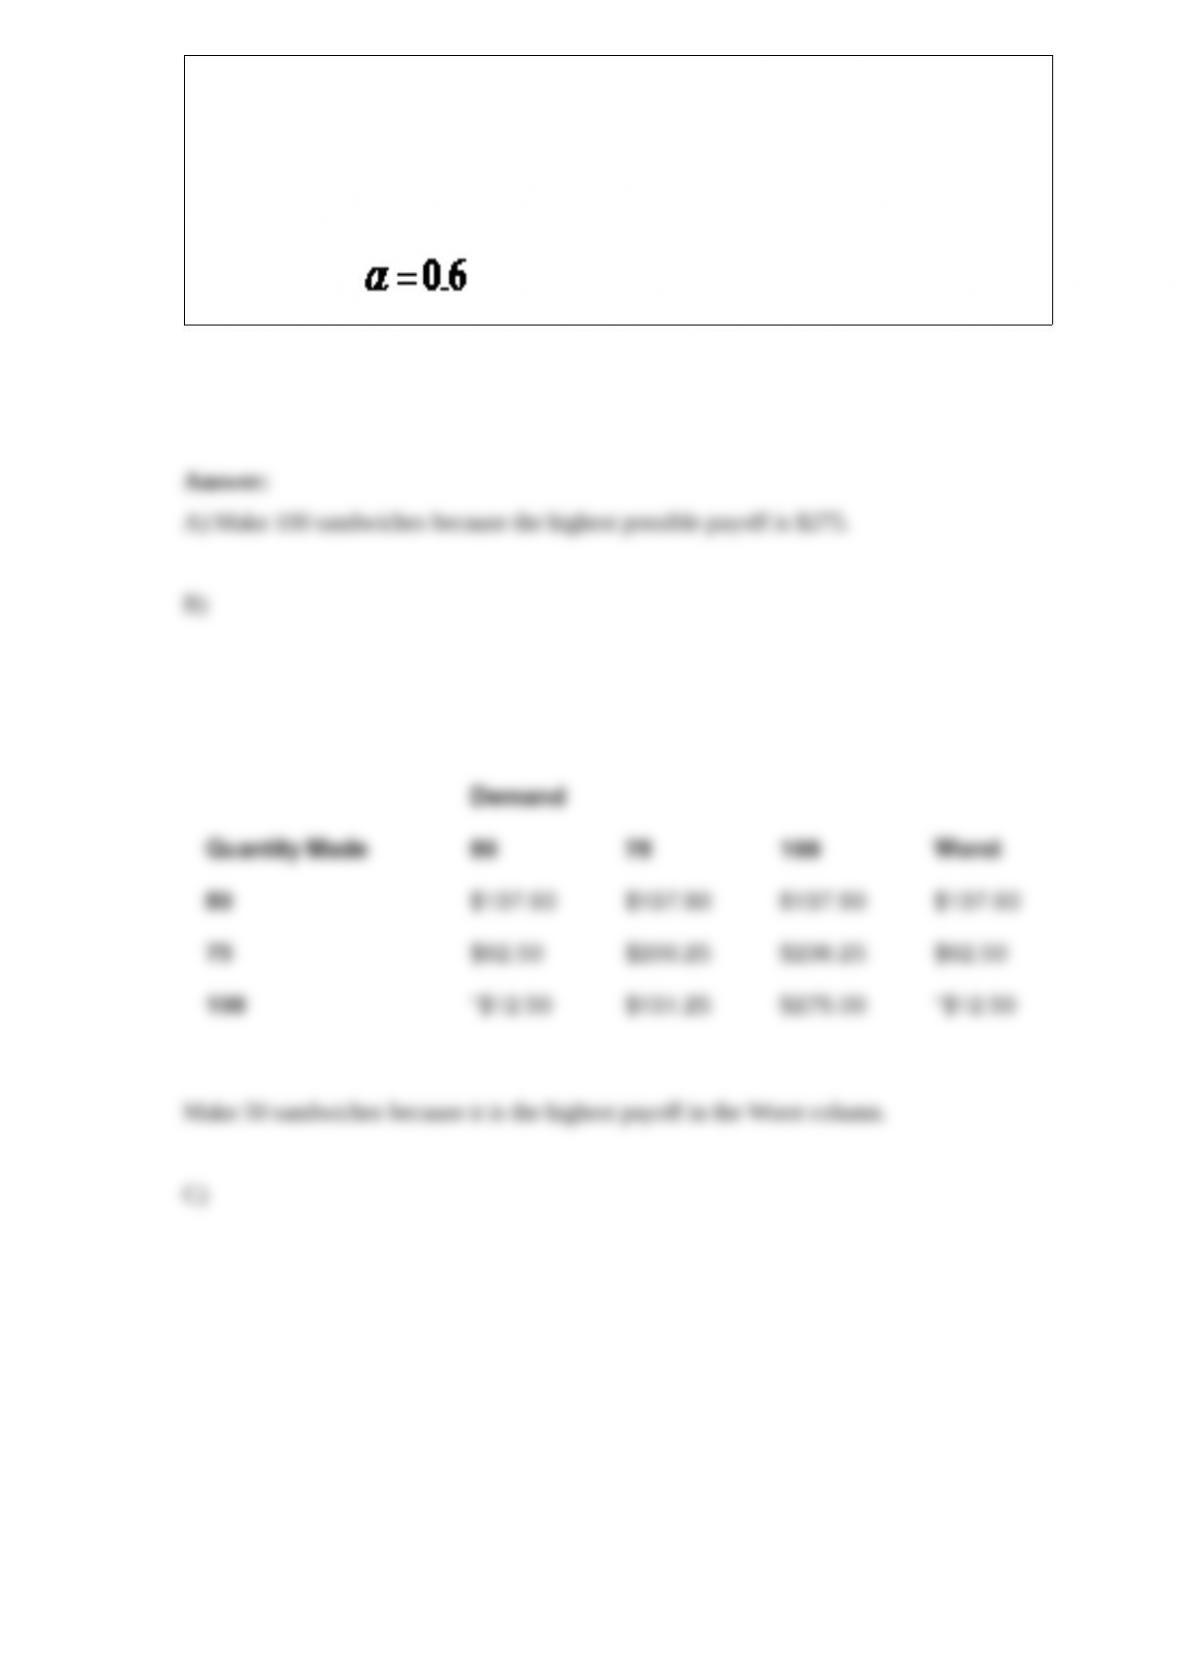
The Department of Education would like to test the hypothesis that the median debt
load of graduating students with a Bachelor’s degree is equal to $17,000. The following
table summarizes the debt load of a random sample of graduating students with a
Bachelor’s degree.
Using α = 0.10, which one of the following statements is true?
A) Because the p-value is greater than α, we reject the null hypothesis and cannot
conclude that the median debt load of graduating students is not equal to $17,000.
B) Because the p-value is greater than α, we fail to reject the null hypothesis and cannot

conclude that the median debt load of graduating students is not equal to $17,000.
C) Because the p-value is less than α, we fail to reject the null hypothesis and conclude
that the median debt load of graduating students is not equal to $17,000.
D) Because the p-value is less than α, we reject the null hypothesis and conclude that
the median debt load of graduating students is not equal to $17,000.
The sum of squares ________ measures the variation between the block means and the
grand mean of the data in randomized block ANOVA.
A) within
B) between
C) block
D) error
Sam’s Deli sells take-out baguette sandwiches for the lunchtime customers that sell for
$7.50 and cost Sam $4.75 to make. Any leftover sandwiches can be sold for $1.75 the
next day. Assume daily demand will be 50, 75, or 100 sandwiches. Sam needs to decide
to make 50, 75, or 100 sandwiches each morning. Determine the number of programs
Syracuse should print for the game using the following criterion.
A) Maximax
B) Maximin
C) Equally likely
D) Minimax regret
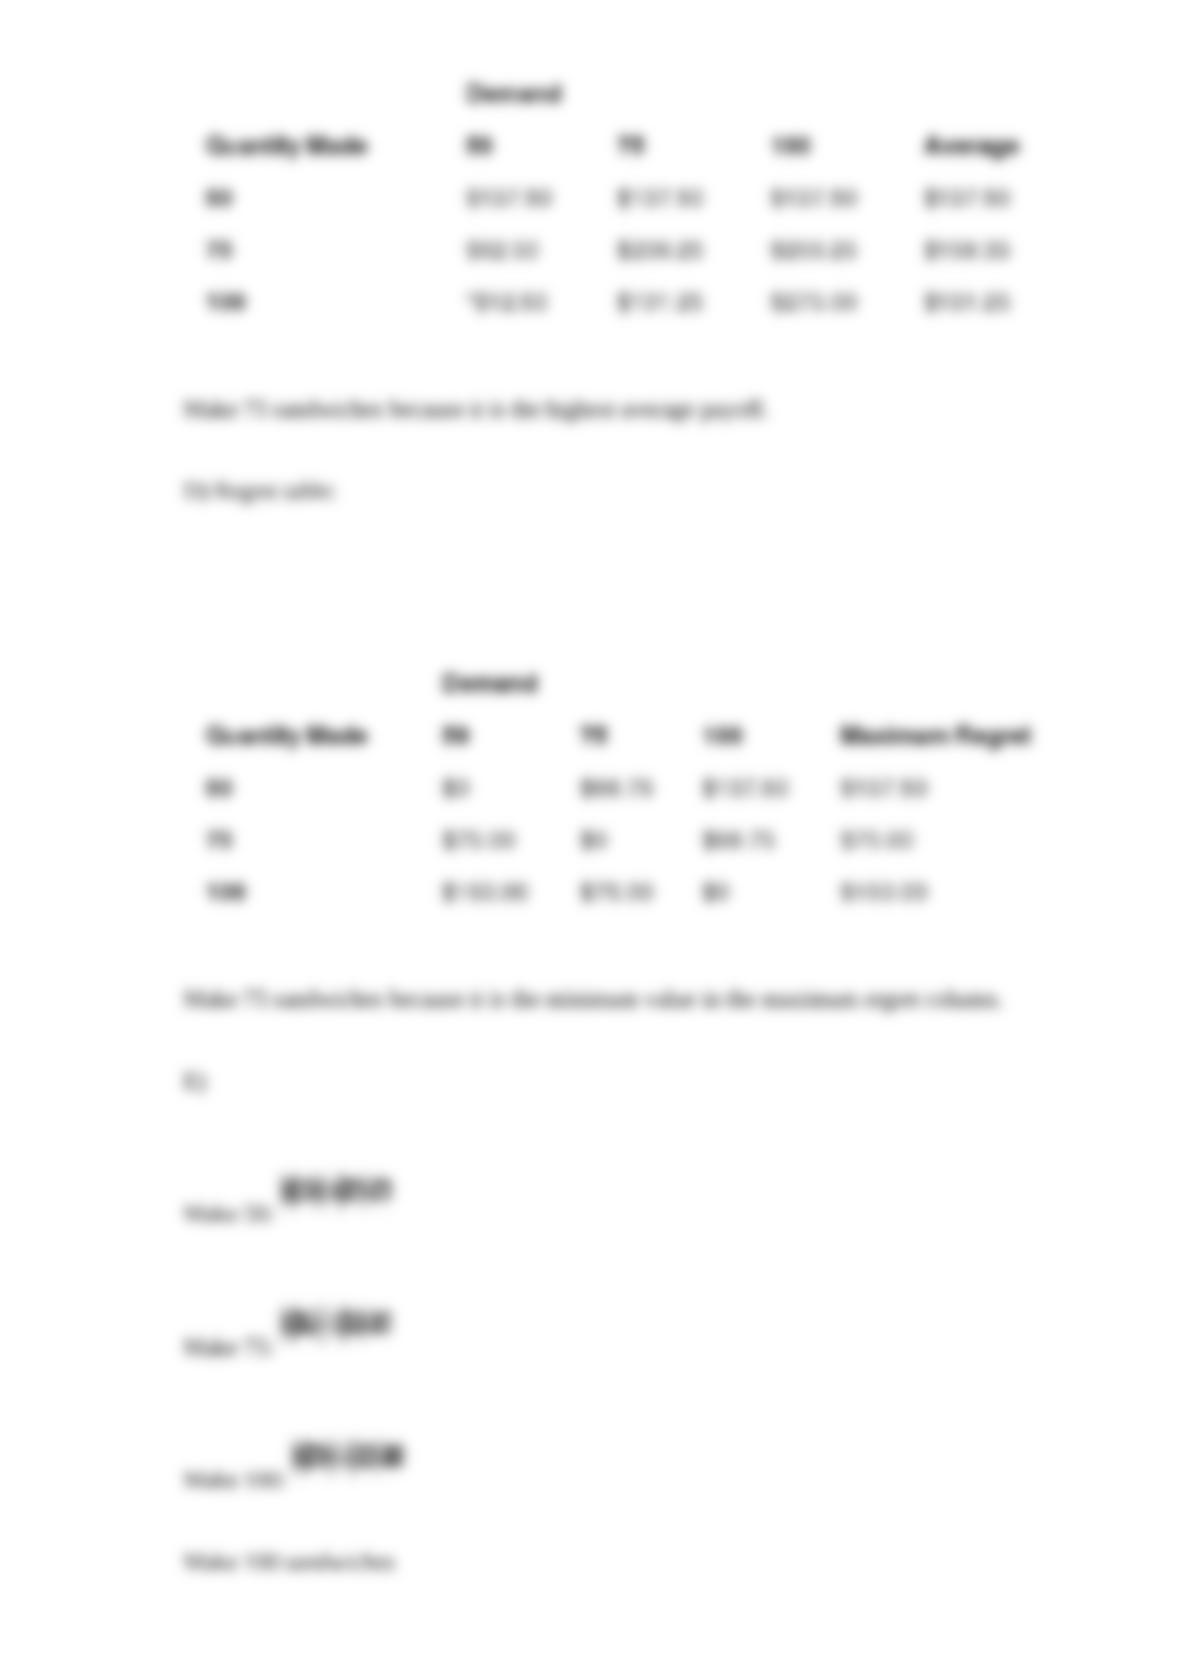
E) Hurwicz with
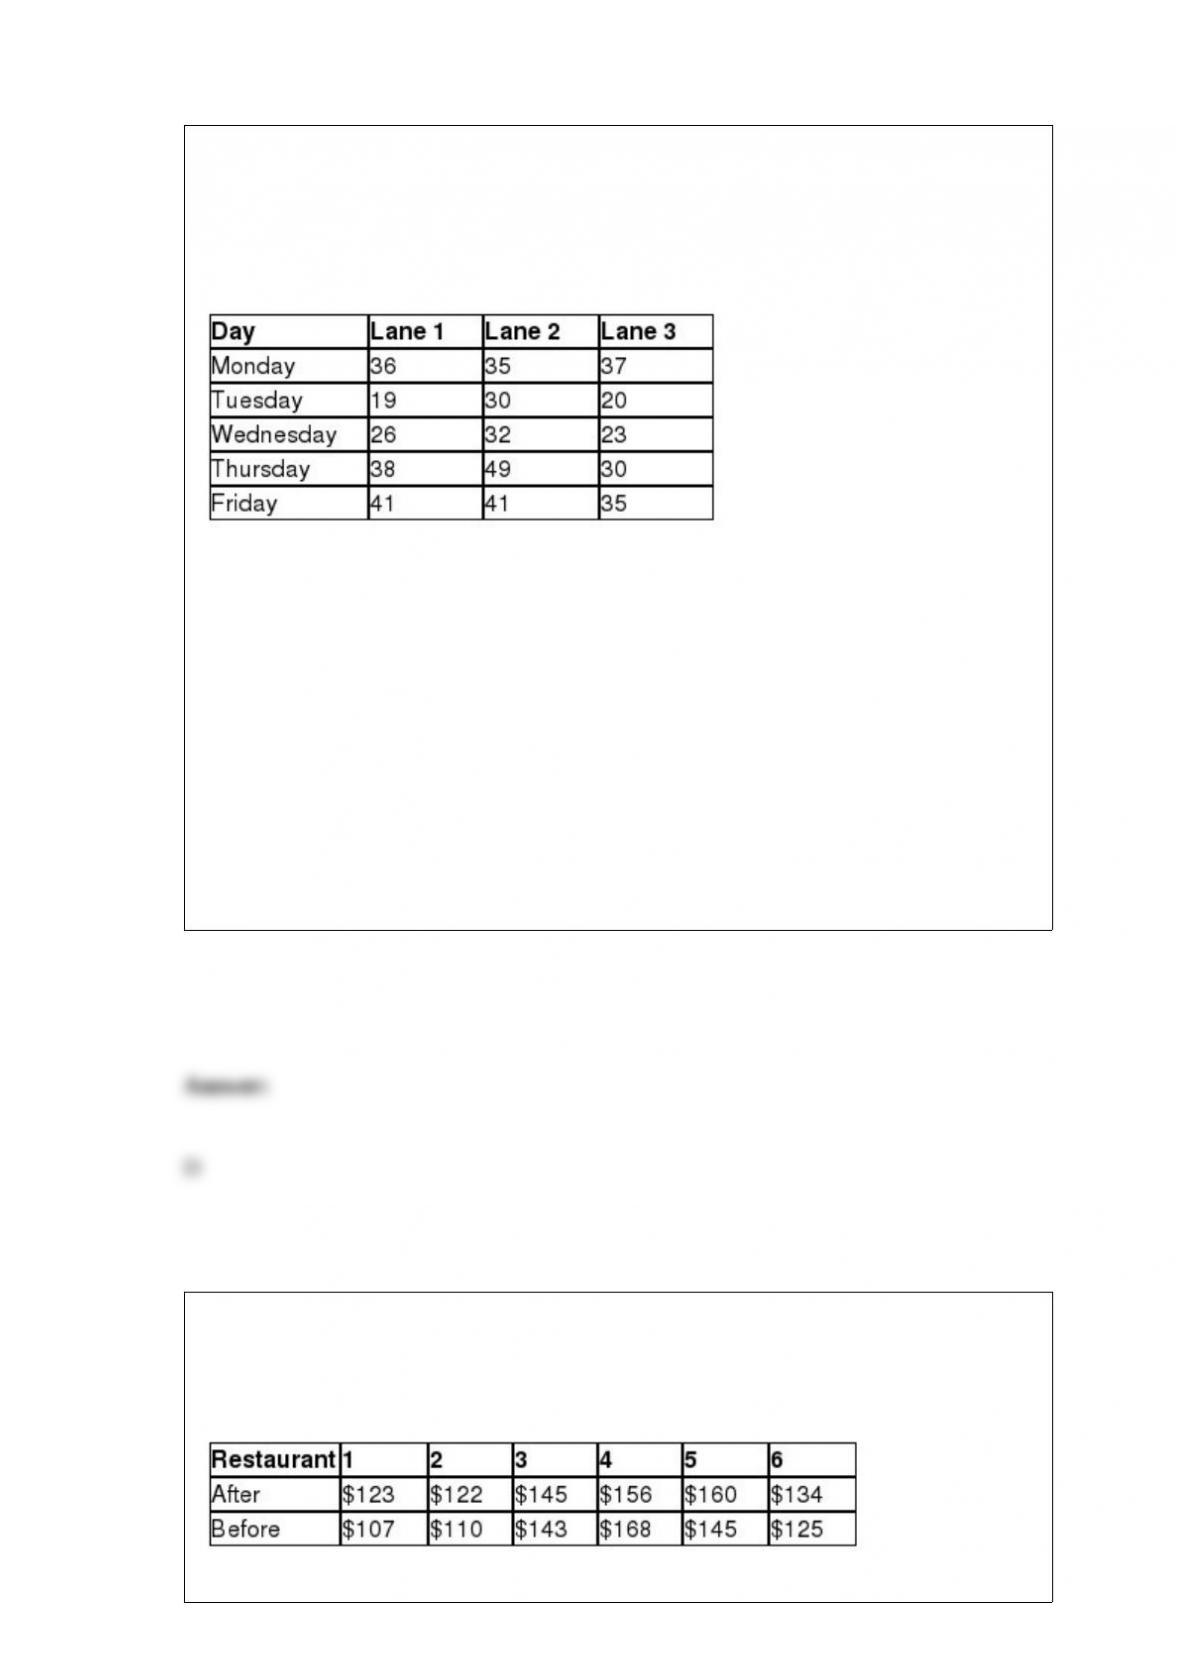
In Delaware, cars are inspected each year using state-operated inspection centers. The
Wilmington center has three drive-through lanes where cars are inspected in a sequence
of steps. The following data show the number of minutes that a random sample of
drivers spent waiting and having their cars inspected in the three lanes each day of the
week.
The state of Delaware would like to perform a randomized block ANOVA to test for a
difference in the average times the drivers spend in the three lanes using the weekday as
a blocking factor with α = 0.05. The sum of squares block for these observations is
________.
A) 570.1
B) 589.3
C) 610.7
D) 650.4
Suppose Burger King has run a major advertising campaign in the hopes of increasing
monthly sales. To investigate the effectiveness of this campaign, Burger King randomly
selected seven restaurants and recorded the monthly sales before and after the
advertising. The following data represents these sales figures in thousands of dollars.

If Population 1 is defined as sales after the advertising campaign and Population 2 is
defined as sales before the advertising campaign, and using α = 0.05, the critical value
for this hypothesis test would be ________.
A) 2.015
B) 1.771
C) 1.440
D) 1.943
________ regression examines all combinations of independent variables as possible
candidates for the final regression model.
A) Best subsets
B) General stepwise
C) Backward elimination
D) Forward selection
The Department of Transportation would like to test the hypothesis that the average age
of cars on the road is less than 12 years. A random sample of 45 cars had an average age
of 10.6 years. It is believed that the population standard deviation for the age of cars is
4.1 years. The Department of Transportation would like to set α = 0.05. The test statistic
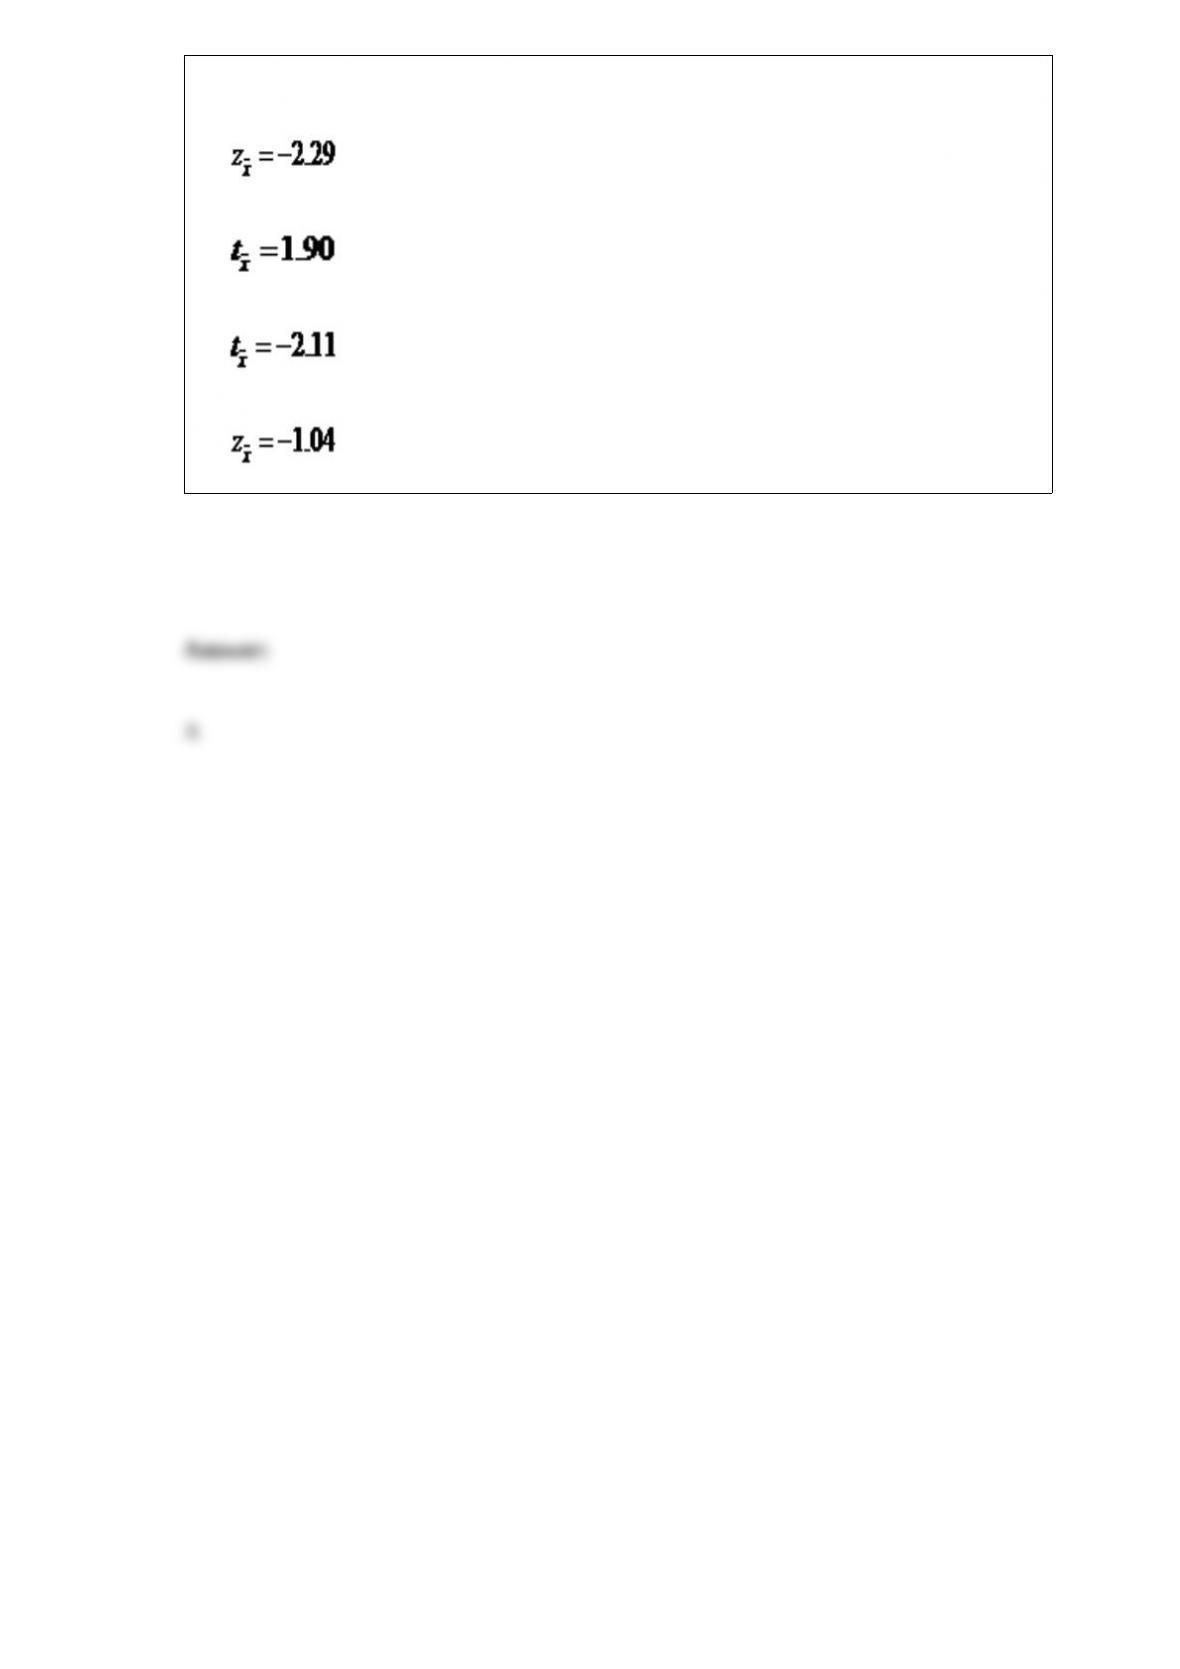
for this hypothesis test would be ________.
A)
B)
C)
D)