The ____________ hypothesis is not rejected unless there is sufficient sample evidence
to do so.
A. research
B. alternative
C. null
D. true
A random sample of 11 third-year medical school students took a comprehensive
written exam as well as a comprehensive oral exam. The scores on both exams are
given below. It is established that both test scores have highly nonnormal distributions.
Student Written exam score Oral exam score
1 60 55
2 72 78
3 33 60
4 89 87
5 61 79
6 65 82
7 25 41
8 80 58
9 92 95
10 48 64
The medical examination board wants to know if the oral exam scores are higher than
the written exam scores. State the appropriate null hypothesis for this problem.
A. H0: The probability distribution of written exam scores is identical to the probability

distribution of oral exam scores.
B. H0:The probability distribution of written exam scores is shifted to the left of the
probability distribution of oral exam scores.
C. H0:The probability distribution of written exam scores is shifted to the right of the
probability distribution of oral exam scores.
D. H0:The probability distribution of written exam scores is shifted to the left or right of
the probability distribution of oral exam scores.
A company is interested in estimating μ, the mean number of days of sick leave taken
by its employees. Their statistician randomly selects 100 personnel files and notes the
number of sick days taken by each employee. The sample mean is 12.2 days, and the
sample standard deviation is 10 days. How many personnel files would the statistician
have to select in order to estimate μ to within 2 days with a 99 percent confidence
interval?
A. 2
B. 13
C. 136
D. 165
E. 173

As the sample size ___________, the standard deviation of the population of all sample
proportions increases.
A. increases
B. stays the same
C. is variable
D. decreases
While conducting experiments, a marine biologist selects water depths from a
uniformly distributed collection that vary between 2.00 m and 7.00 m. What is the
probability that a randomly selected depth is less than 3.60 m?
A. .72
B. .80
C. .46
D. .32
Consider the experiment of tossing a fair coin three times and observing the number of
heads that result (X = number of heads). What is the standard deviation for this
distribution?

A. 1.5
B. 1.22
C. 0.75
D. 0.87
The J.O. Supplies Company buys calculators from a non-US supplier. The probability
of a defective calculator is 10 percent. If 100 calculators are selected at random, what is
the expected number of defectives?
A. 9
B. 90
C. 10
D. 95
Historical data for a local manufacturing company show that the average number of
defects per product produced is 2. In addition, the number of defects per unit is
distributed according to a Poisson distribution. Determine the standard deviation of the
number of defects for 32 units.
A. 2
B. 32
C. 64
D. 8
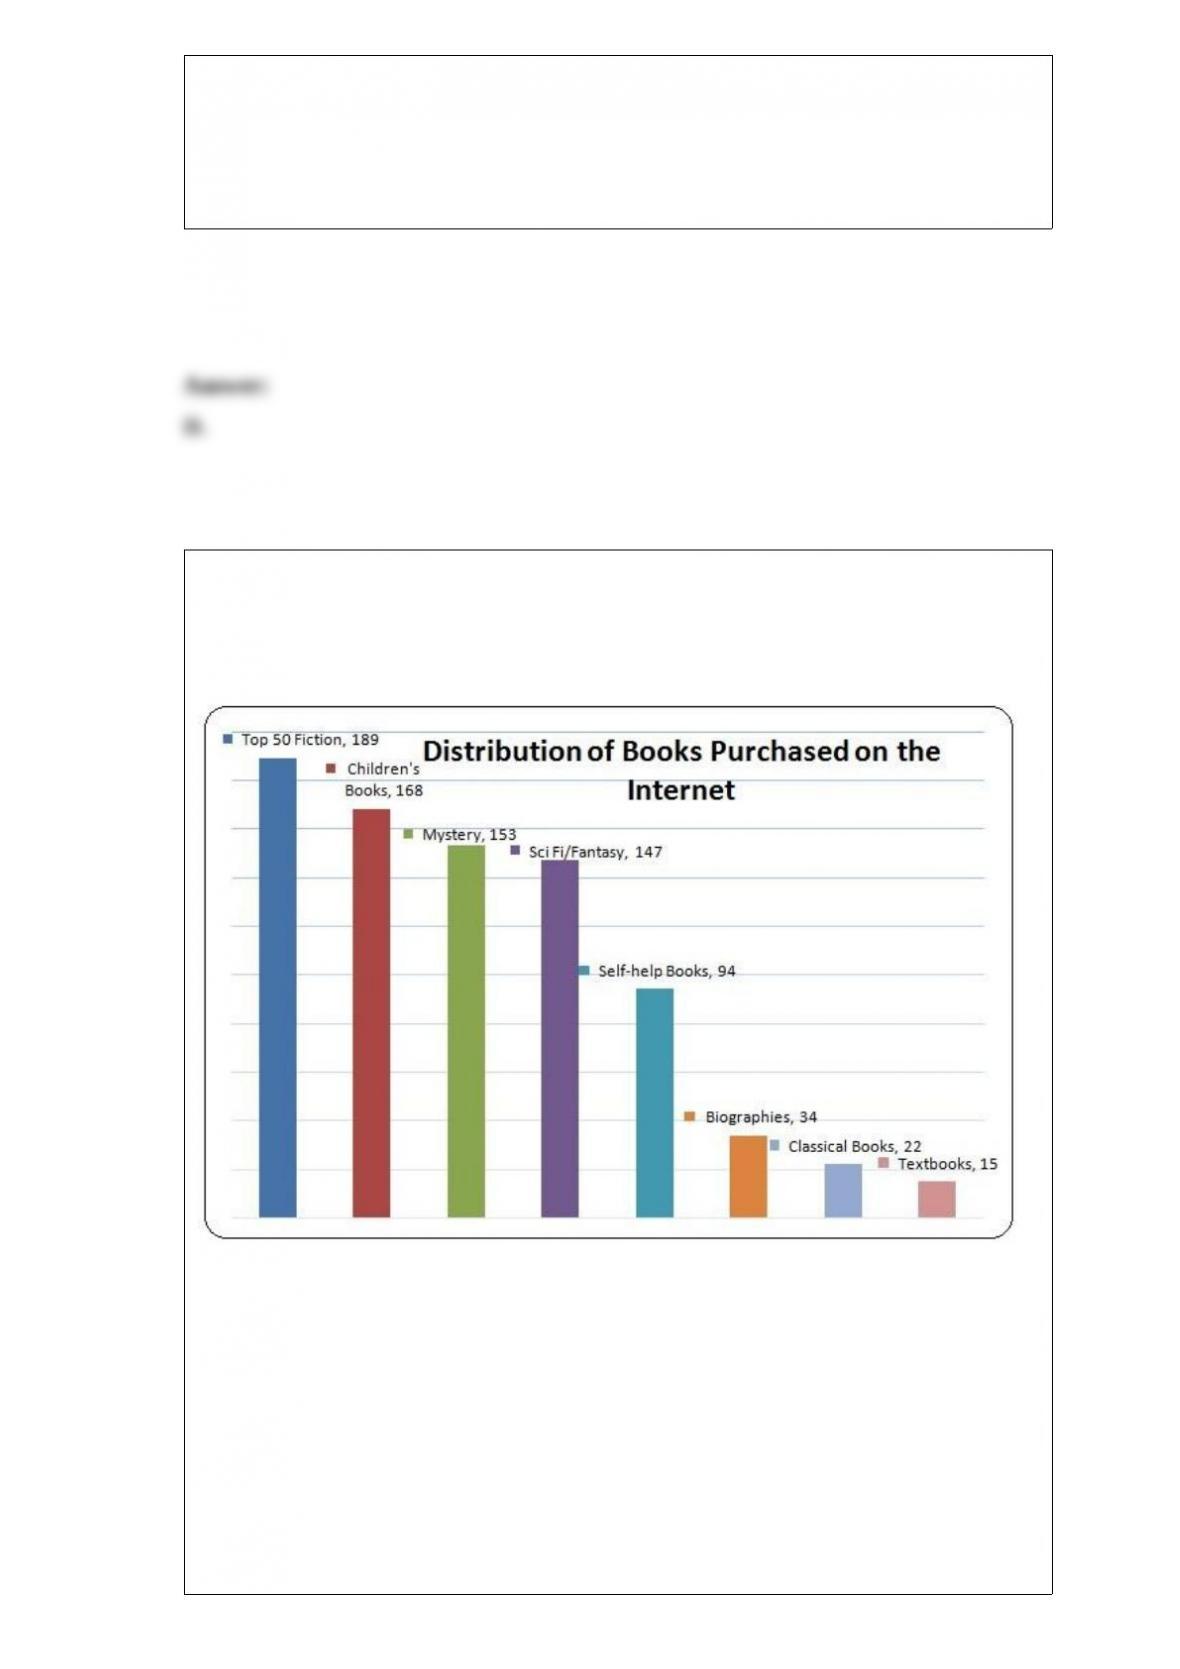
822 customers were randomly selected from those who had recently bought a book over
the Internet. The chart below shows the breakdown of the classification of the book
type.
What percentage of the books purchased were either mystery or science fiction/fantasy?
A. 18.61
B. 36.50
C. 17.88
D. 24.33

E. 22.99
A ____________ is a set of assumptions about how sample data are selected and about
the population from which the sample data are selected.
A. random sampling
B. statistical model
C. descriptive statistics
D. probability sampling
The mean life of a pair of shoes is 40 months with a standard deviation of 8 months. If
the life of the shoes is normally distributed, how many pairs of shoes out of one million
will need replacement before 36 months?
A. 500,000
B. 808,500
C. 191,500
D. 308,500

Unoccupied seats on flights cause airlines to lose revenue. Suppose a large airline wants
to estimate its average number of unoccupied seats per flight over the past year. 225
flight records are randomly selected and the number of unoccupied seats is noted, with
a sample mean of 11.6 seats and a standard deviation of 4.1 seats. Calculate a 90
percent confidence interval for μ, the mean number of unoccupied seats per flight
during the past year.
A. [4.86, 18.34]
B. [11.25, 11.95]
C. [11.57, 11.63]
D. [11.15, 12.05]
E. [11.30, 12.20]
In testing for the equality of means from two independent populations, if the hypothesis
of equal population means is rejected at α = .01, it will __________ be rejected at α = .
05.
A. always
B. sometimes
C. never

If the median of a data set is 760, the upper quartile is 950, and the lower quartile is
650, what is the interquartile range?
A. 300
B. 190
C. 110
D. 150
E. 910
What is the probability of rolling a seven with a pair of fair dice?
A. 6/36
B. 3/36
C. 1/36
D. 8/36
E. 7/36

A positive autocorrelation implies that negative error terms will be followed by
_________ error terms.
A. negative
B. positive
C. either negative or positive
D. irregular
If the probability of a success on a single trial is .2, what is the probability of obtaining
3 successes in 10 trials if the number of successes is binomial?
A. .0031
B. .5033
C. .1074
D. .2013

A histogram that tails out toward smaller values is ___________.
A. skewed to the left
B. normal
C. a scatter plot
D. skewed to the right
Find the z-score for an IQ test score of 142 when the mean is 100 and the standard
deviation is 15.
A. 42
B. 2.8
C. 18.78
D. 1.27
E. −2.8
During the past six months, 73.2 percent of US households purchased sugar. Assume
that these expenditures are approximately normally distributed with a mean of $8.22
and a standard deviation of $1.10. Find the probability that a household spent more than
$16.00 on sugar.

A. 1.00
B. 0.00
C. 0.50
D. 0.98
Which one of the following nonparametric methods can be considered as an extension
of the Wilcoxon rank sum test?
A. Wilcoxon signed ranks test
B. sign test
C. Kruskal-Wallis test
D. Spearman’s test
The correlation coefficient may assume any value between
A. 0 and 1.
B. −∞ and ∞.
C. 0 and 8.
D. −1 and 1.
E. −1 and 0.

The population of all sample proportions has a normal distribution if the sample size (n)
is sufficiently large. The rule of thumb for ensuring that n is sufficiently large is
A. np ≥ 5.
B. n(1 − p) ≥ 5.
C. np ≤ 5.
D. n(1 − p) ≤ 5 and np ≤ 5.
E. np ≥ 5 and n(1 − p) ≥ 5.
A powder metal manufacturing company is producing sleeves for a locking mechanism.
The target (nominal) value for the inside diameter is 1 inch. The inside diameter
specifications are 1 .005 inches. Assume that the process is in statistical control with =
1.0002 inches, = .003 inches, and subgroup size of 5. Calculate the estimated
proportion of out-of-specification sleeve inside diameters.
A. .0471
B. .0217
C. .0001
D. .4783
E. .0139
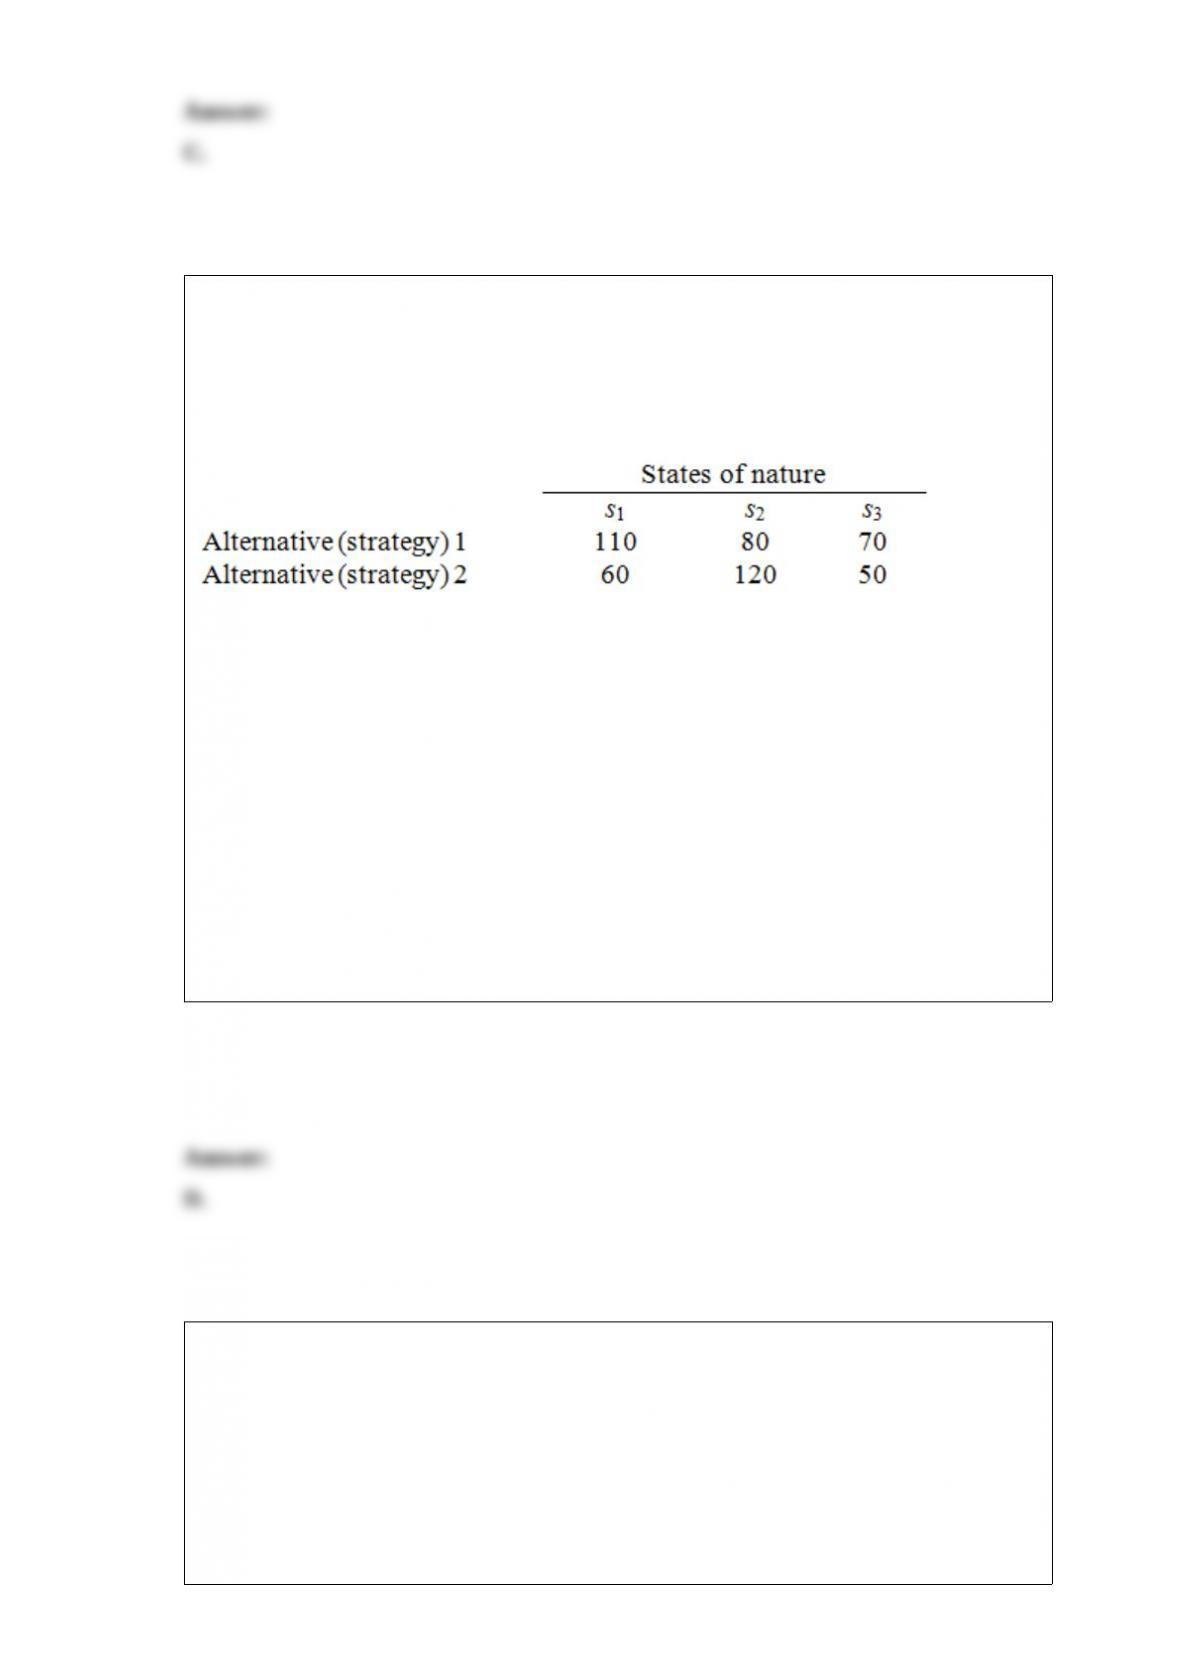
Alternatives 1 and 2 in the following payoff table represent the two possible
manufacturing strategies that the EKA manufacturing company can adopt. The level of
demand affects the success of both strategies. The states of nature (Si) represent the
levels of demand for the company products. S1, S2, and S3 characterize high, medium,
and low demand, respectively. The payoff values are in thousands of dollars.
The best alternative (course of action) for the EKA manufacturing company using the
maximin criterion is strategy _____ and the best possible payoff is __________.
A. 1, $50,000
B. 2, $120,000
C. 1, $100,000
D. 1, $70,000
E. 2, $80,000
For a fixed sample size, the lower we set α, the higher is the ___________.
A. Type I error
B. Type II error
C. random error
D. p-value
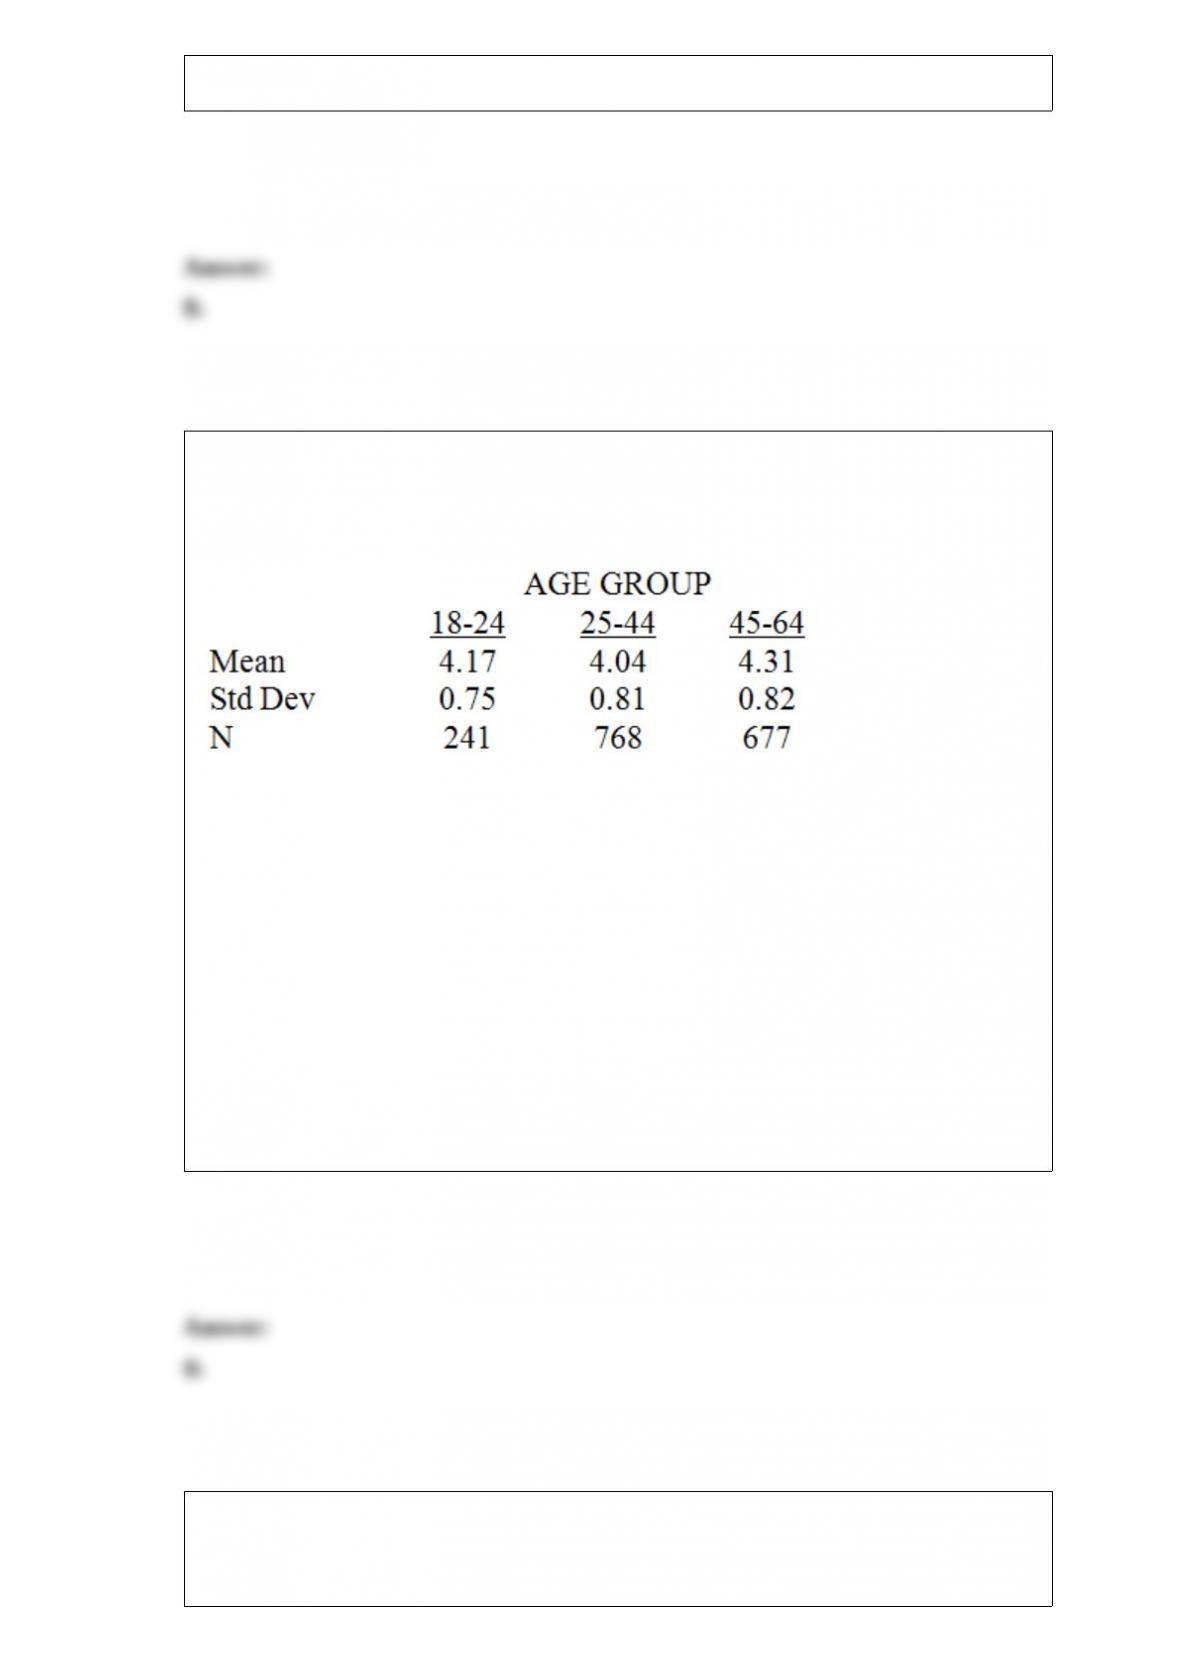
Researchers have studied the role that the age of workers has in determining the hours
per month spent on personal tasks. A sample of 1,686 adults were observed for one
month. The data follow.
Construct a 98 percent confidence interval for the mean hours spent on personal tasks
for 25- to 44-year-olds.
A. [3.96, 4.12]
B. [3.97, 4.11]
C. [3.98, 4.10]
D. [2.16, 5.92]
E. [3.95, 4.13]
The ___________ is a minimum-variance unbiased point estimate of the mean of a
normally distributed population.

A. sample mean
B. sample variance
C. sample standard deviation
D. observed mean
When making a decision in an environment of ________________, the decision maker
knows which of the states of nature will actually occur.
A. certainty
B. uncertainty
C. risk
D. optimism
What sample size is needed to obtain a 90 percent confidence interval for the mean
protein content of meat if the estimate is to be within 2 pounds of the true mean value?
Assume that the variance is 49 pounds.
A. 34
B. 1625
C. 21
D. 987
In performing a one-way ANOVA, _________ measures the variability of the observed
values around their respective means by summing the squared differences between each
observed value of the response and its corresponding treatment mean.
A. SS Error
B. SS Treatment
C. SS Total
D. SS Treatment/SS Error
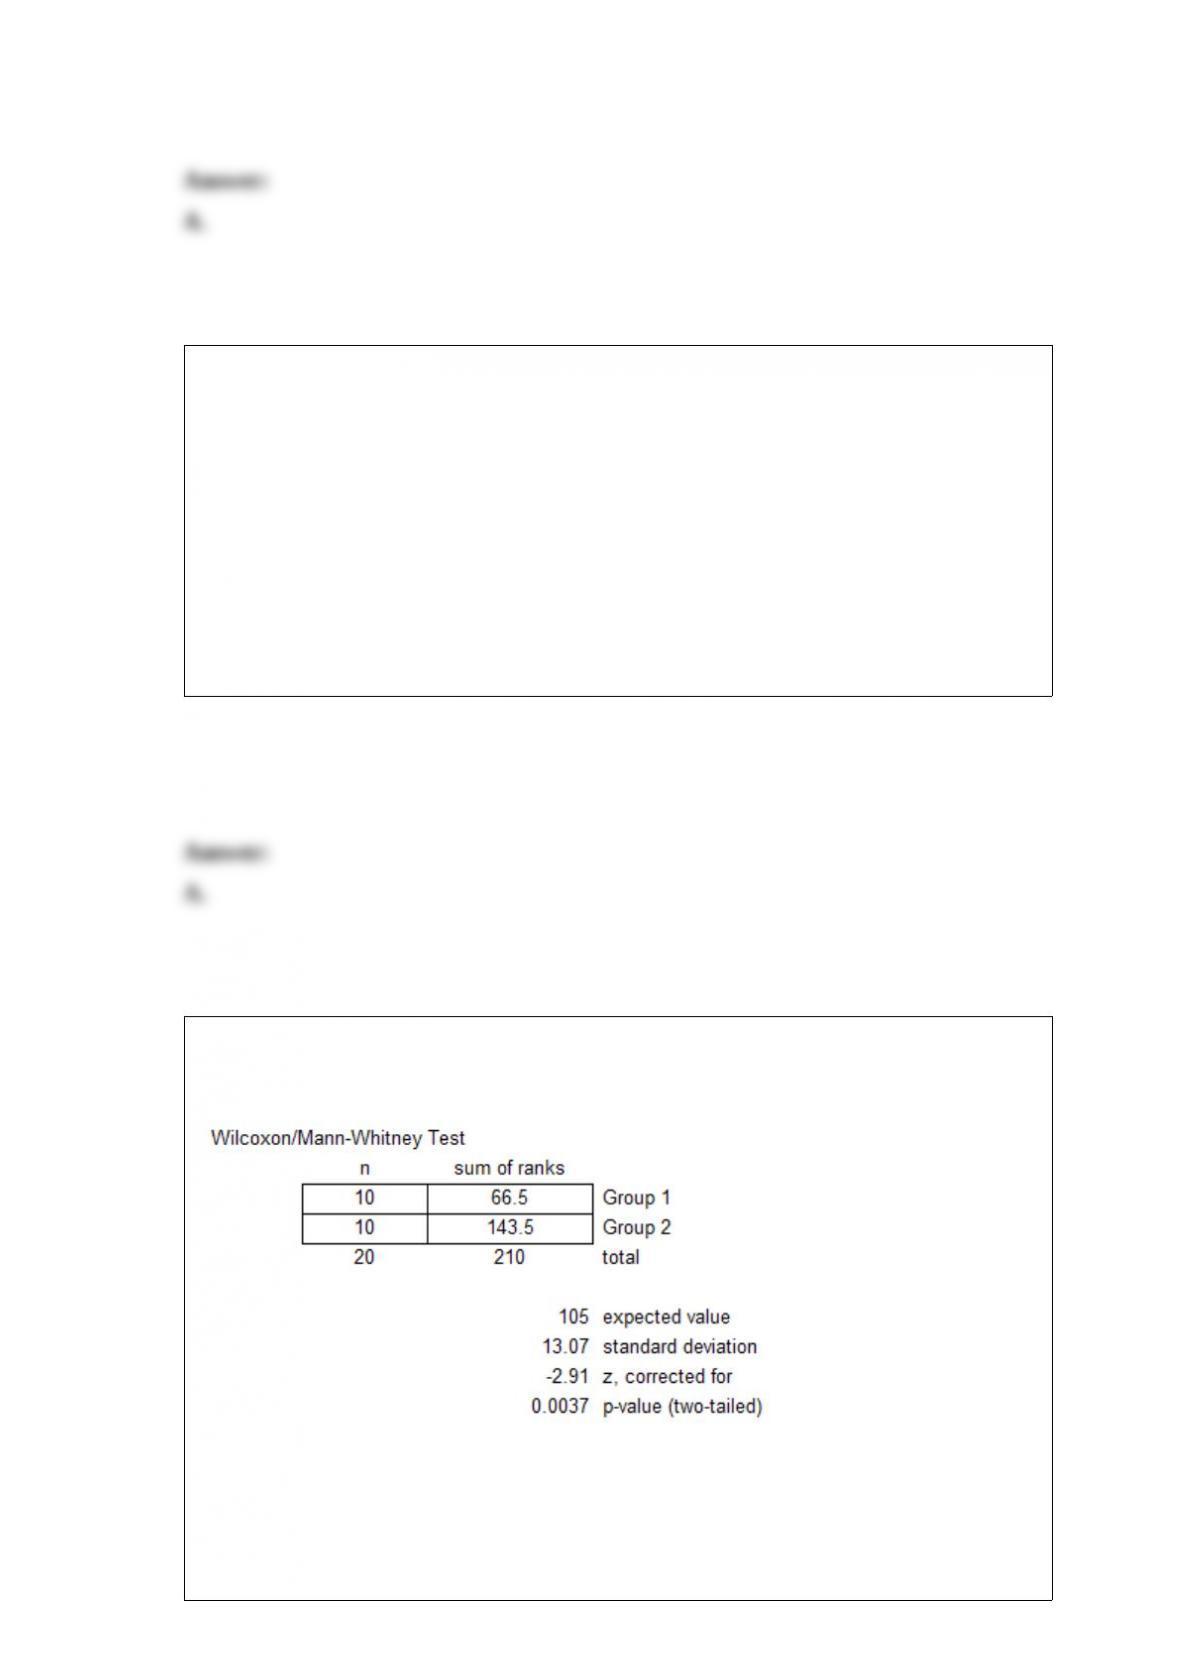
Refer to the MegaStat/Excel output for the Wilcoxon rank sum test given in the table
below.
At a significance level of .05, which one of the following rejection point conditions is
correct regarding the following null hypothesis?
H0: D1 and D2 are identical probability distributions.

A. Reject H0 if T ≥ 79 or T ≤ 131.
B. Reject H0 if T ≥ 131 or T ≤ 83.
C. Reject H0 if T ≥ 131 or T ≤ 79.
D. Reject H0 if T ≤ 83 or T ≥ 127.
E. Reject H0 if T ≤ 79 or T ≥ 127.
The population of lengths of aluminum-coated steel sheets is normally distributed with
a mean of 30.05 inches and a standard deviation of 0.3 inches. What is the probability
that the average length of a steel sheet from a sample of 9 units is more than 29.95
inches long?
A. .8413
B. .6293
C. .3707
D. .1587
In a study of factors affecting whether soldiers decide to reenlist, 320 subjects were
measured for an index of satisfaction. The sample mean is 28.8 and the sample standard
deviation is 7.3. Use the given sample data to construct the 98 percent confidence
interval for the population mean for level of satisfaction.
A. [27.85, 29.75]
B. [27.96, 29.64]
C. [11.82, 45.78]
D. [28.75, 28.85]
E. [28.60, 29.00]
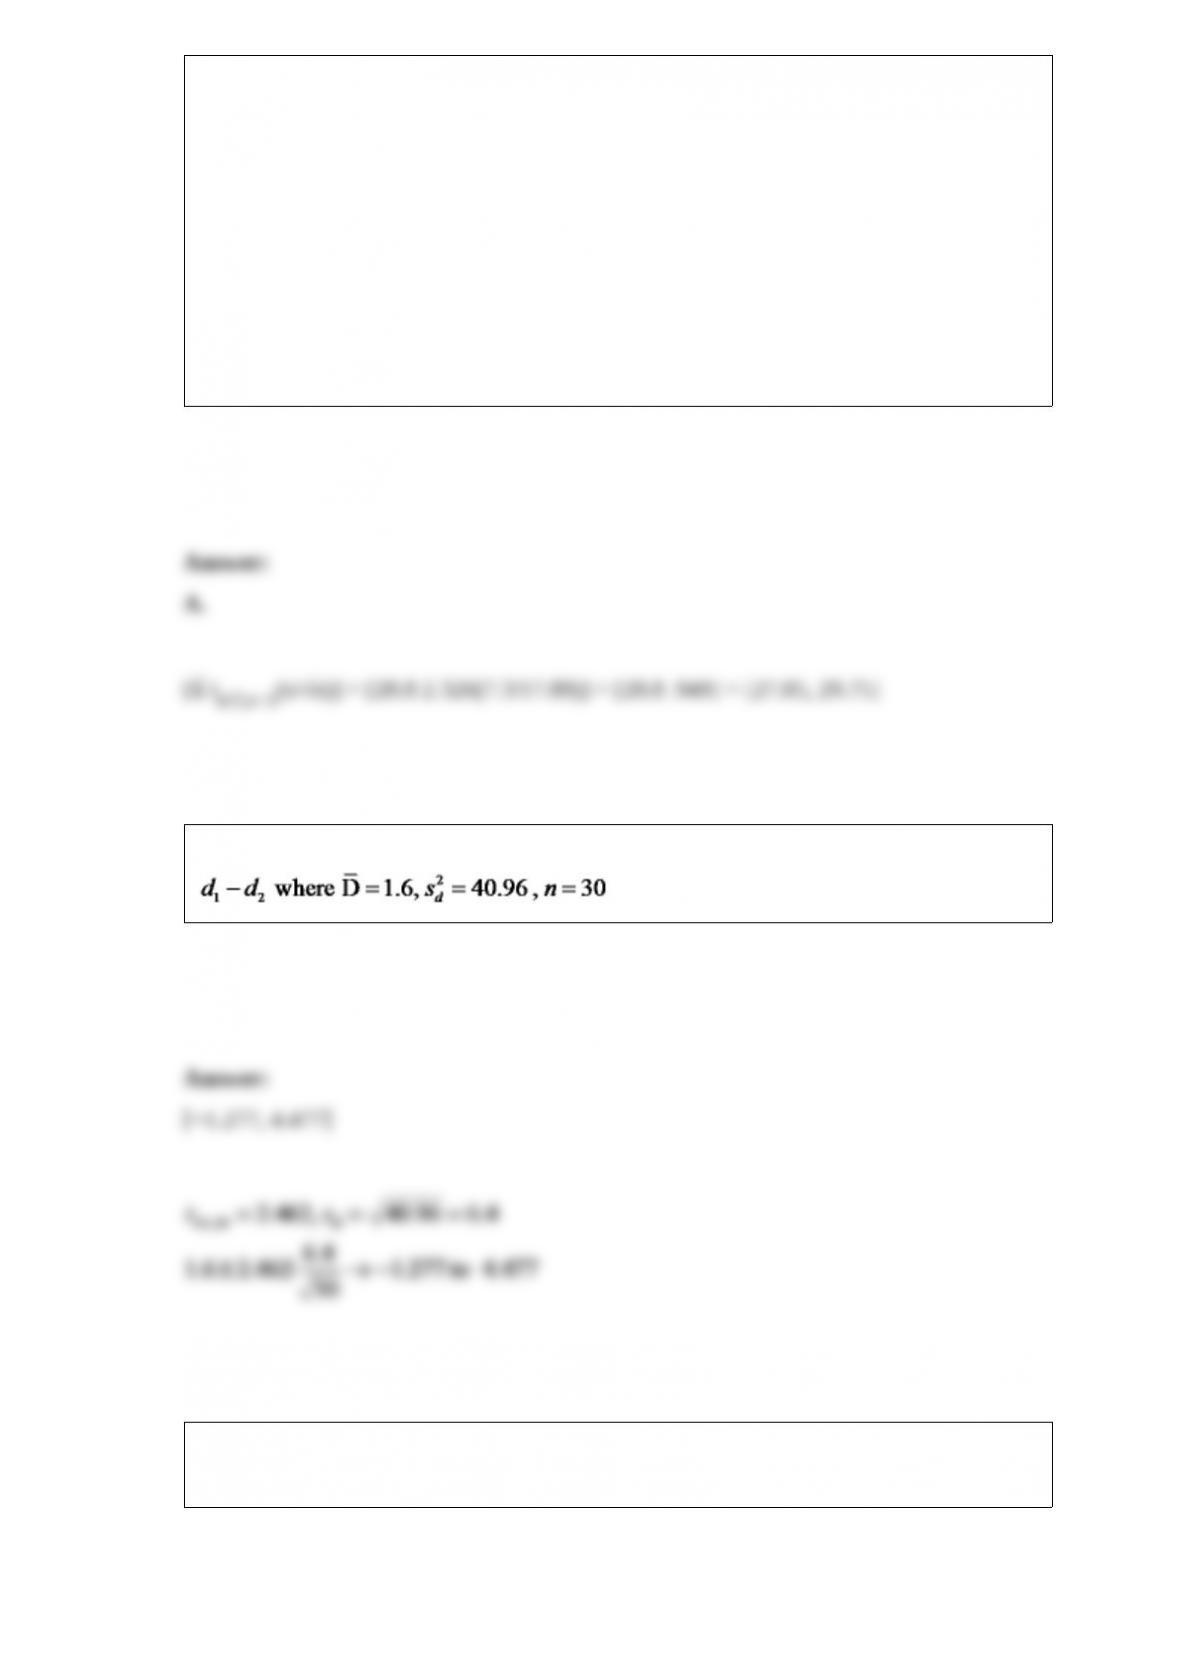
Find a 98 percent confidence interval for the paired difference
Consider the following calculations for a one-way analysis of variance from a
completely randomized design with 20 total observations.
Compute a 95 percent confidence interval for the second treatment mean.
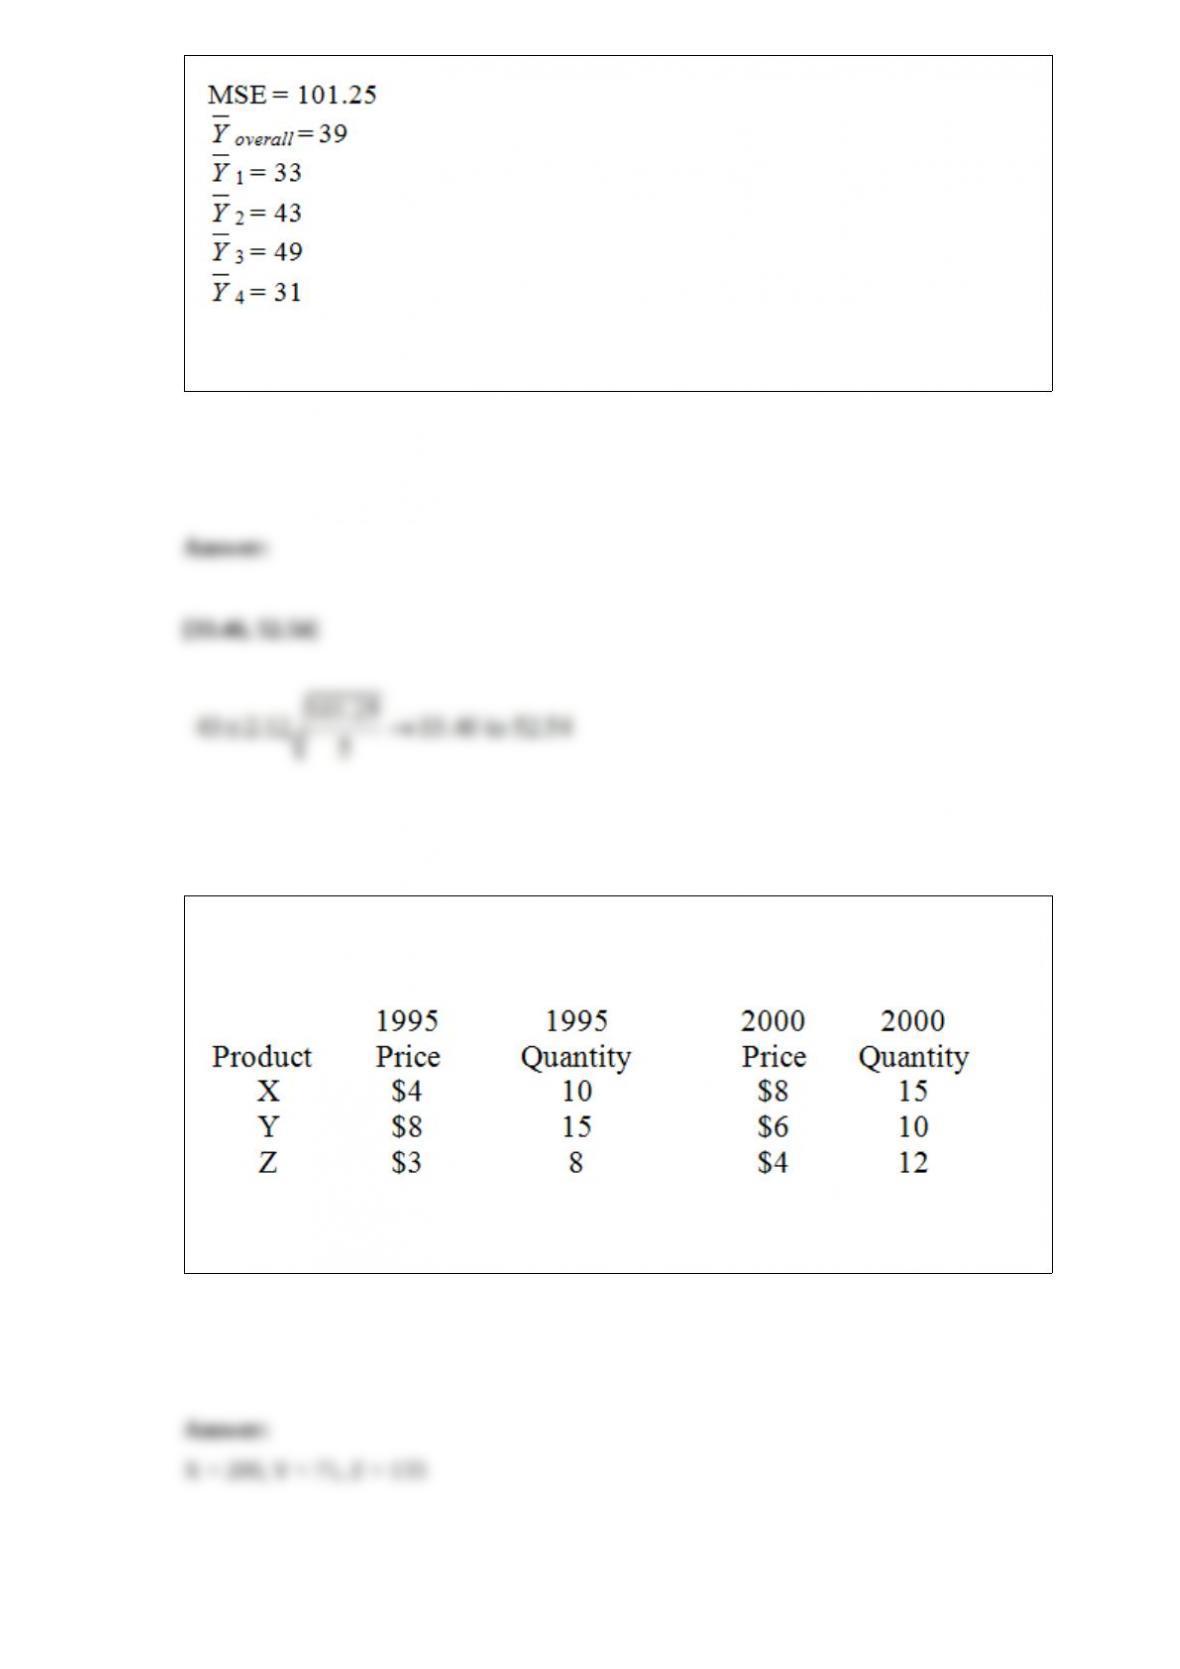
The following data on prices and quantities for the years 1995 and 2000 are given for
three products.
Calculate the 2000 simple price index for each product separately.
An experiment was performed on a certain metal to determine if the strength is a
function of heating time. Results based on 10 metal sheets are given below. Use the
simple linear regression model.
Determine SSE and SS(Total).

A manufacturer of salad dressings uses machines to dispense liquid ingredients into
bottles that move along a filling line. The machine that dispenses dressing is working
properly when 8 ounces are dispensed. The standard deviation of the process is 0.15
ounces. A sample of 48 bottles is selected periodically, and the filling line is stopped if
there is evidence that the mean amount dispensed is different from 8 ounces. Suppose
that the mean amount dispensed in a particular sample of 48 bottles is 7.983 ounces.
Calculate a confidence interval to test the hypotheses at α = .05 and determine if the
process should be stopped.
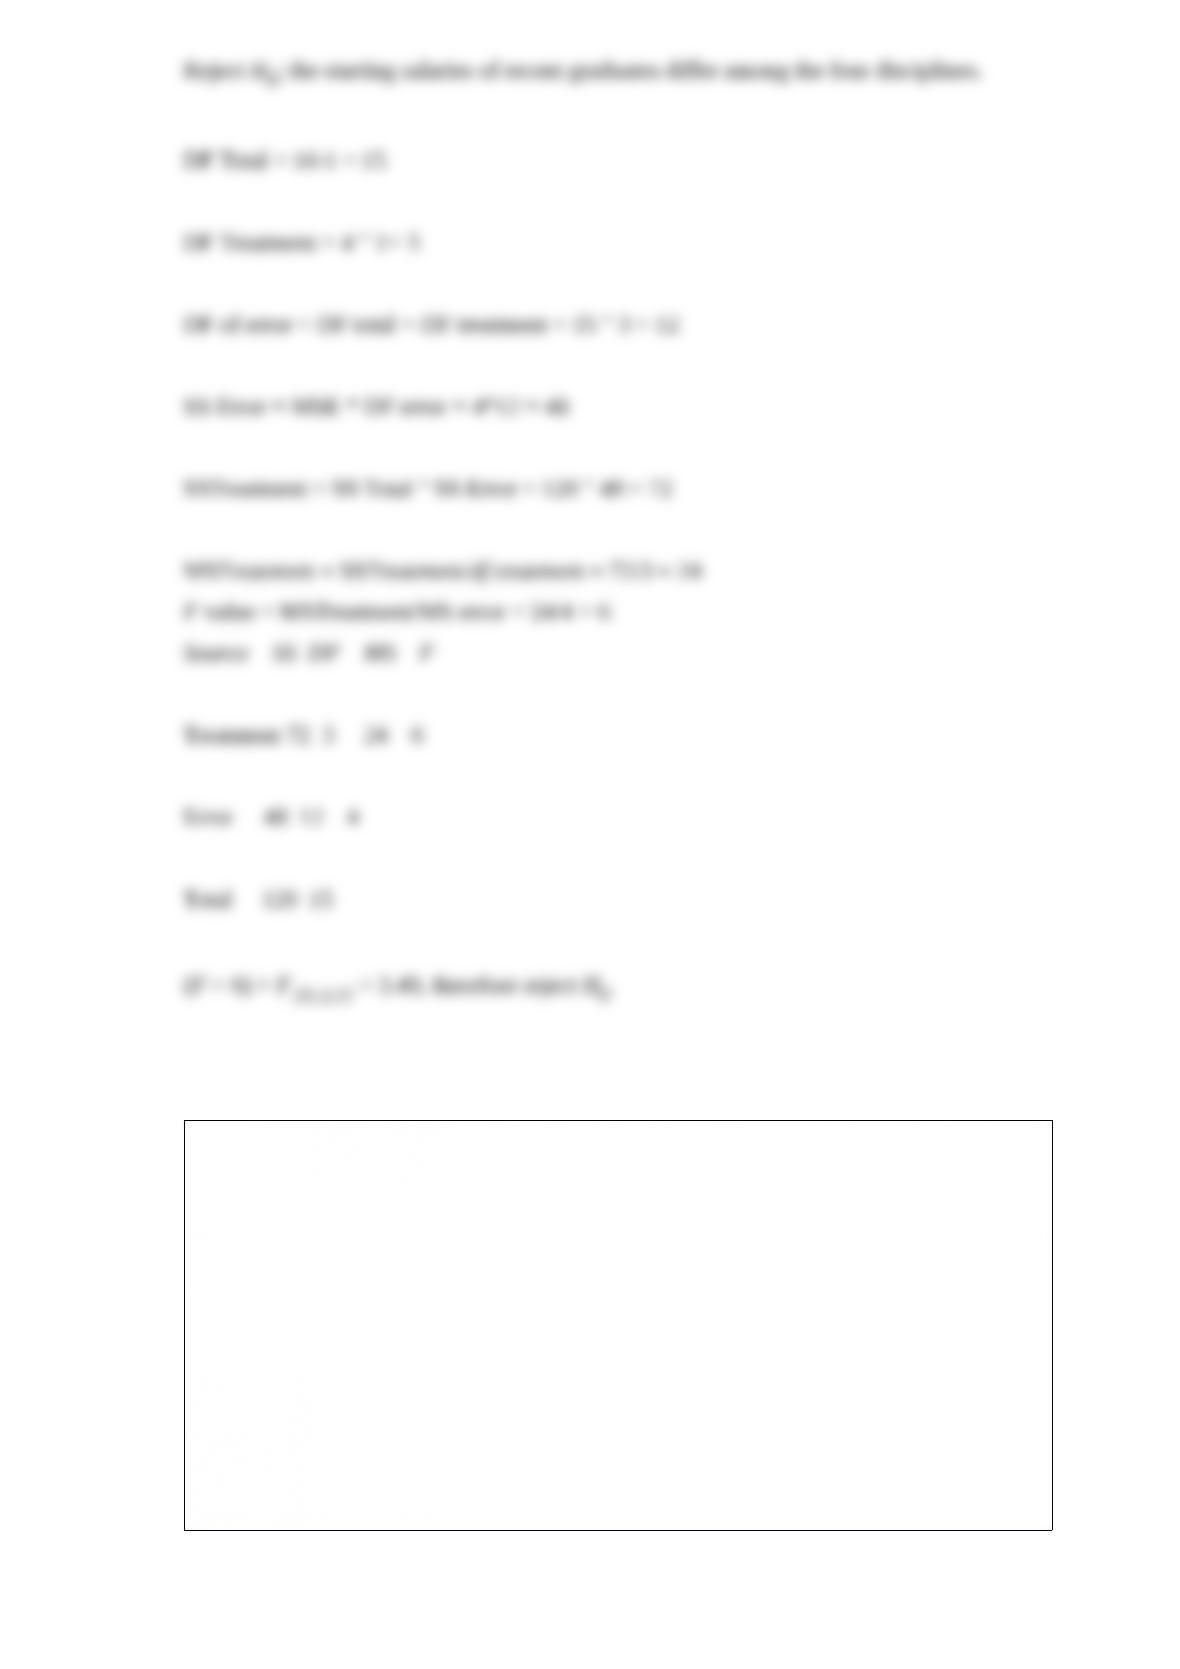
A researcher has used a one-way analysis of variance model to test whether the average
starting salaries differ among recent graduates from the nursing, engineering, business,
and education disciplines. She has randomly selected four graduates from each of the
four areas.
If MSE = 4, and SSTO = 120, complete the following ANOVA table. Is there a
significant difference in the starting salaries among the four disciplines? (H0: No
difference)
Source SS DF MS F
Treatment 4
Error
Total 120
Block
Treatment 1 2 3 4 Treatment Mean
Tr1 2 1 2 3 2
Tr2 4 4 1 1 2.5
Tr3 3 4 3 2 3
Block Mean 2 3 3 2 overall mean = 2.5
Consider the randomized block design with 4 blocks and 3 treatments given above.
What are the degrees of freedom for error?
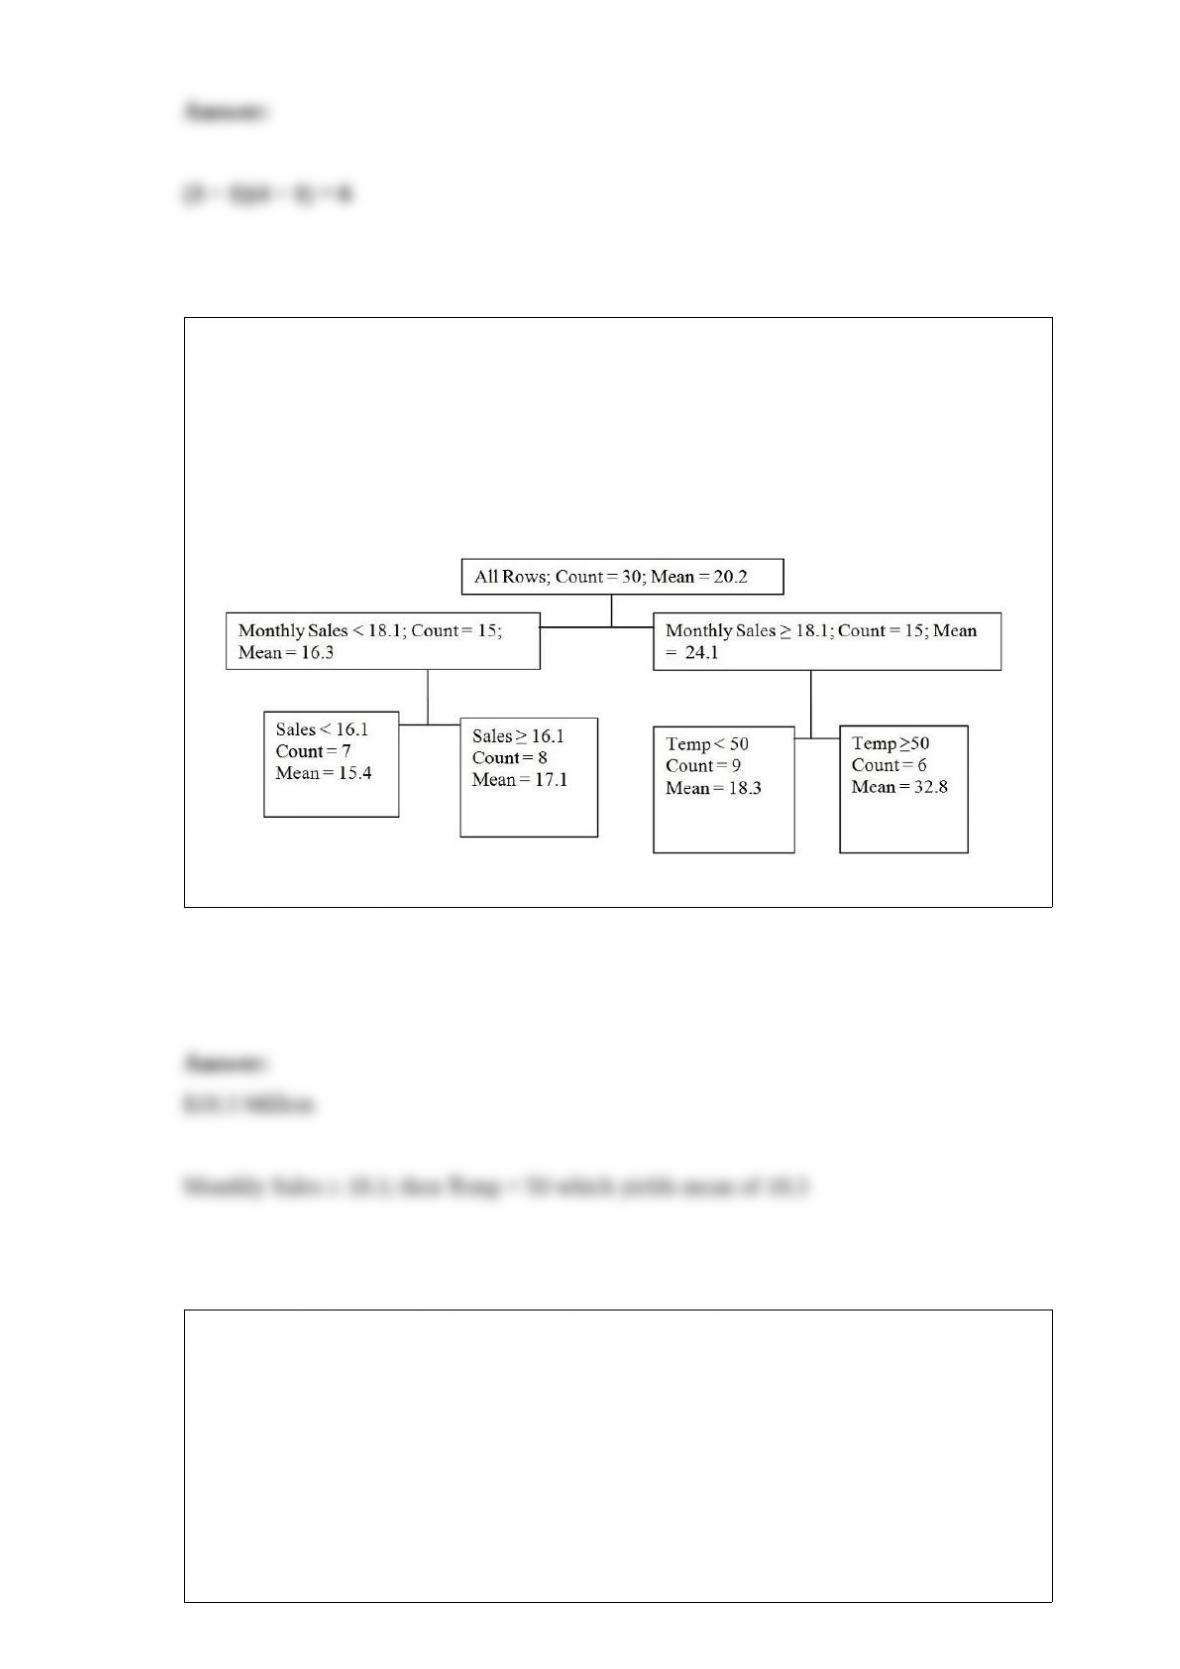
A manufacturer of Product X has developed a model for predicting monthly sales of
their product based on the sales from the same month of the previous year and the
forecasted average daily temperature for the month. Using the regression tree below
based on a random sample of 30 observations predict sales for a future where the
previous year’s monthly sales were $21.2 million dollars and the forecasted average
daily temperature for the month will be 45 degrees.
Consider a two-way analysis of variance experiment with treatment factors A and B.
The results are summarized below.
Source of Variation df SS
Factor A 4 86
Factor B 5 75
Interaction 20 75

Error 90 300
Total 119 536
If the mean response for level 1 of Factor A is 31.5 and the mean response for level 2 of
Factor A is 22.5, calculate a Tukey simultaneous 95 percent confidence interval for this
difference.
Standard X-ray machines should give radiation dosages below 5.00 milliroentgens
(mR). To test a certain X-ray machine, a sample of 36 observations is taken, with a
mean of 4.13 mR and a population standard deviation of 1.91 mR. Calculate the
appropriate test statistic to test the hypotheses using the critical value rule.
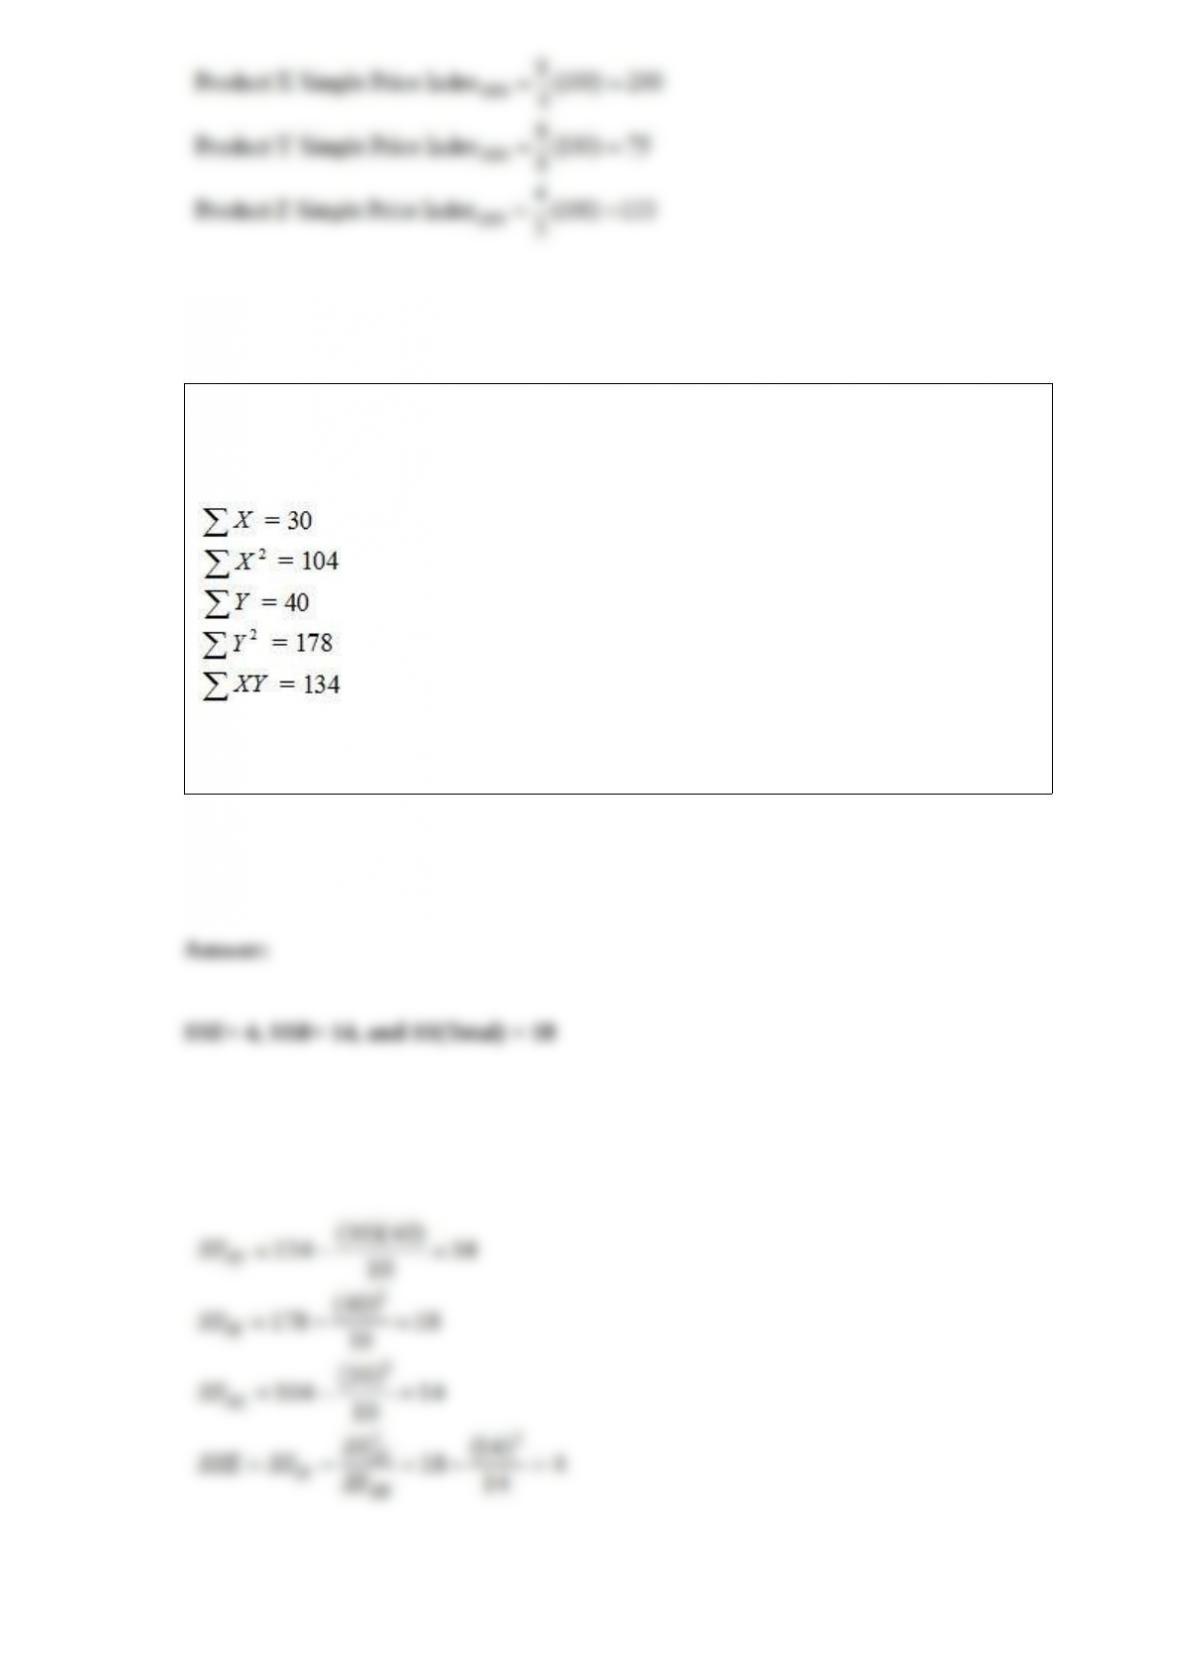
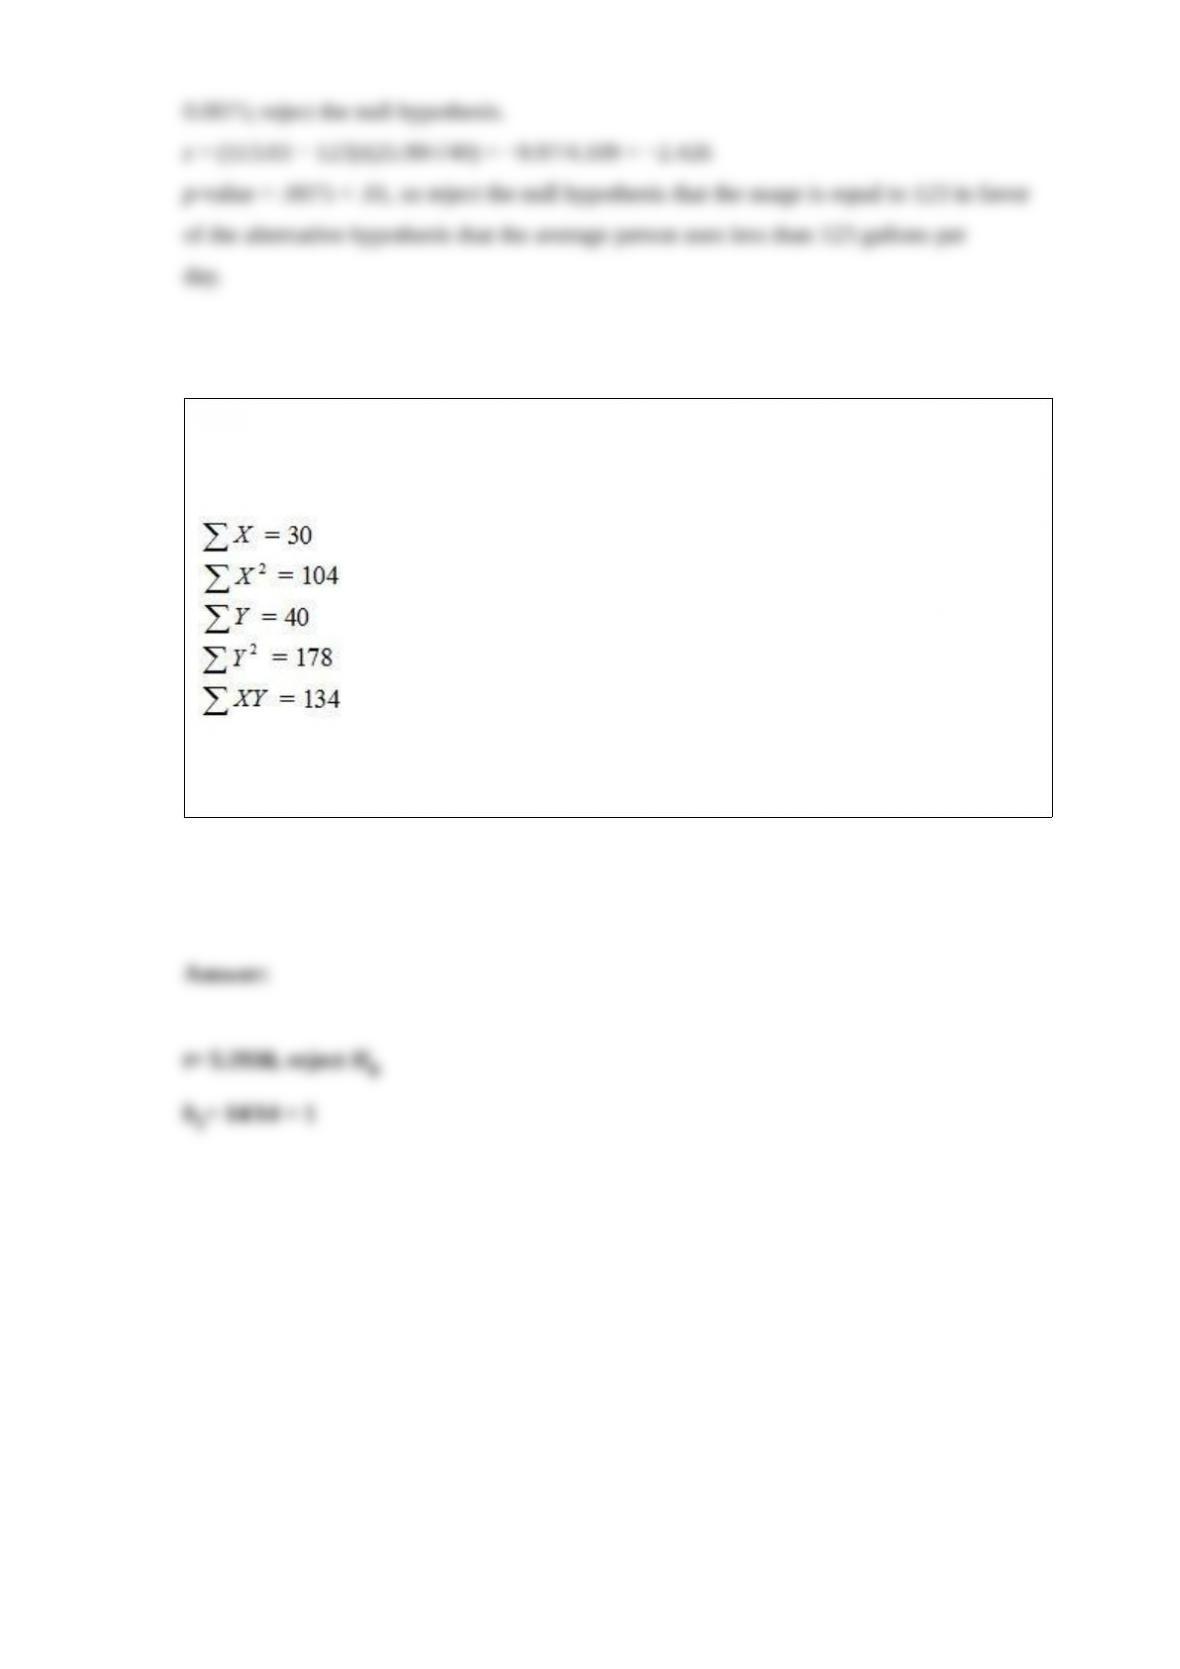
A data set with 7 observations yielded the following. Use the simple linear regression
model.
Find the estimated slope.
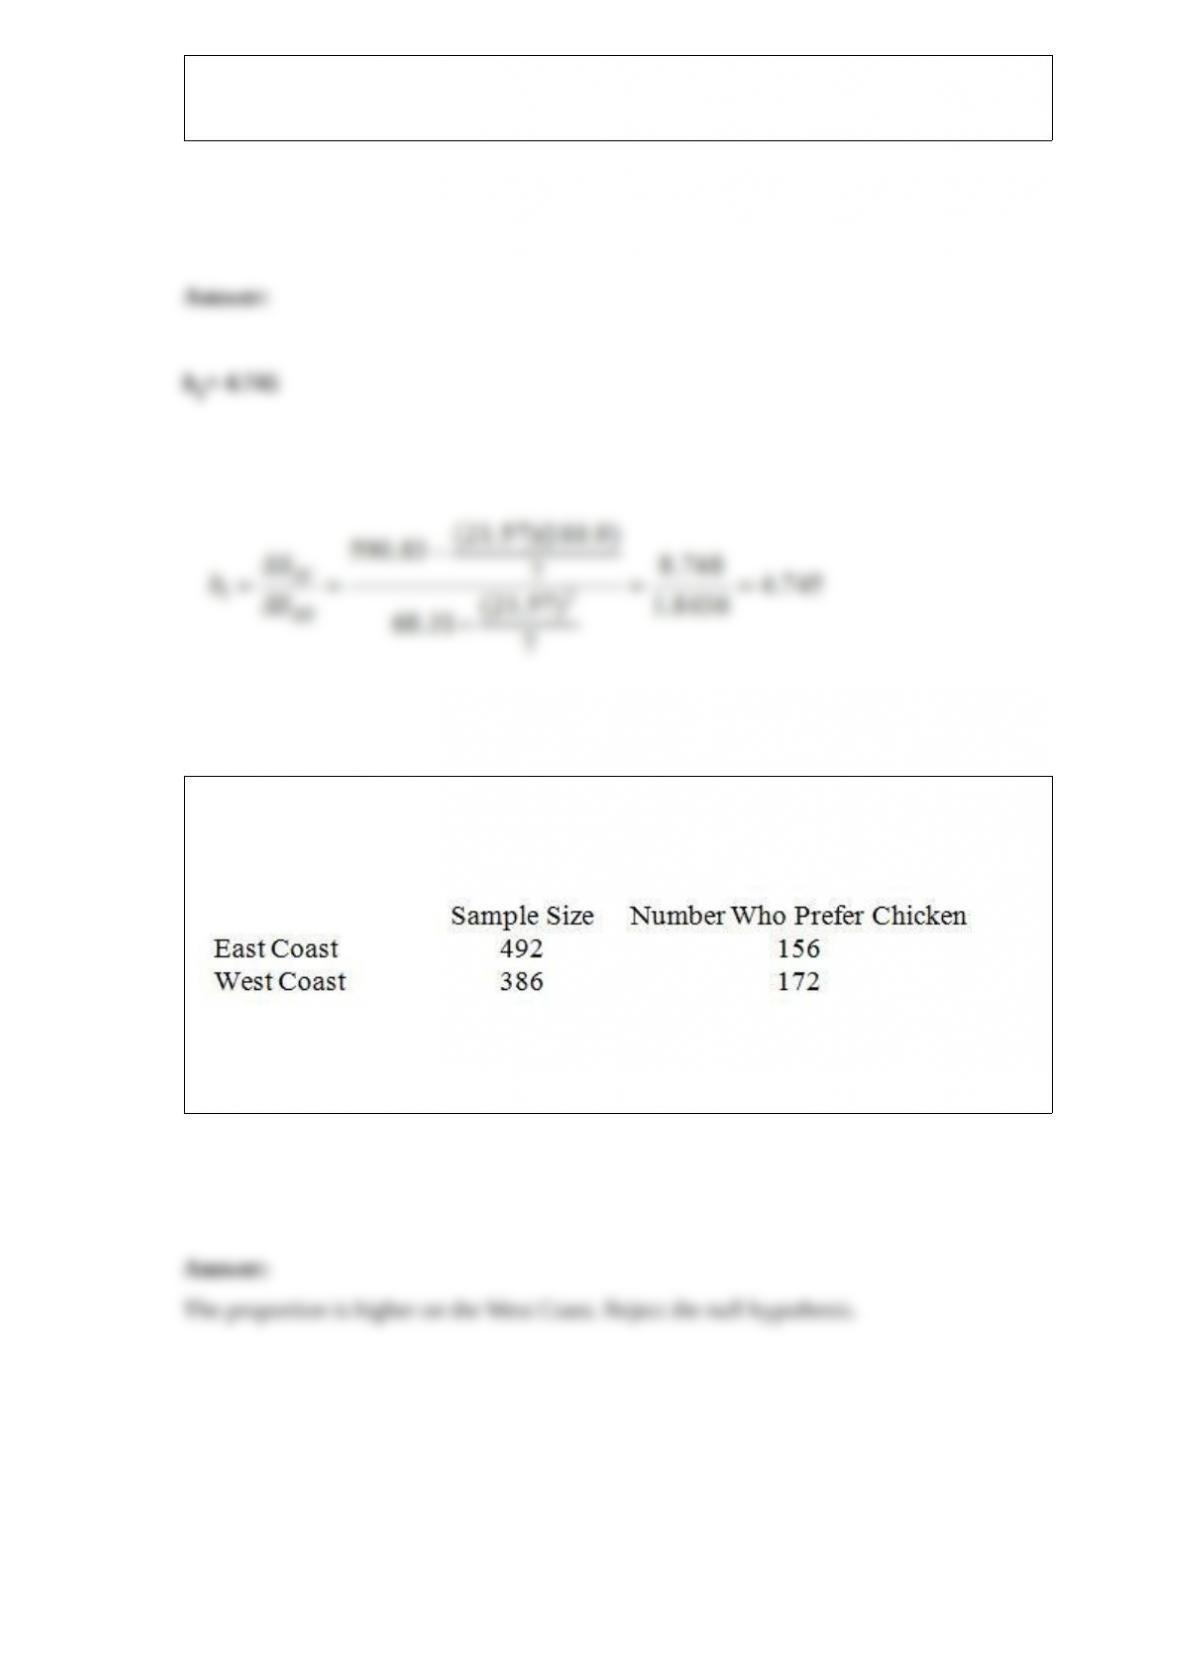
A marketing research company surveyed grocery shoppers on the East Coast and West
Coast to find the percentage of the customers who prefer chicken to other meat. The
data are given below.
The marketing research company is testing the hypothesis that the proportion of
customers who prefer chicken is higher on the West Coast. Test at α = .05.

Consider the following partial analysis of variance table from a randomized block
design with 10 blocks and 6 treatments.
Source SS
Treatments 2,477.53
Blocks 3,180.48
Error 11,661.38
Total
Determine the degrees of freedom for treatments.
It is estimated that the average person in the United States uses 123 gallons of water per
day. Some environmentalists believe this figure is too high and conduct a survey of 40
randomly selected Americans. They find a mean of 113.03 gallons and a population
standard deviation of 25.99 gallons. Calculate the p-value for this test statistic, and test
the hypothesis at α = .01 using the p-value rule.
An experiment was performed on a certain metal to determine if the strength is a
function of heating time. Results based on 10 metal sheets are given below. Use the
simple linear regression model.
Find the t statistic and test H0: b1 ≤ 0 vs. Ha: b1 > 0 at α = .05.