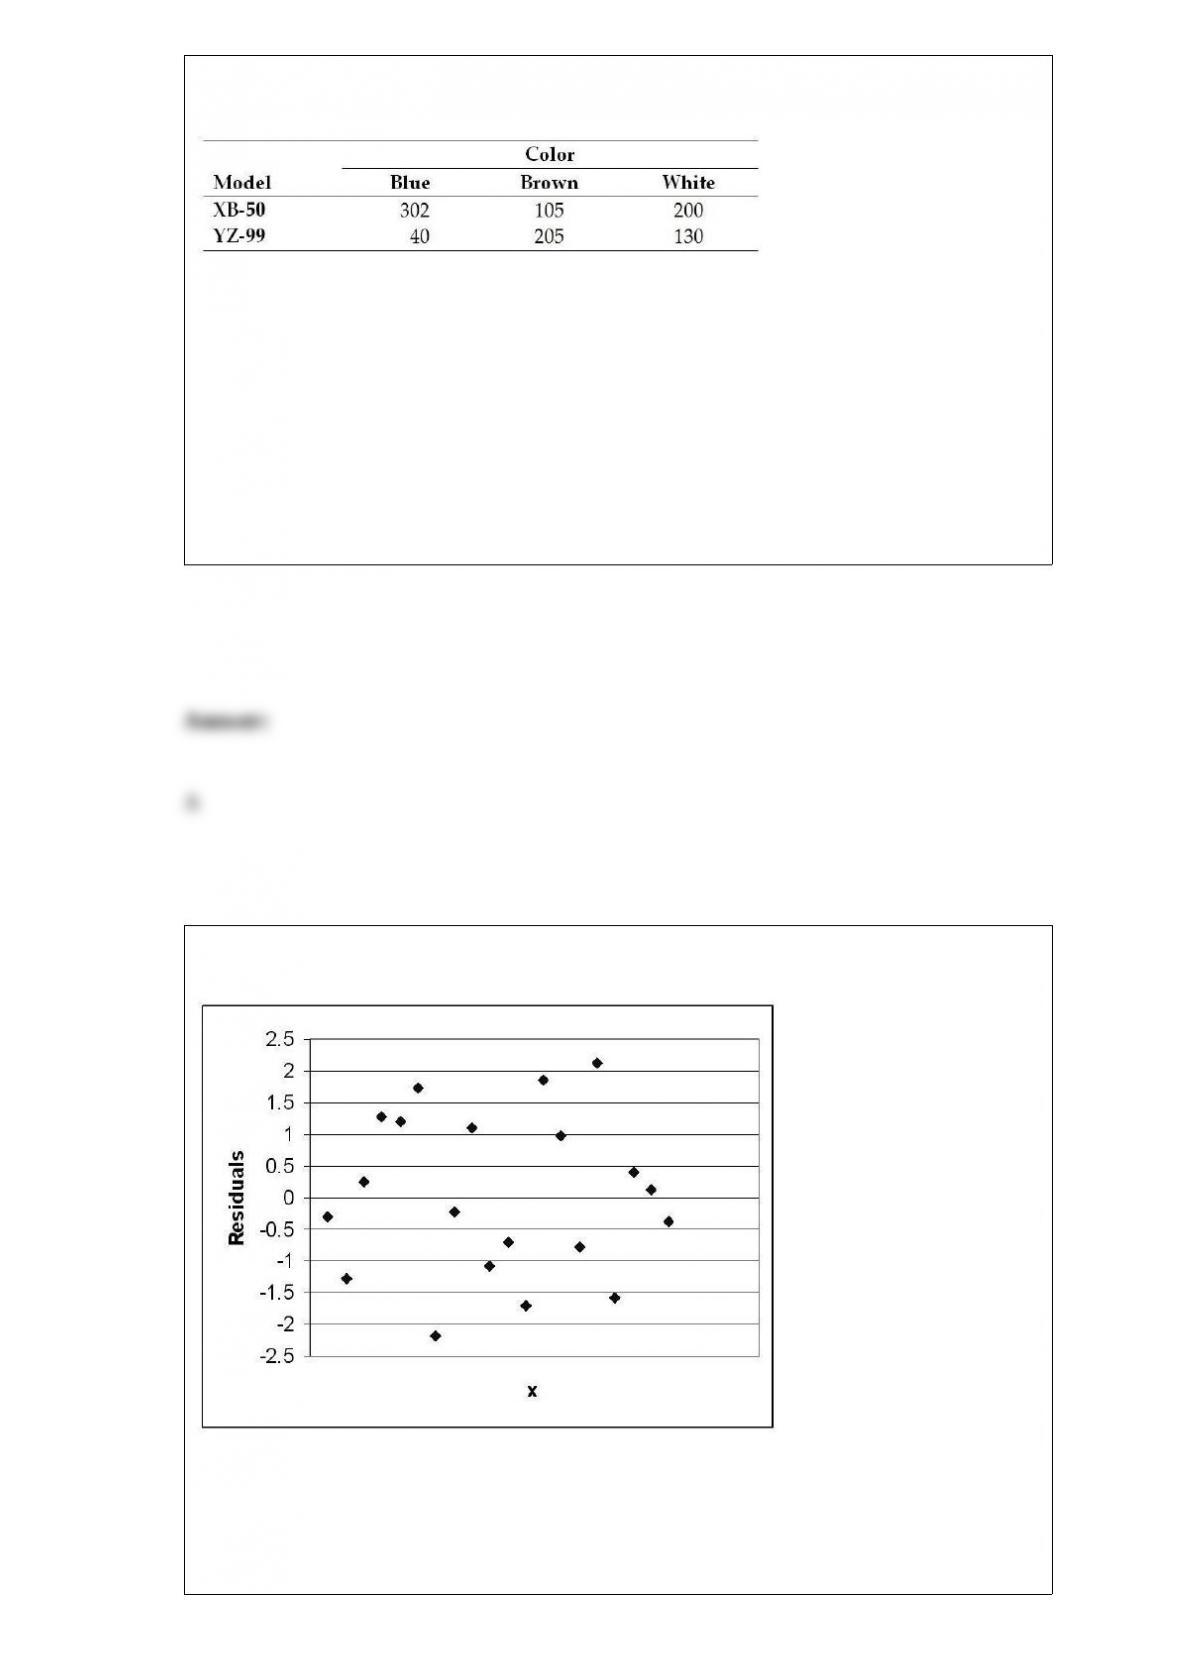
Cross County Bicycles makes two mountain bike models that each come in three
colors. The following table shows the production volumes for last week:
What is the joint probability that a product manufactured is a YZ-99 and brown?
A) 0.2088
B) 0.3819
C) 0.3157
D) 0.1324
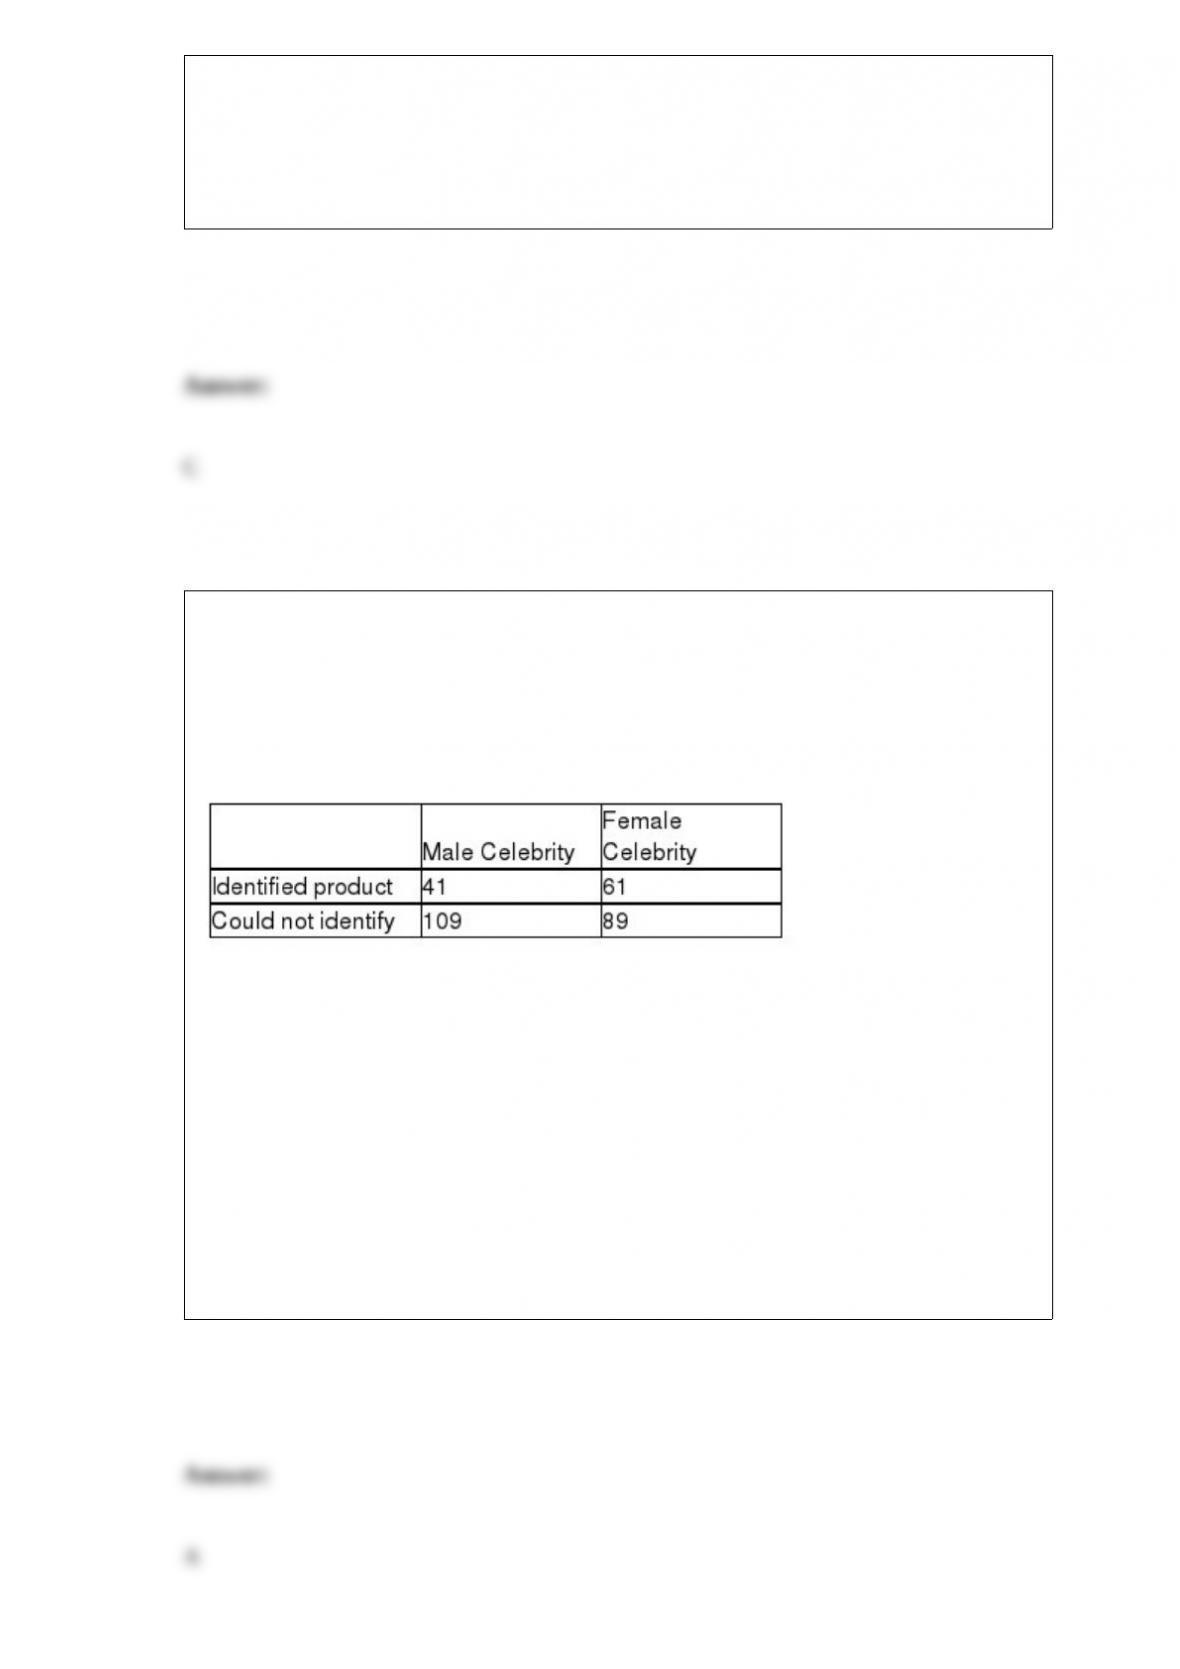
Based on the residual plot below, which of the following is correct?
The above residual plot shows:
A) linearity and nonconstant variance.

B) nonlinearity and constant variance.
C) linearity and constant variance.
D) nonlinearity and nonconstant variance.
The editors of a national automotive magazine recently studied 30 different automobiles
sold in the United States with the intent of seeing whether they could develop a multiple
regression model to explain the variation in highway miles per gallon. A number of
different independent variables were collected. Included in these were two variables
described as follows:
If these two variables are to be included in a regression model, how many additional
variables will be needed?
A) The model explains nearly 63 percent of the variation in the dependent variable.
B) If tested at the 0.05 significance level, the overall model would be considered
statistically significant.
C) The variable X1 has a slope coefficient that is significantly different from zero if
tested at the 0.05 level of significance.
D) All of the above are true.

A population has a proportion equal to 0.30. Calculate the following probabilities with
n = 100. Find P( ≤ 0.35).
A) 0.7244
B) 0.8621
C) 0.7124
D) 0.6126
Parts and Materials for the skis made by the Downhill Adventures Company are
supplied by two suppliers. Supplier A’s materials make up 30% of what is used, with
supplier B providing the rest. Past records indicate that 15% of supplier A’s materials
are defective and 10% of B’s are defective. Since it is impossible to tell which supplier
the materials came from once they are in inventory, the manager wants to know which
supplier most likely supplied the defective materials the foreman has brought to his
attention. Provide the manager this information.
A) Supplier A
B) Supplier B
C) Both are equally likely
D) Cannot be determined from this information

A consumer group plans to test whether a new passenger car that is advertised to have a
mean highway miles per gallon of at least 33 actually meets this level. They plan to test
the hypothesis using a significance level of 0.05 and a sample size of n = 100 cars. It is
believed that the population standard deviation is 3 mpg. Based upon this information,
what is the critical value in terms of miles per gallon that would be needed prior to
finding beta?
A) 32.5065
B) 33.4935
C) 33.588
D) 32.412
Based on a survey of 400 students in a university in which 20 percent indicated that
they were business majors. The university student newspaper reported that “20 percent
of all the students at the university are business majors.” This report is an example of:
A) a sample.
B) a population.
C) statistical inference.
D) descriptive statistics.

A commuter has two different routes available to drive to work. She wants to test
whether route A is faster than route B. The best hypotheses are:
A) H0 : μA – μβ ≥ 0
HA : μA– μβ < 0
B) H0 : μA – μβ ≤ 0
HA : μA– μβ > 0
C) H0 : μA – μβ = 0
HA : μA– μβ ≠ 0
D) H0 : μA – μβ < 0
HA : μA– μβ ≥ 0
We expect the actual frequencies in each cell to approximately match the corresponding
expected cell frequencies when:
A) H0 is false.
B) H0 is true.
C) H0 is falsely accepted.
D) the variables are related to each other.

John Thurgood founded a company that translates Chinese books into English. His
company is currently testing a computer-based translation service. Since Chinese
symbols are difficult to translate, John assumes the computer program will make some
errors, but then so do human translators. The computer error rate is supposed to be an
average of 3 per 400 words of translation. Suppose John randomly selects a 1,200-word
passage. Assuming that the Poisson distribution applies, if the computer error rate is
actually 3 errors per 400 words, determine the probability that no errors will be found.
A) 0.0001
B) 0.0141
C) 0.0415
D) 0.4557
Applebee’s International, Inc., is a U.S. company that develops, franchises, and operates
the Applebee’s Neighborhood Grill and Bar restaurant chain. It is the largest chain of
casual dining restaurants in the country, with over 1,500 restaurants across the United
States. The headquarters is located in Overland Park, Kansas. The company is
interested in determining if mean weekly revenue differs among three restaurants in a
particular city. The file entitled Applebees contains revenue data for a sample of weeks
for each of the three locations.
Test to determine if blocking the week on which the testing was done was necessary.
Use a significance level of 0.05.
A) The p-value = 0.078 > α = 0.05. This indicates that inserting the week on which the
testing was done was necessary.
B) The p-value = 0.078 > α = 0.05. This indicates that inserting the week on which the
testing was done was not necessary.
C) The p-value = 0.000 < α = 0.05. This indicates that inserting the week on which the
testing was done was necessary.
D) The p-value = 0.000 < α = 0.05. This indicates that inserting the week on which the
testing was done was not necessary.
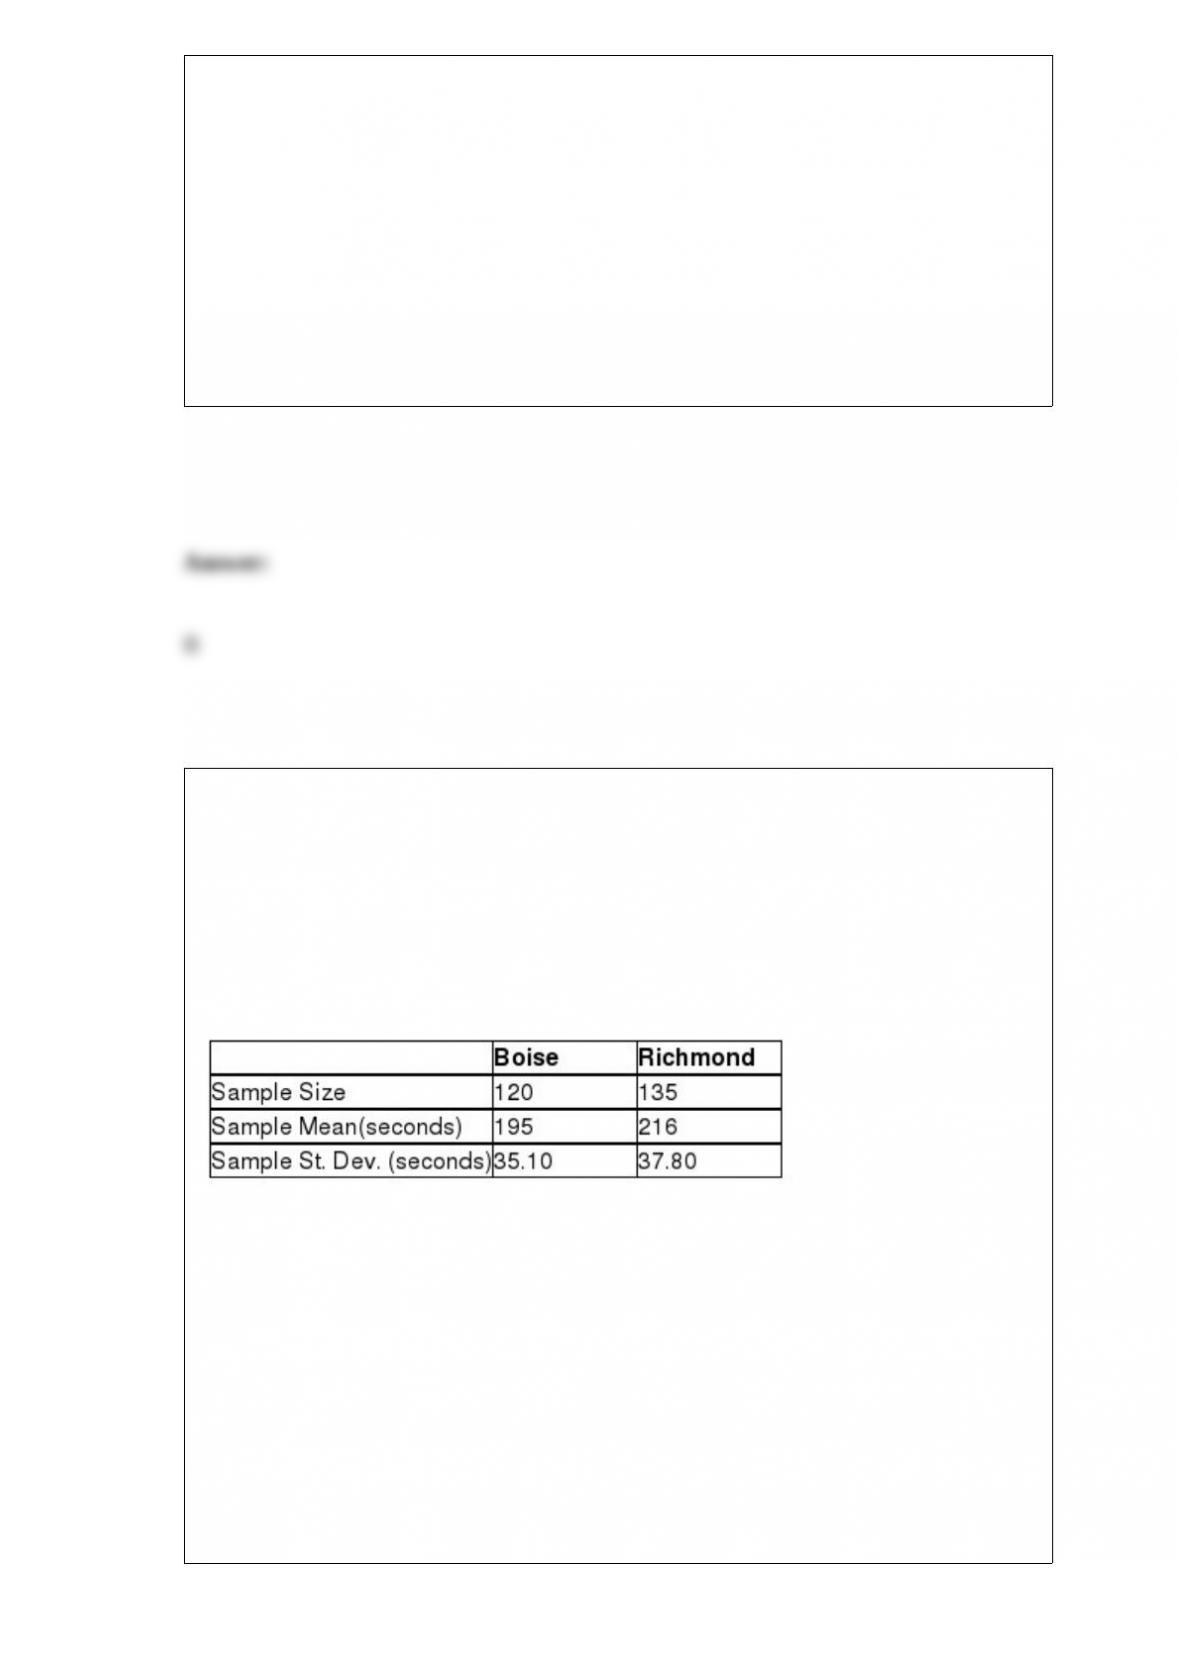
Many companies use well-known celebrities as spokespeople in their TV
advertisements. A study was conducted to determine whether brand awareness of
female TV viewers and the gender of the spokesperson are independent. Each in a
sample of 300 female TV viewers was asked to identify a product advertised by a
celebrity spokesperson. The gender of the spokesperson and whether or not the viewer
could identify the product was recorded. The numbers in each category are given below.
Referring to these sample data, if the appropriate null hypothesis is tested using a
significance level equal to .05, which of the following conclusions should be reached?
A) There is a relationship between gender of the celebrity and product identification.
B) There is no relationship between gender of the celebrity and product identification.
C) The mean number of products identified for males is different than the mean number
for females.
D) Females have higher brand awareness than males.

In a one-way ANOVA, which of the following is true?
A) The degrees of freedom associated with the between sum of squares is equal to one
less than the number of populations.
B) The critical value will be an F-value from the F distribution.
C) If the null hypothesis is rejected, it may still be possible that two or more of the
population means are equal.
D) All of the above
Which of the following time-series components can be identified when a company has
12 weeks of data beginning January and extending through March?
A) Seasonal component
B) Random component
C) Trend component
D) Both B and C
The Maple Grove Hotel manager has collected data on the number of rooms occupied
each evening for the past 700 nights. The fewest rooms occupied during that period was
11 and the most was the capacity, 430. Based on this information, which of the
following would be reasonable class limits for the first class if the manager wishes to
use 8 classes to develop a frequency distribution?
A) 0 to 40
B) 10 to < 65
C) 11 to 19
D) 0 to 52.38
A credit card company operates two customer service centers: one in Boise and one in
Richmond. Callers to the service centers dial a single number, and a computer program
routs callers to the center having the fewest calls waiting. As part of a customer service
review program, the credit card center would like to determine whether the average
length of a call (not including hold time) is different between the two centers. The
managers of the customer service centers are willing to assume that the populations of
interest are normally distributed with equal variances. Suppose a random sample of
phone calls to the two centers is selected and the following results are reported:
Using the sample results, develop a 90% confidence interval estimate for the difference
between the two population means.
A) -29.3124 ≤ (1 – 2) ≤ -18.6876
B) -24.2412 ≤ (1 – 2) ≤ -17.7588
C) -26.2941 ≤ (1 – 2) ≤ -11.8059
D) -28.5709 ≤ (1 – 2) ≤ -13.4291

The director of a state agency believes that the average starting salary for clerical
employees in the state is less than $30,000 per year. To test her hypothesis, she has
collected a simple random sample of 100 starting clerical salaries from across the state
and found that the sample mean is $29,750. State the appropriate null and alternative
hypotheses.
A) H0 : μ ≥ 30,000 HA : μ < 30,000
B) H0 : μ ≥ 29,750 HA: μ < 29,750
C) H0 : μ ≤ 30,000 HA: μ > 30,000
D) H0: μ ≤ 29,750 HA : μ > 29,750
Consider the following residual plot.
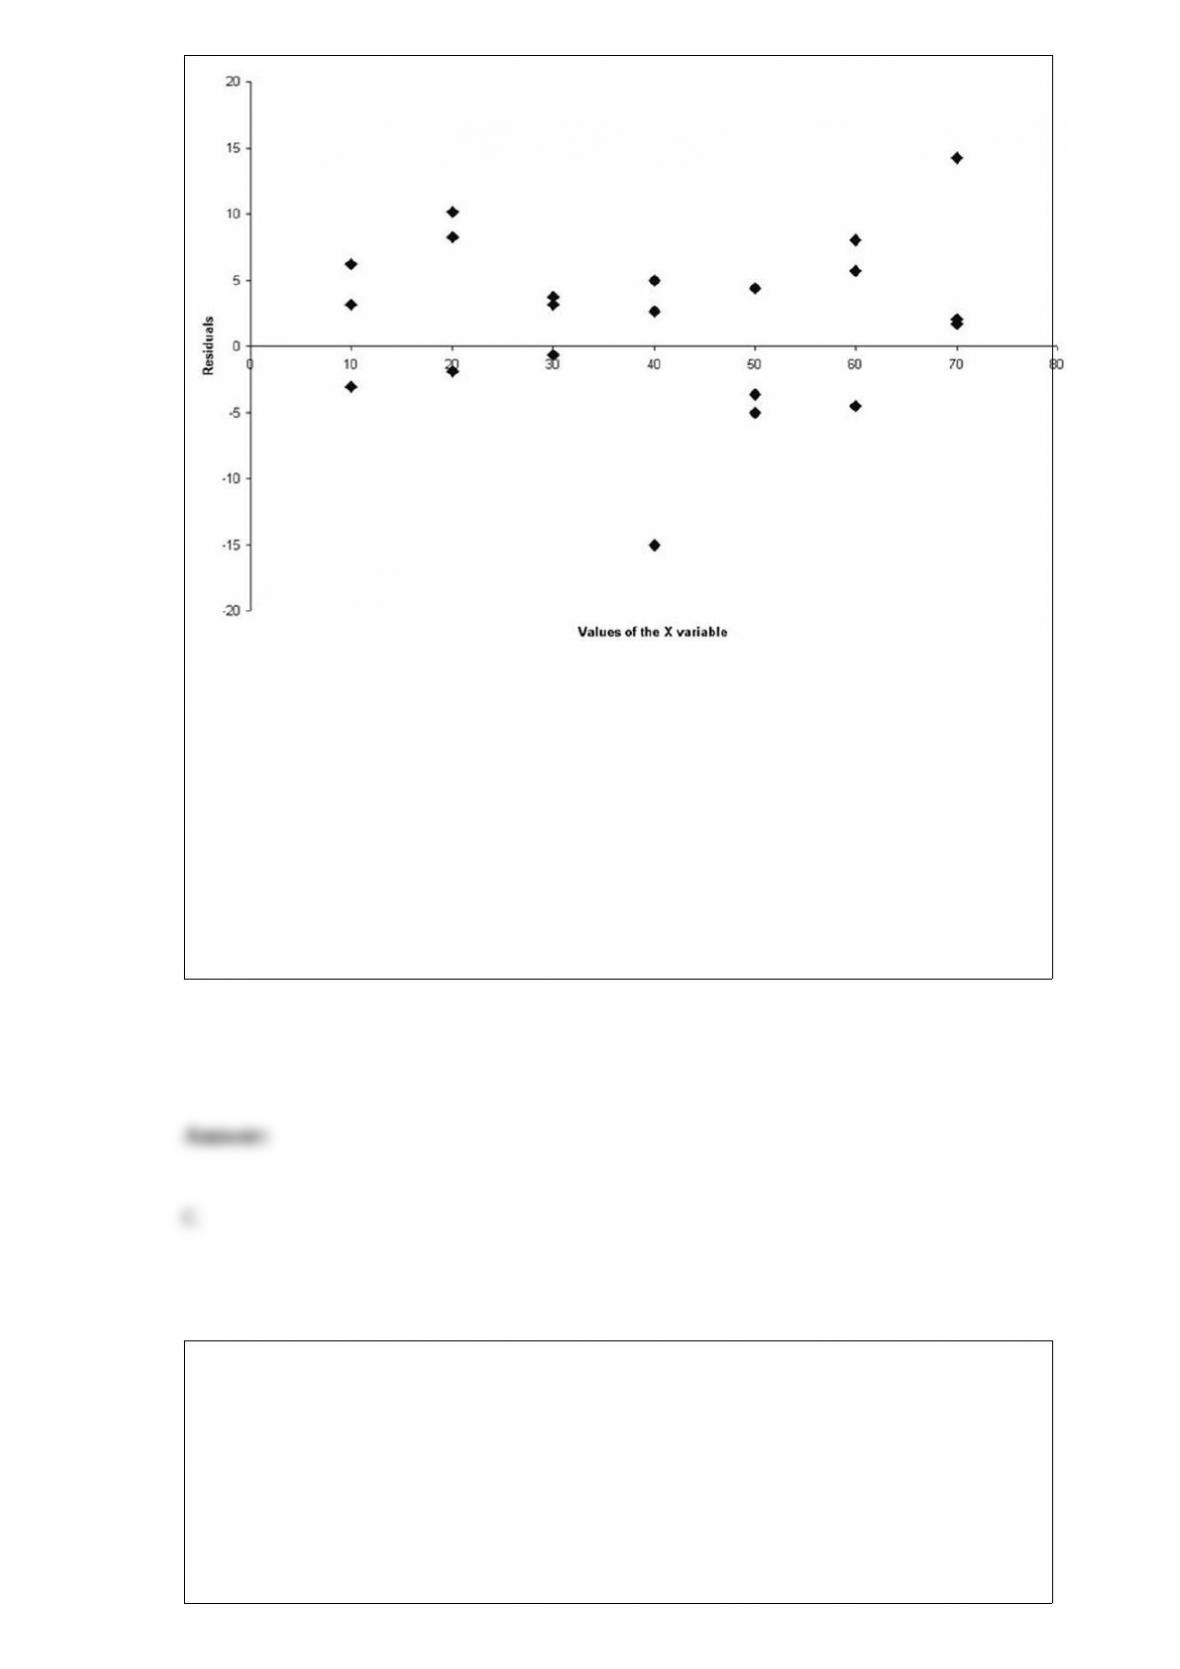
Given this plot, what conclusion should be reached?
A) There appears to be no basis for concluding that the relationship between the x and y
variable is not linear.
B) The assumption of constant variance seems to be supported by this plot.
C) Both A and B are true.
D) Neither A nor B are true.
The probability that a product is found to be defective is 0.10. If we examine 50
products, which of the following has the highest probability?
A) 3 defective products are found.
B) 4 defective products are found.
C) 5 defective products are found.

D) 6 defective products are found.
There are a number of highly touted search engines for finding things of interest on the
Internet. Recently a consumer rating system ranked two search engines ahead of the
others. Now, a computer user’s magazine wishes to make the final determination
regarding which one is actually better at finding particular information. To do this, each
search engine was used in an attempt to locate specific information using specified
keywords. Both search engines were subjected to 100 queries. Search engine 1
successfully located the information 88 times and search engine 2 located the
information 80 times. Using a significance level equal to 0.05, what is the null
hypothesis to be tested?
A) H0 : μ1 = μ2
B) H0 : p1 ≠ p2
C) H0 : 1 = 2
D) H0 : p1 = p2
The editors of a national automotive magazine recently studied 30 different automobiles
sold in the United States with the intent of seeing whether they could develop a multiple
regression model to explain the variation in highway miles per gallon. A number of
different independent variables were collected. The following regression output is the
result of using a forward selection stepwise regression approach.
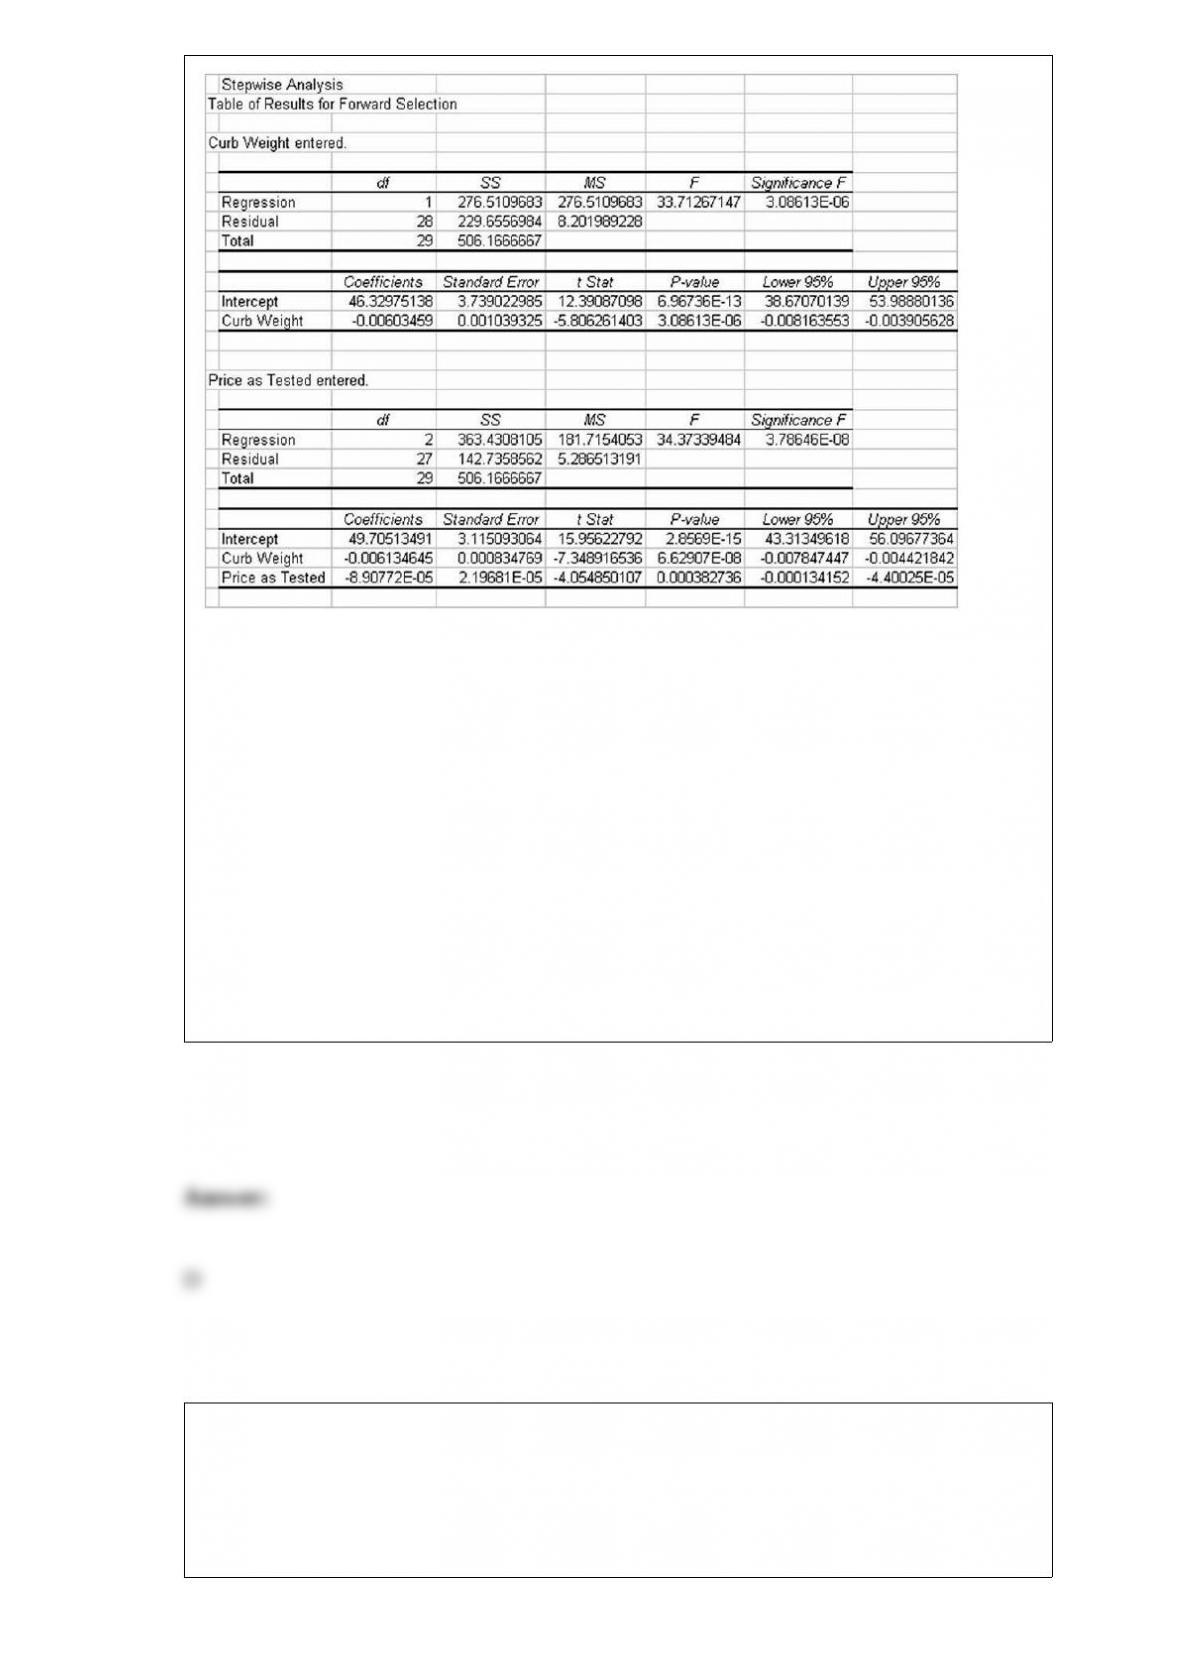
Which of the following might explain why no other independent variables entered the
model?
A) No other variable had a correlation with the dependent variable that was close to 1.0.
B) None of the remaining variables had a positive correlation with y.
C) The remaining variables must be nearly perfectly correlated with the two variables
already in the model.
D) Given the two variables already in the model, none of the others could add
significantly to the percentage of variation in the y variable that would be explained by
the model.
The editors of a national automotive magazine recently studied 30 different automobiles
sold in the United States with the intent of seeing whether they could develop a multiple
regression model to explain the variation in highway miles per gallon. A number of
different independent variables were collected. The following regression output (with
some values missing) was recently presented to the editors by the magazine’s analysts:
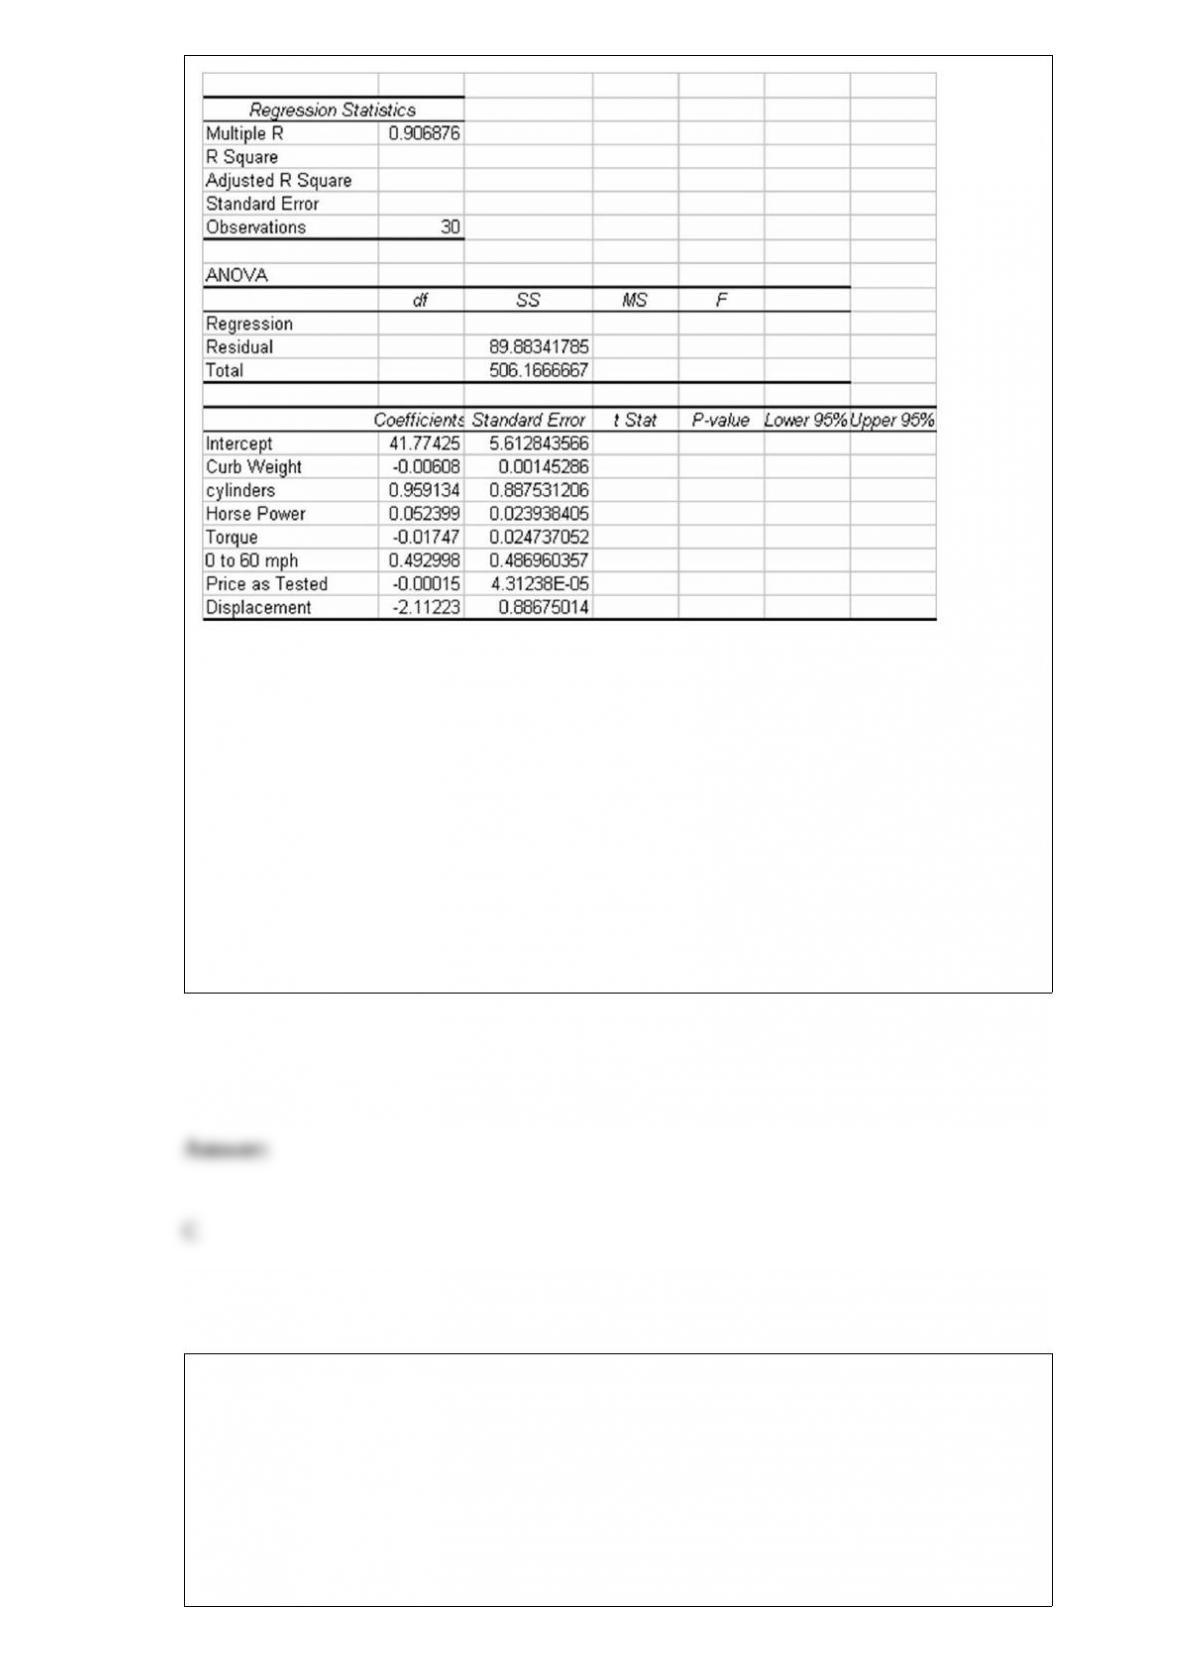
Based on this output and your understanding of multiple regression analysis, what is the
critical value for testing the significance of the overall regression model at a 0.05 level
of statistical significance?
A) About F = 5.92
B) Nearly F = 3.80
C) Approximately F = 2.50
D) None of the above
If a data set has 1,133 sorted values, what value corresponds to the 3rd quartile?
A) The 250th value
B) The 850th value
C) The 760th value

D) The 849th value
After completing sales training for a large company, it is expected that the salesperson
will generate a sale on at least 15 percent of the calls he or she makes. To make sure
that the sales training process is working, a random sample of n = 400 sales calls made
by sales representatives who have completed the training have been selected and the
null hypothesis is to be tested at 0.05 alpha level. Suppose that a sale is made on 36 of
the calls. Based on these sample data, which of the following is true?
A) The null hypothesis should be rejected since the test statistic falls in the lower tail
rejection region.
B) The null hypothesis is supported since the sample results do not fall in the rejection
region.
C) There is insufficient evidence to reject the null hypothesis and the sample proportion
is different from the hypothesized proportion due to sampling error.
D) It is possible that a Type II statistical error has been committed.
Considering the following printout for a two-factor ANOVA study, which of the
following is the number of replications used?

A) 2
B) 5
C) 4
D) Can’t be determined without more information.
Scatter diagrams can be used for either quantitative or qualitative data.
A recent study of 15 shoppers showed that the correlation between the time spent in the
store and the dollars spent was 0.235. Using a significance level equal to 0.05, which of
the following is the appropriate null hypothesis to test whether the population
correlation is zero?

A) H0: r = 0.0
B) H0 : ρ = 0.0
C) H0 : μ = 0.0
D) H0 : ρ ≠ 0
To test the following hypotheses at the 0.05 level of significance, using a sample size of
n = 15.
H0 : σ2 = 0.05
HA : σ2 ≠ 0.05
What is the upper tail critical value?
A) 23.685
B) 24.996
C) 27.488
D) 26.119
In a survey, respondents were asked to indicate their favorite brand of cereal (Post or
Kellogg’s). They were allowed only one choice. What is the probability concept that

implies it is not possible for a single respondent to state both Post and Kellogg’s to be
the favorite cereal?
A) Concept of independent events
B) Concept of mutually exclusive events
C) Concept of dependent events
D) Concept of mutually inclusive events
The file Danish Coffee contains a random sample of 144 Danish coffee drinkers and
measures the annual coffee consumption in kilograms for each sampled coffee drinker.
A marketing research firm wants to use this information to develop an advertising
campaign to increase Danish coffee consumption.
Develop and interpret a 90% confidence interval estimate for the mean annual coffee
consumption of Danish coffee drinkers.
A) (6.4257, 6.6479)
B) (6.1768, 6.8968)
C) (6.3881, 6.6855)
D) (6.3366, 6.7370)

The U.S. Bureau of Labor Statistics (www.bls.gov) released its Consumer Expenditures
report in October 2008. Among its findings is that average annual household spending
on food at home was $3,624. Suppose a random sample of 137 households in Detroit
was taken to determine whether the average annual expenditure on food at home was
less for consumer units in Detroit than in the nation as a whole. The sample results are
in the file Detroit Eats. Based on the sample results, can it be concluded at the α = 0.02
level of significance that average consumer-unit spending for food at home in Detroit is
less than the national average?
A) Because t = -13.2314 is less than the critical t value of -1.4126, do not reject H0.
The annual average consumer unit spending for food at home in Detroit is not less than
the 2006 national consumer unit average
B) Because t = -13.2314 is less than the critical t value of -1.4126, reject H0.
The annual average consumer unit spending for food at home in Detroit is less than the
2006 national consumer unit average
C) Because t = -15.7648 is less than the critical t value of -2.0736, do not reject H0.
The annual average consumer unit spending for food at home in Detroit is not less than
the 2006 national consumer unit average.
D) Because t = -15.7648 is less than the critical t value of -2.0736, reject H0.
The annual average consumer unit spending for food at home in Detroit is less than the
2006 national consumer unit average.
It is assumed that the time customers spend in a record store is uniformly distributed
between 3 and 12 minutes. Based on this information, what is the probability that a
customer will be exactly 7.50 minutes in the record store?
A) 0.1250
B) 0.05
C) Essentially zero

D) 0.111
If a binomial distribution applies with a sample size of n = 20, find the probability of at
least 7 successes if the probability of a success is 0.25.
A) 0.1814
B) 0.2142
C) 0.2333
D) 0.3123
Assuming the population of interest is approximately normally distributed, construct a
95% confidence interval estimate for the population mean given the following values:
A) (16.73, 20.07)
B) (13.22, 23.58)
C) (15.86, 20.94)
D) (14.20, 22.60)

A company has recorded annual sales for the past 14 years and found the following
linear trend model:
= 5.23 + 144.60t. This means that:
A) on average sales are increasing by of 5.23 per year.
B) on average sales are increasing by of 144.6 per year.
C) there is a seasonal component in the data.
D) sales in year 1 were 5.23.