
An assembly process takes between 20 and 40 minutes to complete with the distribution
of time thought to be uniformly distributed. Based on this, the percentage of assemblies
that require less than 25 minutes is 0.05.
Because variations are unavoidable in a system, the output of the system is always
unpredictable.
All Wilcoxon signed rank tests are two-tailed tests since we are testing whether the
population median is the exact center of the population distribution.
If a population standard deviation is computed to be 345, it will almost always be the
case that a standard deviation computed from a random sample from that population
will be larger than 345.


The critical value for a one-tailed Mann-Whitney U test with sample sizes of n1 = 10
and n2 = 10 is 23 for a 0.05 level of significance.
When conducting a hypothesis test to determine whether or not two groups differ, using
paired samples rather than independent samples has the advantage of controlling for
sources of variation that might distort the conclusions of the study.
The purpose of deseasonalizing a time series is that a strong seasonal pattern may make
it difficult to see a trend in the time series.

Based on the correlations below:
we could say that x1 accounts for 64 percent of the variation in y and x2 accounts for 49
percent of the variation in y. So if both xs are included in a multiple regression model,
then the resulting R-square = 1.13.
A correlation matrix shows the correlation between each independent variable and the
dependent variable but gives no information about the potential for multicollinearity
problems.
The difference between a scatter plot and a scatter diagram is that the scatter plot has
the independent variable on the x-axis while the independent variable is on the Y-axis in
a scatter diagram.


Statistical inference would be used as the primary statistical tool by a quality control
manager who wishes to estimate the average weight of her company’s products.
A box and whisker plot shows where the mean value falls relative to the median for a
variable.
A continuous random variable approaches normality as the level of skewness increases.
Renton Industries makes replacement parts for the automobile industry. As part of the

company’s capacity planning, it needs a long-range total demand forecast. The
following information was generated based on 10 years of historical data on total
number of parts sold each year.
Based on this information, we can conclude that sales on average have been growing by
more than 48 thousand annually.
In a multiple regression model where three independent variables are included in the
model, the percentage of explained variation will be equal to the square of the sum of
the correlations between the independent variables and the dependent variable.
An Internet service provider is interested in estimating the proportion of homes in a
particular community that have computers but do not already have Internet access. To


do this, the company has selected a random sample of n = 200 homes and made calls. A
total of 188 homes responded to the survey question with 38 saying that they had a
computer with no Internet access. The 95 percent confidence interval estimate for the
true population proportion is approximately 0.1447 – 0.2595.
Type II errors are typically greater for two-tailed hypothesis tests than for one-tailed
tests.
Some stocks are referred to as cyclical stock because they tend to be in favor for several
years and then out of favor for several years. This is a correct use of the term cyclical.
When testing a hypothesis involving population proportions, an increase in sample size
will result in a smaller chance of making a Type I statistical error.

The prediction interval developed from a simple linear regression model will be at its
narrowest point when the value of x used to predict y is equal to the mean value of x.
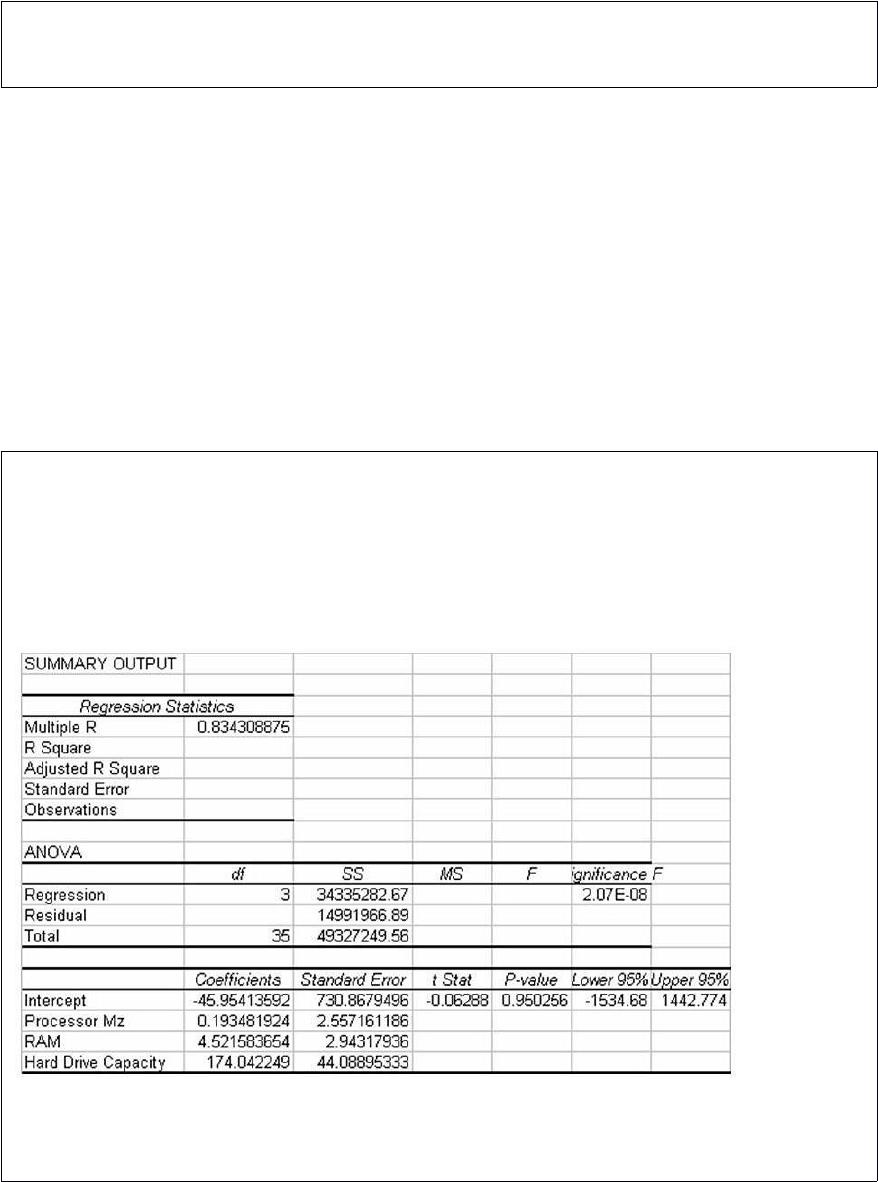
A study has recently been conducted by a major computer magazine publisher in which
the objective was to develop a multiple regression model to explain the variation in
price of personal computers. Three independent variables were used. The following
computer printout shows the final output. However, several values are omitted from the
printout.
Given this information, the calculated test statistic for the regression slope coefficient
on the variable RAM, is approximately 1.54.

The Georgia Company, a pharmaceutical company, recently conducted a study in which
20 people were given a new drug and 20 other people were given a placebo. The
objective was to determine whether there was a difference in pain relief between those
using the new drug versus those using the placebo. The data collection used here is an
example of an experiment.
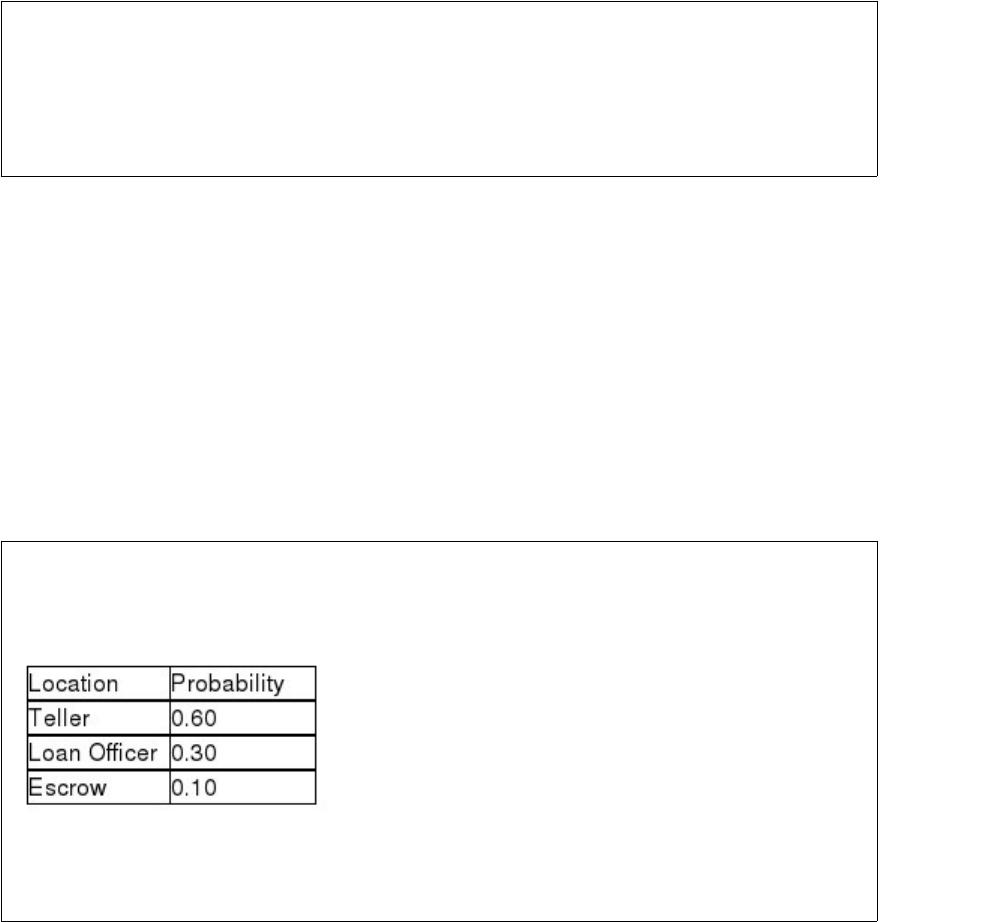
When customers come to a bank, there are three primary locations they may select to go
to: teller, loan officer, or escrow department. Based on past experience, the following
probability distribution applies:
Seventy percent of customers are males. The probability that the next two customers to
enter the bank are males and go to the Loan Officer is 0.42.

In hypothesis testing, the null hypothesis should contain the equality sign.
All other factors held constant, the higher the confidence level, the closer the point
estimate for the population mean will be to the true population mean.
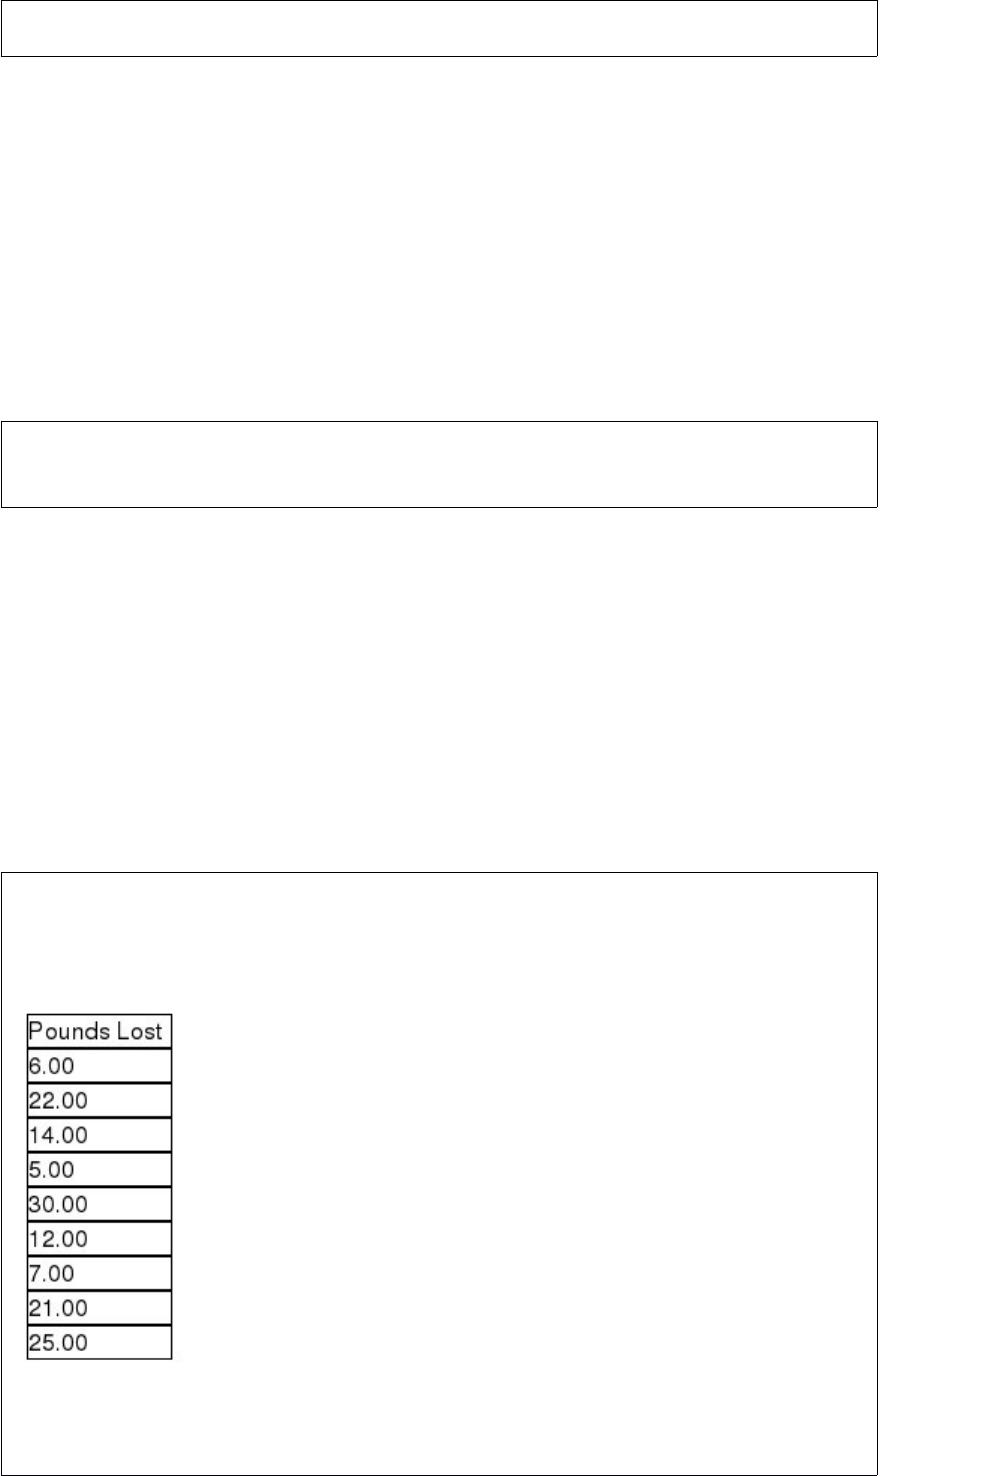
Managers for a company that produces a weight loss product claim that the median
weight lost over six weeks for people who use this product will be at least 20 pounds.
The following data were collected from a sample of nine people who used the product.
In order to test the manager’s claim, they will need to assume that the population is
normally distributed.


A lube and oil change business believes that the number of cars that arrive for service is
the same each day of the week. If the business is open six days a week (Monday –
Saturday) and a random sample of n = 200 customers is selected, the critical value for
testing the hypothesis using a goodness-of-fit test is x2 = 9.2363 if the alpha level for
the test is set at .10.
One of the assumptions associated with the Wilcoxon Matched-Pairs Signed Rank test
is that the distribution of the population differences is symmetric about their median.
The product manager for a large retail store has recently stated that she estimates that
the average purchase per visit for the store’s customers is between $33.00 and $65.00.
The $33.00 and the $65.00 are considered point estimates for the true population mean.
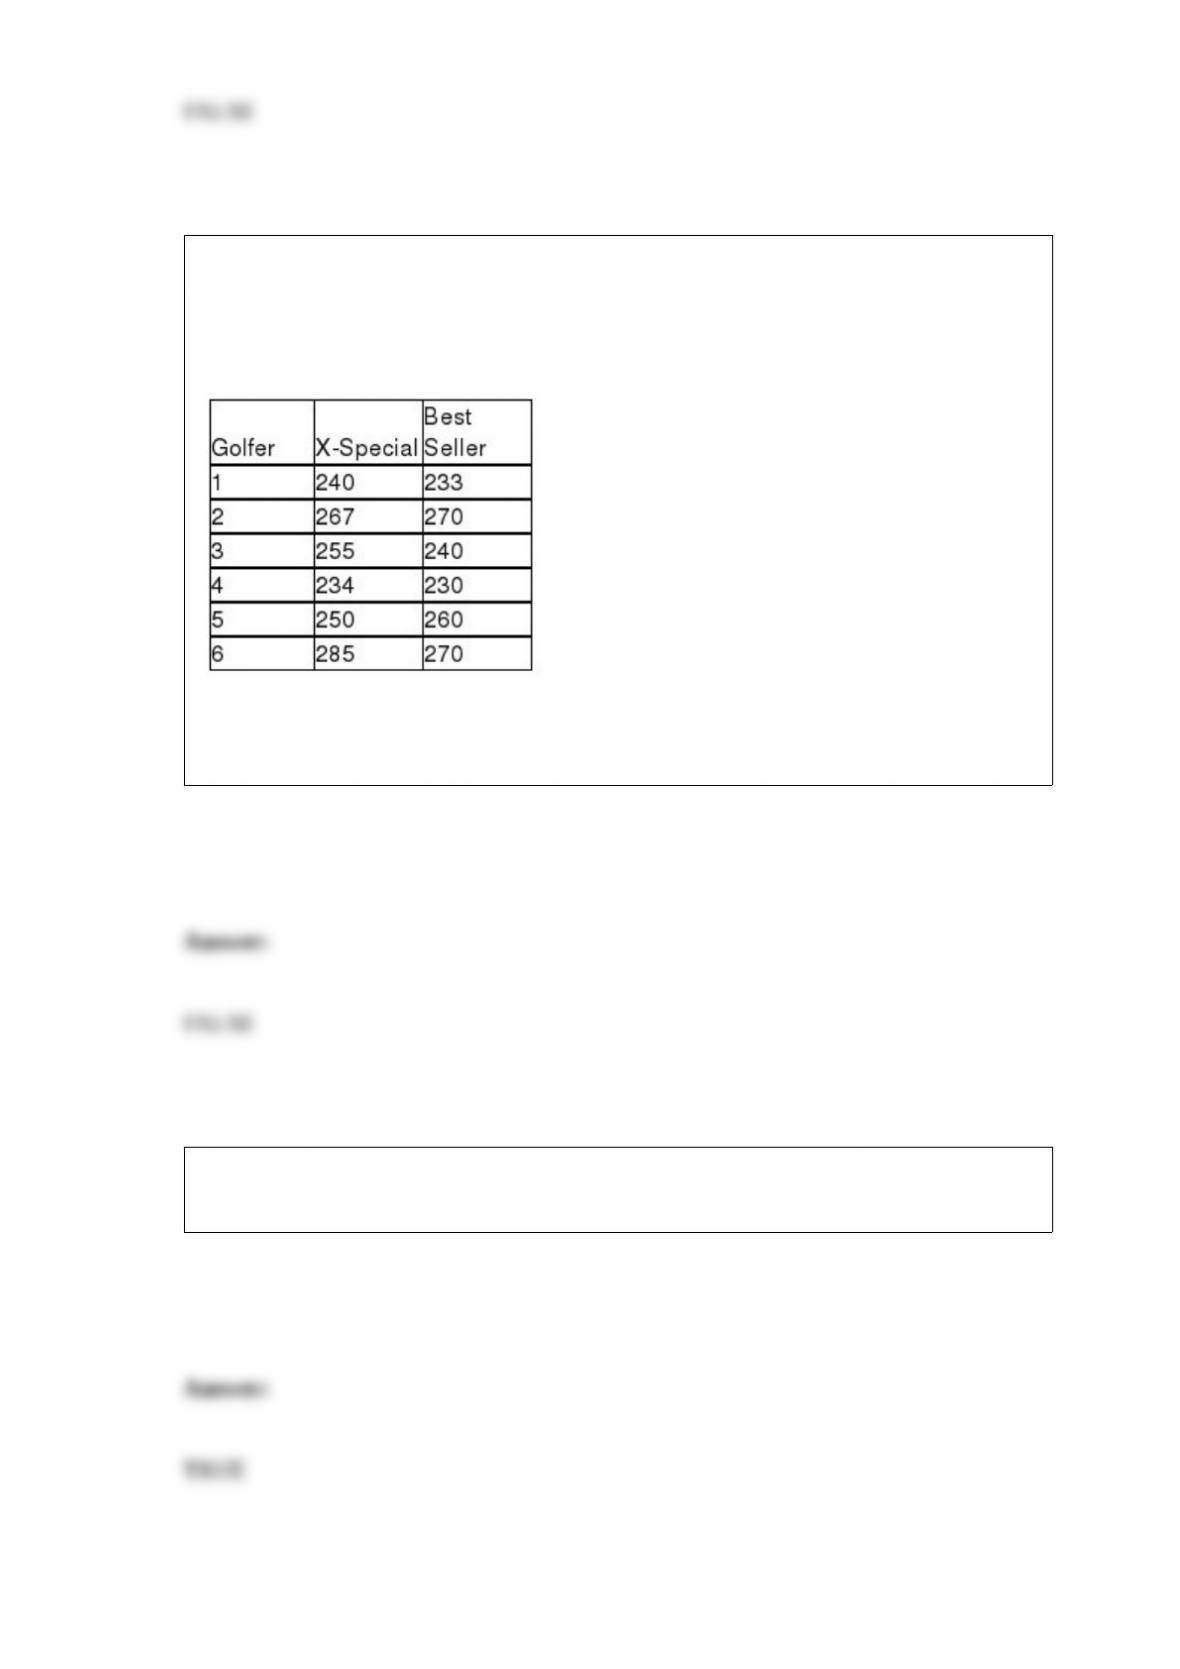
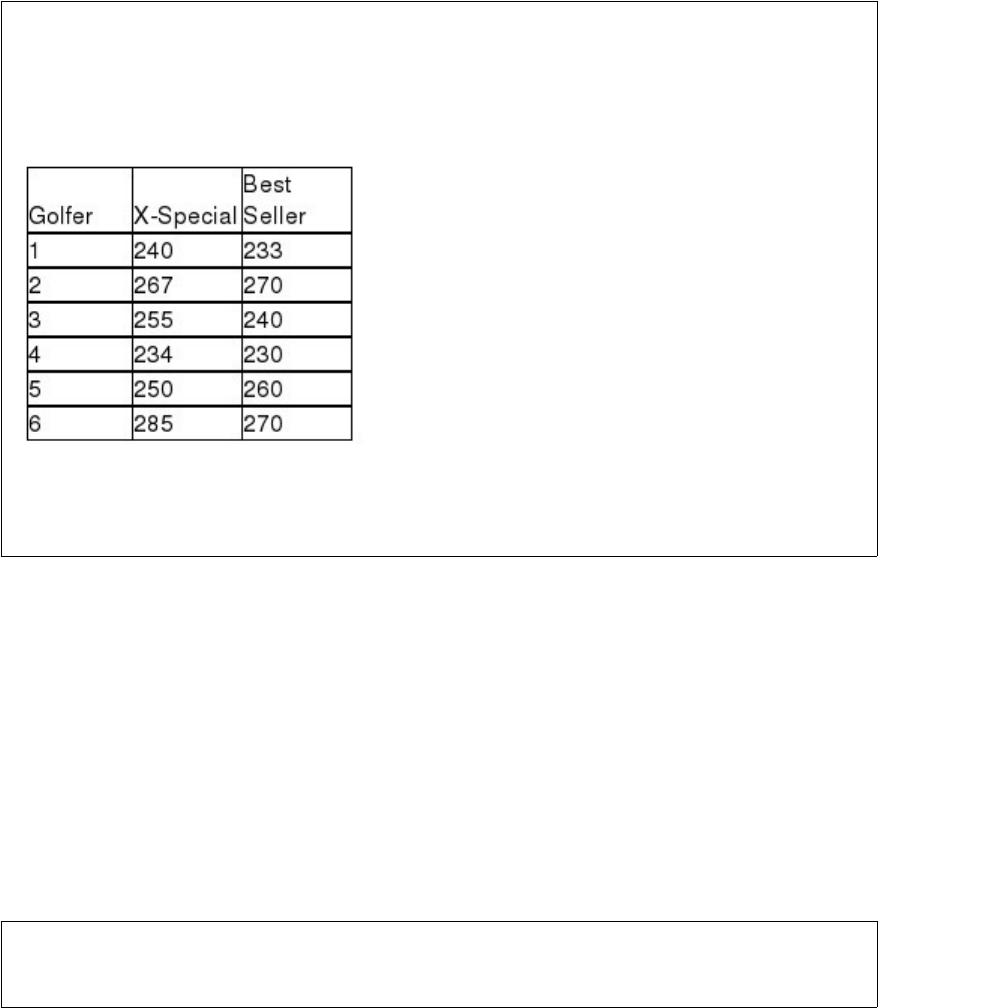
In order to determine whether the median distance for the X-Special golf ball exceeds
the median distance for the best-selling golf ball, six golfers were selected and asked to
hit each ball with their driver. The distance was recorded. The following data were
observed.
Based on these data, and testing at an alpha = 0.025 level, the critical value for the
Wilcoxon Matched Pairs Signed Rank test is 2.
When the marketing manager for a large company surveys a portion of the total
customers of his company, he is using a sample from the population.
In conducting a hypothesis test for a correlation, the correct probability distribution to
use is the F distribution.
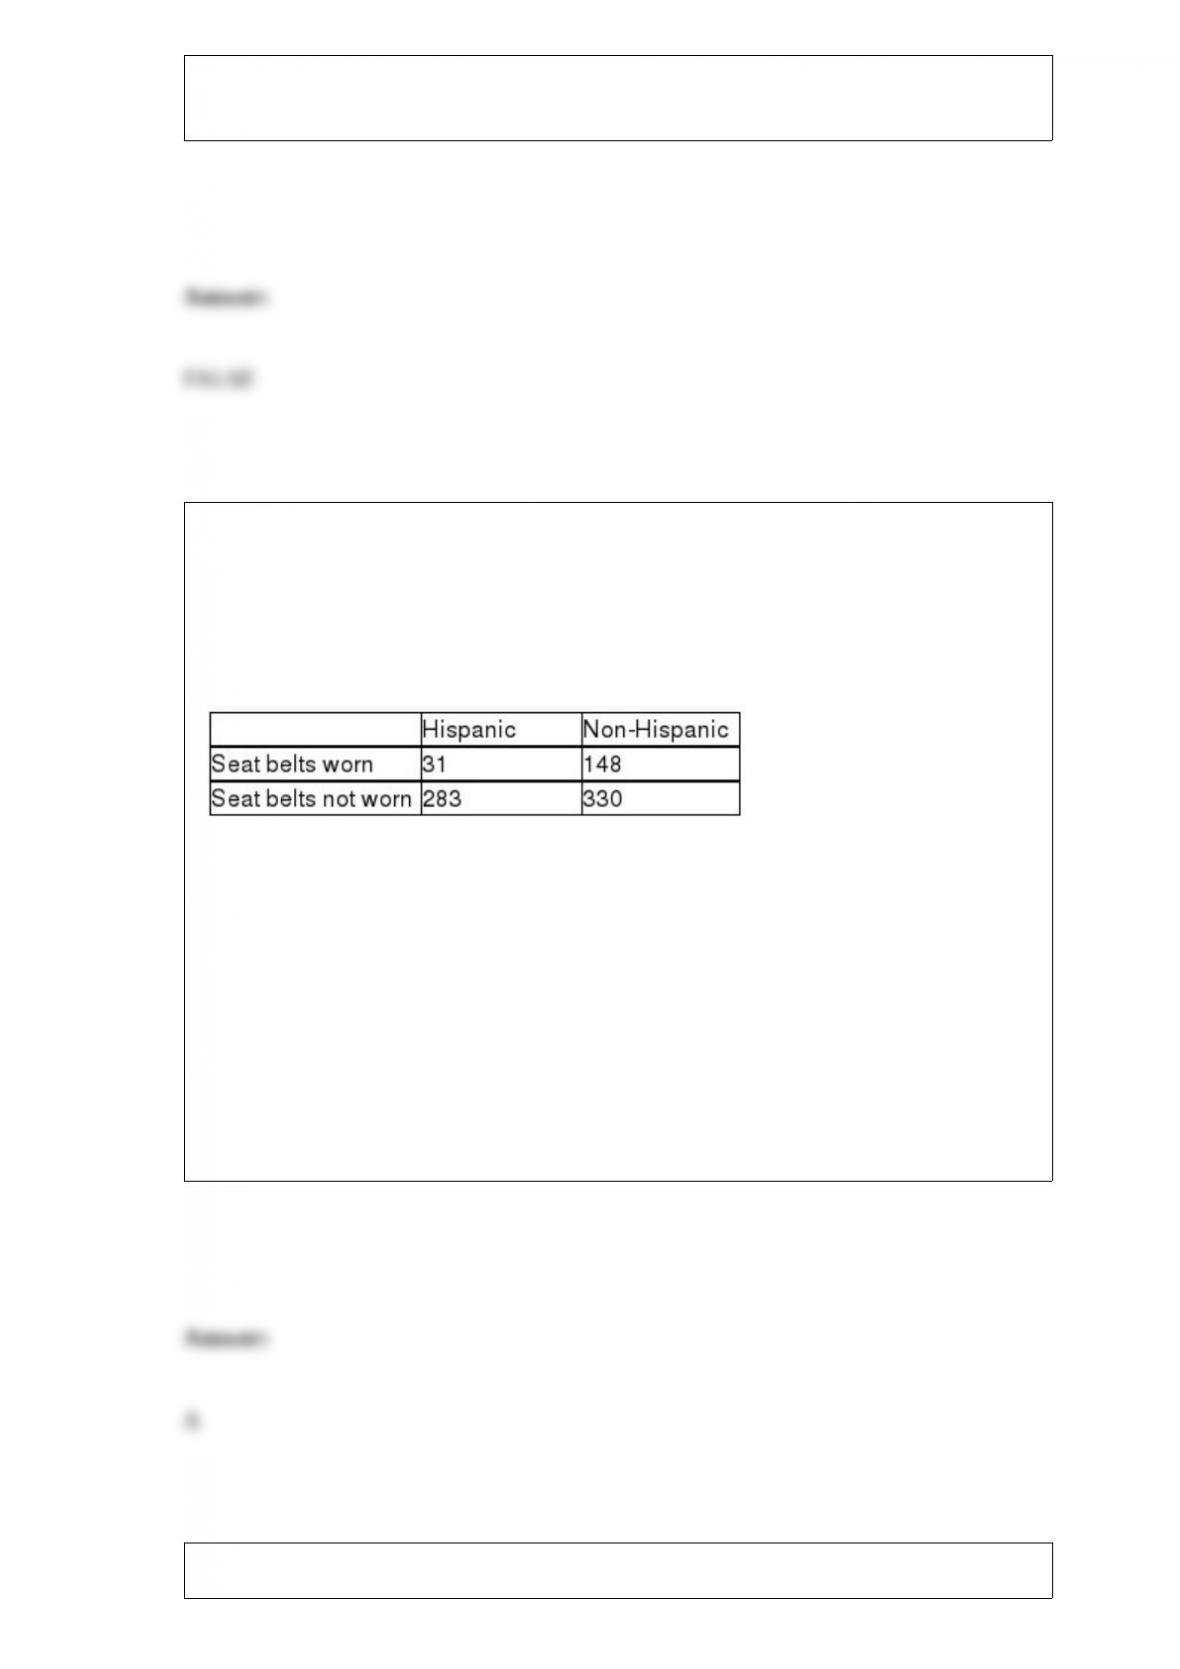
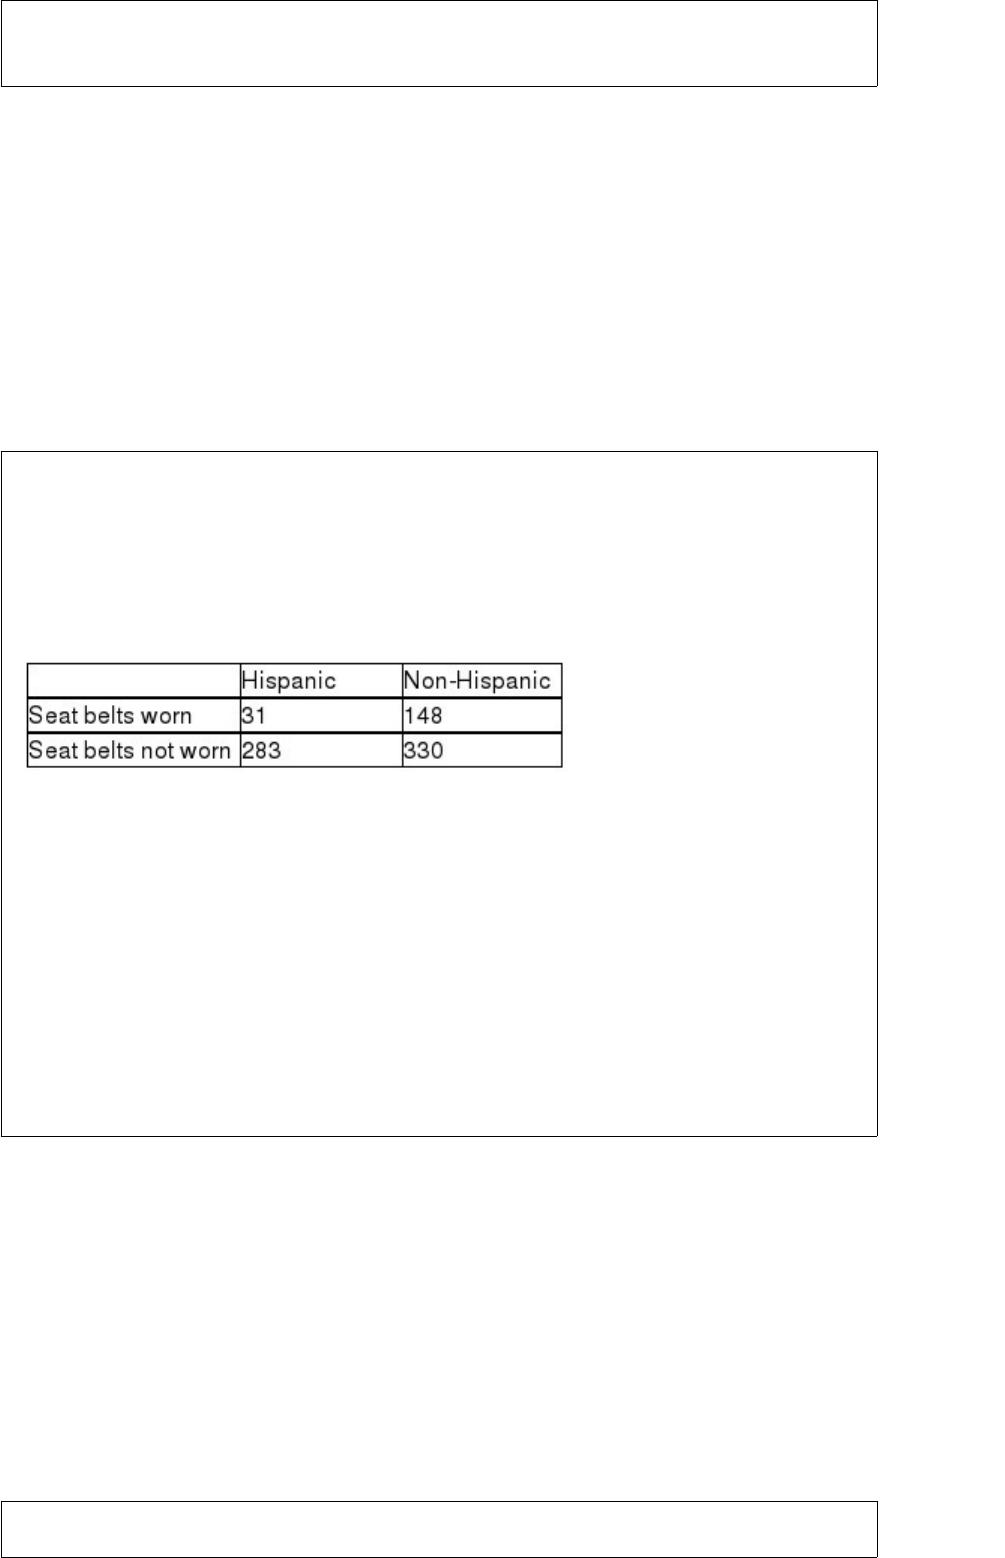
A study published in the American Journal of Public Health was conducted to
determine whether the use of seat belts in motor vehicles depends on ethnic status in
San Diego County. A sample of 792 children treated for injuries sustained from motor
vehicle accidents was obtained, and each child was classified according to (1) ethnic
status (Hispanic or non-Hispanic) and (2) seat belt usage (worn or not worn) during the
accident. The number of children in each category is given in the table below.
Referring to these data, which test would be used to properly analyze the data in this
experiment?
A) x2 test for independence in a two-way contingency table
B) x2 test for equal proportions in a one-way table
C) ANOVA F-test for interaction in a 2 2 factorial design
D) x2 goodness-of-fit test
If a systematic random sample is to be selected of size 100 from a population with

5,000 items, the first item selected from the ordered population will be:
A) randomly selected between 1 and 100.
B) randomly selected between 1 and 50.
C) any randomly selected value between 1 and 5,000.
D) item 50.
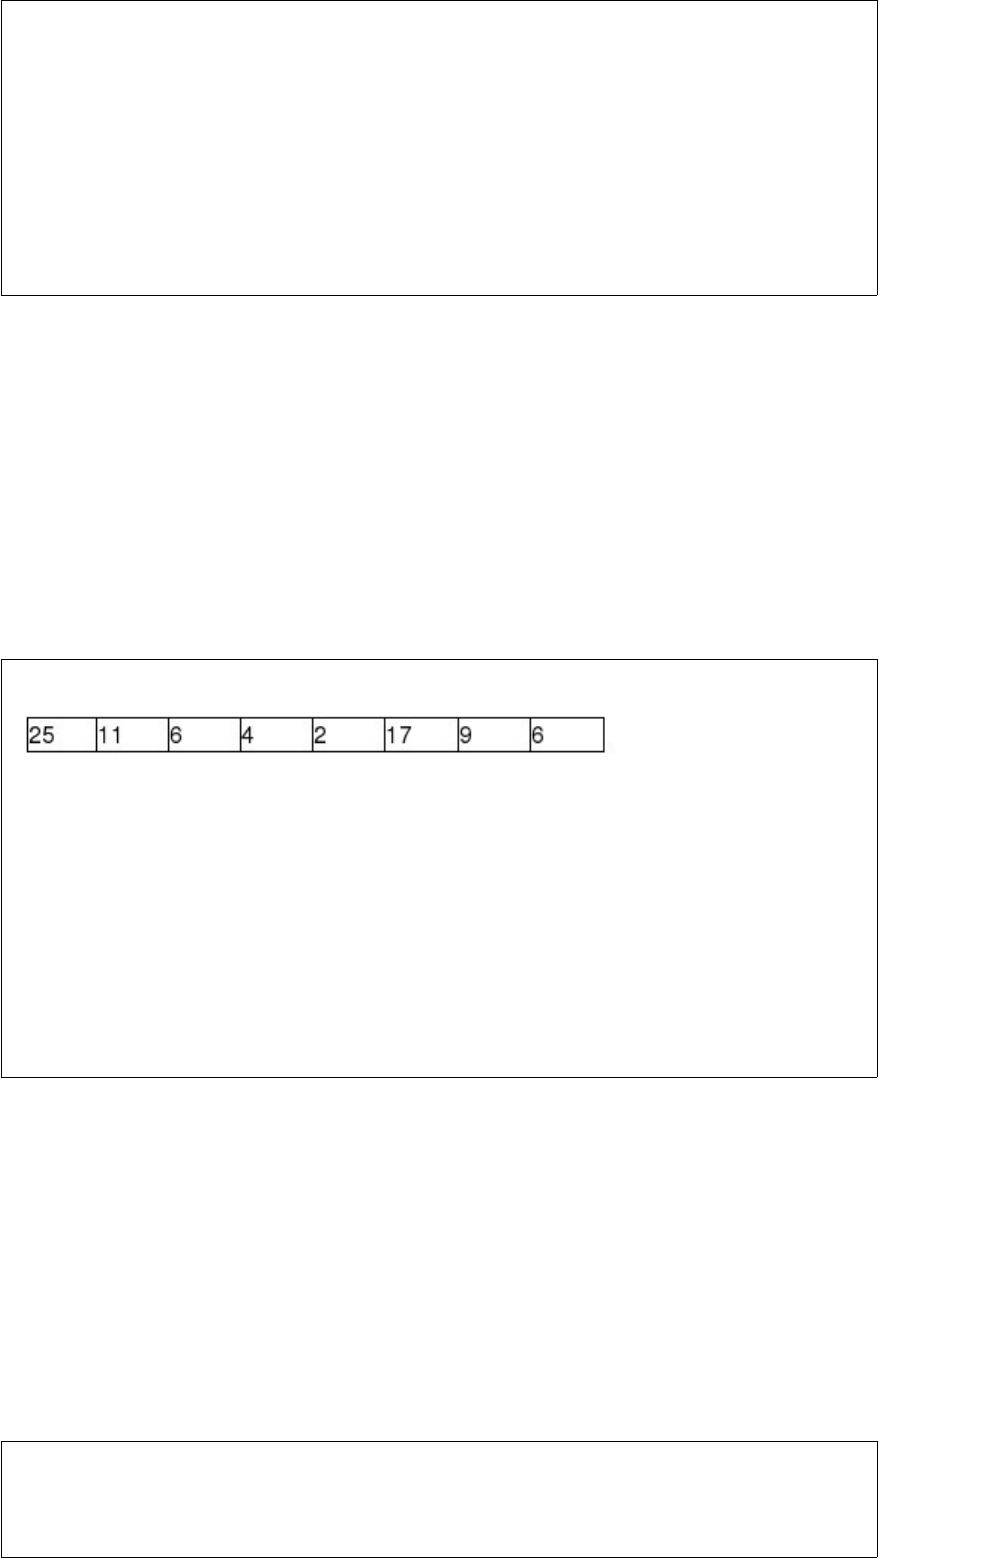
Consider the following sample data:
For these data the sample mean is:
A) 8
B) 10
C) 3
D) 12
If the residuals have a constant variance, which of the following should be evident?
A) The residuals should have a variance equal to zero for all levels of the independent


variable.
B) The plot of the residuals against each x variable should show that the spread in the
residuals is about the same at all levels of each of the independent variables.
C) The average residual should be about zero and the residual standard deviation should
be approximately 1.
D) None of the above
Given a binomial distribution with n = 8 and p = 0.40, obtain the standard deviation.
A) 1.921
B) 1.386
C) 1.848
D) 1.465
Which of the following is the appropriate null hypothesis when testing whether two
population variances are equal?
A) H0 : =


B) H0 : ≠
C) H0 : >
D) H0 : ≥
The number of visible defects on a product container is thought to be Poisson
distributed with a mean equal to 3.5. Based on this, how many defects should be
expected if 3 containers are inspected?
A) 10.5
B) Approximately 3.24
C) Between 4 and 7
D) 3.5
A company has developed a linear trend model to forecast monthly sales. The following
data show the actual sales and the “fitted” sales for months 1-12.
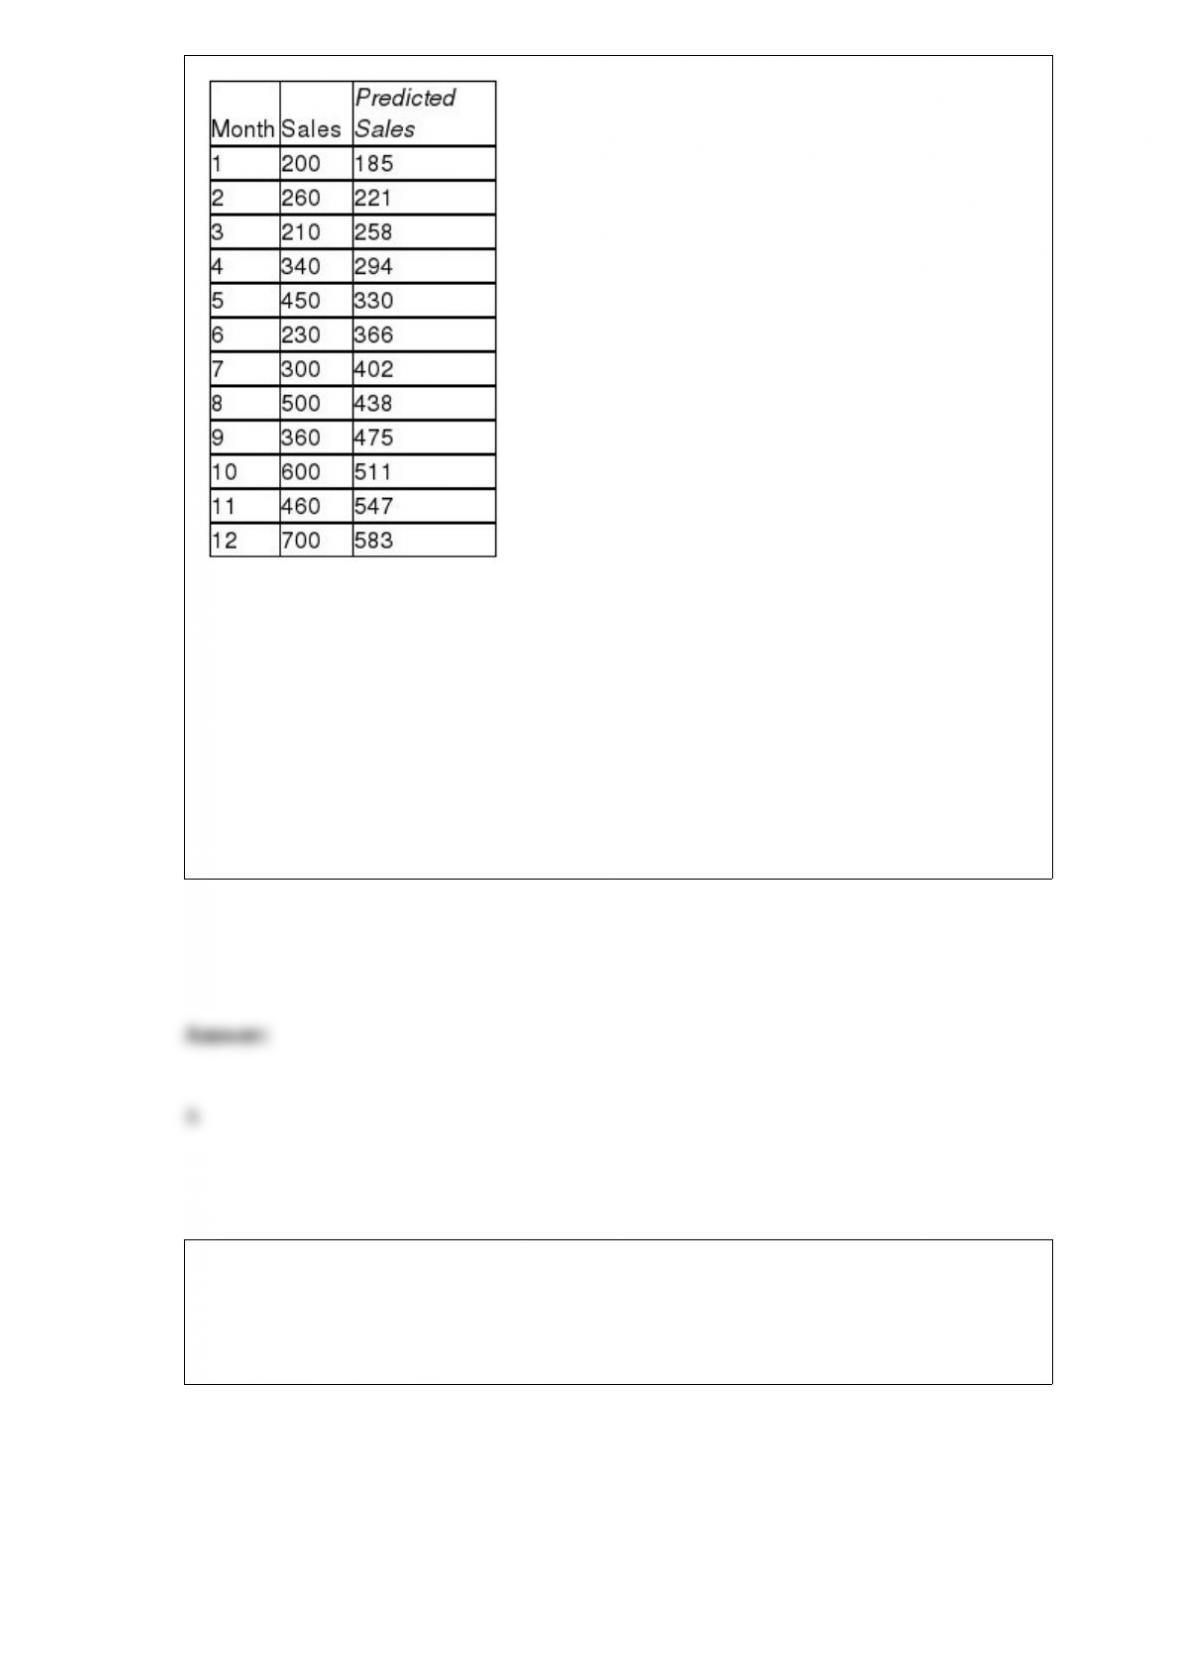
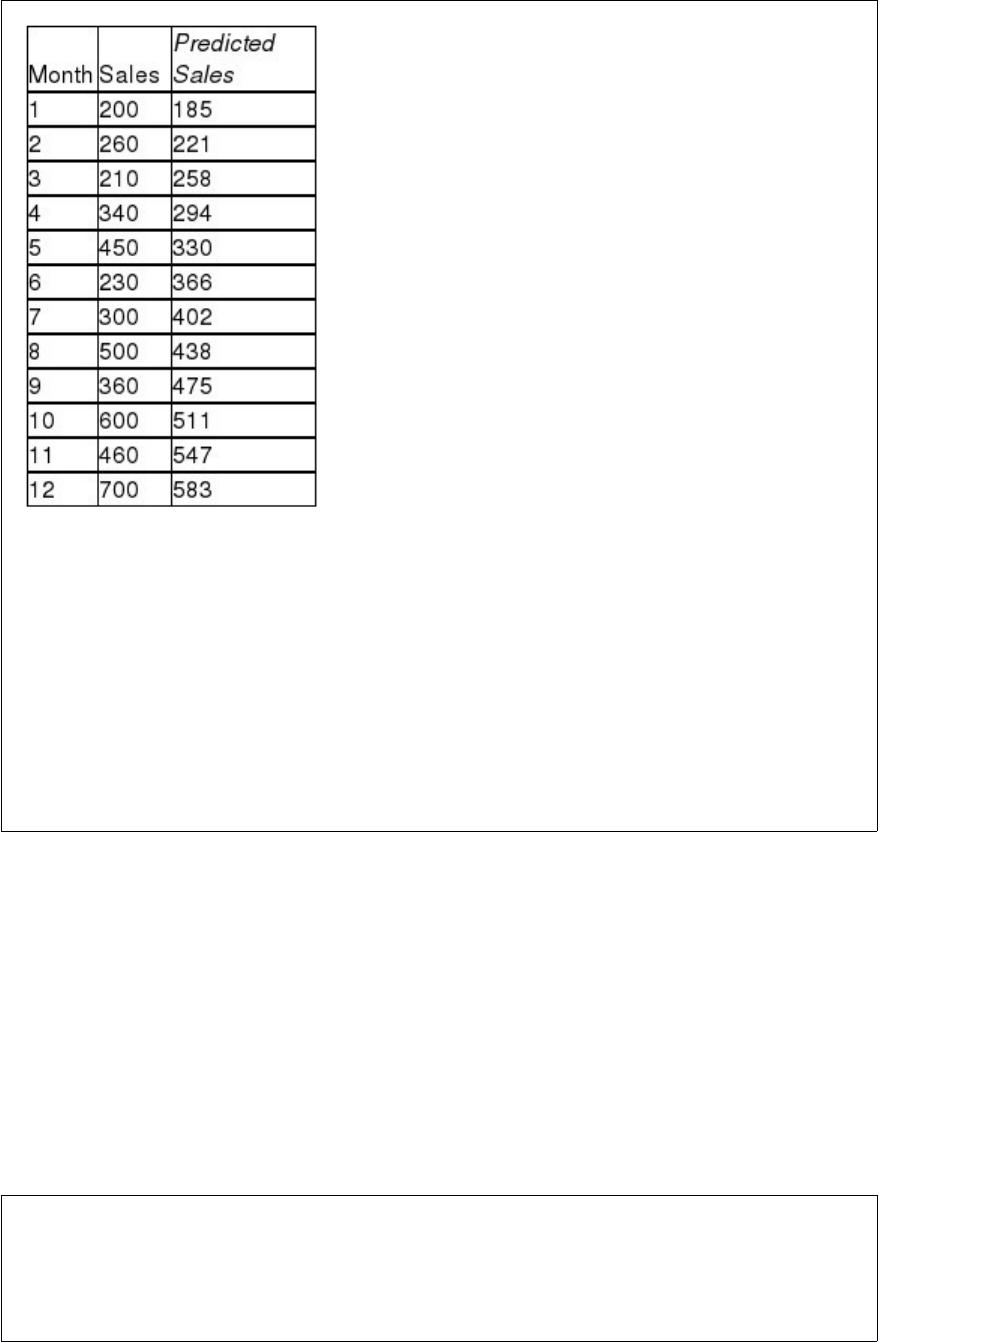
Based on these data, what is the mean square error for the linear trend model?
A) Approximately 7,968
B) About 99,615
C) Nearly 18,000
D) None of the above
The Zocor Company is interested in forecasting period 13 sales for a product. It has 12
months of historical data. The following shows the data and the forecasted values for
periods 1-12 using a single exponential smoothing model with a smoothing constant
value equal to 0.20


What is the forecast bias value for the model over periods 2-12?
A) About 8.7
B) Approximately -11.9
C) About 8.9
D) None of the above
The file Danish Coffee contains a random sample of 144 Danish coffee drinkers and
measures the annual coffee consumption in kilograms for each sampled coffee drinker.
A marketing research firm wants to use this information to develop an advertising
campaign to increase Danish coffee consumption.
Based on the sample’s results, what is the best point estimate of average annual coffee
consumption for Danish coffee drinkers?
A) 6.5368
B) 7.4151
C) 6.1411
D) 7.4127
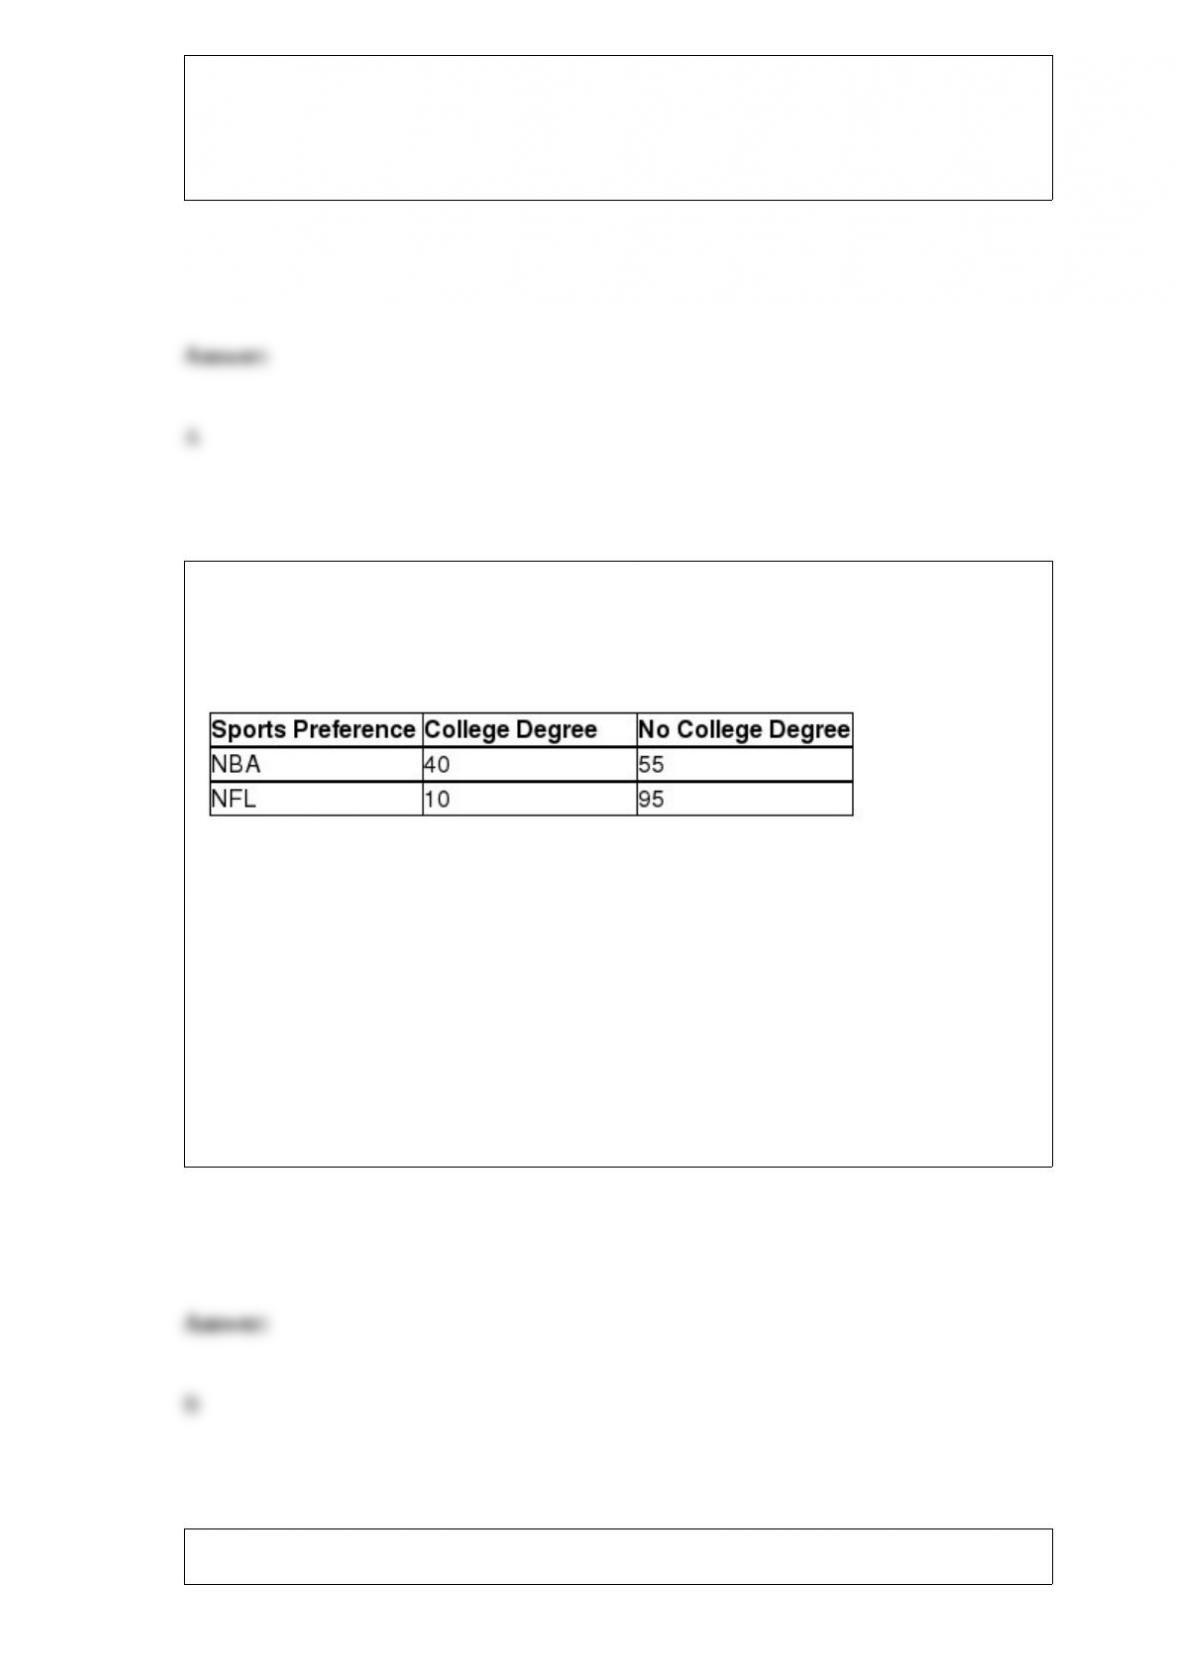
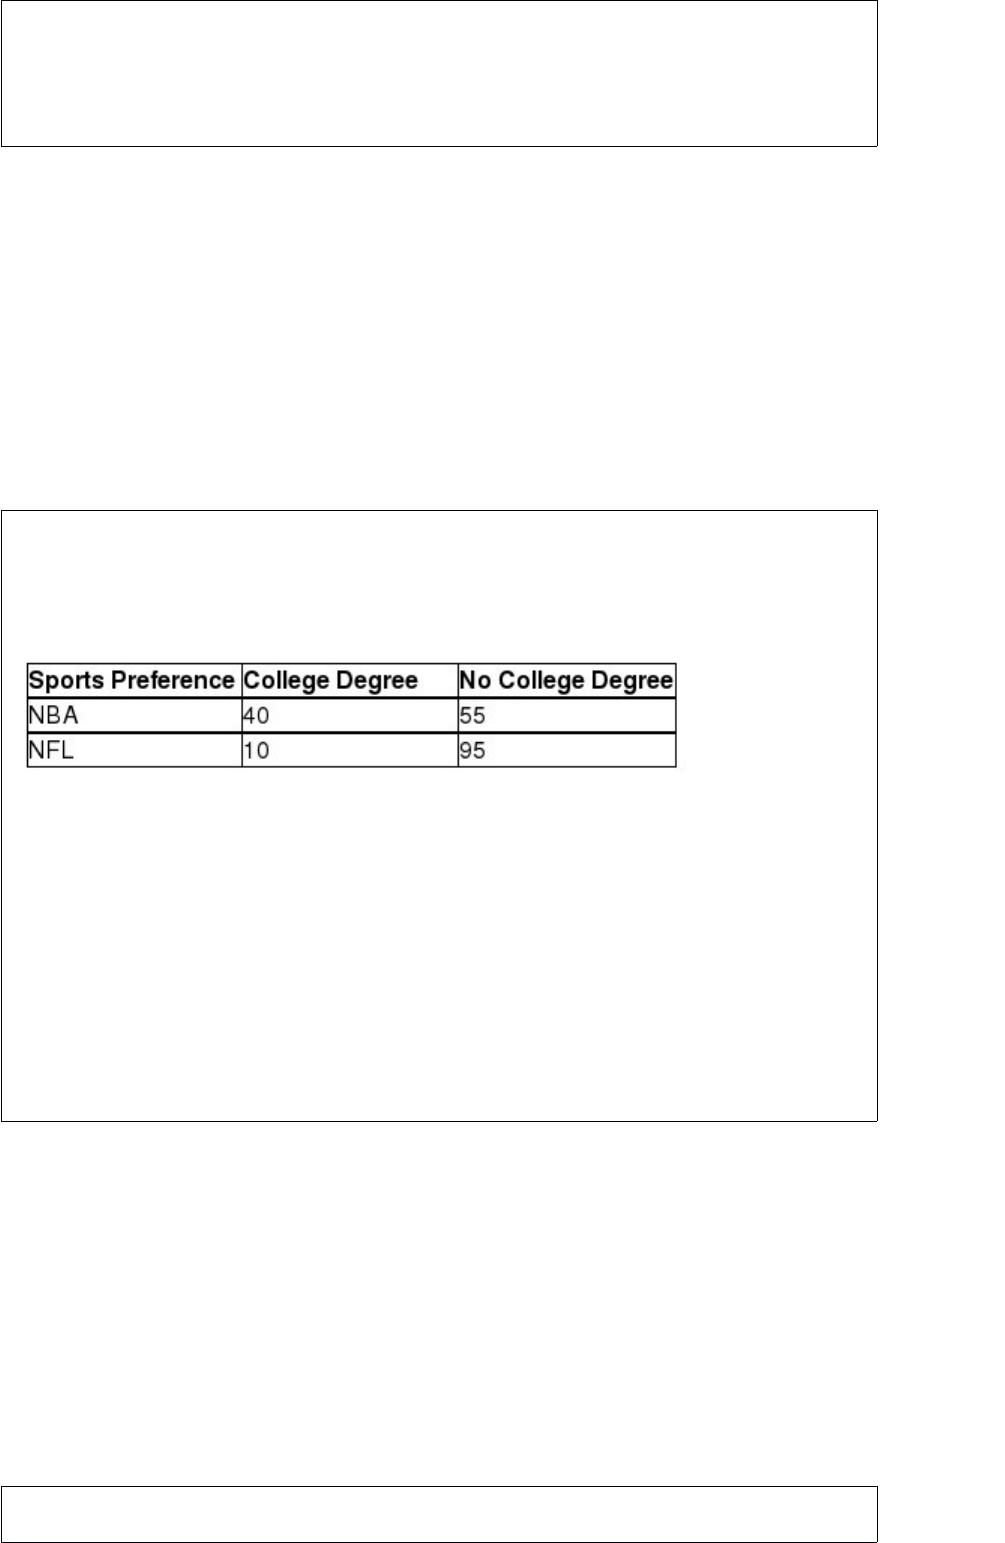
Drake Marketing and Promotions has randomly surveyed 200 men who watch
professional sports. The men were separated according to their educational level
(college degree or not) and whether they preferred the NBA or the National Football
League (NFL). The results of the survey are shown:
Suppose a survey participant is randomly selected and you are told that he has a college
degree. What is the probability that this man prefers the NFL?
A) 0.5250
B) 0.2000
C) 0.6050
D) 0.5880
Which of the following measures is not affected by extreme values in the data?
A) The mean
B) The median
C) The range
D) The standard deviation
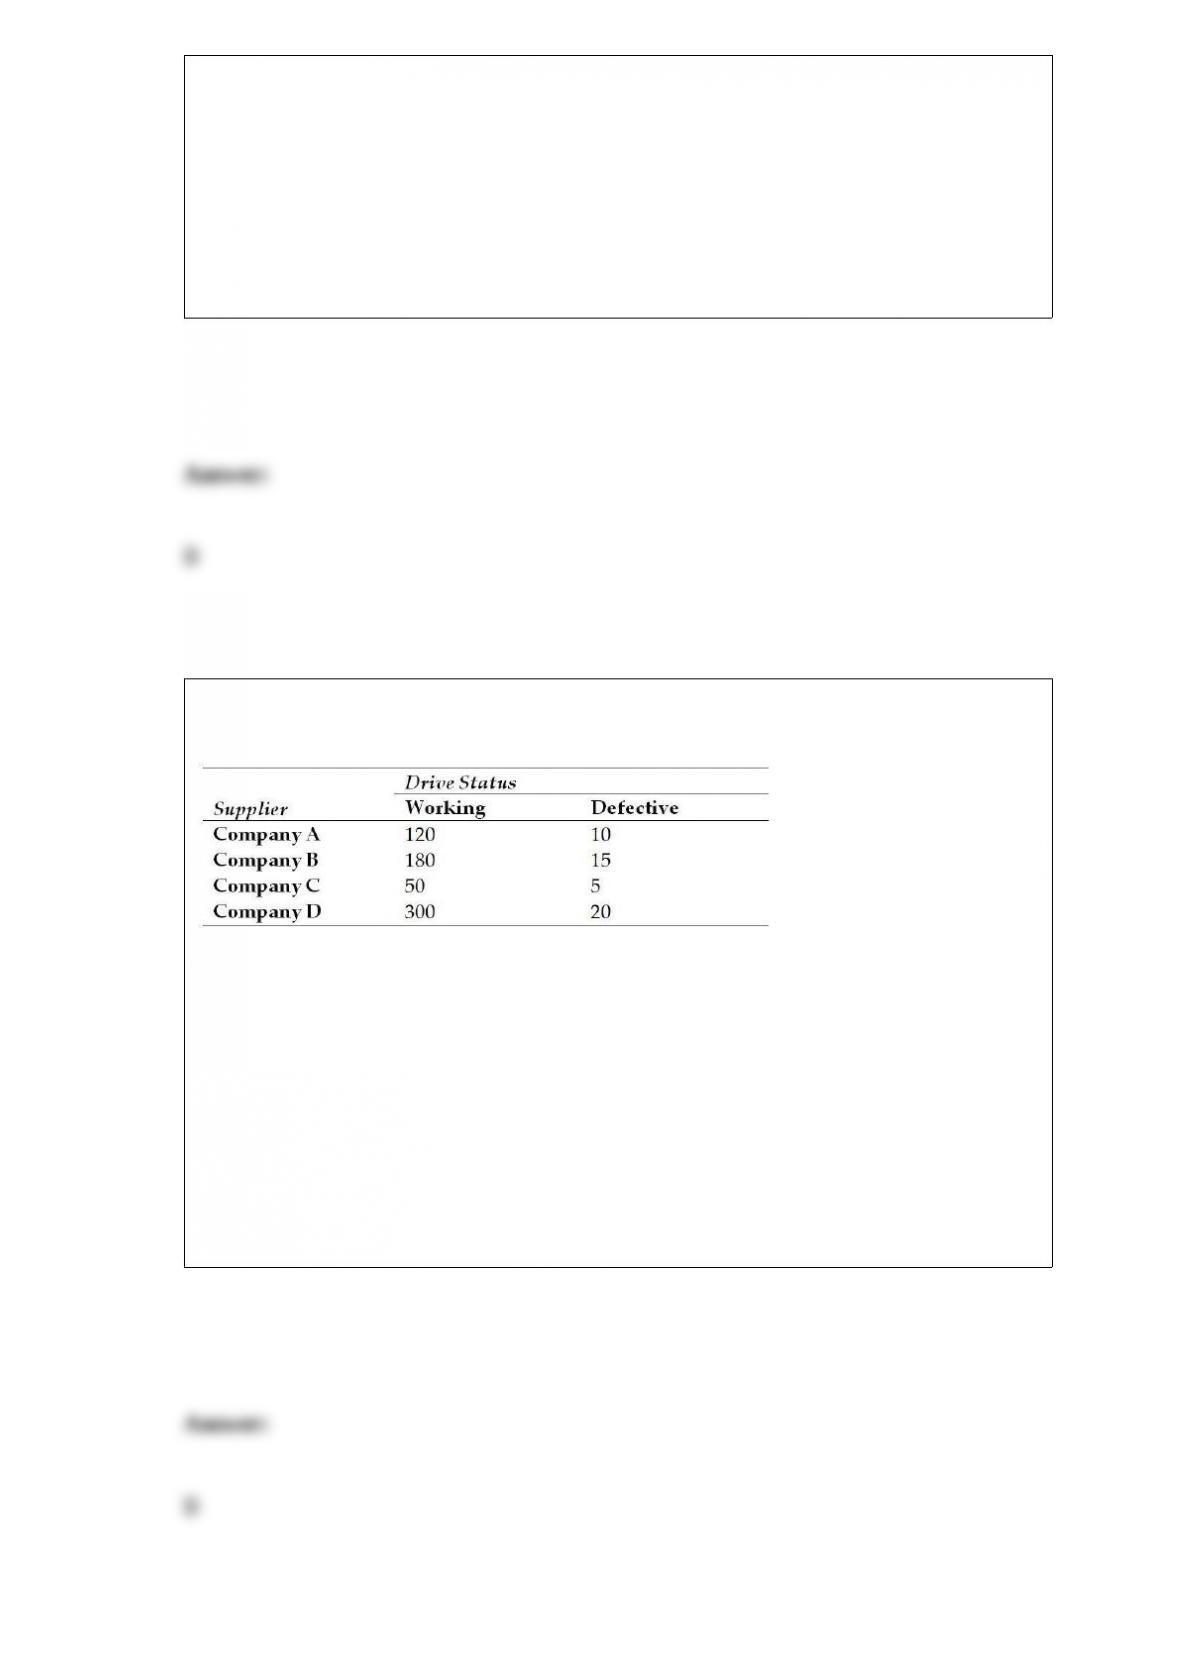
Suppose a quality manager for Dell Computers has collected the following data on the
quality status of disk drives by supplier. She inspected a total of 700 disk drives.
Based on these inspection data, what is the probability of randomly selecting a disk
drive from company B?
A) 0.07
B) 0.28
C) 0.021
D) 0.76

A study was recently conducted by the regional electric and gas company. Data were
collected for three customer categories showing the dollar amount of natural gas and the
dollar amount of electricity consumed during the year. Which of the following graphs
would most likely be used to display both sets of data together?
A) Pie chart
B) Bar chart
C) Line chart
D) Histogram
A forecasting model of the following form was developed:
y = B0 + B1xj+ B2 + B3 + ε
Which of the following best describes the form of this model?
A) Quadratic model
B) 3rd degree polynomial model
C) 3rd level regression model
D) Tri-slope regression model


A company has developed a linear trend regression model based on 16 quarters of data.
The independent variable is the measure of time (t = 1 thru 16 where quarter 1 is winter
quarter, 2 is spring, etc.). The company has also developed seasonal indexes for each
quarter as follows:
The linear trend forecast equation is: = 120 + 56t.
Given this information, what is the seasonally adjusted forecast for period 19?
A) 1,064
B) 1,184
C) 828.80
D) 986.7
If a company has 12 years of annual sales data and is in need of a three-year forecast,
which of the following forecasting techniques might be useful?
A) Forecast generalization
B) Seasonality processing
C) Regression-based trend forecasting
D) Random component analysis


A company that makes shampoo wants to test whether the average amount of shampoo
per bottle is 16 ounces. The standard deviation is known to be 0.20 ounces. Assuming
that the hypothesis test is to be performed using 0.10 level of significance and a random
sample of n = 64 bottles, which of the following would be the upper tail critical value?
A) 1.28
B) 1.645
C) 1.96
D) 2.575
Chicago Connection, a local pizza company, delivers pizzas for free within the market
area. The delivery drivers are paid $2.00 per delivery plus they get to keep any tips. To
estimate the proportion of deliveries that result in a tip to the driver, a random sample of
64 deliveries was selected. Of these, 48 times a tip was received. Based on this
information, and using a 95 percent confidence level, the upper limit for the confidence
interval estimate is about .1061.
State University recently randomly sampled seven students and analyzed grade point
average (GPA) and number of hours worked off-campus per week. The following data
were observed:
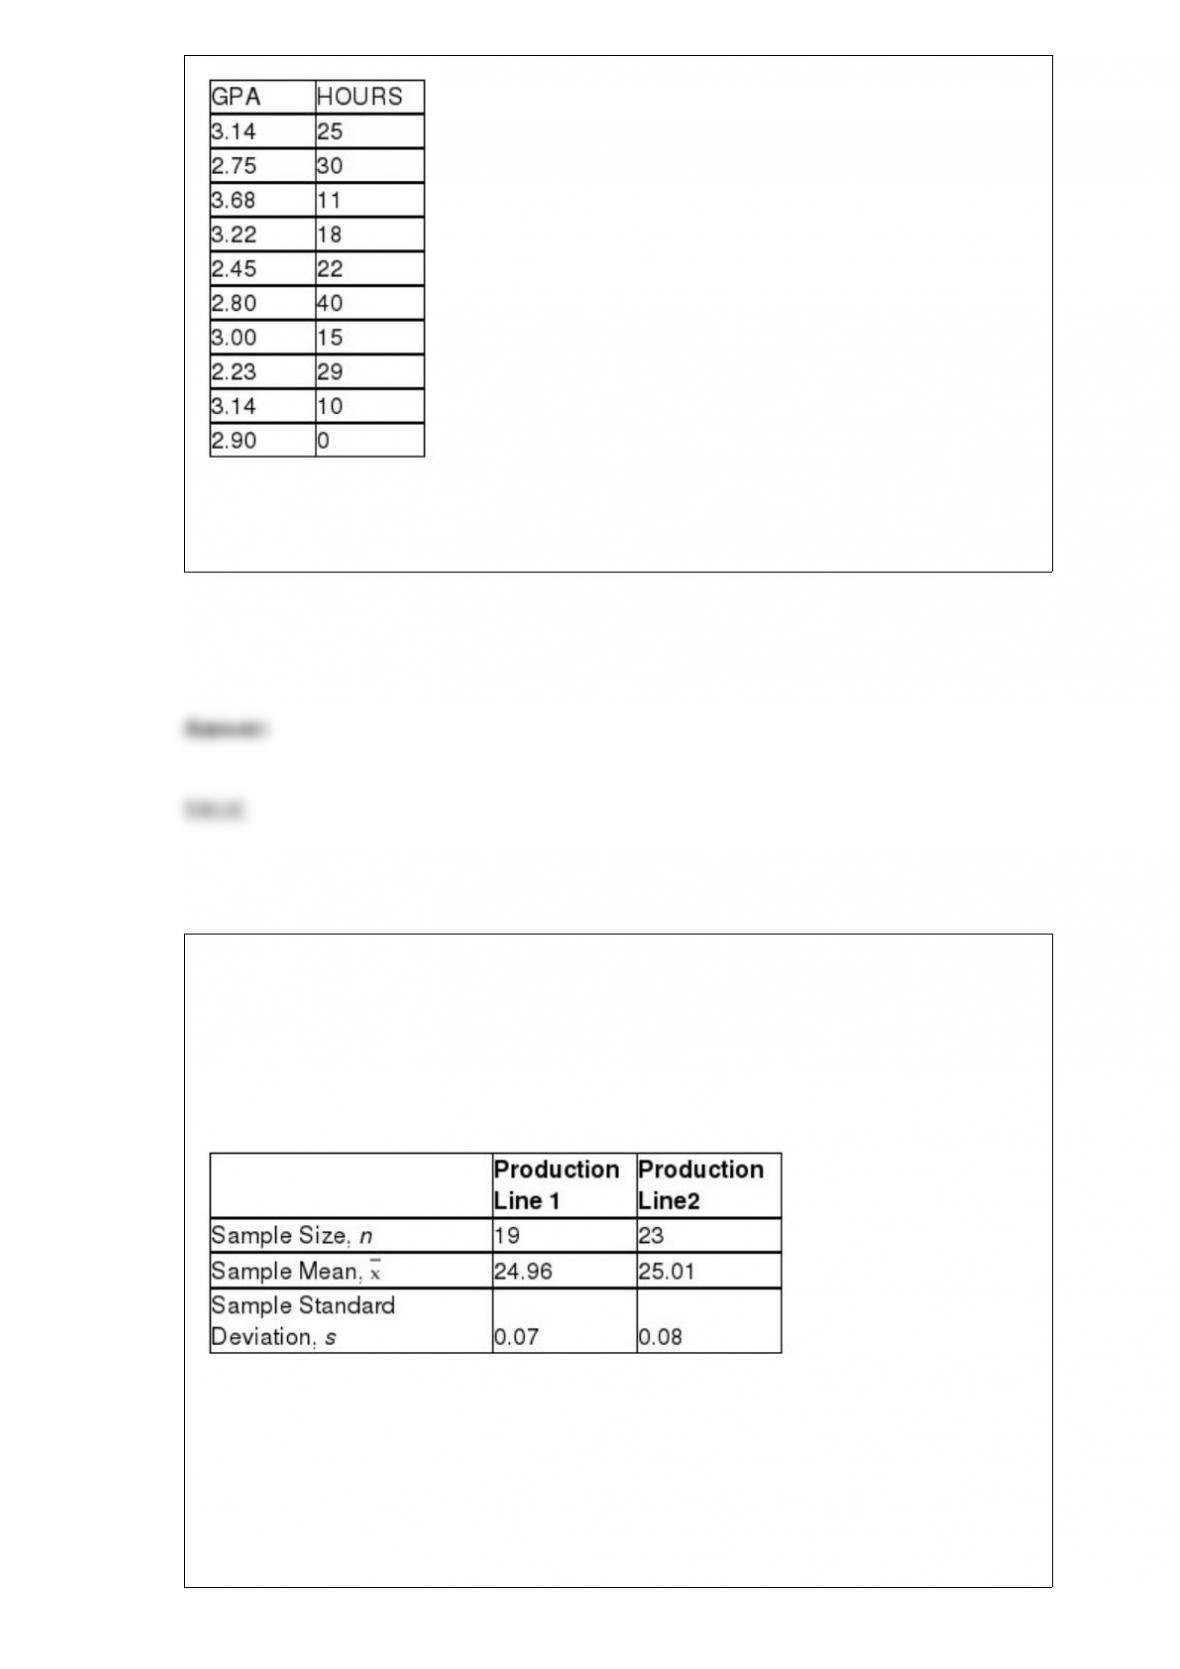
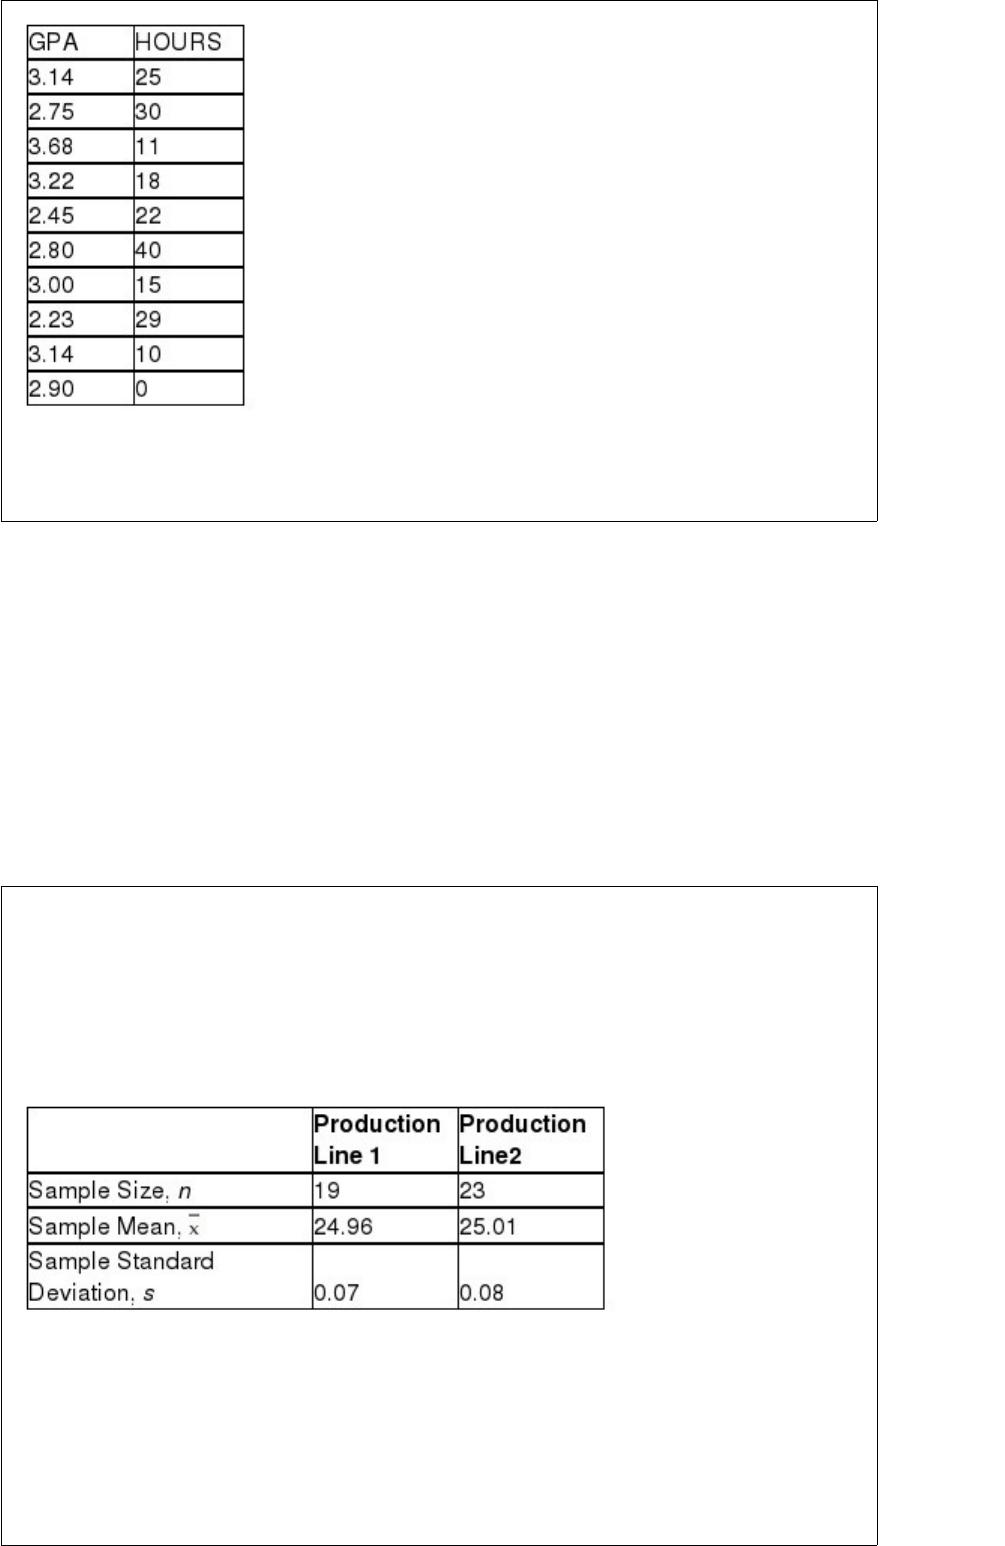
In testing the significance of the regression slope coefficient for the independent
variable, HOURS, the calculated test statistic is approximately t = -1.47.
A pet food producer manufactures and then fills 25-pound bags of dog food on two
different production lines located in separate cities. In an effort to determine whether
differences exist between the average fill rates for the two lines, a random sample of 19
bags from line 1 and a random sample of 23 bags from line 2 were recently selected.
Each bag’s weight was measured and the following summary measures from the
samples are reported:
Management believes that the fill rates of the two lines are normally distributed with
equal variances.
Calculate the point estimate for the difference between the population means of the two
lines.


A) 0.040
B) 0.034
C) -0.050
D) -0.042
A major issue facing many states is whether to legalize casino gambling. Suppose the
governor of one state believes that more than 55% of the state’s registered voters would
favor some form of legal casino gambling. However, before backing a proposal to allow
such gambling, the governor has instructed his aides to conduct a statistical test on the
issue. To do this, the aides have hired a consulting firm to survey a simple random
sample of 300 voters in the state. Of these 300 voters, 175 actually favored legalized
gambling.
Assuming that a significance level of 0.05 is used, what conclusion should the governor
reach based on these sample data?
A) Since z = 1.1594 < 1.645, do not reject the null hypothesis.
The sample data do not provide sufficient evidence to conclude that more than 55
percent of the population favor legalized gambling.
B) Since z = 2.1316 > 1.645, reject the null hypothesis.
The sample data provide sufficient evidence to conclude that more than 55 percent of
the population favor legalized gambling.
C) Since z = 1.1594 < 1.645, do not reject the null hypothesis.
The sample data do not provide sufficient evidence to conclude that more than 58
percent of the population favor legalized gambling.
D) Since z = 2.1316 > 1.645, reject the null hypothesis.
The sample data provide sufficient evidence to conclude that more than 58 percent of
the population favor legalized gambling.


A decision maker is interested in estimating a population proportion. A sample of size n
= 150 yields 115 successes. Based on these sample data, construct a 90% confidence
interval estimate for the true population proportion.
A) (0.714, 0.826)
B) (0.717, 0.823)
C) (0.737, 0.803)
D) (0.750, 0.790)
The J.R. Simplot Company produces frozen French fries that are then sold to customers
such as McDonald’s. The “prime” line of fries has an average length of 6.00 inches with
a standard deviation of 0.50 inch. To make sure that Simplot continues to meet the
quality standard for “prime” fries, they plan to select a random sample of n = 100 fries
each day. The quality analysts will compute the mean length for the sample. They want
to establish limits on either side of the 6.00 inch mean so that the chance of the sample
mean falling within the limits is 0.99. What should these limits be?
A) Approximately 0.13 inches
B) Within the approximate range of 5.87 inches to 6.13 inches
C) Within the range of about 4.71 inches to 7.29 inches
D) Approximately 1.29 inches


The mayor of a large U.S. city is interested in addressing complaints from many
property owners regarding recent property assessments. Many people feel that they are
being overtaxed and that their assessments are too high. To study this issue, the mayor
plans to hire consultants to randomly select homes in the city and have these homes
independently assessed for value. However, she is concerned that the cost of sampling
will be very high since the city is spread out over a wide geographical area. To
potentially reduce the cost of sampling, which of the following statistical sampling
techniques should be applied?
A) Cluster sampling
B) Ratio sampling
C) Simple random sampling
D) Stratified random sampling
The cost of a college education has increased at a much faster rate than costs in general
over the past twenty years. In order to compensate for this, many students work part- or
full-time in addition to attending classes. At one university, it is believed that the
average hours students work per week exceeds 20. To test this at a significance level of
0.05, a random sample of n = 20 students was selected and the following values were
observed:

Based on these sample data, the critical value expressed in hours:
A) is approximately equal to 25.26 hours.
B) is approximately equal to 25.0 hours.
C) cannot be determined without knowing the population standard deviation.
D) is approximately 22 hours.
Standard stepwise regression
A) is the same as forward selection.
B) involves trying more regressions that the best subsets method.
C) always finds the best regression model.
D) combines attributes of both forward selection and backward elimination.


Consider a random variable, z, that has a standardized normal distribution. Determine
(-2 ≤ z ≤ 3).
A) 0.12414
B) 0.97587
C) 0.47722
D) 0.49865
Dell Computers receives large shipments of microprocessors from Intel Corp. It must
try to ensure the proportion of microprocessors that are defective is small. Suppose Dell
decides to test five microprocessors out of a shipment of thousands of these
microprocessors. Suppose that if at least one of the microprocessors is defective, the
shipment is returned.
If Intel and Dell agree that Intel will not provide more than 5% defective chips,
calculate the probability that the entire shipment will be returned even though only 5%
are defective.
A) 0.2262
B) 0.3478
C) 0.4564
D) 0.1812


A concern of Major League Baseball is that games last too long. Some executives in the
league’s headquarters believe that the mean length of games this past year exceeded 3
hours (180 minutes). To test this, the league selected a random sample of 80 games and
found the following results: = 193 minutes and s = 16 minutes.
Based on these results, if the null hypothesis is tested using an alpha level equal to 0.10,
which of the following is true?
A) The null hypothesis should be rejected if > 182.31.
B) The test statistic is t = 1.2924.
C) Based on the sample data, the null hypothesis cannot be rejected.
D) It is possible that when the hypothesis test is completed, a Type II statistical error
has been made.
There are a number of highly touted search engines for finding things of interest on the
Internet. Recently, a consumer rating system ranked two search engines ahead of the
others. Now, a computer user’s magazine wishes to make the final determination
regarding which one is actually better at finding particular information. To do this, each
search engine was used in an attempt to locate specific information using specified
keywords. Both search engines were subjected to 100 queries. Search engine 1
successfully located the information 88 times and search engine 2 located the
information 80 times. Using a significance level equal to 0.05, which of the following is
true?
A) Based the sample data, the null hypothesis of equal population proportions is
rejected since the test statistic exceeds the critical value.
B) Based on the sample data, the null hypothesis should not be rejected since the test
statistic of z = 2.04 exceeds the critical value of z = 1.96.
C) According to the test results, the hypothesis should be rejected since the test statistic
value, z = 1.54, falls in the rejection region.
D) Based on the sample data, there is not sufficient evidence to conclude that a
difference exists between the proportion of search hits since the test statistic, z = 1.54,
does not fall in the rejection region.


It is often a good idea to convert frequency distributions to relative frequency
distributions when you wish to compare two distributions with different amounts of
data.
The URS construction company has submitted two bids, one to build a large hotel in
London and the other to build a commercial office building in New York City. The
company believes it has a 40% chance of winning the hotel bid and a 25% chance of
winning the office building bid. The company also believes that winning the hotel bid is
independent of winning the office building bid.
What is the probability the company will win at least one contract?
A) 0.55
B) 0.45
C) 0.10
D) 0.75


If a distribution is considered to be Poisson with a mean equal to 11, the most
frequently occurring value for the random variable will be:
A) 10.5
B) 11
C) 10 and 11
D) 22
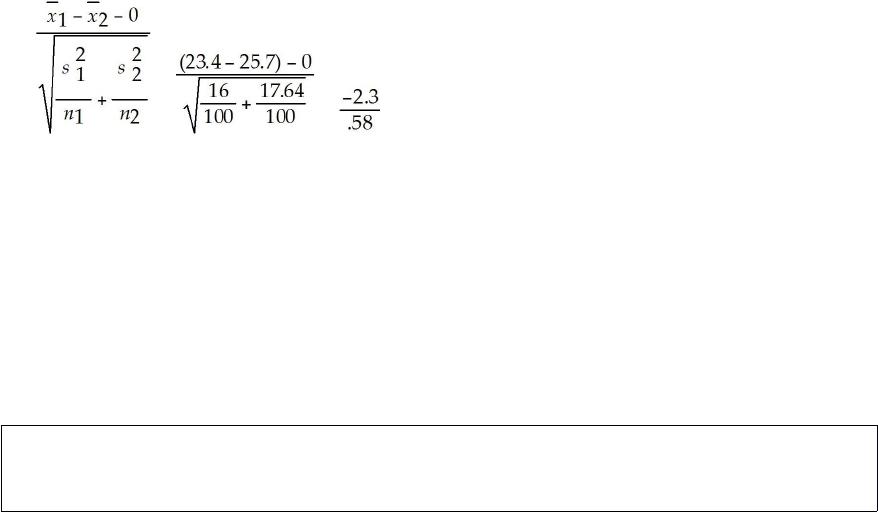
A major U.S. oil company has developed two blends of gasoline. Managers are
interested in determining whether a difference in mean gasoline mileage will be
obtained from using the two blends. As part of their study, they have decided to run a
test using the Chevrolet Impala automobile with automatic transmissions. They selected
a random sample of 100 Impalas using Blend 1 and another 100 Impalas using Blend 2.
Each car was first emptied of all the gasoline in its tank and then filled with the
designated blend of the new gasoline. The car was then driven 200 miles on a specified
route involving both city and highway roads. The cars were then filled and the actual
miles per gallon were recorded. The following summary data were recorded:
Blend 1 Blend 2
Sample Size 100 100
Sample Mean 23.4 mpg 25.7 mpg
Sample St. Dev. 4.0 mpg 4.2 mpg
Based on the sample data, using a 0.05 level of significance, what conclusion should the
company reach about whether the population mean mpg is the same or different for the
two blends? Use the test statistic approach to test the null hypothesis.

Explain why, in performing a goodness-of-fit test, it is sometimes necessary to combine
categories.

How would you respond to a statement that says that by increasing the sample size, the
amount of sampling error will be decreased?
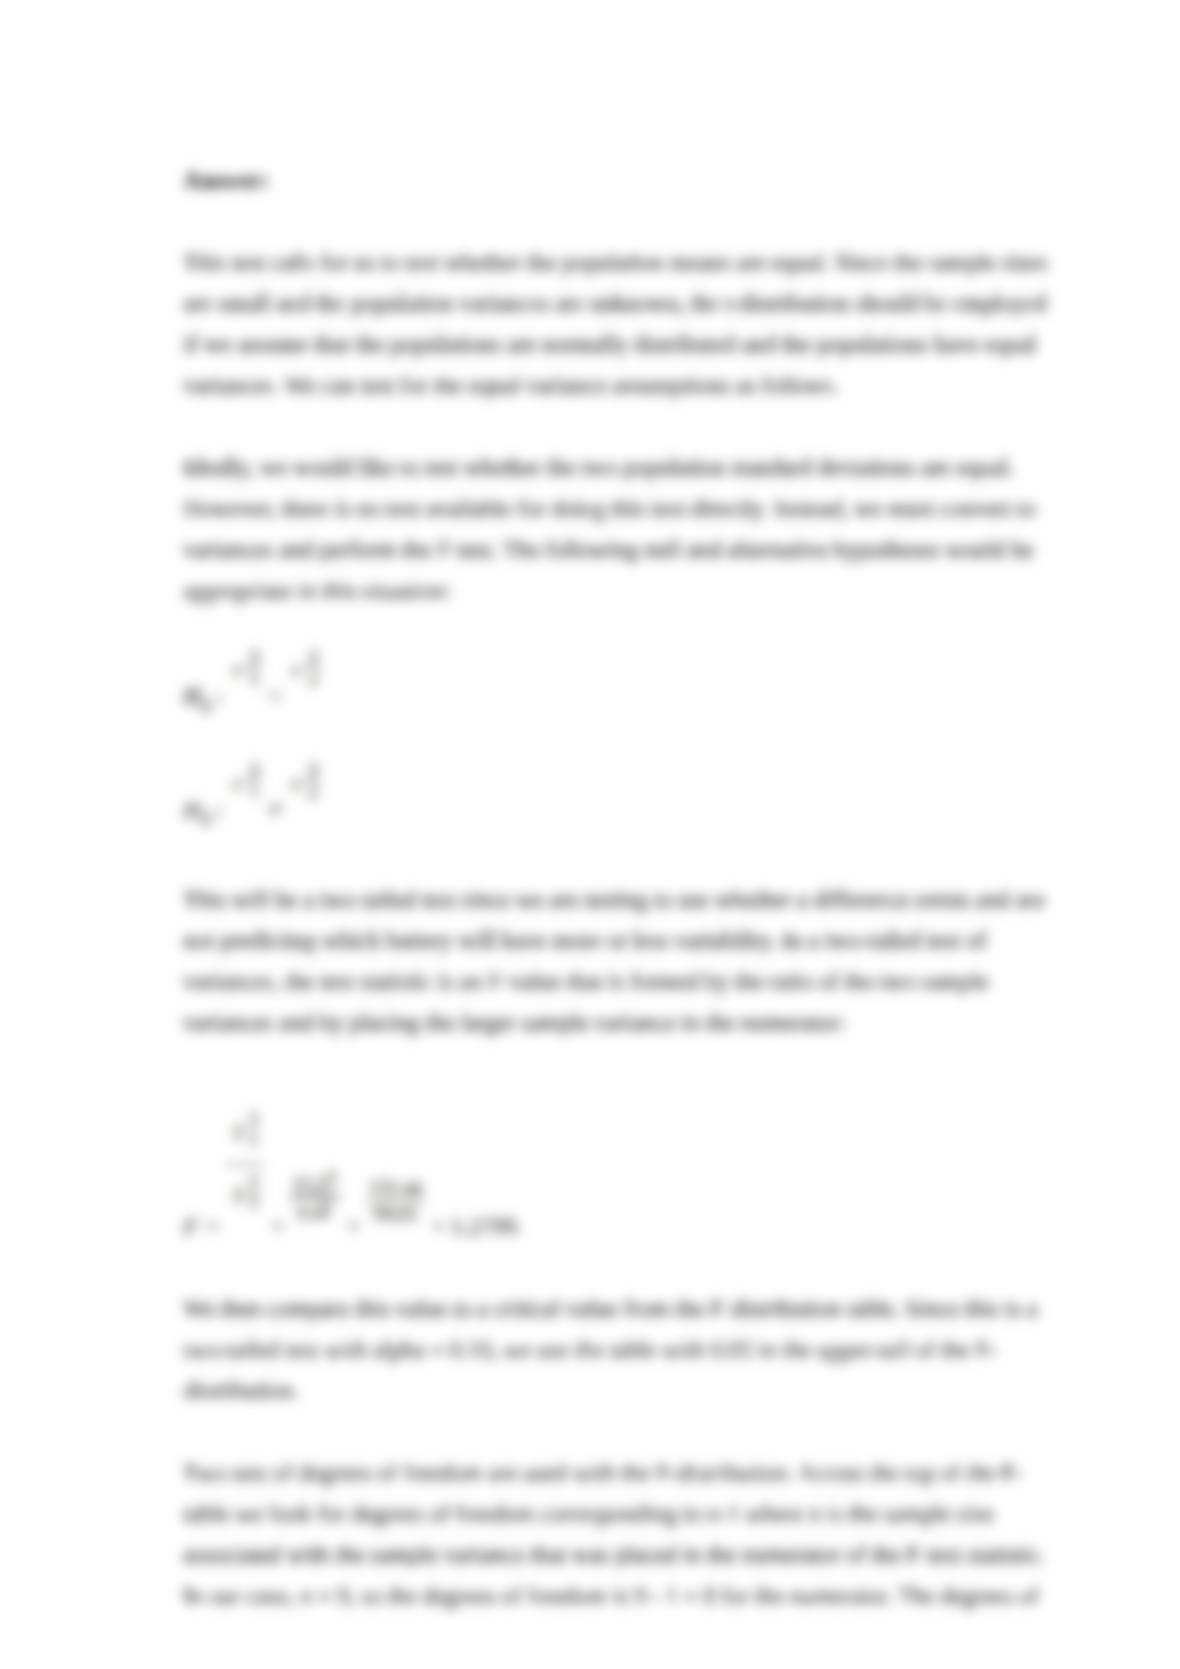
A PC company uses two suppliers for rechargeable batteries for its notebook computers.
Two factors are important quality features of the batteries: mean use time and variation.
It is desirable that the mean use time be high and the variability be low. Recently, the
PC maker conducted a test on batteries from the two suppliers. In the test, 9 randomly
selected batteries from Supplier 1 were tested and 12 randomly selected batteries from
Supplier 2 were tested. The following results were observed:
Supplier 1 Supplier 2
n1 = 9 n2 = 12
1 = 67.25 min 2 = 72.4 min
s1 = 11.2 min s2 = 9.9 min
Based on these sample results, can the PC maker conclude that a difference exists
between the two batteries with respect to the population mean use time? Test using a
0.10 level of significance.


What is meant by the concept, standardizing the data? Explain why a decision maker
may wish to compute a standardized value.
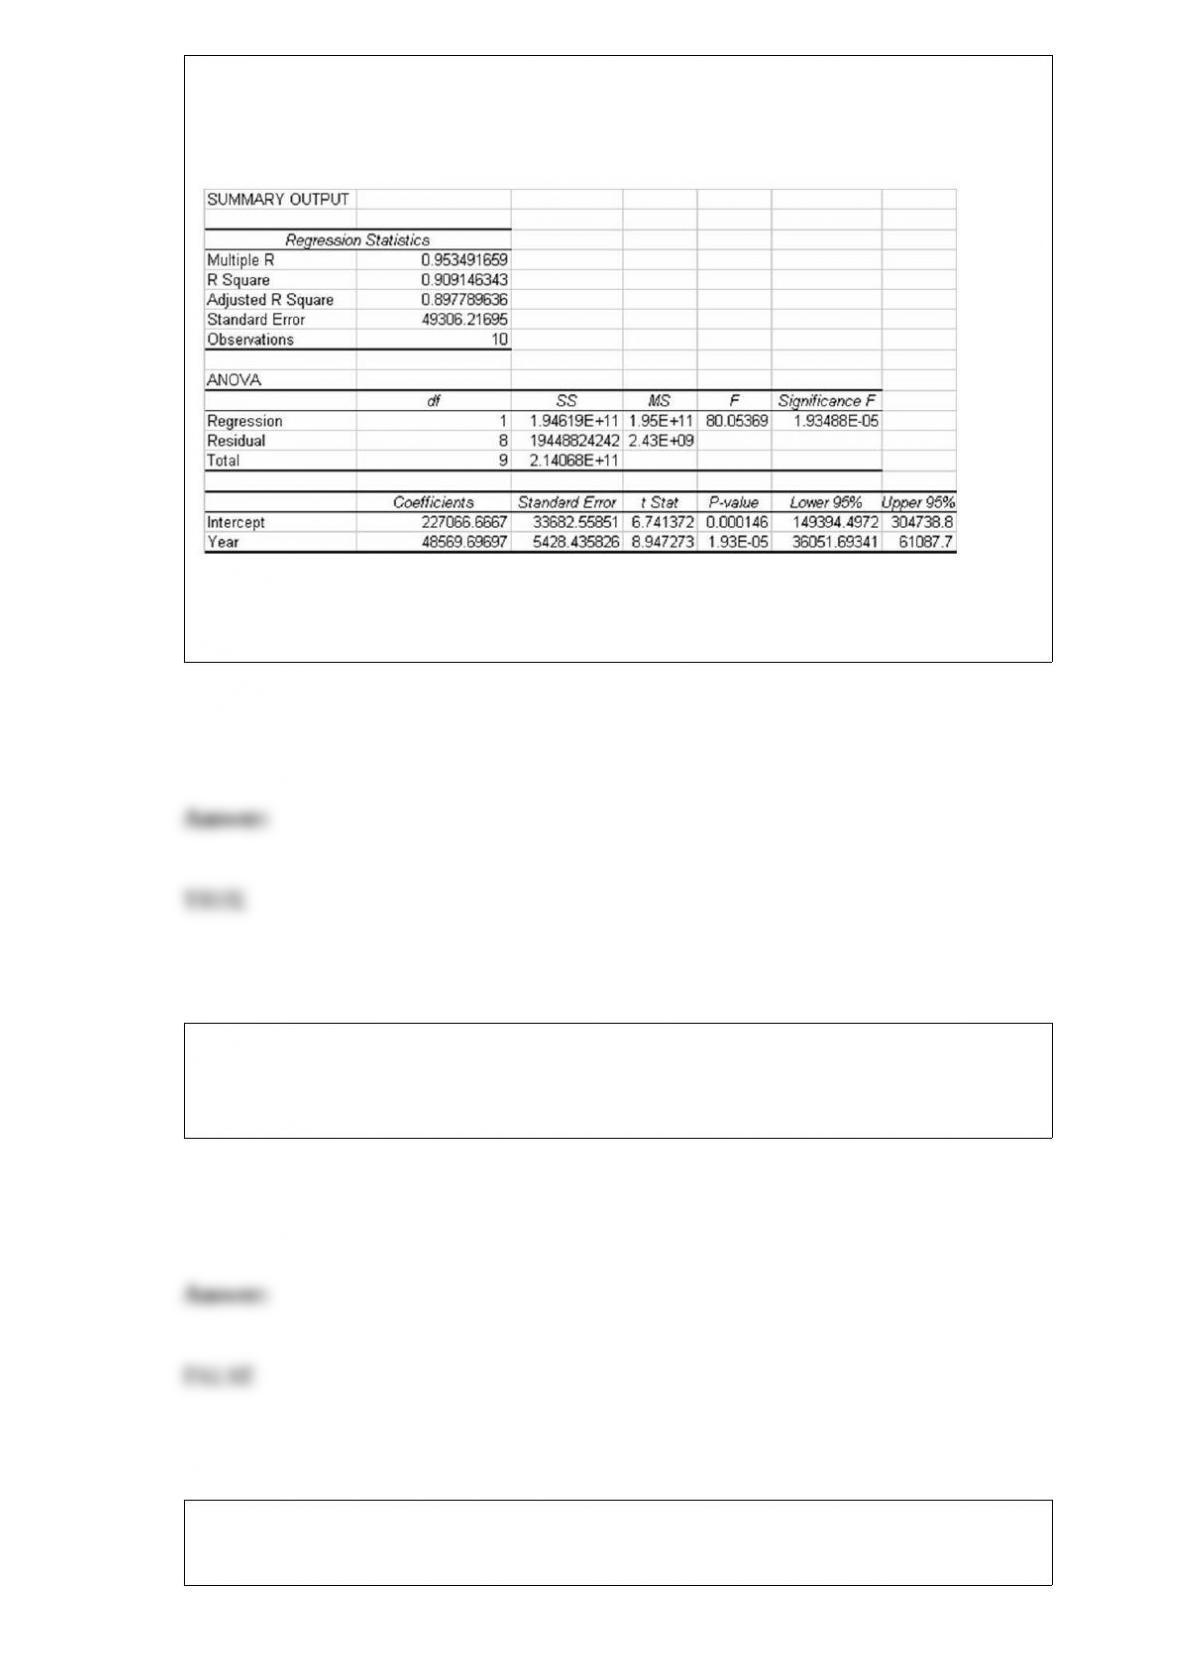
The Norton Industrial Company has 12 quarters of historical sales data and is interested
in forecasting sales for quarter 13. The following data are available:

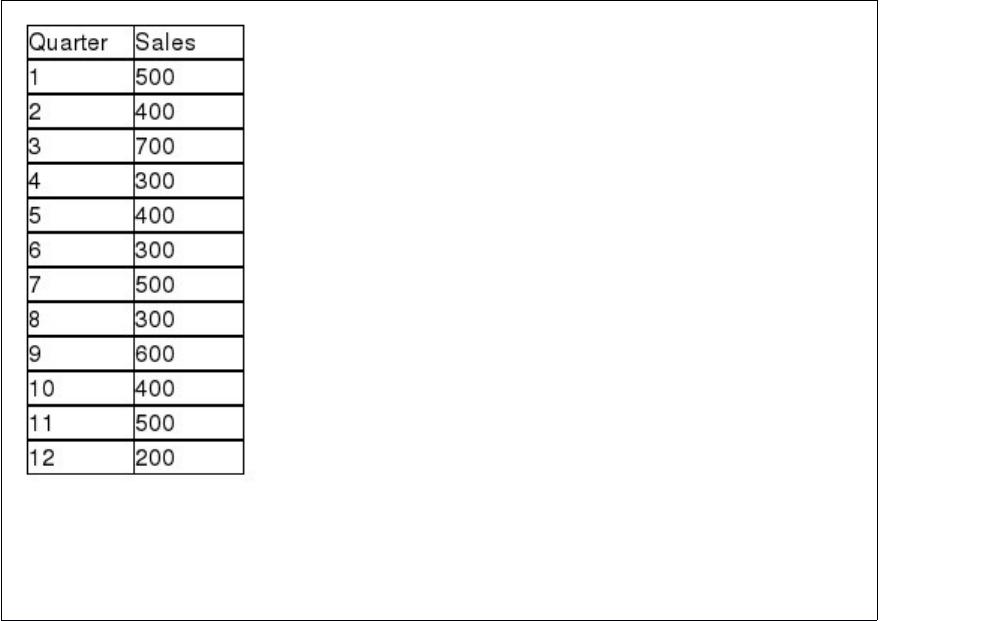
Based on this data, using simple exponential smoothing with a smoothing constant
value equal to 0.10 and a starting forecast value equal to the sales in quarter 1 to
forecast sales for period 13, what is the MAD value for periods 2-12?
A study has been conducted to determine whether the mean spending for recreational
activities during the month of August differs for residents of three cities. Random
samples of 30 people were selected from each city and their spending on recreation was
recorded during August. The following output was generated using Excel:
ANOVA: Single Factor
SUMMARY
ANOVA
The Excel output shows that the null hypothesis of equal means should be rejected.
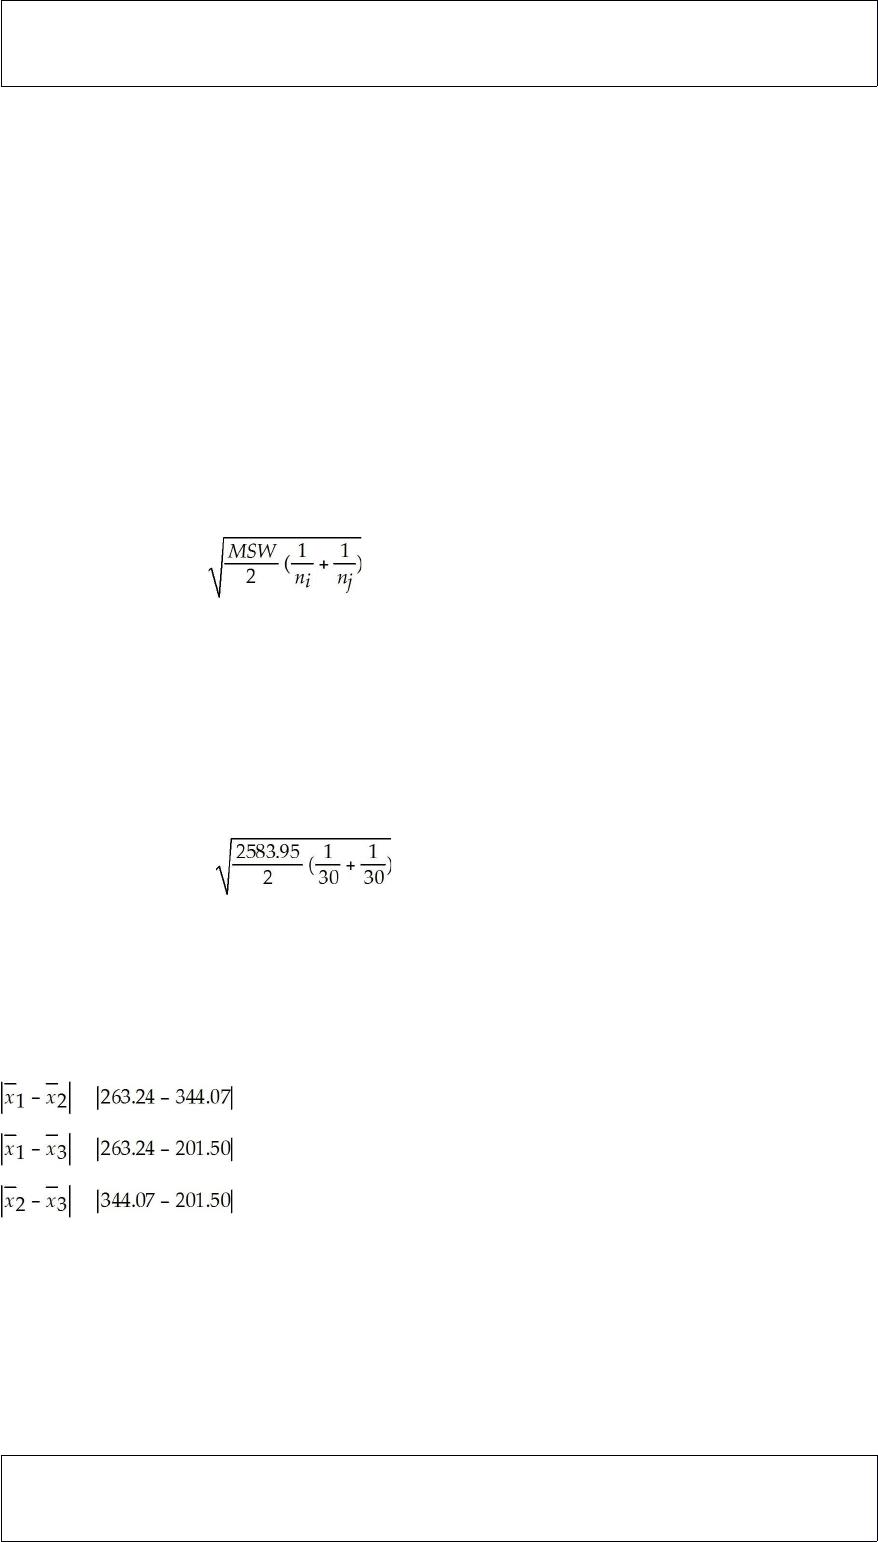
Given this, perform the appropriate method for determining which population means
are different. Conduct the test using an alpha = 0.05 level.
Of the following techniques for collecting data, which one is generally considered the
least costly to implement: experiments, telephone surveys, mail questionnaires, direct

observation, personal interview?
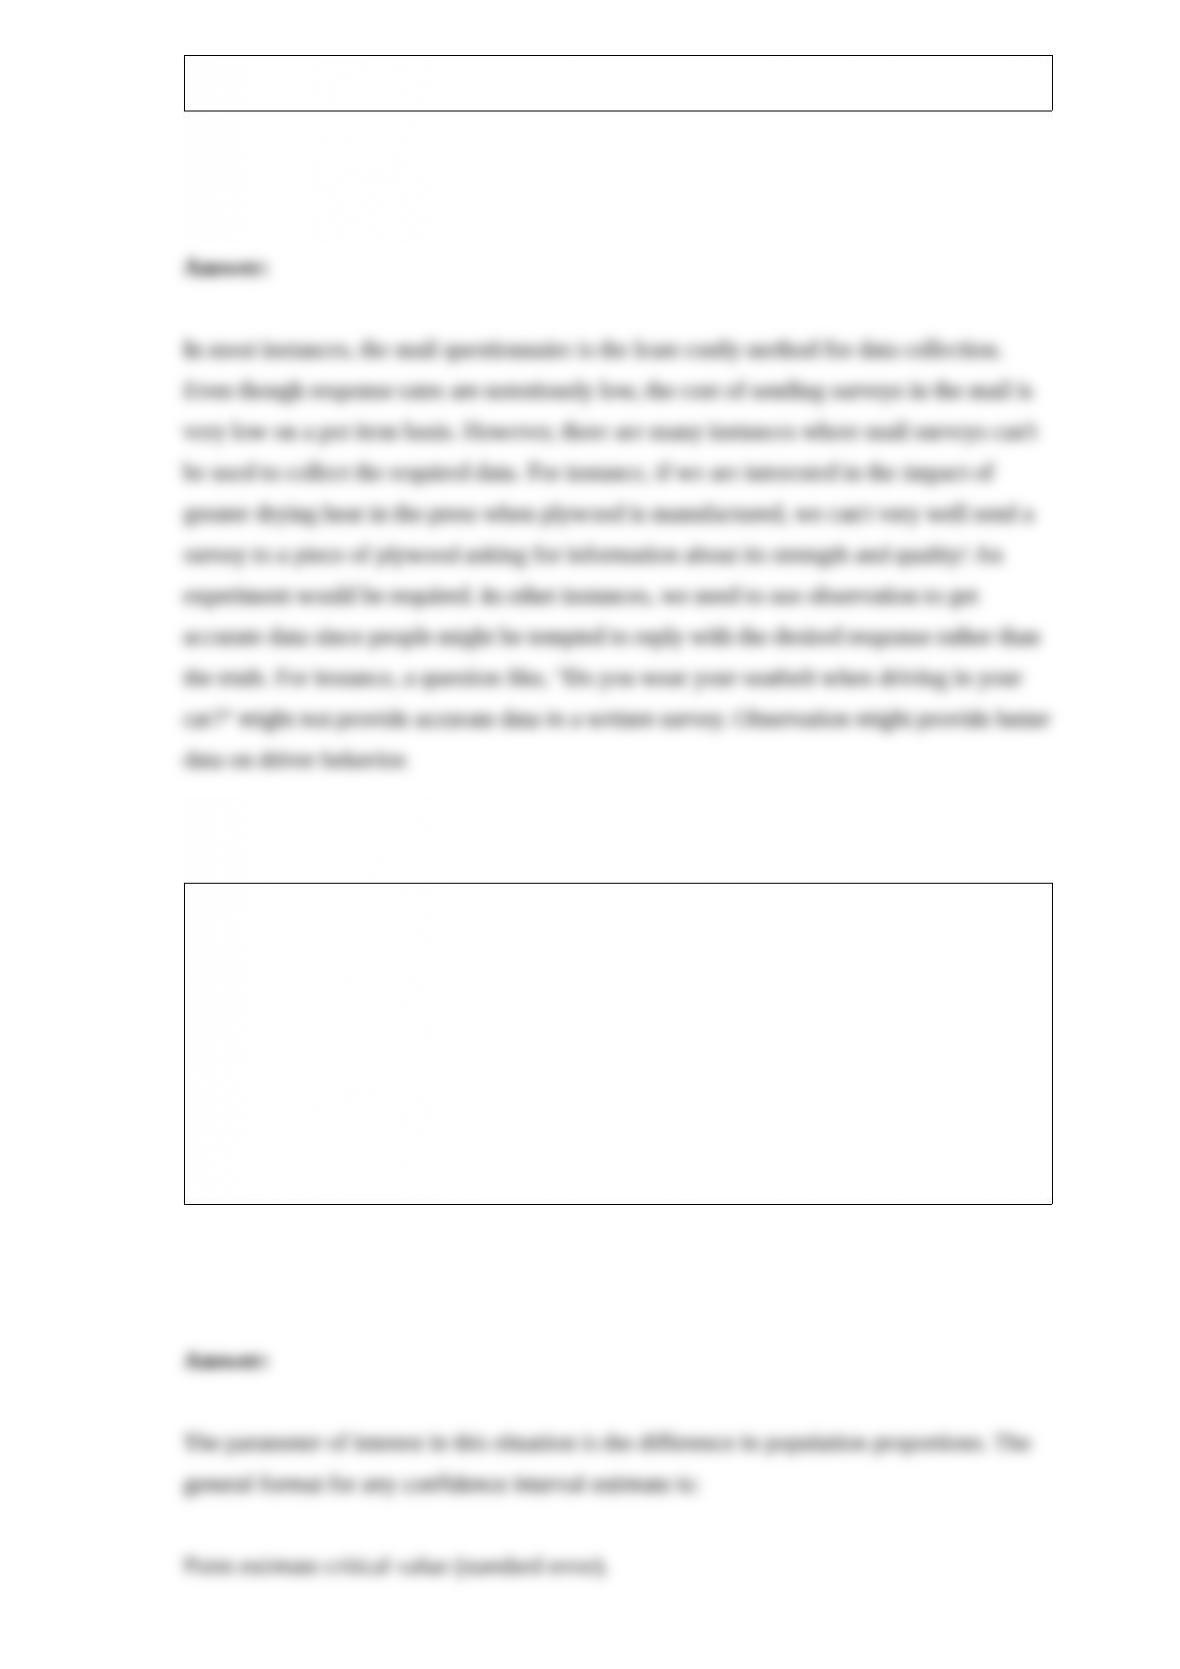
A market research firm has come up with two coupon designs that could be inserted
into the envelopes that go out with the monthly statement to credit card customers. The
coupons offer the customer an opportunity to become a member of a travel club. The
research firm is interested in estimating the difference in proportion of customers who
will join the club after receiving one or the other of the two coupons. To obtain this
estimate, the research firm has sent out coupon design 1 to a random sample of 100
customers. A second random sample of 100 customers received coupon 2. For the first
coupon, 11 customers joined the travel club, while 15 customers who received coupon 2
joined. Based upon this sample information, develop and interpret the desired 95
percent confidence interval estimate.


Discuss the steps involved in developing and carrying out a written survey.

Suppose that the distribution of grocery purchases is thought to be symmetric. If the
mean purchase is $23.14, what would the median purchase be?
Explain the difference between stratified random sampling and cluster random
sampling.

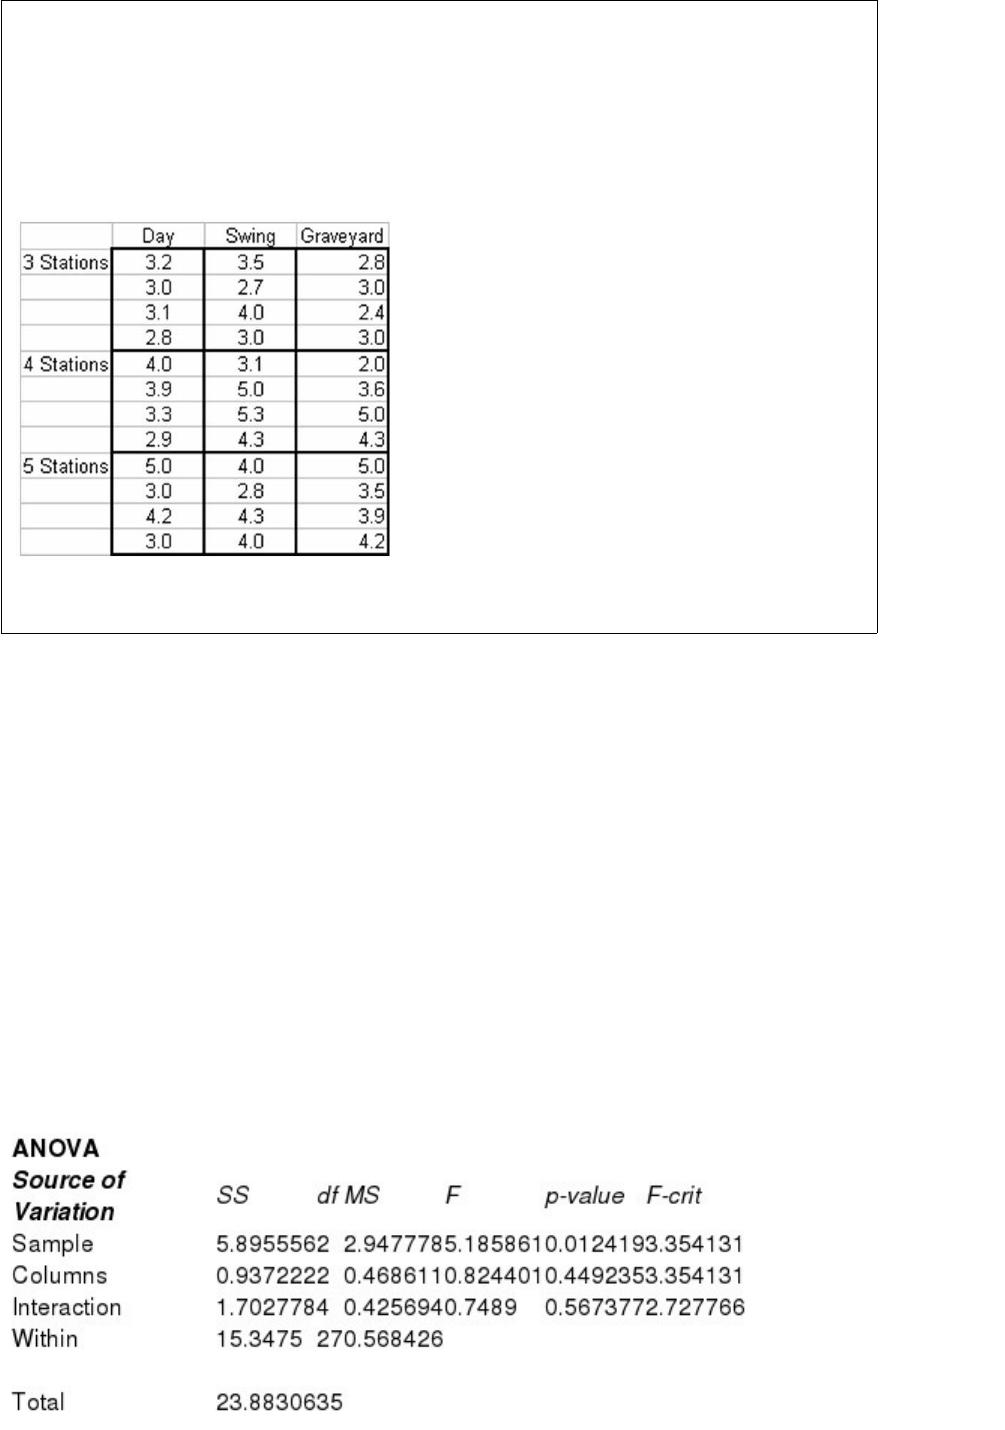
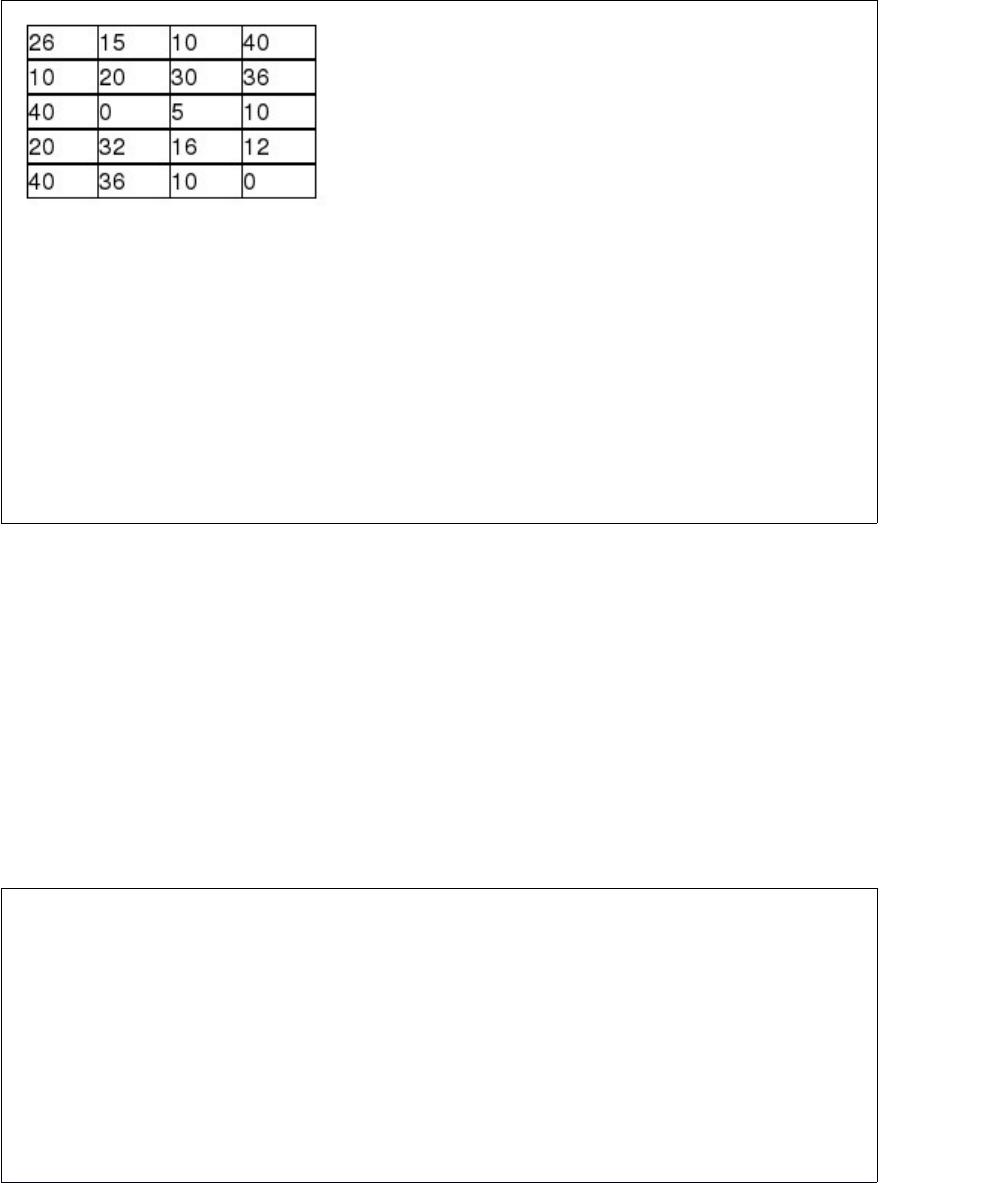
A personal computer assembly company is interested in studying the time it takes to
assemble a computer under different conditions. Specifically, two factors are to be
controlled: Factor A (Sample) is the number of individual work stations in the line and
Factor B (Columns) is whether the assembly was done on day shift, swing shift, or
graveyard shift. The following data were obtained in the study where the response
variable is the time required to assemble the PC from start to final test.
Carry out the appropriate statistical tests using an alpha equal .05 level.

Why should a histogram contain no gaps between the bars but a bar chart may have
gaps?


A PC company uses two suppliers for rechargeable batteries for its notebook computers.
Two factors are important quality features of the batteries: mean use time and variation.
It is desirable that the mean use time be high and the variability be low. Recently, the
PC maker conducted a test on batteries from the two suppliers. In the test, 9 randomly
selected batteries from Supplier 1 were tested and 12 randomly selected batteries from
Supplier 2 were tested. The following results were observed:
Supplier 1 Supplier 2
n1 = 9 n2 = 12
1 = 67.25 min 2 = 72.4 min
s1 = 11.2 min s2 = 9.9 min
Based on these sample results, can the PC maker conclude that a difference exists
between the two batteries with respect to the population standad deviations? Test using
a 0.10 level of significance.

What is the difference between a normal distribution and the standard normal
distribution?

Explain why it is appropriate to connect the points on a line graph, but the points on a
scatter plot should not be connected.
The money spent by people at an amusement park, after paying to get in the gate, is
thought to be uniformly distributed between $5.00 and $25.00. Based on this, what is
the probability that someone will spend between $8.00 and $12.00?


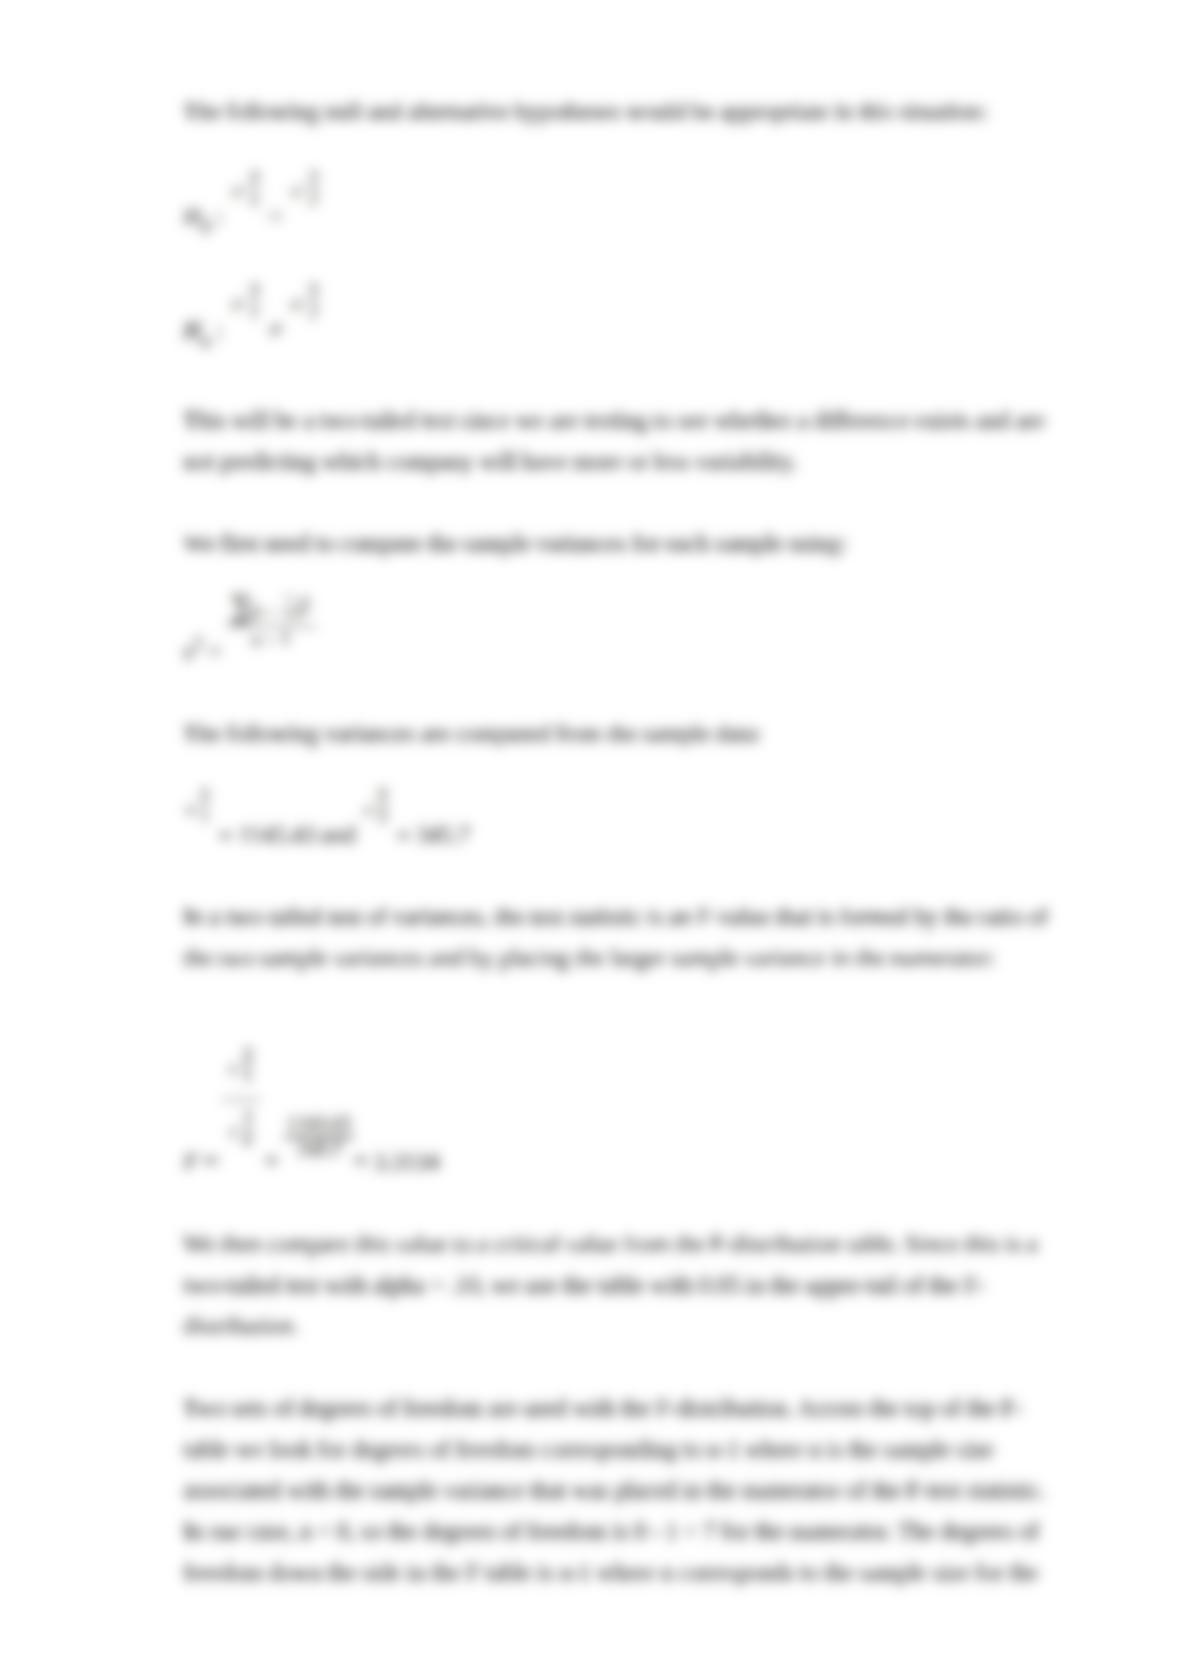
There are two major companies that provide SAT test tutoring for high school students.
At issue is whether Company 1, which has been in business for the longer time,
provides better results than Company 2, the newer company. Specifically of interest is
whether the mean increase in SAT scores for students who have already taken the SAT
test one time is higher for Company 1 than for Company 2. Two random samples of
students are selected. The following data reflect the number of points higher (or lower)
that the students scored on the SAT test after taking the tutoring. Prior to conducting the
test, which compares the means, we should determine if the assumption of equal
variances is supported.
Conduct the appropriate hypothesis test to determine if the assumption of equal
variances is supported using a 0.10 level of significance.
Company 1 Company 2
98 65
60 11
-14 30
80 52
55 27
71 16
37 27
41 47