
Which of the following data sets provides the most realistic estimate of the performance
of a model on completely unseen data?
A) validation data set
B) test data set
C) training data set
D) linear regression data set
The Risk Solver Platform ________ feature allows you to superimpose the frequency
distributions from selected forecasts on one chart in order to compare differences and
similarities that might not be apparent.
A) trend chart
B) sensitivity chart
C) overlay chart
D) box-whisker chart
Shirley Templeton is a real estate agent for Paralol Realty. Shirley is given the
responsibility to manage potential customers for 5 of the Realty’s bungalows. These 5
bungalows are situated in close proximity. In order to make traveling easier, Shirley
decides to move to a location closer to the 5 bungalows. The table below gives the
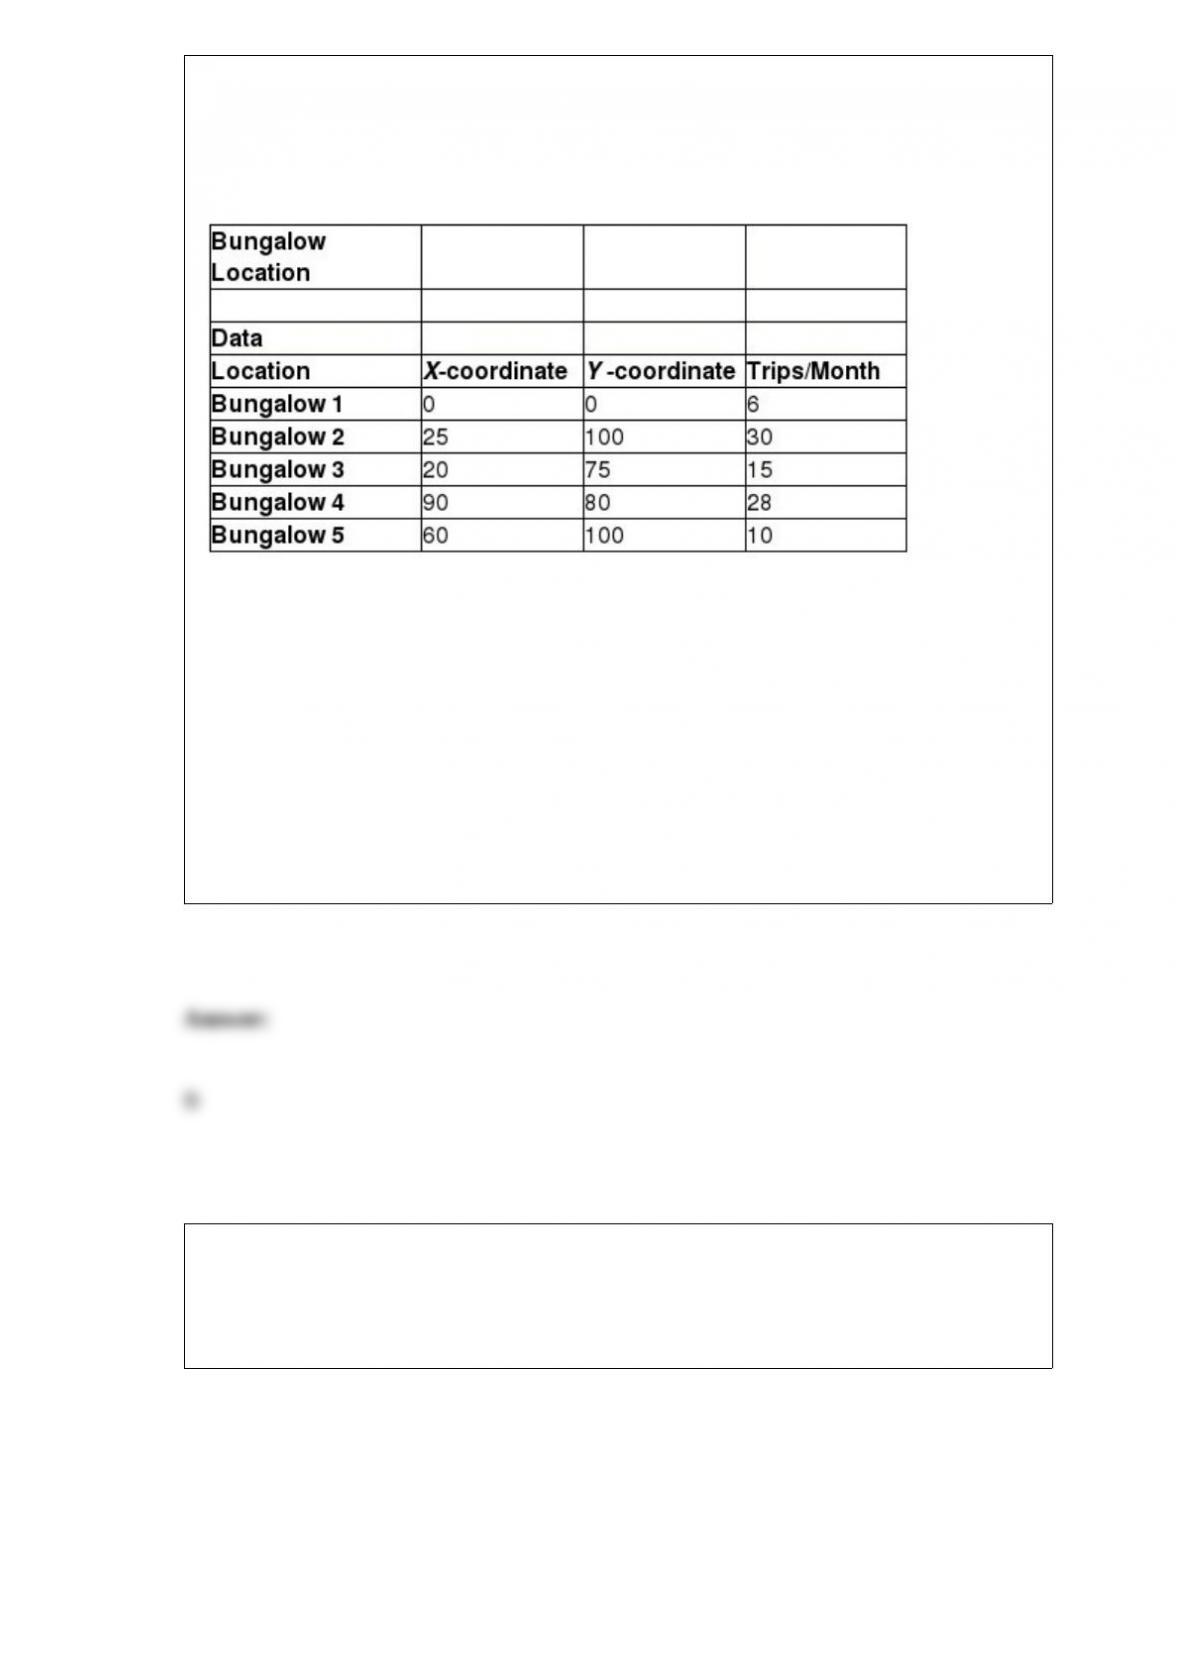
location (X and Y coordinates) of the 5 bungalows along with the number of trips she
would have to make to each bungalow. Create a nonlinear model based on the data
given in the table below noting that the objective is to reduce the weighted distance
between Shirley’s accommodation and the 5 bungalows.
According to the model, what is the X-coordinate for the location of Shirley’s new
accommodation?
A) 54.62
B) 36.53
C) 25
D) 23.12
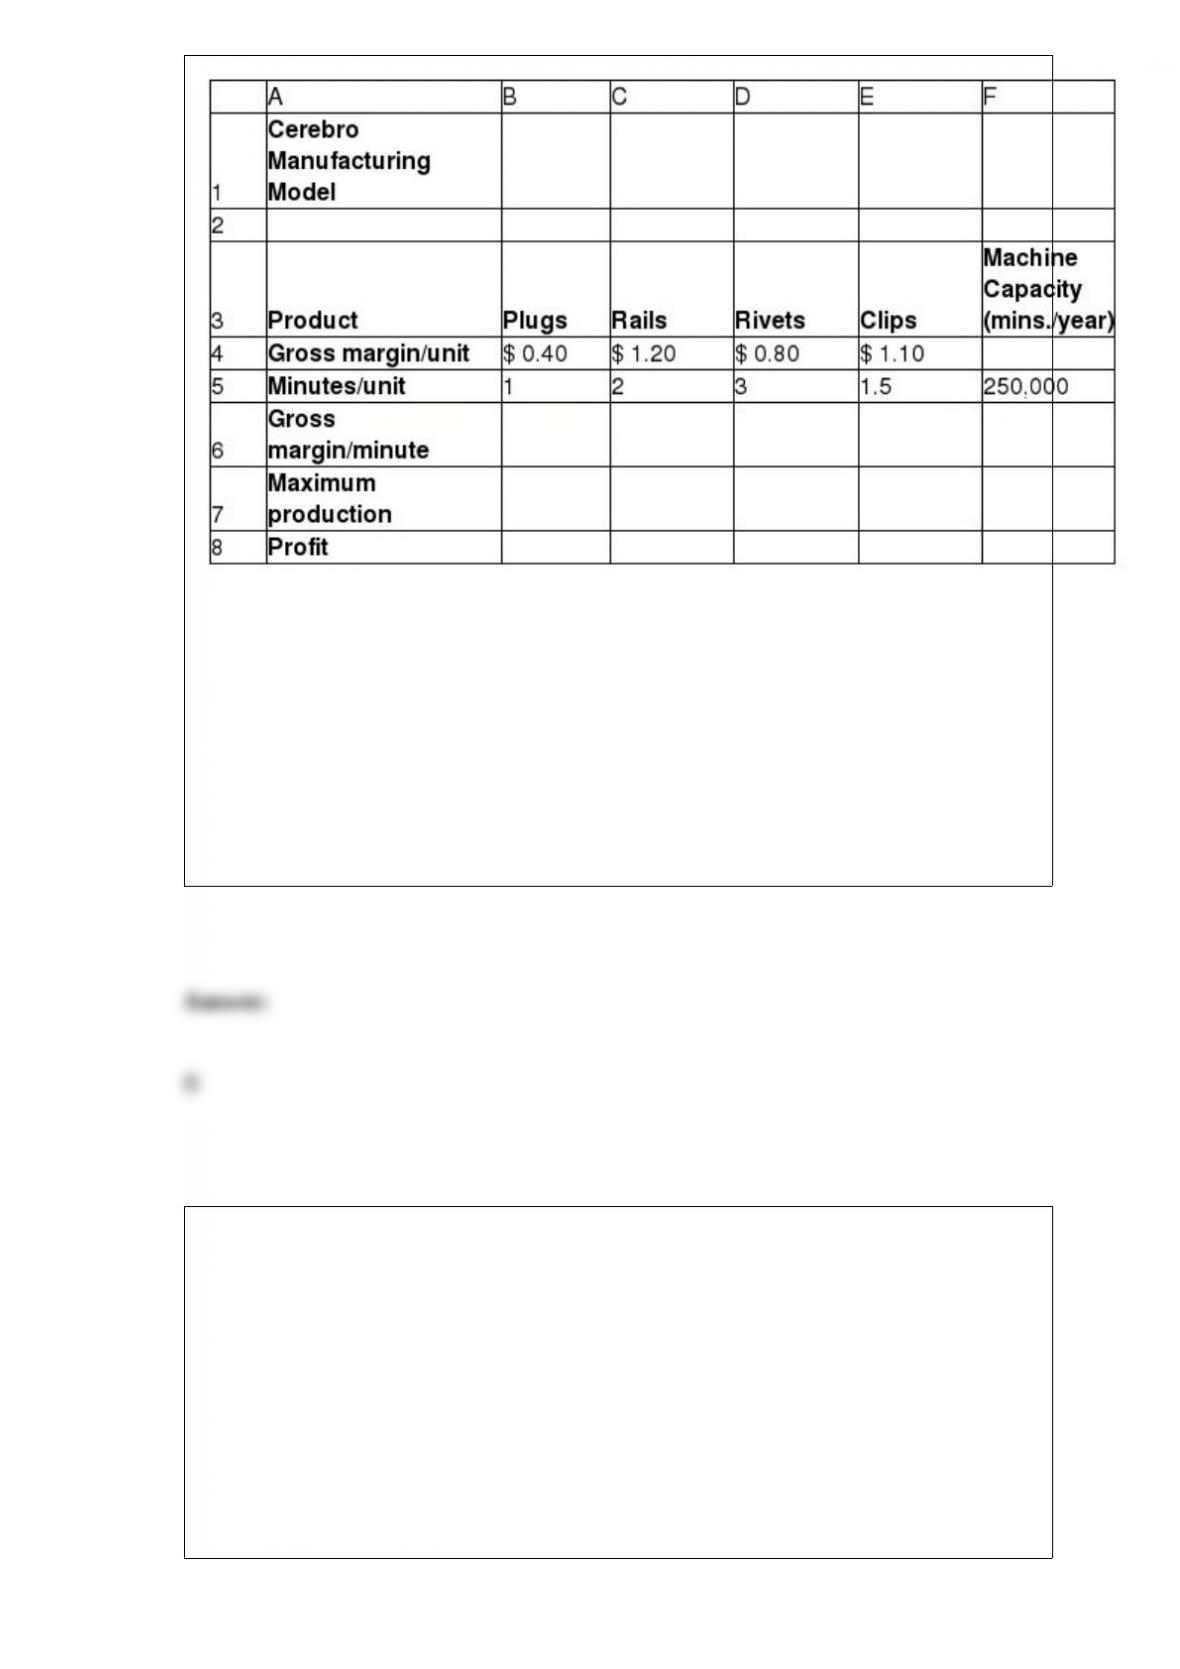
Cerebro Manufacturing produces four types of structural support fittings-plugs, rails,
rivets, and clips-which are machined on two CNC machining centers. The machining
centers have a capacity of 250,000 minutes per year. The gross margin per unit and
machining requirements are shown in the spreadsheet below.
What is the total profit generated from the manufacture of only plugs?
A) $ 66,666.67
B) $ 100,000.00
C) $ 183,333.33
D) $ 150,000.00
The Risk Solver Platform ________ feature allows you to superimpose the frequency
distributions from selected forecasts on one chart in order to compare differences and
similarities that might not be apparent.
A) trend chart
B) sensitivity chart
C) overlay chart
D) box-whisker chart
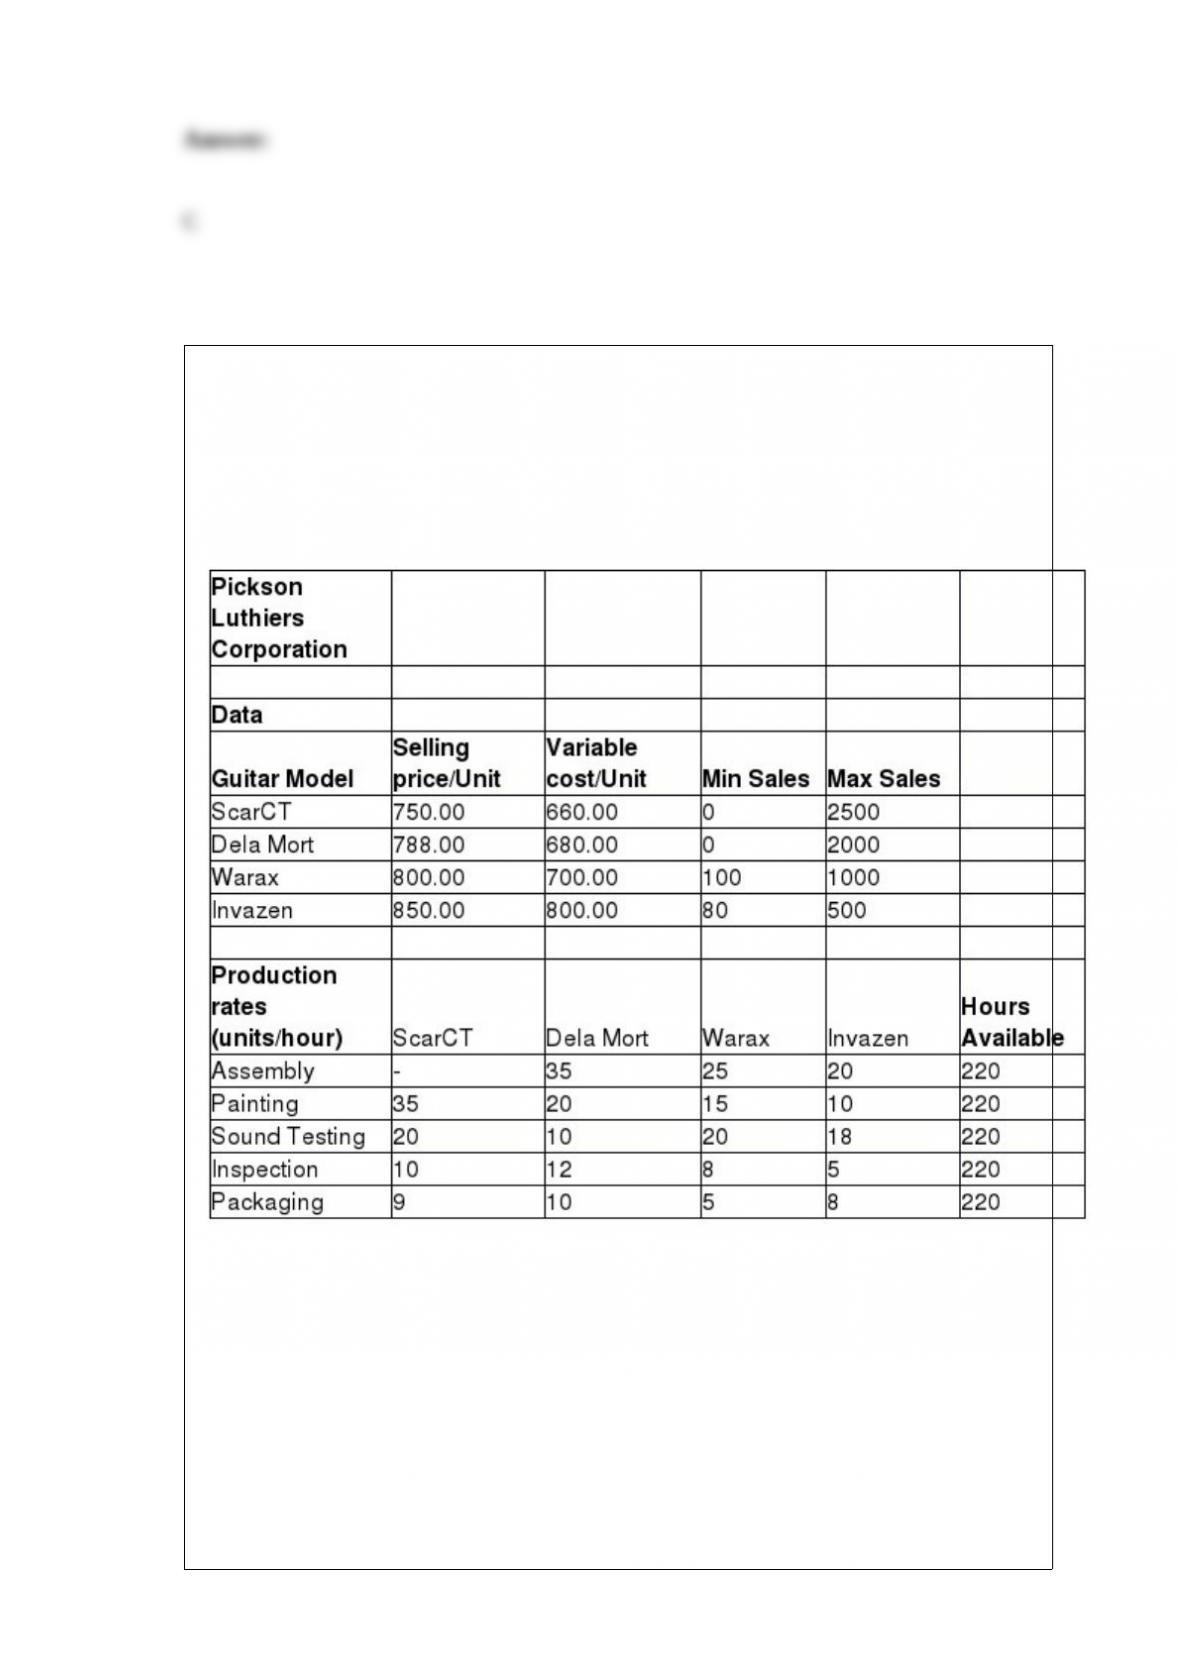
Pickson Luthiers Corporation makes four models of electric guitars, ScarCT, Dela Mort,
Warax, and Invazen. Each guitar must flow through five departments, assembly,
painting, sound testing, inspection, and packaging. The table below shows the relevant
data. Production rates are shown in units/hour. (ScarCT is assembled elsewhere).
Pickson wants to determine how many guitars to make to maximize monthly profit.
According to the linear optimization model, what is the total hours spent for painting all
the models?
A) 220
B) 94.94
C) 109.67
D) 199.44

When two or more independent variables in the same regression model can predict each
other better than the dependent variable, the condition is referred to as _______.
A) autocorrelation
B) heteroscedasticity
C) multicollinearity
D) homoscedasticity
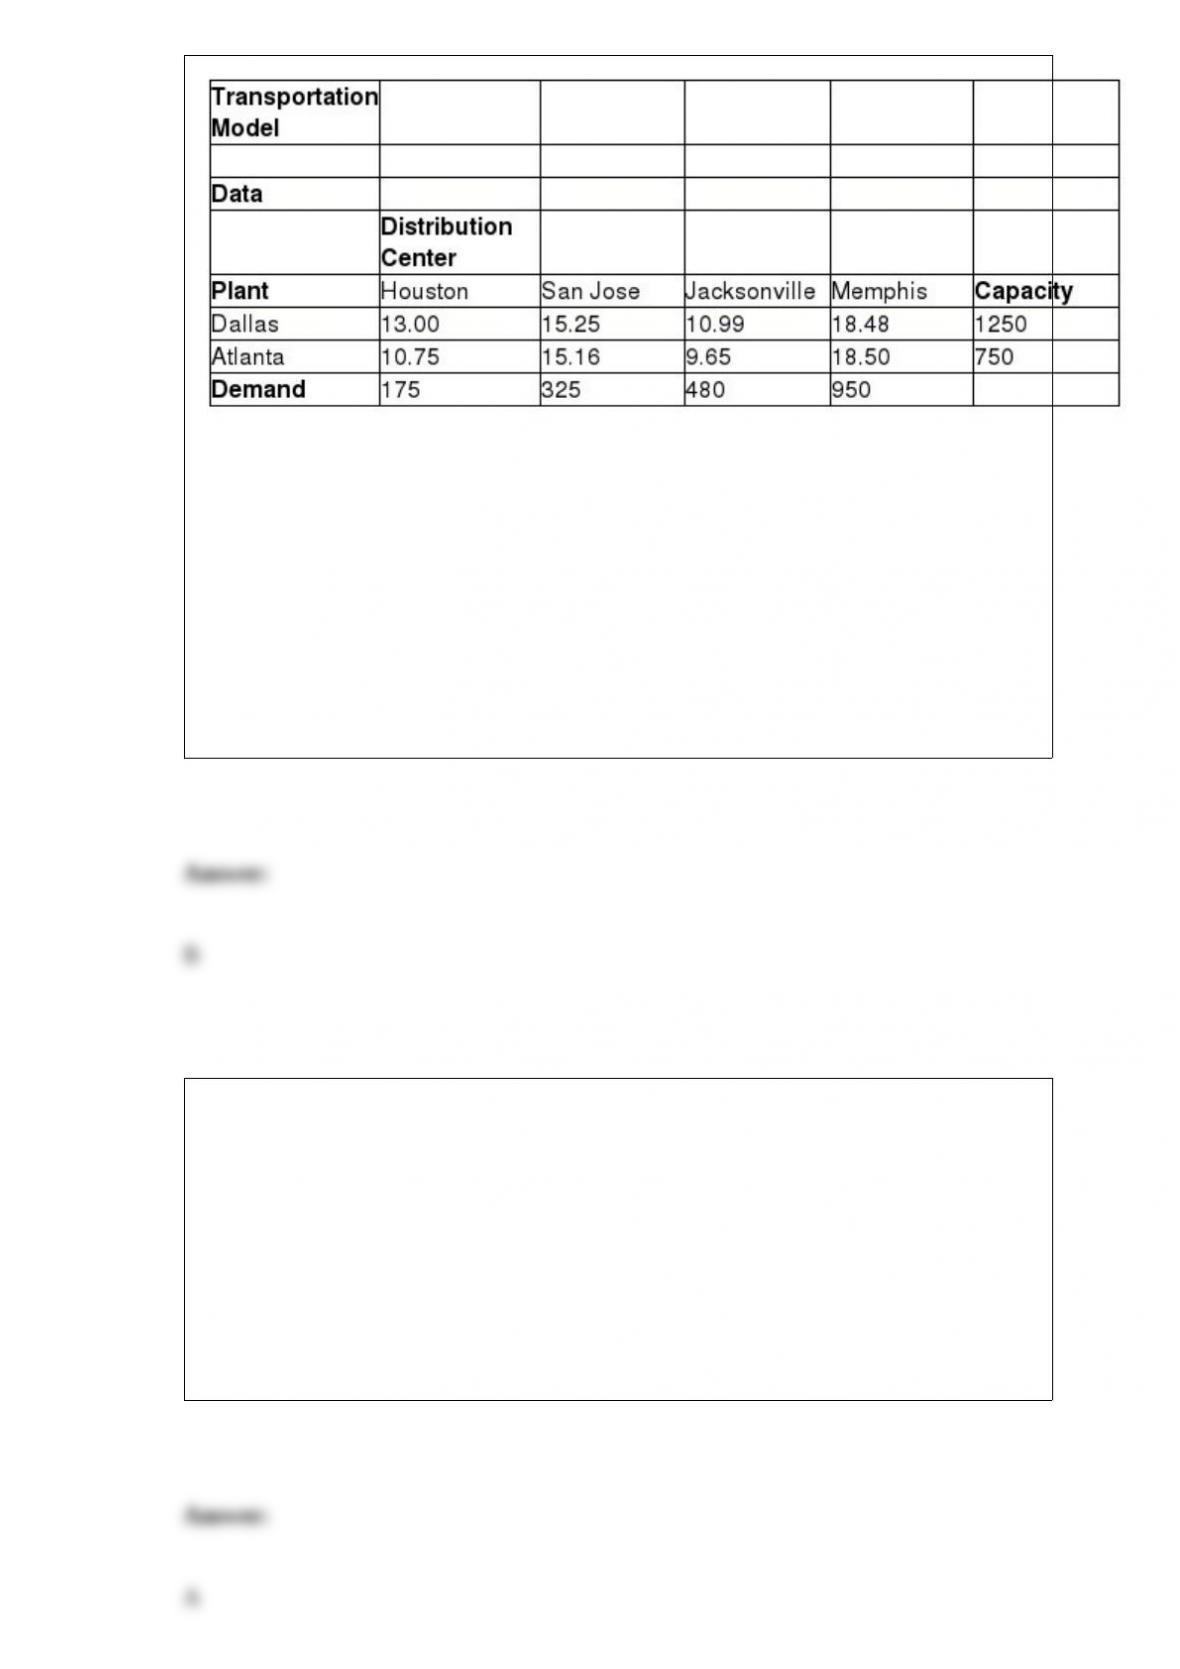
The Riviera Transport Company (RTC) produces car accessories at two plants: Dallas
and Atlanta. They ship them to major distribution centers in Houston, San Jose,
Jacksonville, and Memphis. The accounting, production, and marketing departments
have provided the information in the table below, which shows the unit cost of shipping
between any plant and distribution center, plant capacities over the next planning
period, and distribution center demands. RTC’s supply chain manager faces the problem
of determining how much to ship between each plant and distribution center to
minimize the total transportation cost, not exceed available capacity, and meet customer
demand.
Assume Xij = amount shipped from plant i to distribution center j, where i = 1
represents Dallas, i = 2 represents Atlanta, j = 1 represents Houston, and so on.
According to the transportation model, what is the amount shipped from Atlanta to
Memphis?
A) 480
B) 0
C) 230
D) 950
Which of the following is true when testing for normality of errors?
A) Normality is verified by inspecting for a bell-shaped distribution.
B) It is easier to evaluate normality with small sample sizes.
C) A scatter diagram of the whole data is always used to verify normality.
D) Errors are normally distributed when the scatter diagram shows a straight-line
distribution.
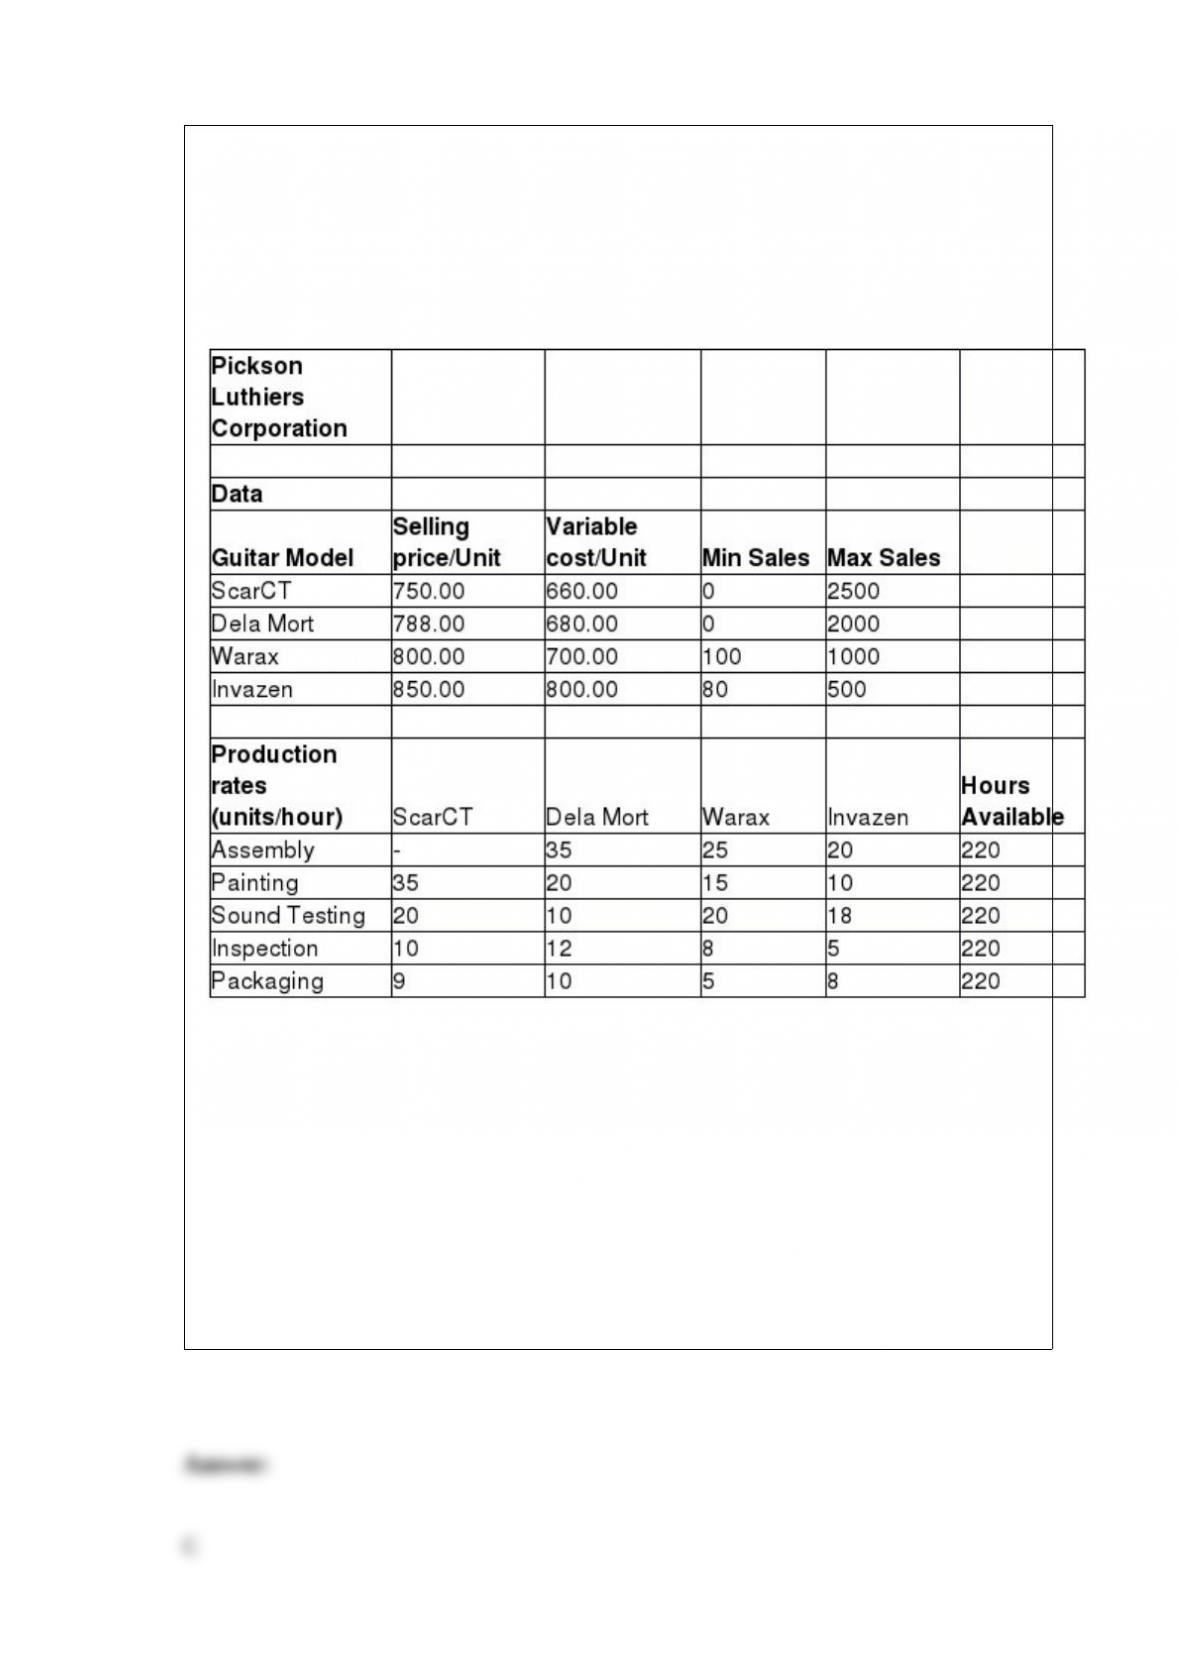
Pickson Luthiers Corporation makes four models of electric guitars, ScarCT, Dela Mort,
Warax, and Invazen. Each guitar must flow through five departments, assembly,
painting, sound testing, inspection, and packaging. The table below shows the relevant
data. Production rates are shown in units/hour. (ScarCT is assembled elsewhere).
Pickson wants to determine how many guitars to make to maximize monthly profit.
According to the linear optimization model, what is the total number of ScarCTs
produced?
A) 2500
B) 750
C) 0
D) 100
If cell G7 contains the function, it states that if the value in cell C3 is 9, the number 7
will be assigned to cell G7; if the value in cell C3 is not 9, the number 4 will be
assigned to cell G7.
A) =IF(G7=9)(G7=7)=OR(G7=4)
B) =IF(G7=7)=THEN(C3=9)=OR(C3=4)
C) =IF(C3=9)(C3=7)=OR(C3=4)
D) =IF(C3=9,7,4)
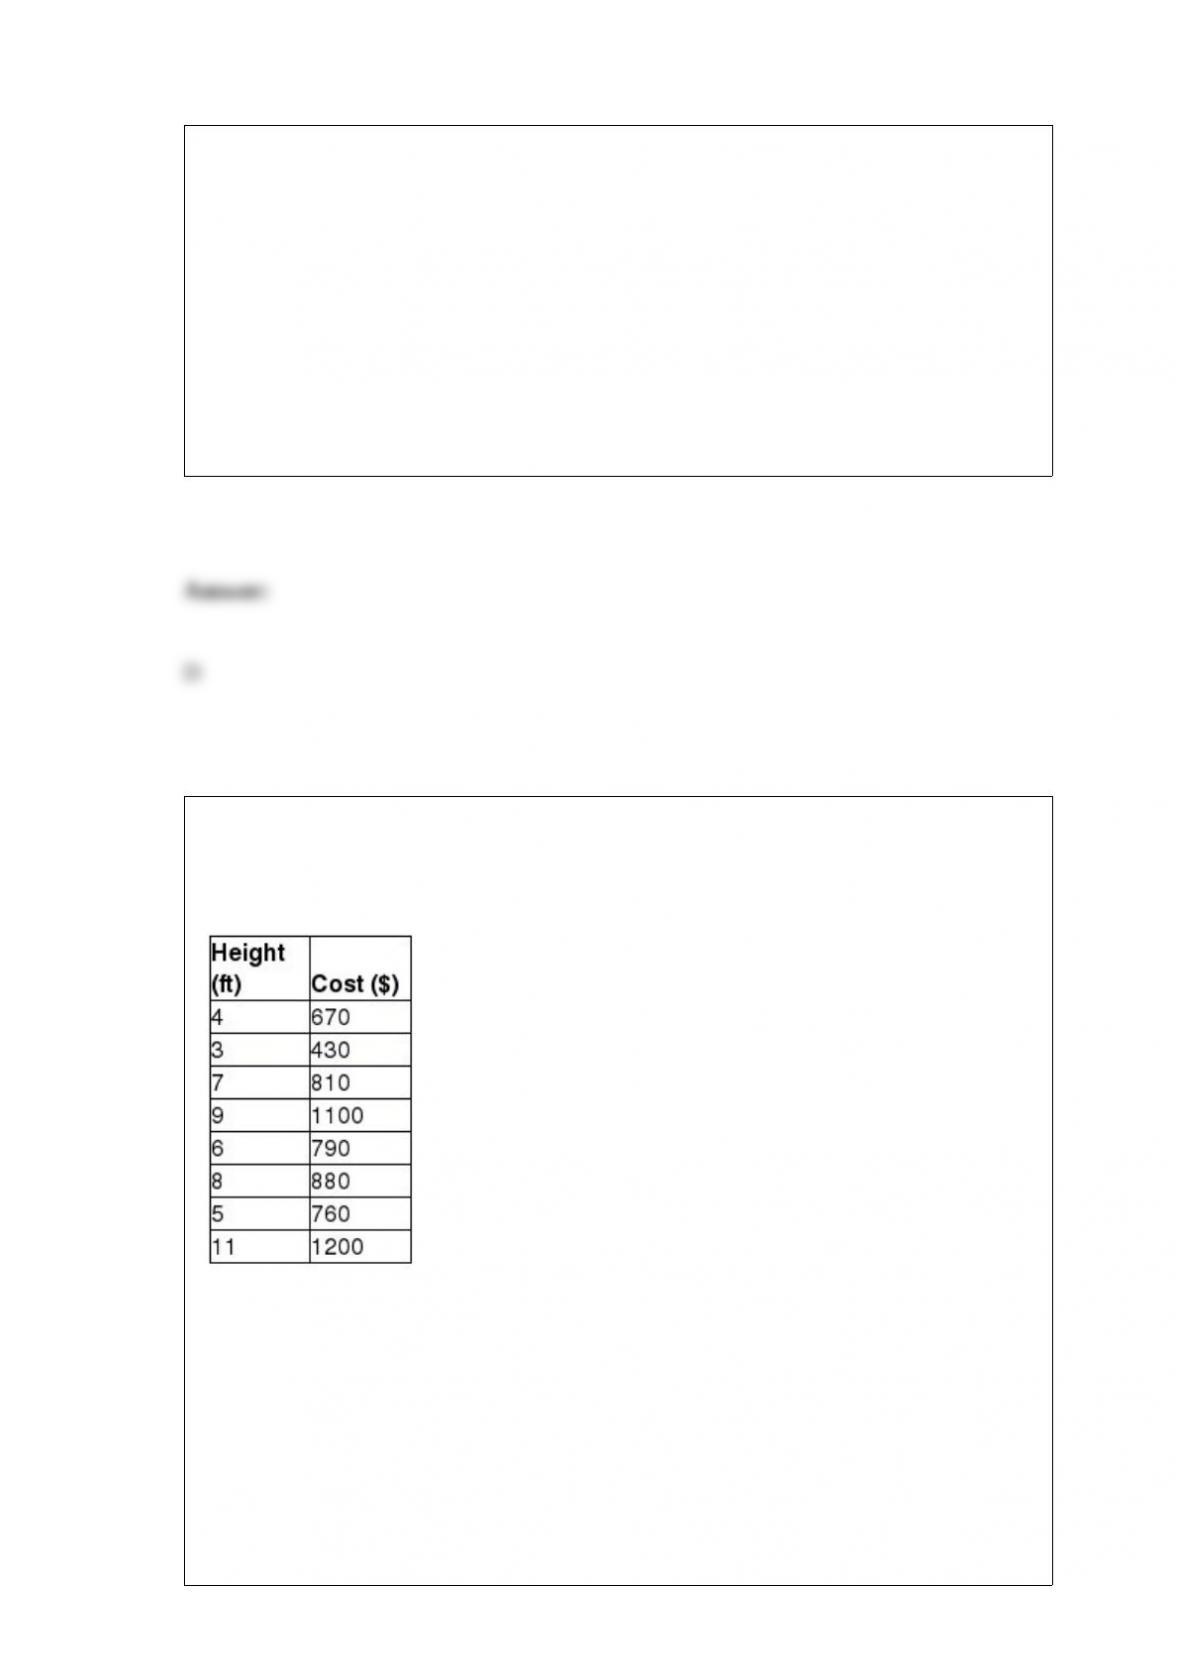
Following is an extract from the database of a construction company. The table shows
the height of walls in feet and the cost of raising them. The estimated simple linear
regression equation is given as Ŷ = b0 + b1X. (Hint: Use Excel functions).
What is the estimated cost of raising a 10-inch wall?
A) 1505.786
B) 1103.578
C) 968.6109
D) 1123.008
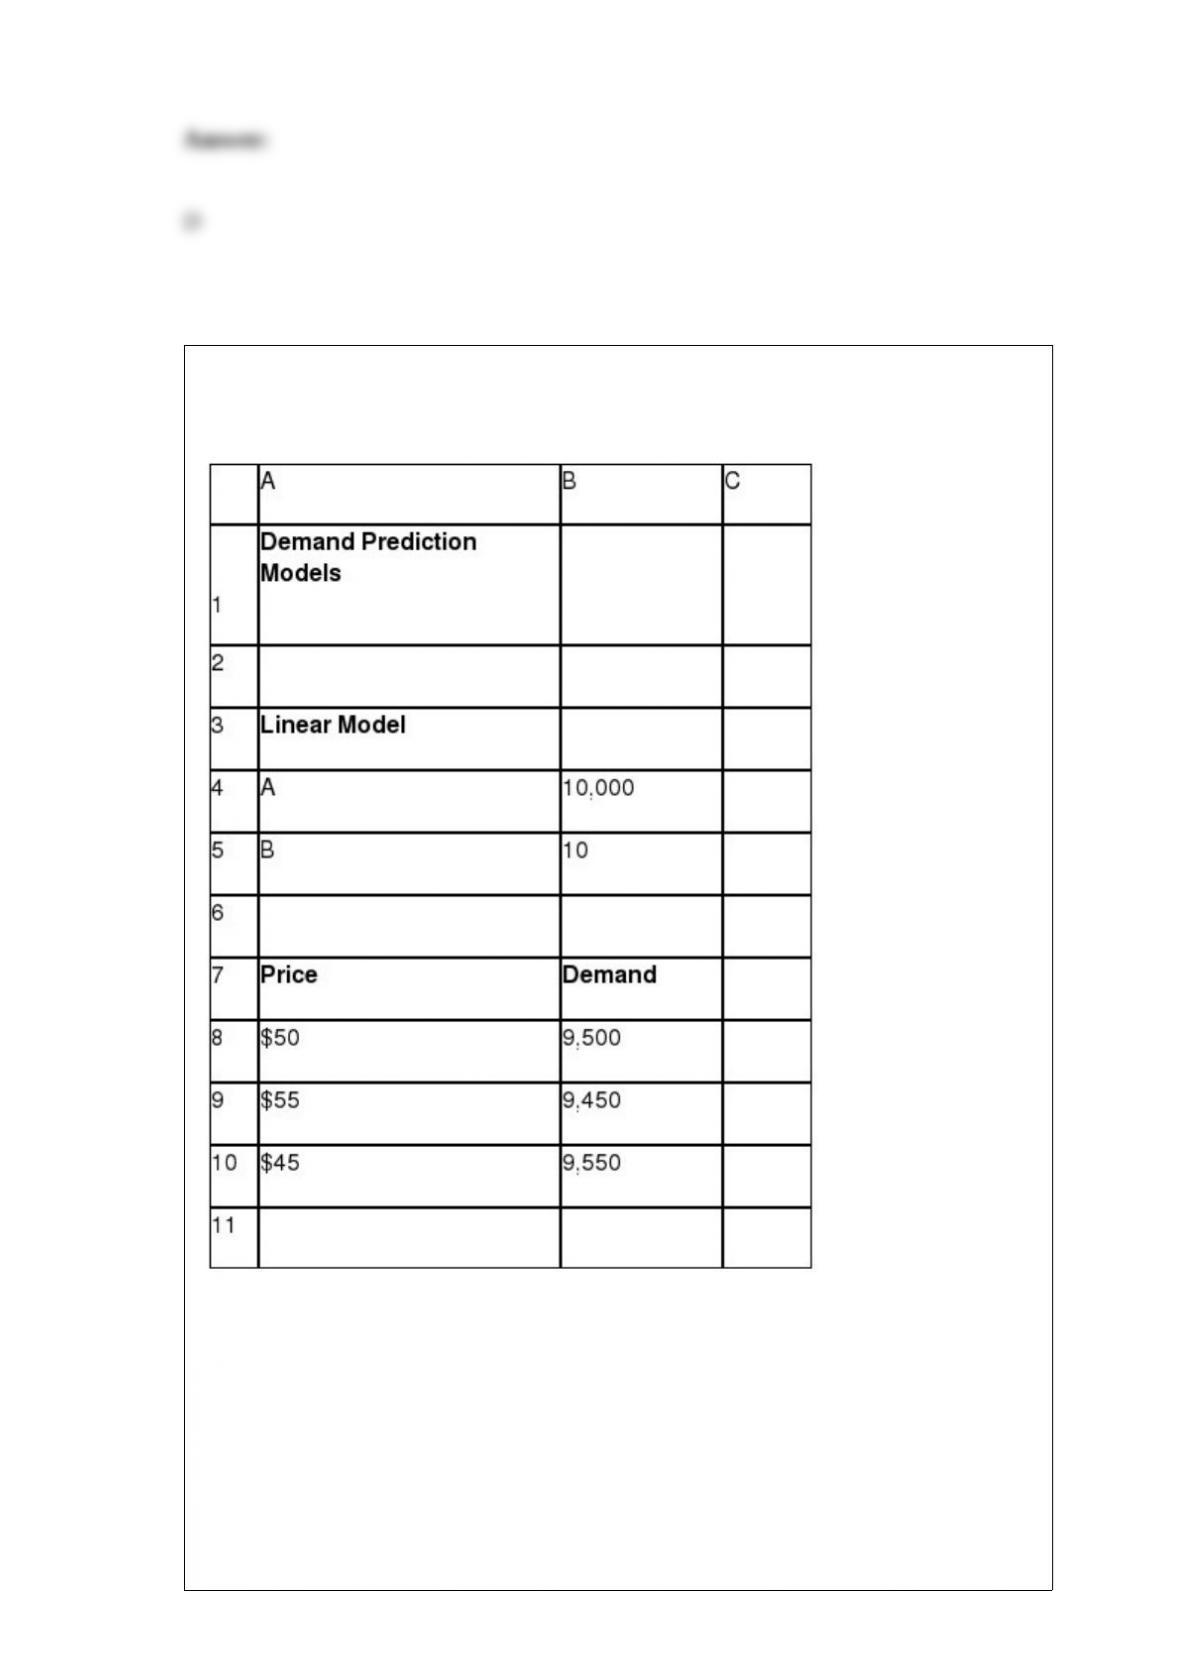
Below is the spreadsheet for demand prediction of a company that sells chocolates.
Given that D = a-bP, where D, is demand, “a” and “b,” are linear constants, and P, is
price, from the below spreadsheet, how will the formula in B9 be represented in Excel
using relative addressing?
A) B4-B5*A9
B) C5-C6*A10
C) B4-B5*A10
D) B5-B6*A10
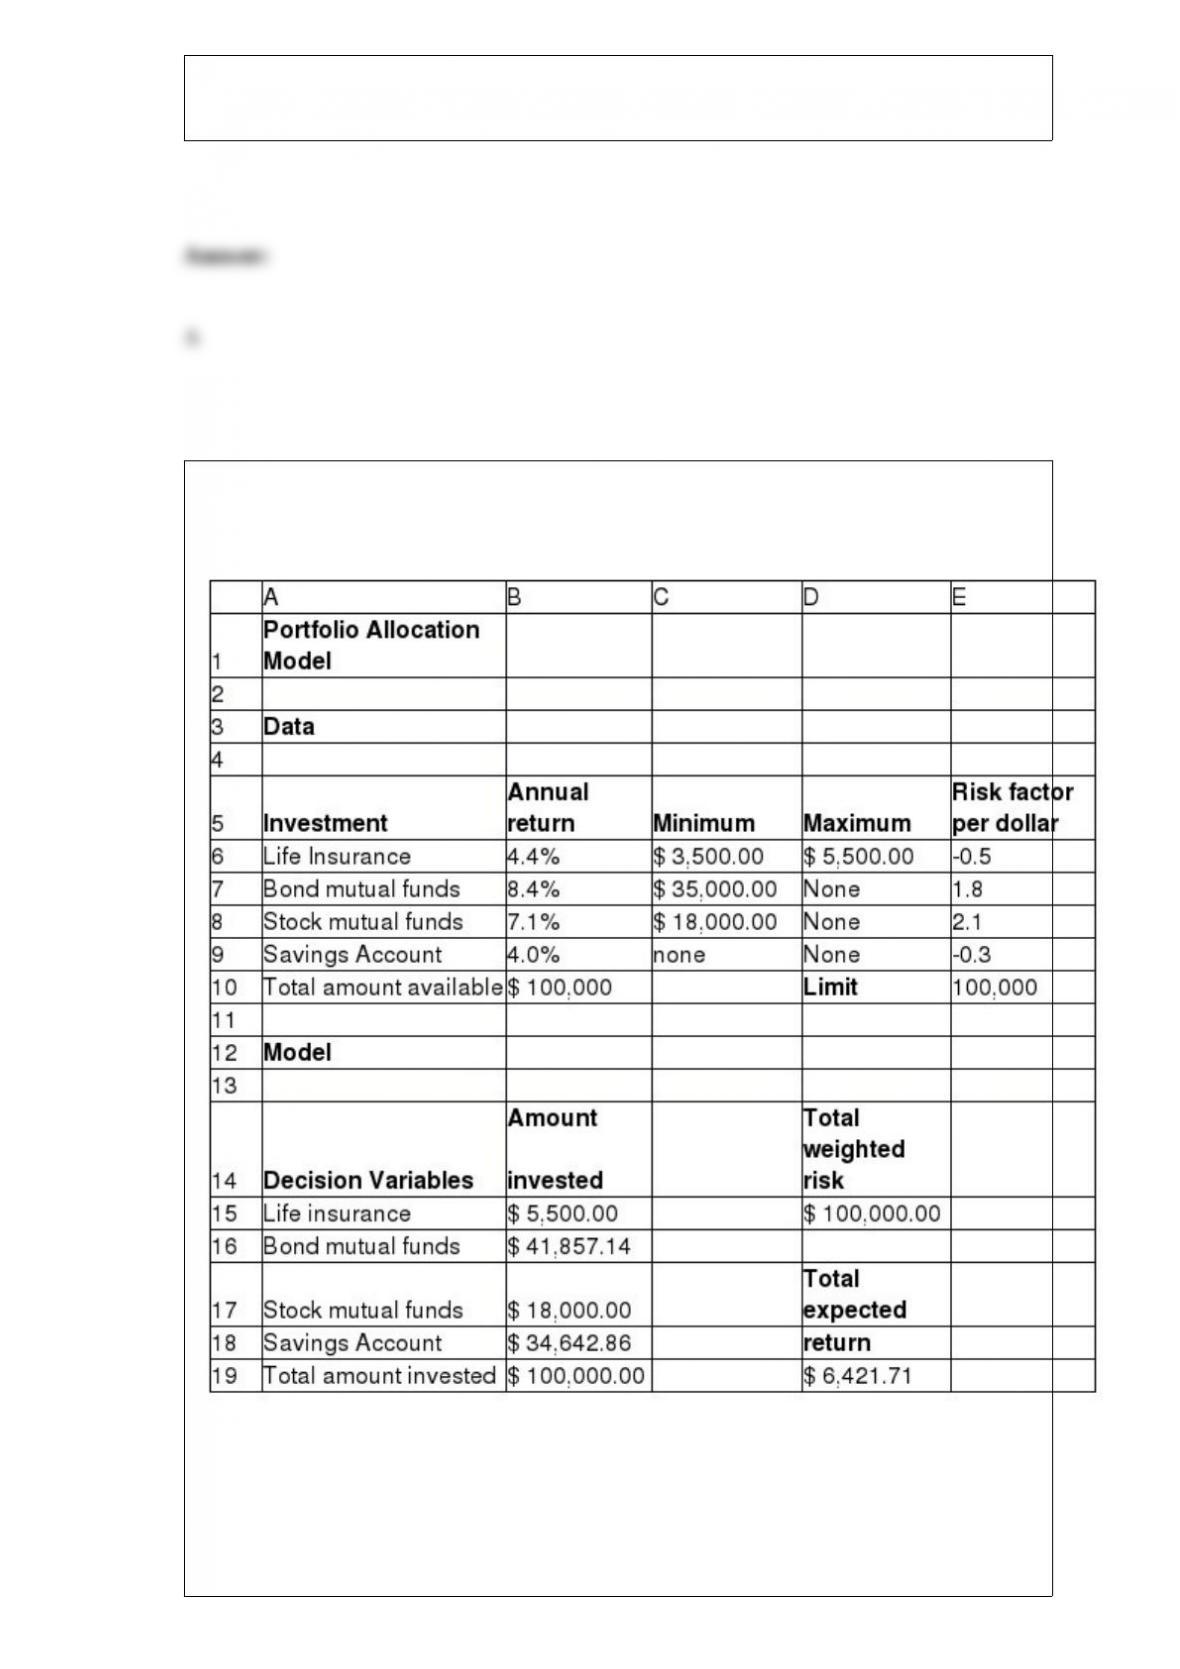
Below is the spreadsheet for a portfolio allocation model.
Answer the following question(s) using a model with uncertainty on type of investment
return. Assume that the distributions of life insurance annual return is uniform with
minimum 4% and maximum 6%, bond mutual funds annual return is normal with mean
7% and standard deviation 1%, stock mutual funds annual return is lognormal with
mean 11% and standard deviation 4%. Use 10,000 trials and 1 for random seed for the

simulation.
What is the coefficient of variation obtained from the simulation results for maximizing
the total expected return? [Hint: Choose the approximate value.]
A) 1.2451
B) 0.4865
C) 0.8917
D) 0.1284
Consider the spreadsheet for a Newsvendor Model.
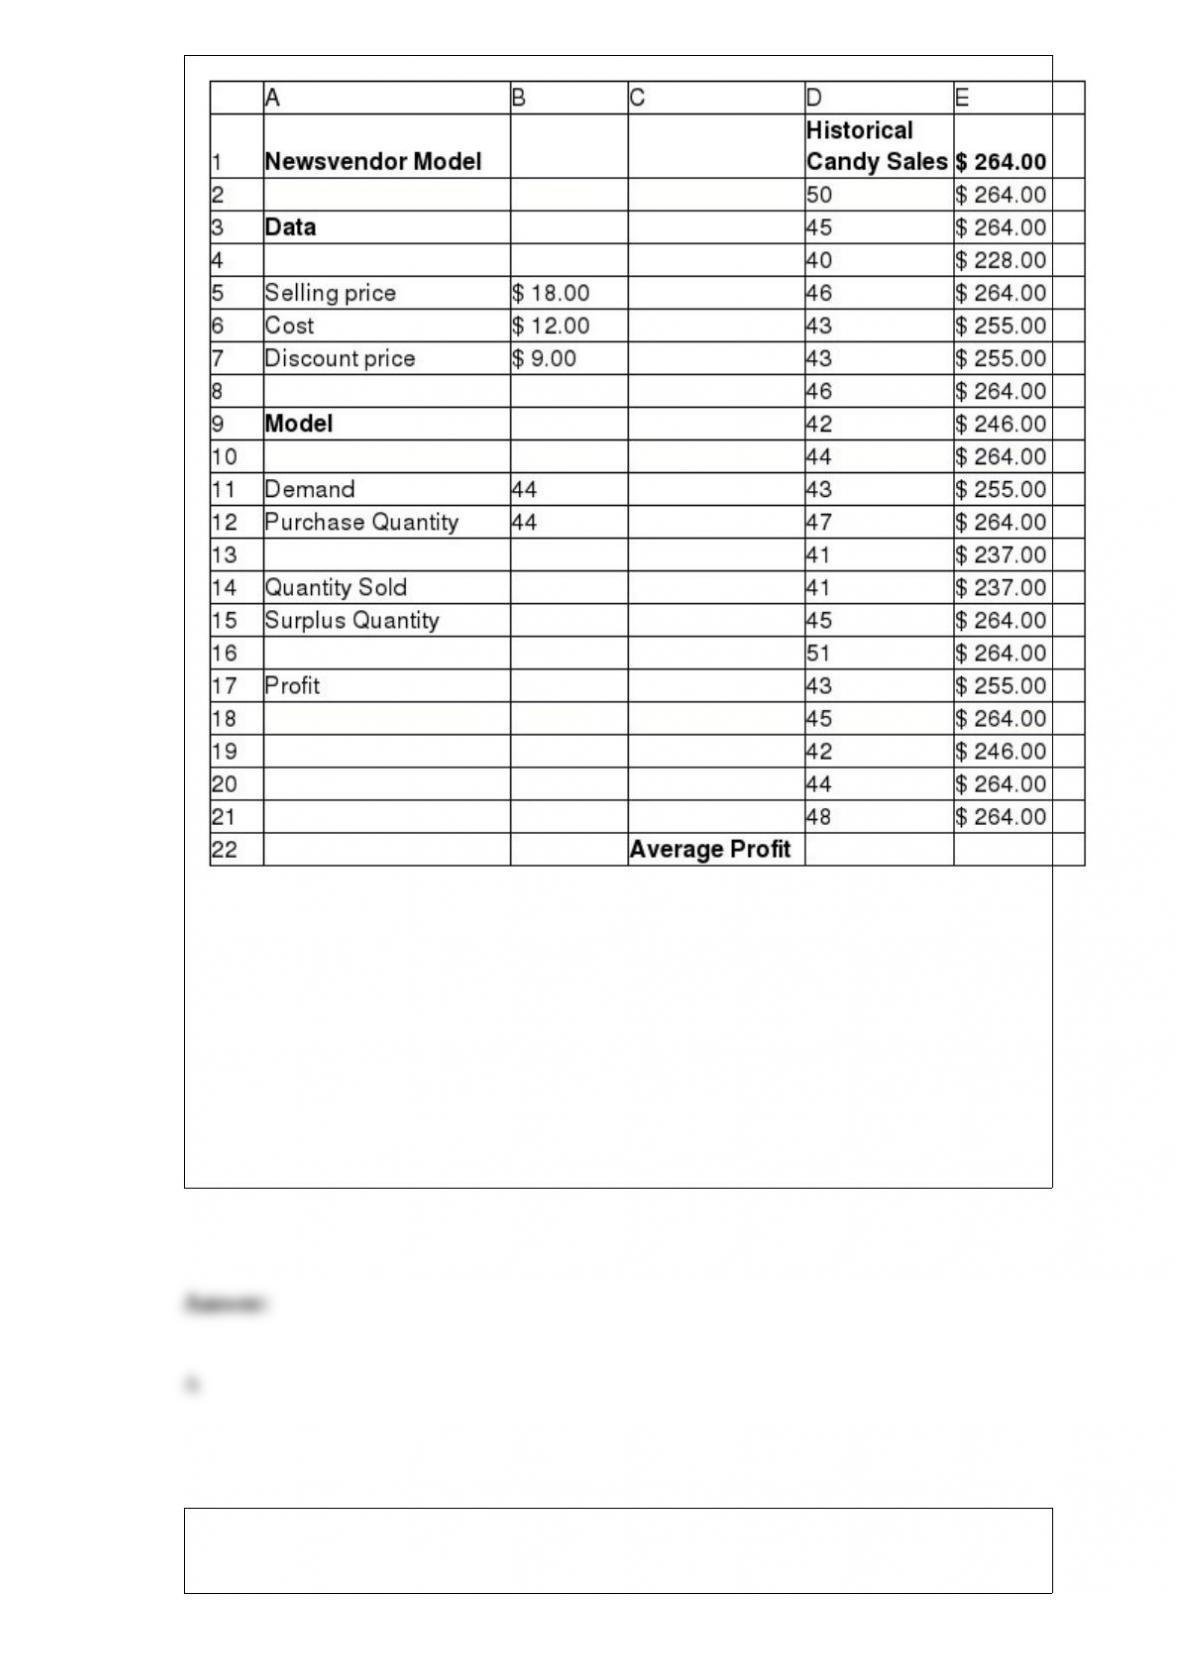
What is the value of mean profit?
A) $255.90
B) $251.45
C) $245.98
D) $264.00
Which of the following is the rectilinear distance between the points A(13, and
B(10,12)?

A) 4
B) 25
C) 6
D) 10
Which of the following is a difference between interval estimates and point estimates?
A) Point estimates cannot be used to calculate statistical error, while interval estimate is
used to calculate statistical error.
B) Point estimates provide only a single value for a sample, while interval estimates
provide a range of values.
C) Point estimates indicate the magnitude of potential error in the estimate, while
interval estimates don’t.
D) Point estimates on an average provide more information than interval estimates.
The Riviera Transport Company (RTC) produces car accessories at two plants: Dallas
and Atlanta. They ship them to major distribution centers in Houston, San Jose,
Jacksonville, and Memphis. The accounting, production, and marketing departments
have provided the information in the table below, which shows the unit cost of shipping
between any plant and distribution center, plant capacities over the next planning
period, and distribution center demands. RTC’s supply chain manager faces the problem
of determining how much to ship between each plant and distribution center to
minimize the total transportation cost, not exceed available capacity, and meet customer
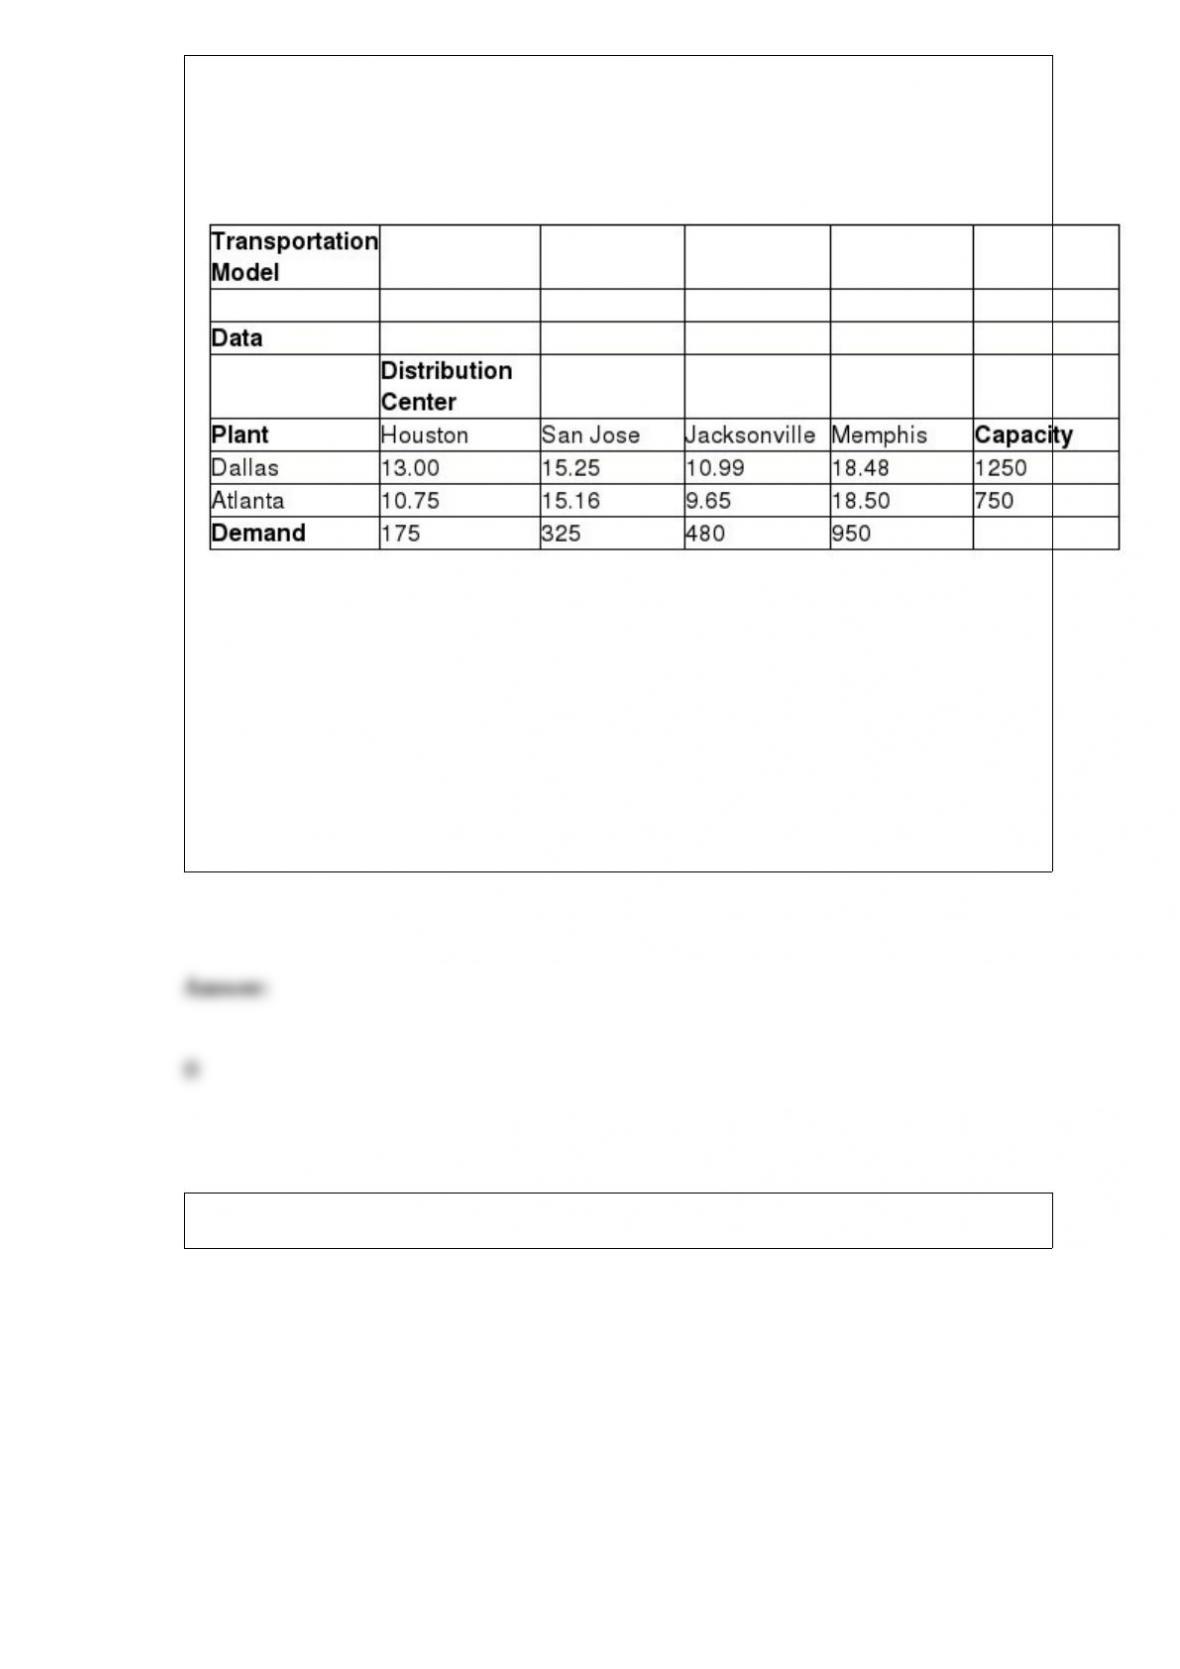
demand.
Assume Xij = amount shipped from plant i to distribution center j, where i = 1
represents Dallas, i = 2 represents Atlanta, j = 1 represents Houston, and so on.
Which of the following is the constraint for total amount shipped from Atlanta?
A) X11 + X12 + X13 + X14 – X21 + X22 + X23 + X24 ≤ 850
B) X21 + X22 + X23 + X24 ≤ 750
C) X21 + X22 + X23 + X24 ≤ 1250
D) X11 + X12 + X13 + X14 ≤ 1250
Below is the spreadsheet for a project selection model:
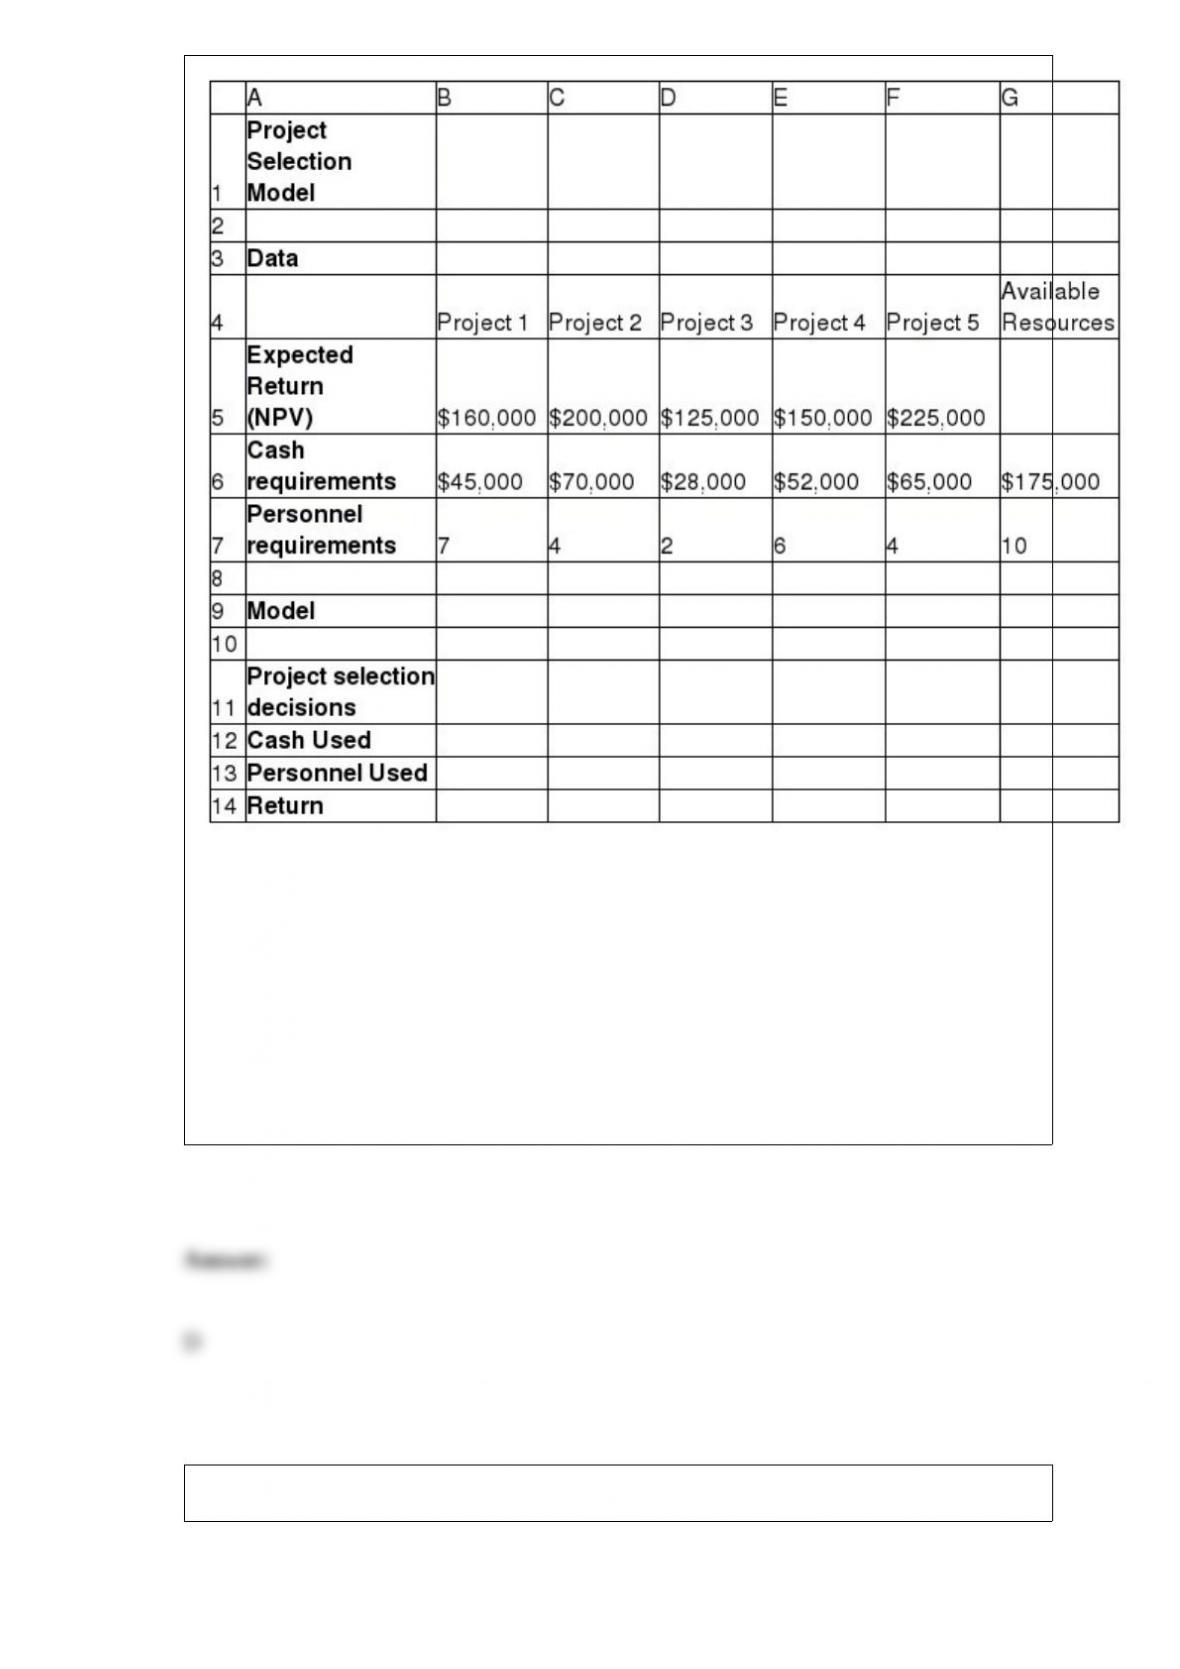
What is the return obtained from Project 5?
A) $ 200,000
B) $ 125,000
C) $ 275,000
D) $ 225,000
Below is a spreadsheet for Trance Electronics.
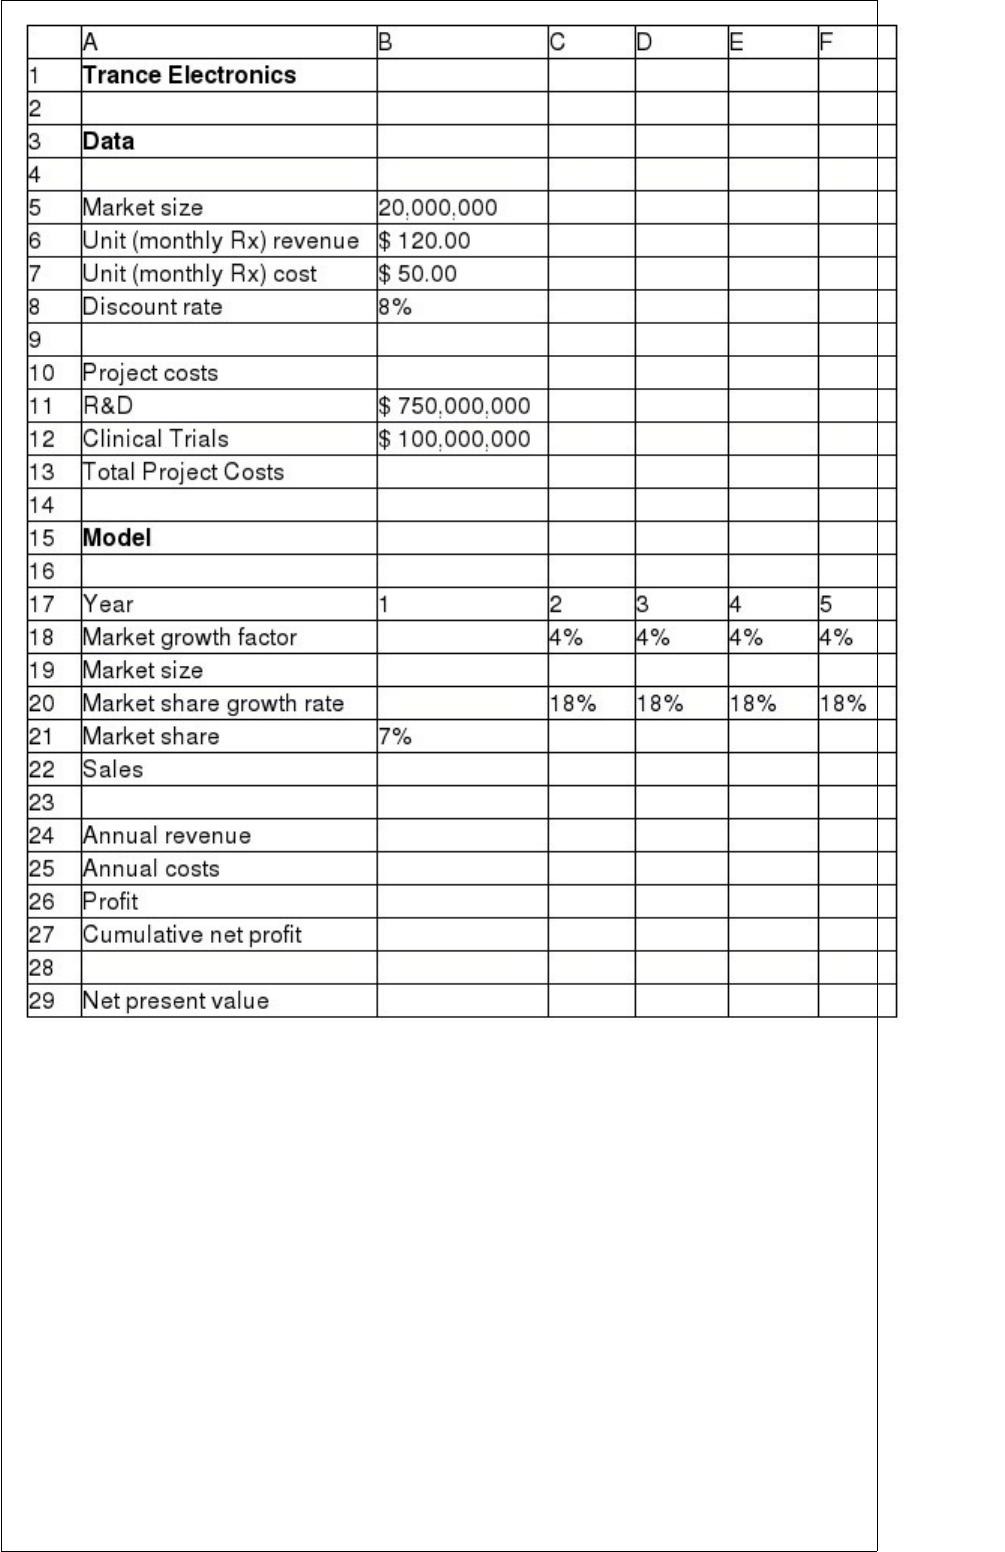
Suppose that the project manager of Trance Electronics has identified the following
uncertain variables in the model and the distributions and parameters that describe
them, as follows: Market size: normal with mean of 20,000,000 units and standard
deviation of 4,000,000 units. R&D costs: uniform between $600,000,000 and
$800,000,000.
Clinical trial costs: lognormal with mean of $150,000,000 and standard deviation
$30,000,000. Annual market growth factor: triangular with minimum = 2%,
maximum = 6%, and most likely = 3%.
Annual market share growth rate: triangular with minimum = 15%, maximum =
25%, and most likely = 20%.
The number of trials per simulation is equal to 10,000 at a Sim. Random Seed of 2. Run
the simulation and answer the following questions using the Risk Solver Platform.
What cumulative profit in the fifth year is likely to be realized with a probability of
0.50?

A) $78,244,098
B) $101,970,955
C) $144,058,696
D) $203,676,827