

When dividing a population into subgroups so that a random sample from each
subgroup can be collected, what type of sampling is used?
A. Simple random sampling
B. Systematic sampling
C. Stratified random sampling
D. Cluster sampling
Management is considering a bonus system to increase production. One suggestion is to
pay a bonus on the highest 5% of production based on past experience. Past records
indicate that an average of 4,000 units of a small assembly is produced during a week.
The distribution of the weekly production is approximately normally distributed with a
standard deviation of 60 units. If the bonus is paid on the upper 5% of production, the
bonus will be paid on how many units or more?
A. 6255
B. 5120
C. 3196
D. 4099
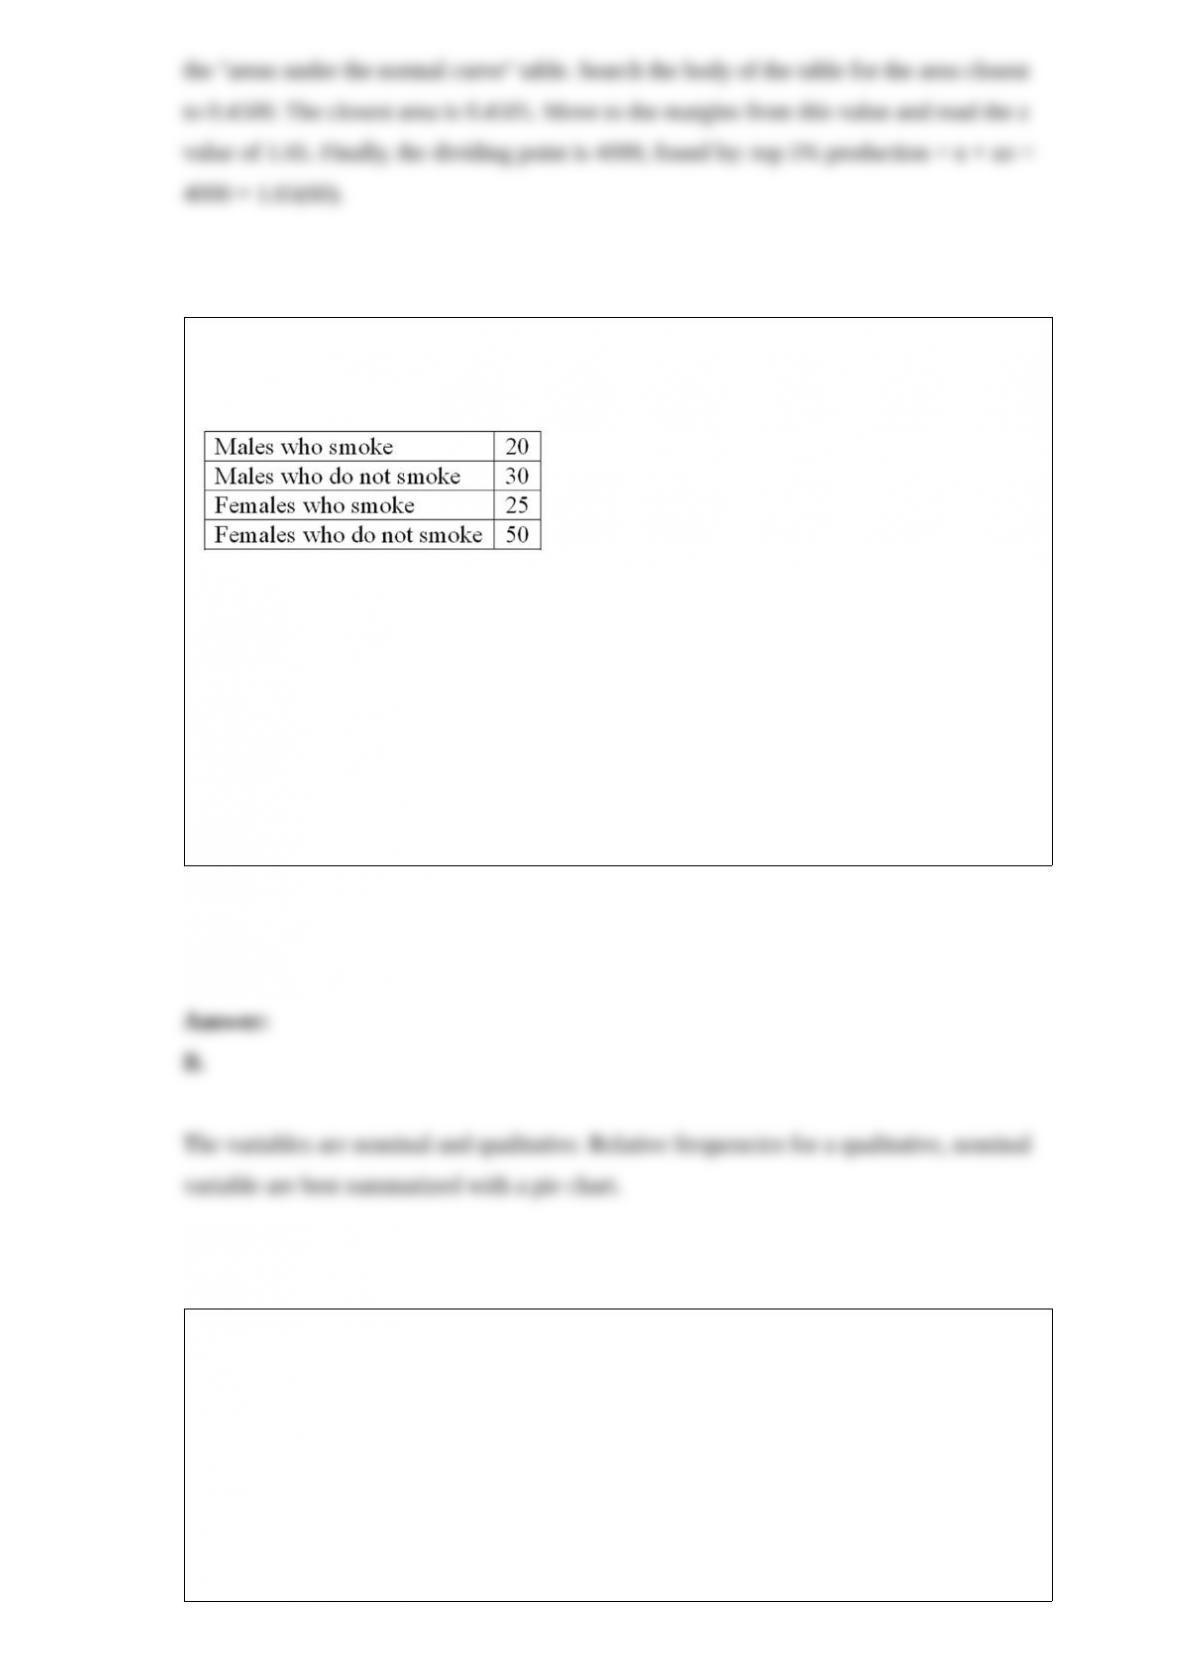
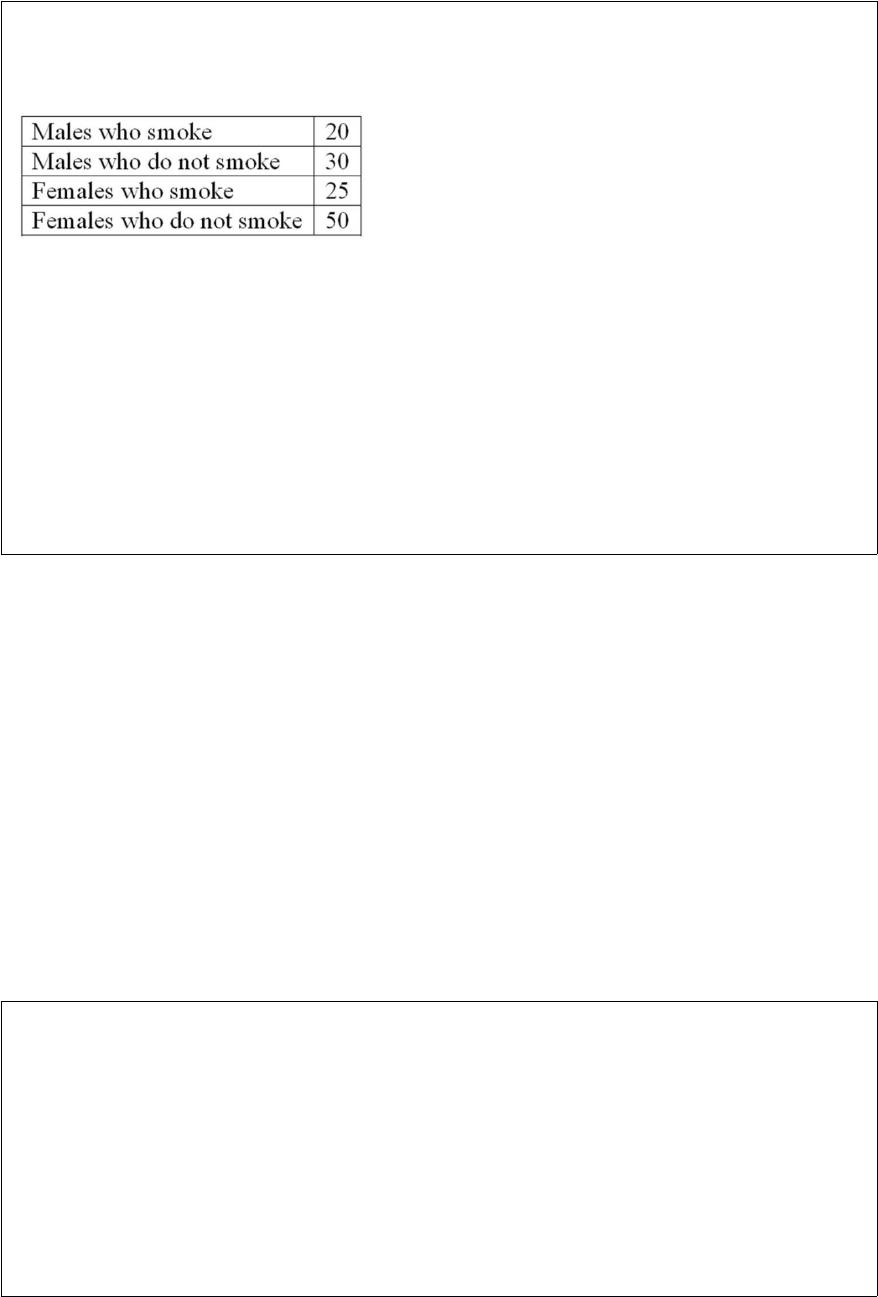
A student was interested in the cigarette smoking habits of college students and
collected data from an unbiased random sample of students. The data is summarized in
the following table:
What type of chart best represents relative class frequencies?
A. Box plot
B. Pie chart
C. Scatter plot
D. Frequency polygon
In a management trainee program, 80% of the trainees are female, 20% male. A total of
90% of the females attended college, while 78% of the males attended college. A
management trainee is selected at random. What is the probability that the person
selected is a male who did NOT attend college?
A. P (male) P (did not attend college | male)
B. P (did not attend college) P (male | did not attend college)

C. P (male) P (did not attend college)
D. P (did not attend college)
A store asks shoppers for their zip code to identify market areas. Zip codes are an
example of ratio data.
Six basic colors are used in decorating a new condominium. They are applied to a unit
in groups of four colors. One unit might have gold as the principal color, blue as a
complementary color, red as the accent color, and touches of white. Another unit might
have blue as the principal color, white as the complementary color, gold as the accent
color, and touches of red. If repetitions are permitted, how many different units can be
decorated?
A. 7,825
B. 25

C. 125
D. 1,296
Which of the following is a point estimate for the population mean ()?
A. σ
B. x/n
C.
D. s
An experiment involves selecting a random sample of 256 middle managers for study.
One item of interest is their annual income. The sample mean is computed to be
$35,420, and the sample standard deviation is $2,050. What is the sample standard error
of the mean?
A. $128.125
B. $138.36


C. $2,050
D. $8.01
What does the complement rule state?
A. P(A) = P(A) – P(B)
B. P(A) = 1 – P(not A)
C. P(A) = P(A) P(B)
D. P(A) = P(A)X + P(B)
A normally distributed random variable has _________.
A. Any value between -∞ and + ∞.
B. Discrete values.
C. Any value between specified minimum and maximum values.

D. Only two values, success and failure.
For a binomial distribution, the mean is 0.6 and n = 2. What is π for this distribution?
A. 0.5
B. 1.00
C. 0.3
D. 0.1
The chi-square statistic _______________.
A. Is greater than or equal to zero
B. Is less than or equal to zero
C. Can be any value
D. Is equal to zero

In a distribution, the second quartile corresponds with the __________.
A. Mean
B. Median
C. Mode
D. Variance
Monthly commissions of first-year insurance brokers are $1,270, $1,310, $1,680,
$1,380, $1,410, $1,570, $1,180 and $1,420. These figures are referred to as a(n)
__________.
A. Histogram
B. Raw data
C. Frequency distribution
D. Frequency polygon

What statement do we make that determines if the null hypothesis is rejected?
A. Decision rule
B. Test statistic
C. Alternate hypothesis
D. Critical value
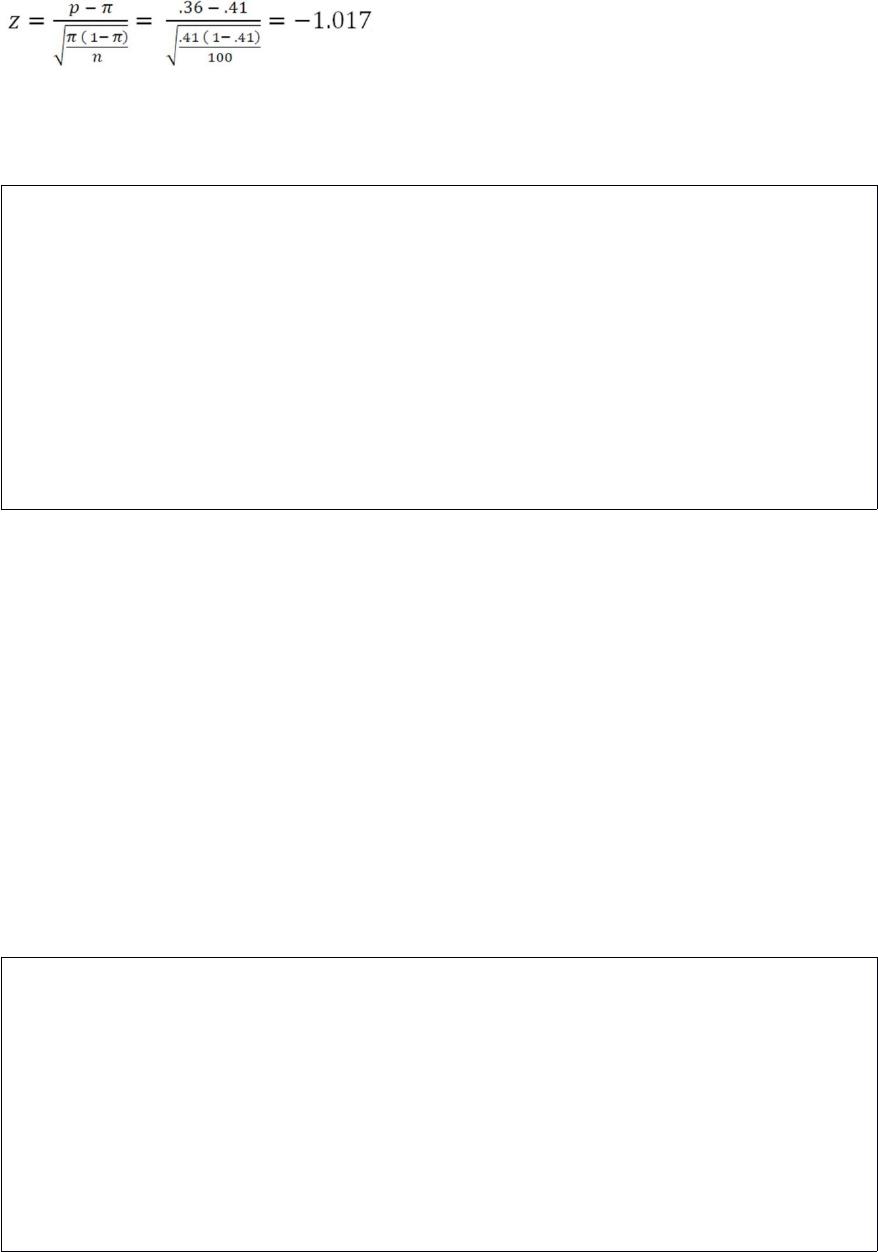
Based on the Nielsen ratings, the local CBS affiliate claims its 11 p.m. newscast reaches
41% of the viewing audience in the area. In a survey of 100 viewers, 36% indicated that
they watch the late evening news on this local CBS station. What is the z test statistic?
A. 1.02
B. 1.22
C. -1.02
D. -1.22

In an ANOVA table for a multiple regression analysis, total variation is separated into
_________.
A. Treatment and error variation
B. Regression and residual variation
C. Treatment and block variation
D. Block and error variation
The sample proportion is defined as _________.
A. nπ
B. x/n
C. n!
D. π
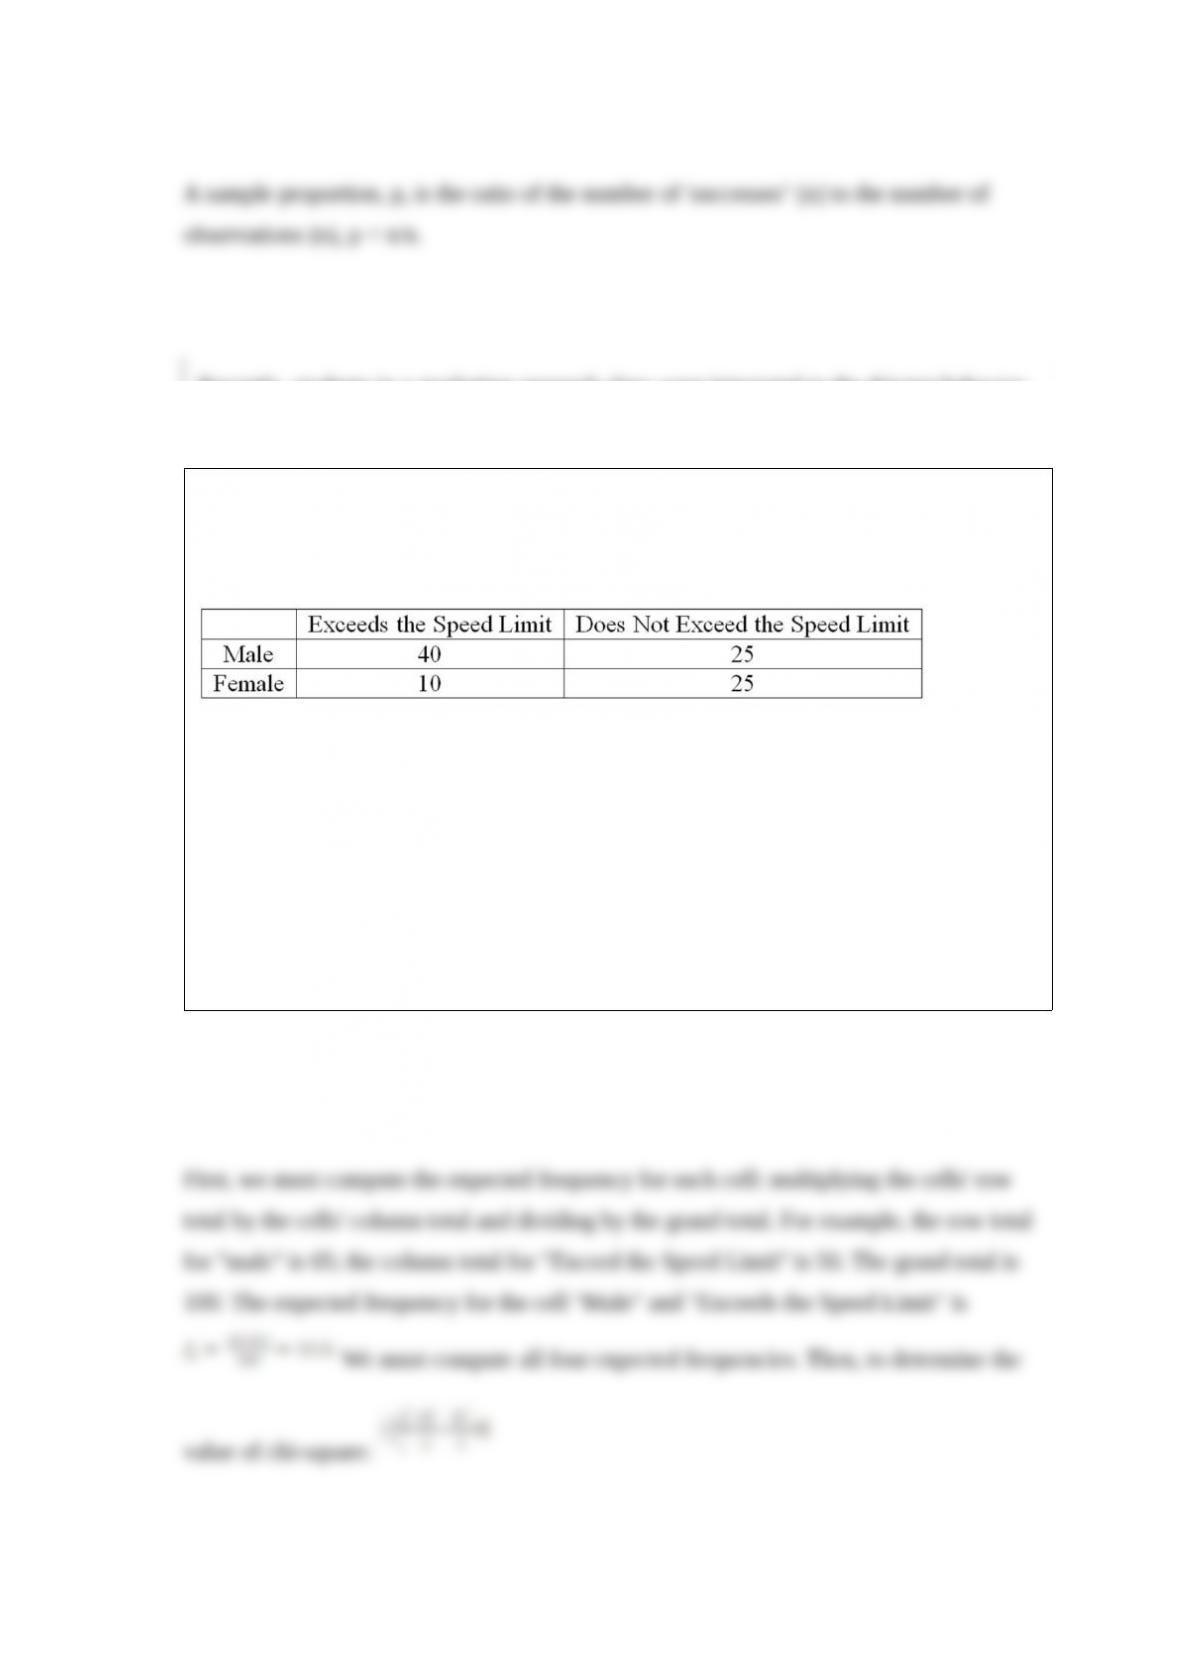
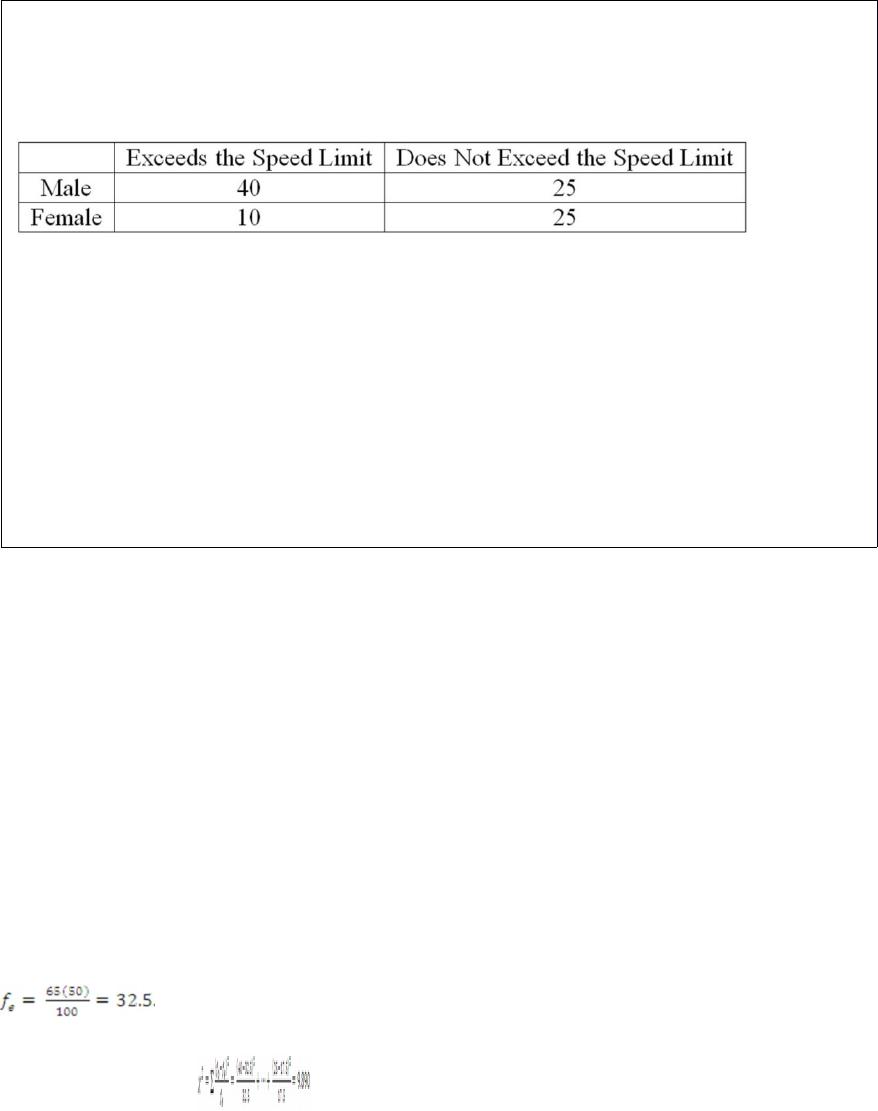
Recently, students in a marketing research class were interested in the driving behavior
of students. Specifically, the marketing students were interested in finding out if
exceeding the speed limit was related to social activity. They collected the following
responses from 100 randomly selected students:
What is the value of the test statistic?
A. 83.67
B. 9.890
C. 50
D. 4.94

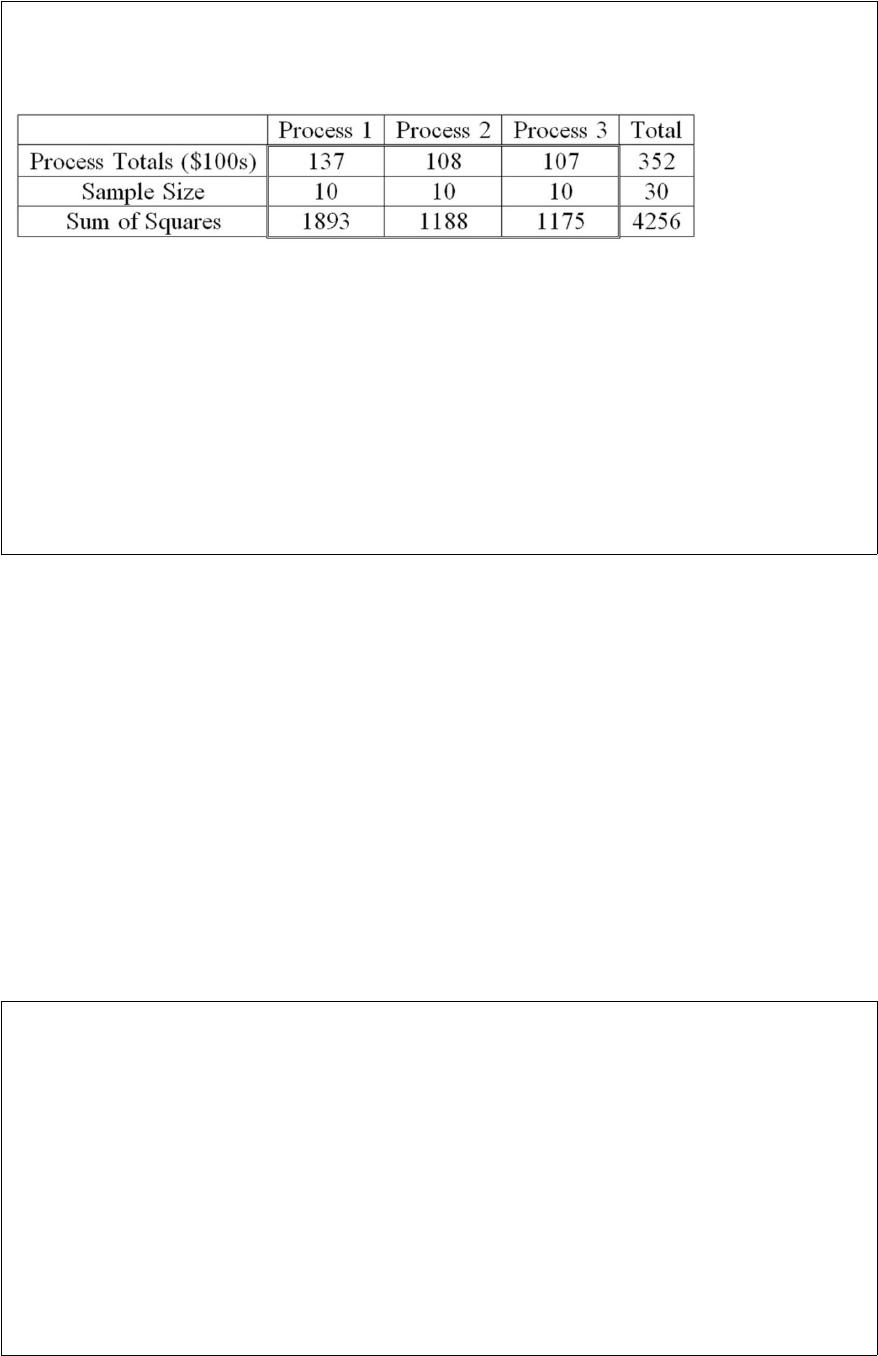
A manufacturer of automobile transmissions uses three different processes.
Management ordered a study of the production costs to see if there is a difference
among the three processes. A summary of the findings is shown next.
In an ANOVA table, what are the total degrees of freedom?
A. 27
B. 28
C. 29
D. 30
A frequency distribution has a mean of 100 and a standard deviation of 20. The class
limits for one class are 50 up to 60. Based on the normal distribution, what is the
probability that an observation would be in this class?
A. 0.4938
B. 0.4772
C. 0.0166
D. -0.0166

If the coefficient of multiple determination is 0.81, what percent of variation is not
explained?
A. 19%
B. 90%
C. 66%
D. 81%
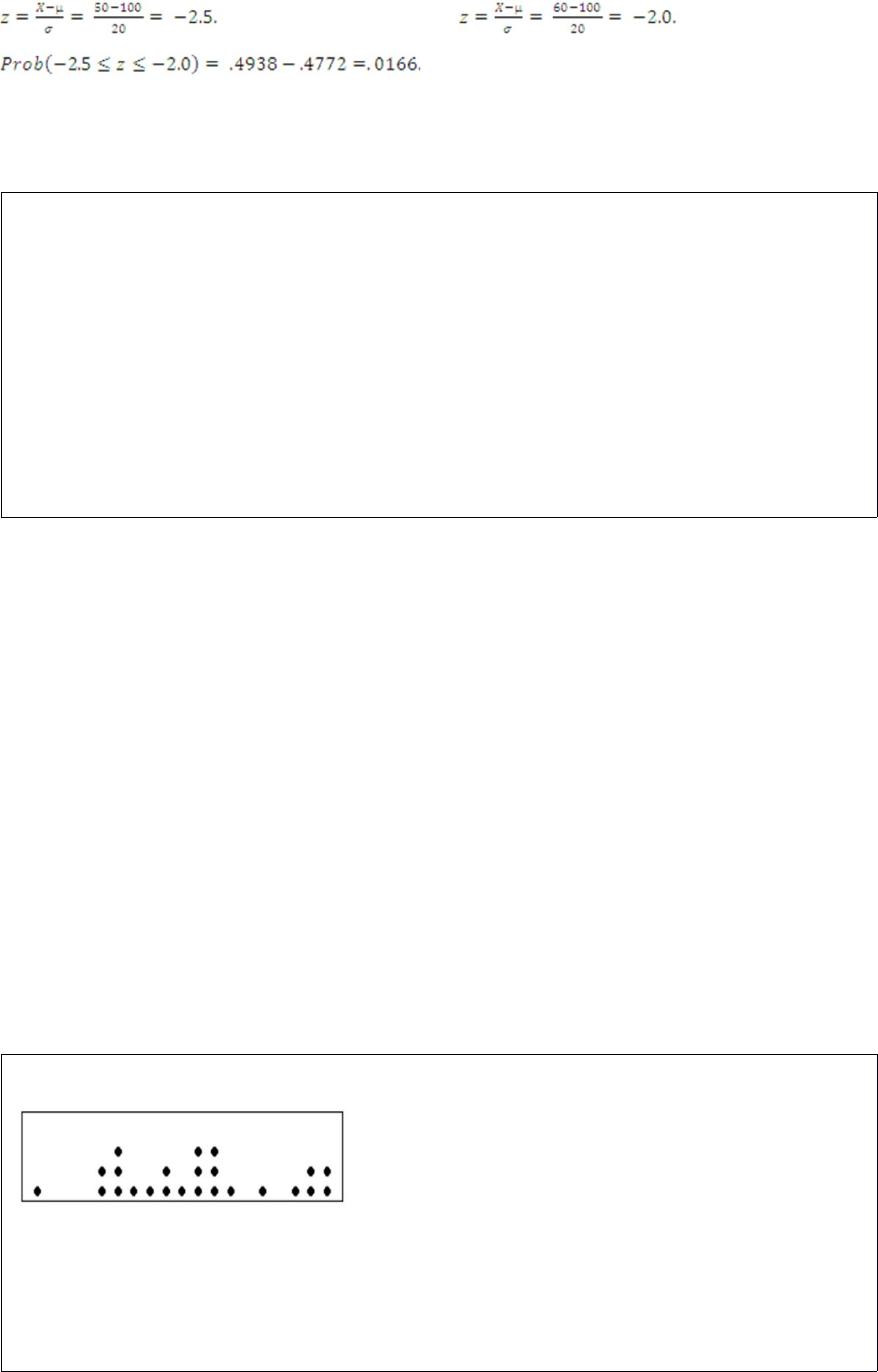
The following graph is a ____________.
A. Dot plot
B. Stem-and-leaf diagram


C. Box plot
D. Contingency table
In an ANOVA table, for a multiple regression analysis, the variation of the dependent
variable explained by the variation of the independent variables is represented by
___________.
A. The regression sum of squares
B. The total sum of squares
C. The residual mean square
D. The p-value
Multiple regression analysis is applied when analyzing the relationship between
__________.
A. An independent variable and several dependent variables
B. A dependent variable and several independent variables

C. Several dependent variables and several independent variables
D. Several regression equations and a single sample
The final rankings of the top 20 NCAA college basketball teams are an example of
which level of measurement?
A. Nominal
B. Ordinal
C. Interval
D. Ratio
What is the alternate hypothesis to test the significance of the slope in a regression
equation?
A. H1: β = 0
B. H1: β ≠ 0

C. H1: β ≤ 0
D. H1: β ≥ 0
The total area of a normal probability distribution is _______.
A. Between -3.0 and 3.0
B. 1.00
C. Dependent on a value of “z”
D. Approximated by the binomial distribution
When expressed as a percentage, what is the range of values for multiple R2?
A. -100% to +100% inclusive
B. -100% to 0% inclusive

C. 0% to +100% inclusive
D. Unlimited range
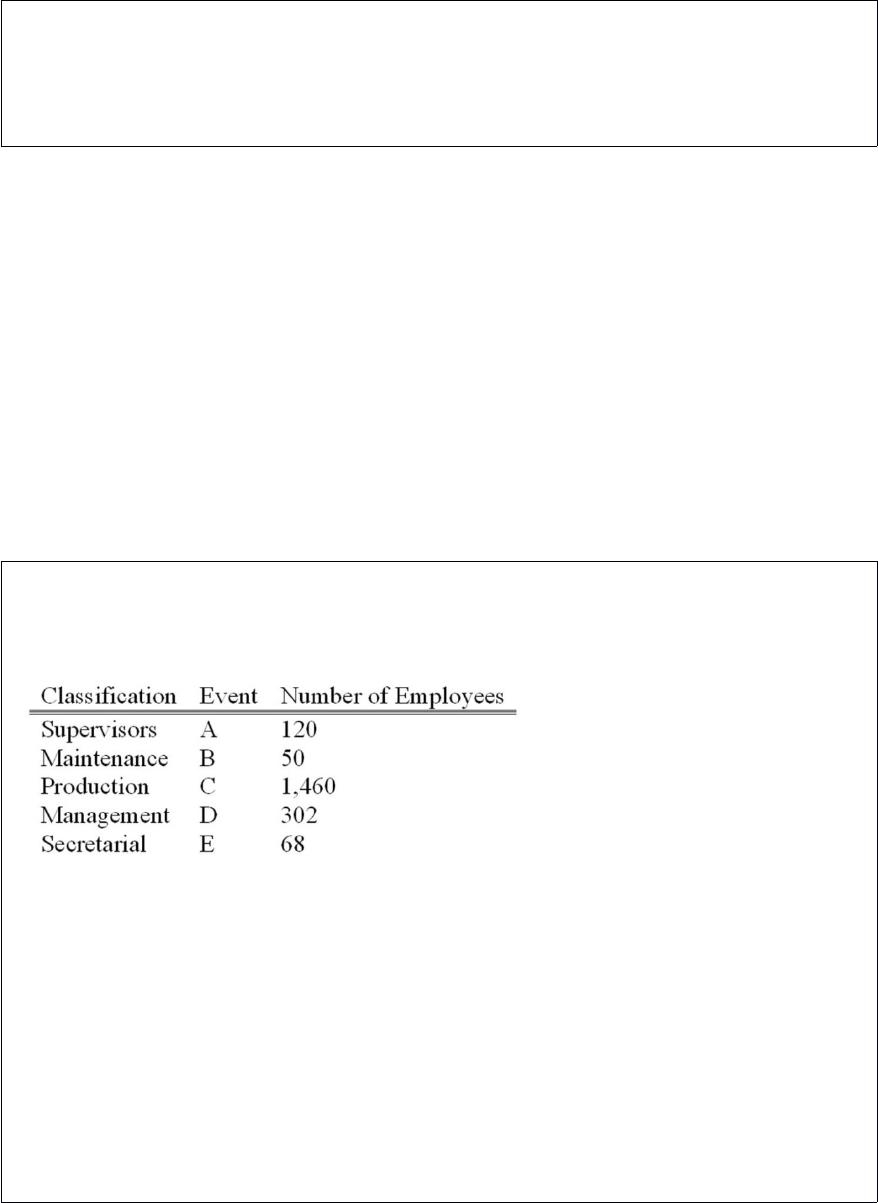
A group of employees of Unique Services will be surveyed about a new pension plan.
In-depth interviews with each employee selected in the sample will be conducted. The
employees are classified as follows.
What is the probability that the first person selected is either in maintenance or in
secretarial?
A. 0.200
B. 0.015
C. 0.059
D. 0.001


Which one of the following is referred to as the population mean?
A. µ
B. s
C. σ
D. χ
Among 200 people surveyed, 66 people or 0.33% preferred the product. 0.33% is called
the _______________.
The pooled estimate of the proportion is found by dividing the total number of
successes by ___________________________.
Select a value for the correlation coefficient and provide a complete interpretation of
the correlation coefficient using your selected value.
How are residual plots drawn and used to evaluate the assumptions of linear multiple
regression?
For the following data, what relationship is shown in the graph?
The _____________ unit of measurement is used to express the coefficient of
skewness.
A company wants to estimate next year’s total revenue. Why is an interval estimate
preferred to a point estimate?


Sampling from a population may be preferred because, contacting or listing the entire
population would be too ___________ consuming.
The interval within which a population parameter is expected to lie is called a
__________.
A _____ chart is useful for displaying a frequency distribution for a nominal variable.


For the standard normal distribution, the z-score that corresponds with the first quartile
is ________.
In a binomial experiment, the probability of a _________ remains constant.
A company is researching the effectiveness of a new website design to decrease the
time to access a website. Five website users were randomly selected and their times (in
seconds) to access the website with the old and new designs were recorded. The results
follow.

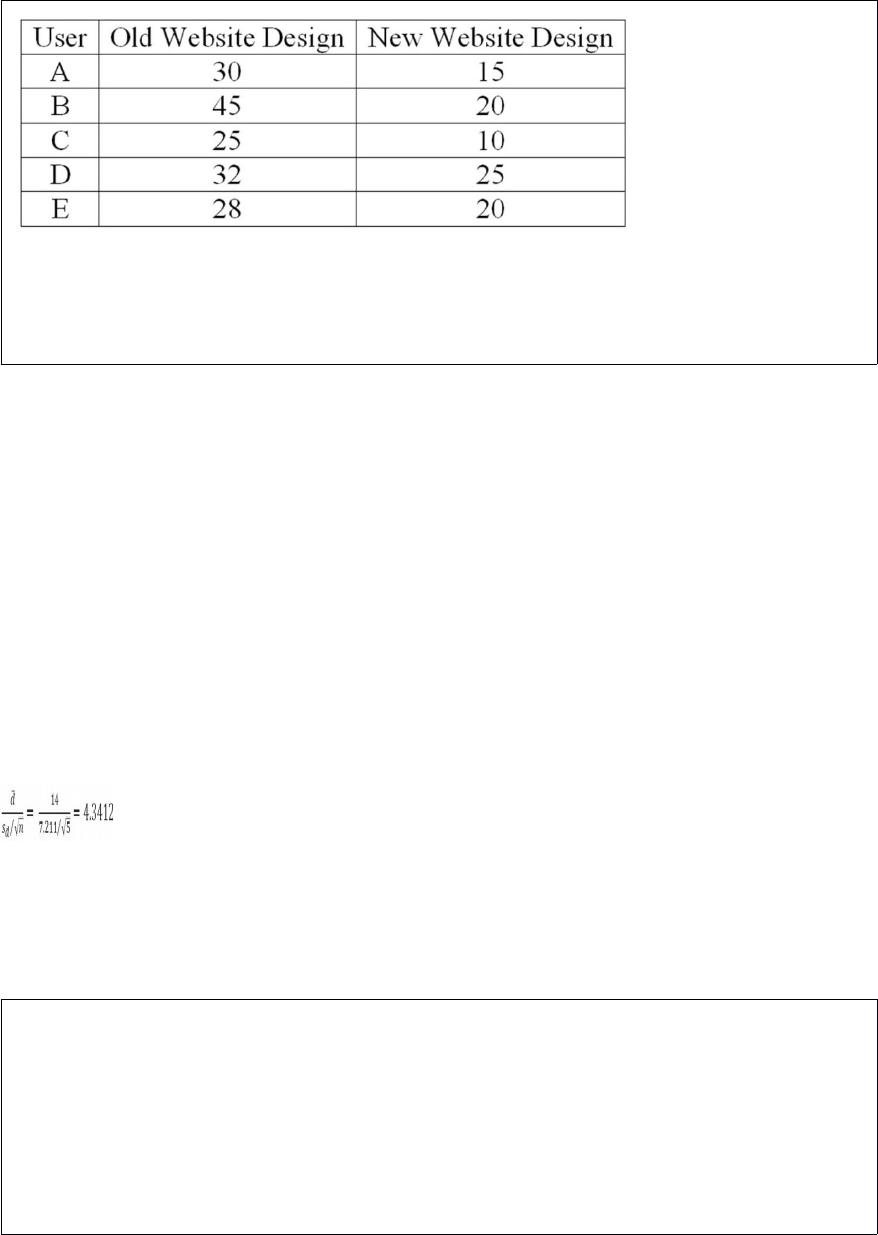
Let α = 0.05. Is the mean time to access the new website design shorter, or is (time for
the old design – time for the new design) greater than zero? Express your answer in
terms of the null hypothesis.
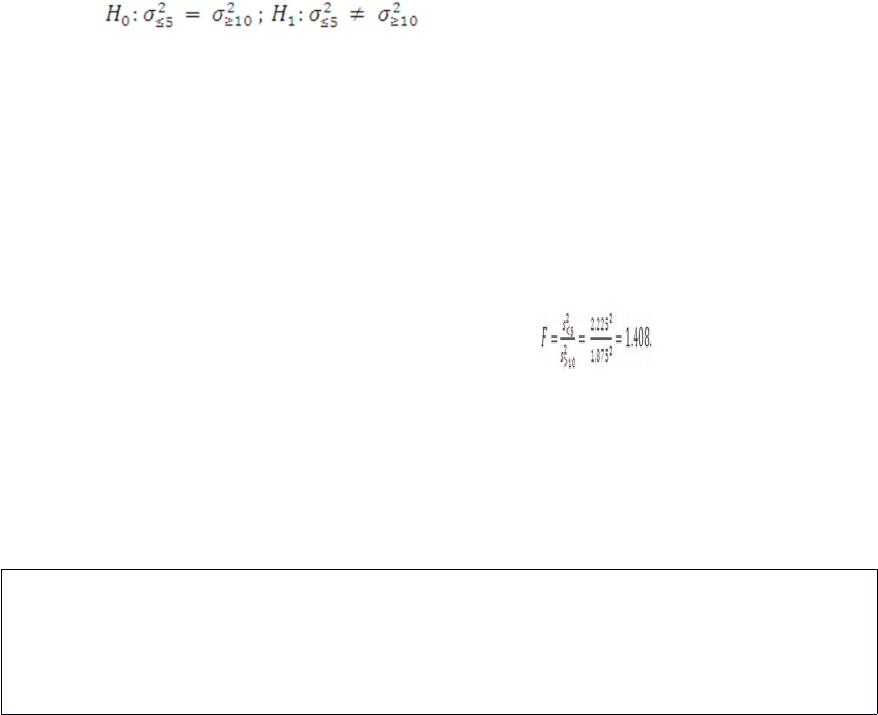
A company compared the variance of salaries for employees who have been employed
for 5 years or less with employees who have been employed for 10 years or more. They
randomly selected 21 employees with 5 years or less experience and 15 employees with
10 years or more experience. The standard deviation for the group with 5 years or less
experience was $2,225; the standard deviation for the group with 10 years or more
experience was $1,875. Using the 0.05 significance level, what is the decision regarding
the null hypothesis?
A population consists of the following five values: 3, 8, 11, 13, and 16. From this
population, there are 10 different samples of size 3. The means of the 10 samples of size
3 are 7.33, 8, 9, 9, 10, 10.67, 10.67, 11.67, 12.33, and 13.33. Compare the dispersion in
the population with that of the sample means.