
Assume that a Kruskal-Wallis test is being conducted to determine whether or not the
medians of three populations are equal. The sum of rankings and the sample size for
each group are below.
The value of the test statistic is H = 0.68
Sampling error is the difference between a statistic computed from a sample and the
corresponding parameter computed from the population.
In a two-tailed hypothesis test involving two population variances, if the null hypothesis
is true then the F-test statistic should be approximately equal to 1.0.

Each week American Stores receives a shipment from a supplier. The contract specifies
that the maximum allowable percent defective is 5 percent. When the shipment arrives,
a sample of 20 parts is randomly selected. If 2 or more of the sampled parts are
defective, the shipment is rejected and returned to the supplier. Assume that a shipment
arrives that actually has 4 percent defective parts and the distribution of defective parts
is described by a binomial distribution. The probability that the shipment is rejected is
approximately 0.19.
Where there are two independent variables in a multiple regression, the regression
equation forms a plane.
On a scatter diagram, the independent variable should be placed on the horizontal axis
and the dependent variable should be placed on the vertical axis.
The variance inflation factor is an indication of how much multicollinearity there is in

the regression model.
In a one-way analysis of variance test, the following null and alternative hypotheses are
appropriate:
H0 : μ1 = μ2 = μ3
Hα : μ1 ≠ μ2 ≠ μ3
In conducting the Wilcoxon Matched-Pairs Signed Rank test, the difference between
each pair of values must be found prior to conducting any ranking.
Histograms cannot have gaps between the bars, whereas bar charts can have gaps.

The null and alternate hypotheses must be opposites of each other.
A recent study involving a sample of 3,000 vehicles in California showed the following
statistics related to the number of miles driven per day: Q1 = 12, Q2 = 45, and Q3 = 56.
Based on these data, we know that the distribution is skewed.
Contingency analysis can be used when the level of data measurement is nominal or
ordinal.

When the correlation coefficient for the two variables was -0.23, it implies that the two
variables are not correlated because the correlation coefficient cannot be negative.
If an analyst computes statistics from a sample, the sample is by definition a statistical
sample.
A warehouse contains 5 parts made by the Stafford Company and 8 parts made by the
Wilson Company. If an employee selects 3 of the parts from the warehouse at random,
the probability that all 3 parts are from the Wilson Company is approximately .1958.
The statistical process control (SPC) chart is one of the most important tools for
identifying important issues to improve quality.

A multiple regression model of the form = B0 + B1x + B2x2 + B3x3 + ε is called an
expanded second-order polynomial since it contains all the terms up to x3 in the model
at one time.
In a chi-square contingency test, the number of degrees of freedom is equal to the
number of cells minus 1.
Two separate frequency distributions for two variables provide the same information as
one joint frequency distribution involving the same two variables.

A cell phone company believes that 90 percent of its customers are satisfied with their
service. They survey n = 30 customers. Based on this, it is acceptable to assume the
sample distribution is normally distributed.
During the past week, of the 250 customers at the Dairy Queen who ordered a Blizzard,
50 ordered strawberry. This means that of the next five Blizzard customers, exactly one
will order strawberry.
The director of the city Park and Recreation Department claims that the mean distance
people travel to the city’s greenbelt is more than 5.0 miles. Assuming that the
population standard deviation is known to be 1.2 miles and the significance level to be
used to test the hypothesis is 0.05 when a sample size of n = 64 people are surveyed, the
probability of a Type II error is approximately .4545 when the “true” population mean is
5.5 miles.

If a state agency wishes to conduct on-site surveys of small businesses throughout the
state, cluster sampling could potentially be used to reduce the geographical area over
which the surveys would need to be conducted.
All of the factors that are needed to determine the required sample size are within the
control of the decision maker.
In Excel a joint frequency distribution table can be created using a tool called
PivotTable.

You are given the following linear trend model: Ft = 345.60 – 200.5(t). This model
implies that in year 1, the dependent variable had a value of 145.1.
The owners of Greg’s Department Store have reason to believe that one of their
employees has been stealing from the store. In an interview with the police, the owner
says that she is 75 percent sure that the employee is stealing. This probability is an
example of one that was assessed using classical probability.
The concept of margin of error applies directly when estimating a population mean, but
is not appropriate when estimating a population proportion.
The Gilbert Company chief financial officer has been tracking annual sales for each of
the company’s three divisions for the past 10 years. At a recent meeting, he pointed to
the annual data and indicated that it clearly showed the seasonality associated with its
business. Given the data, this statement may have been very appropriate.
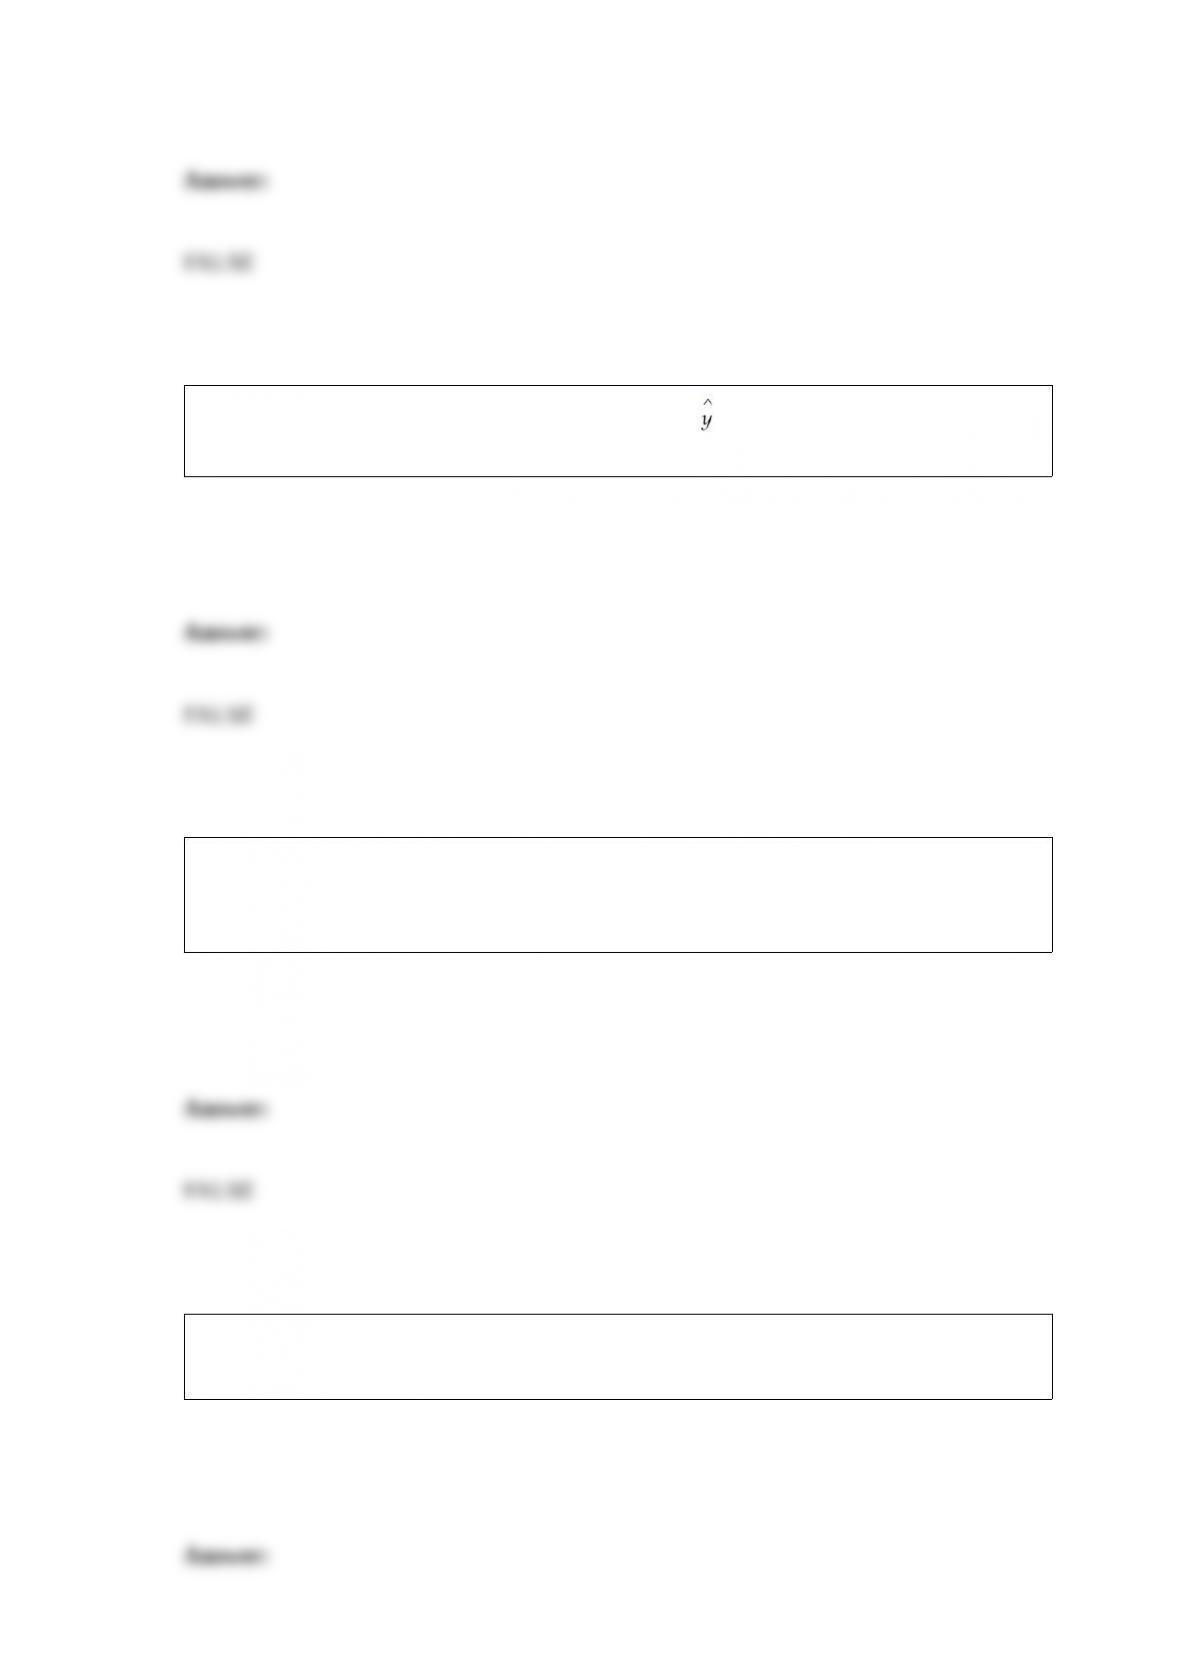
Assume that we have found a regression equation of = 3.6 – 2.4x, and that the
coefficient of determination is 0.72, then the correlation of x and y must be about 0.849.
The Ace Construction Company has entered into a contract to widen a street in Boston.
The possible payoffs for this project have been determined by management. The
probabilities for these payoffs could be determined using a binomial distribution.
In Excel, joint frequency distributions can be generated using the Pivot Table feature
under the Data tab.

A publisher is interested in estimating the proportion of textbooks that students resell at
the end of the semester. He is interested in making this estimate using a confidence
level of 95 percent and a margin of error of 0.02. Based upon his prior experience, he
believes that π is somewhere around 0.60. Given this information, the required sample
size is over 2,300 students.
A random sample of 100 people was selected from a population of customers at a local
bank. The mean age of these customers was 40. If the population standard deviation is
thought to be 5 years, the margin of error for a 95 percent confidence interval estimate
is .98 year.
The interquartile range contains the middle 50 percent of a data set.

Suppose that two population proportions are being compared to test whether there is
any difference between them. Assume that the test statistic has been calculated to be z =
2.21. Find the p-value for this situation.
A) p-value = 0.0136
B) p-value = 0.4864
C) p-value = 0.0272
D) p-value = 0.9728
If a residual plot exhibits a curved pattern in the residuals, this means that:
A) the errors are not normally distributed.
B) there must be a curvilinear relation between x and y.
C) there is no significant relation between x and y.
D) there is a problem with constant variance.
A manager wishes to estimate a population mean using a 95% confidence interval
estimate that has a margin of error of 44.0. If the population standard deviation is
thought to be 680, what is the required sample size?
A) 1215
B) 871
C) 1050
D) 918
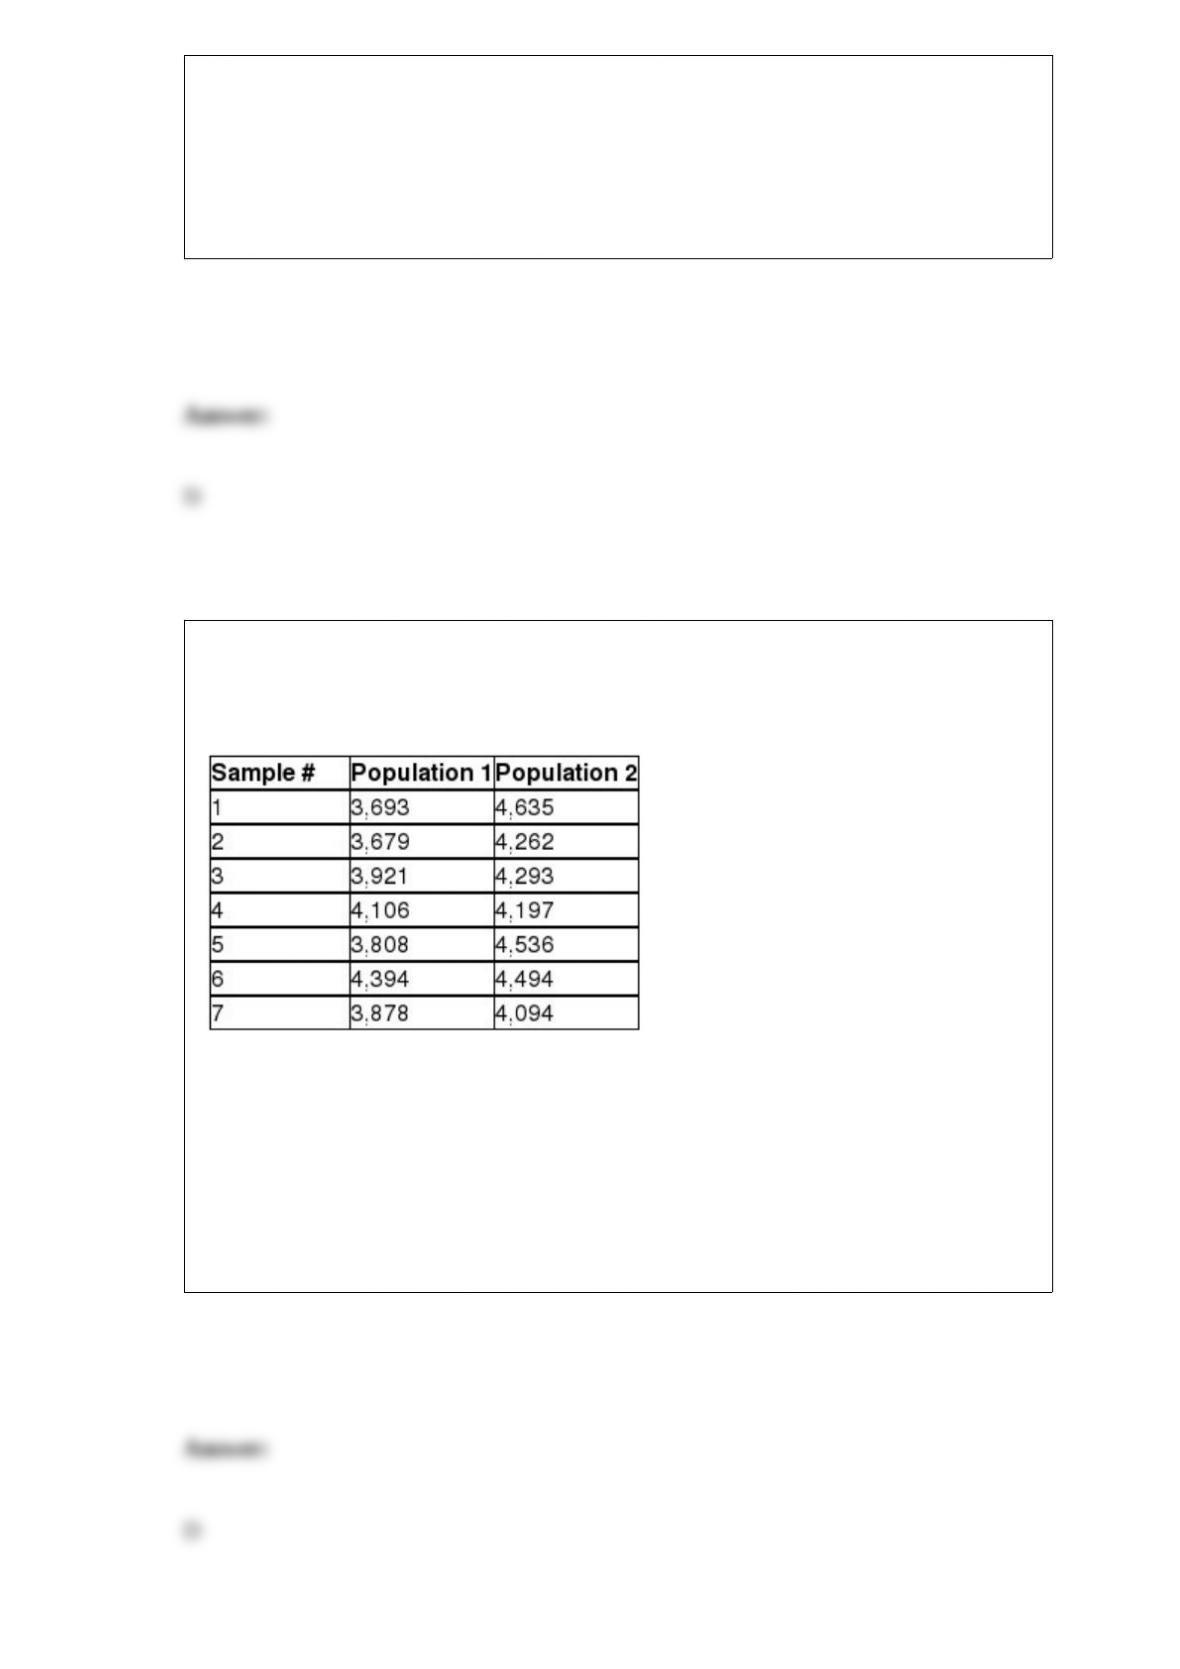
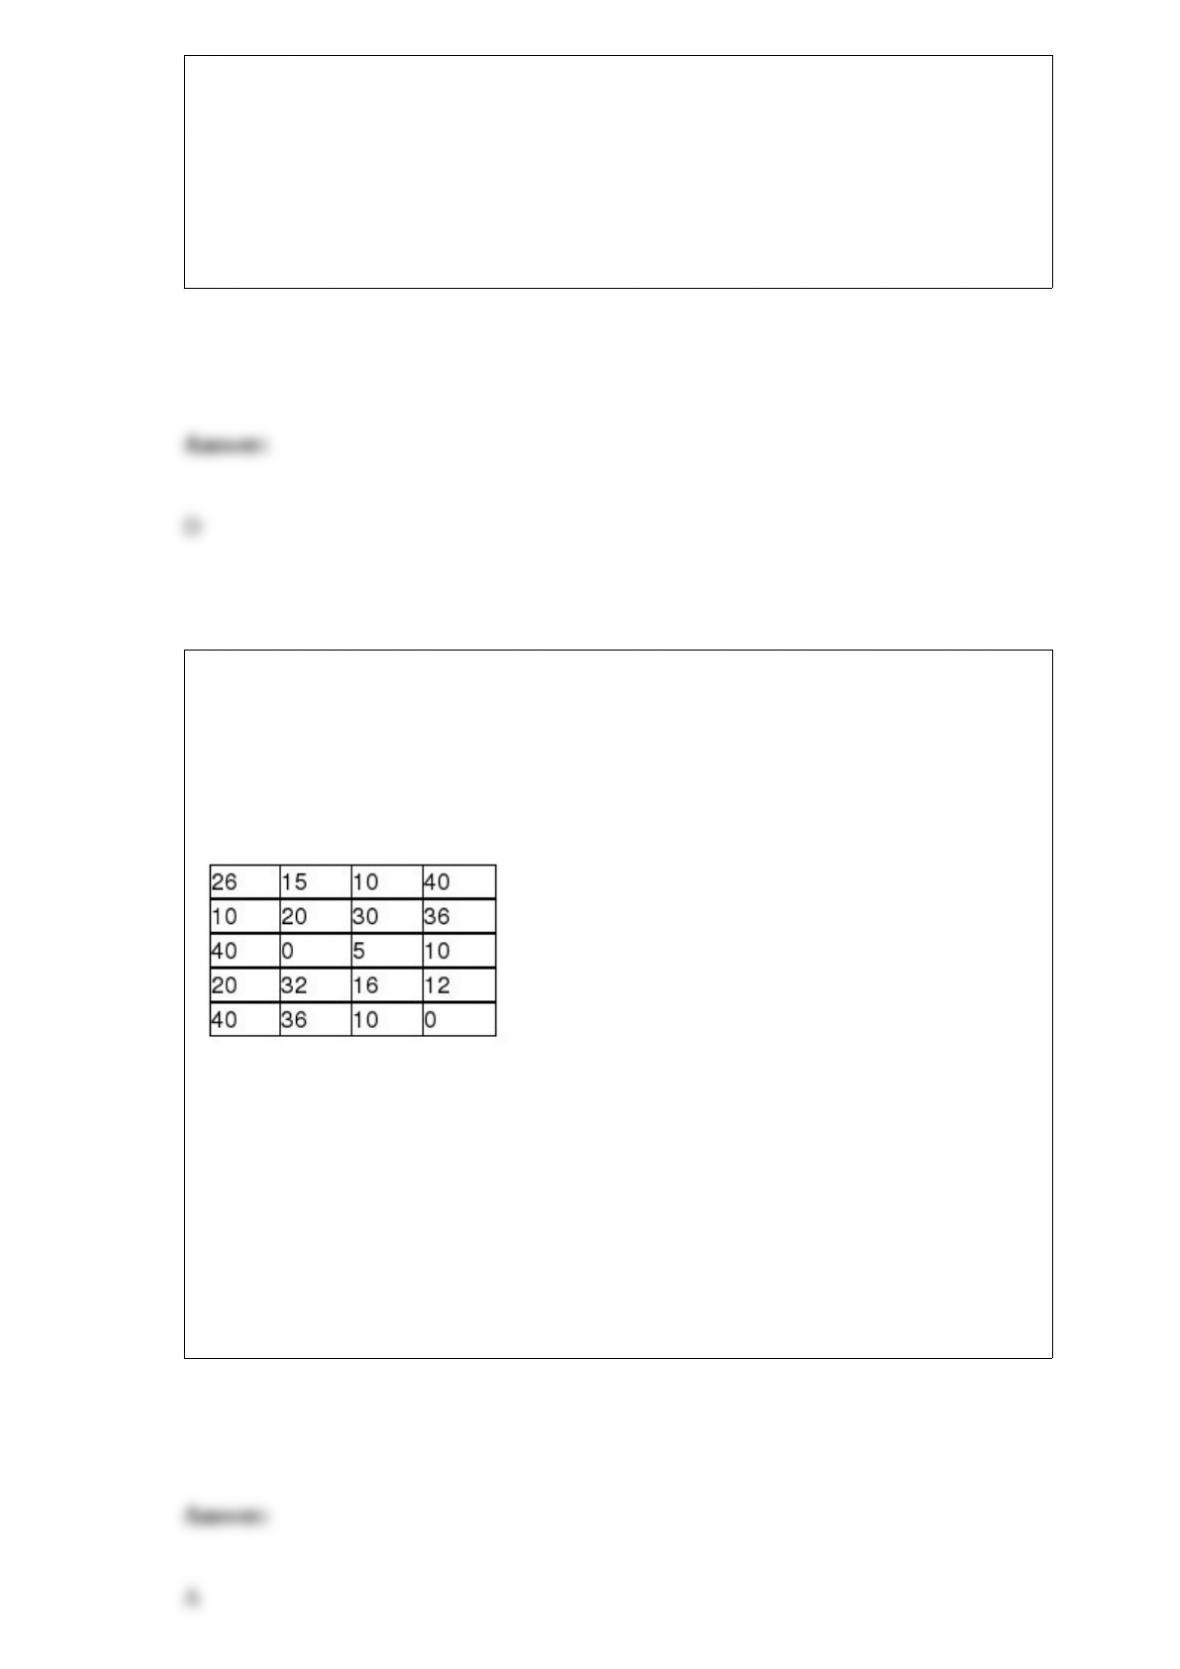
The following paired samples have been obtained from normally distributed
populations. Construct a 90% confidence interval estimate for the mean paired
difference between the two population means.
A) -571.92 ≤ μ ≤ -172.51
B) -487.41 ≤ μ ≤ -283.89
C) -812.21 ≤ μ ≤ -72.61
D) -674.41 ≤ μ ≤ -191.87
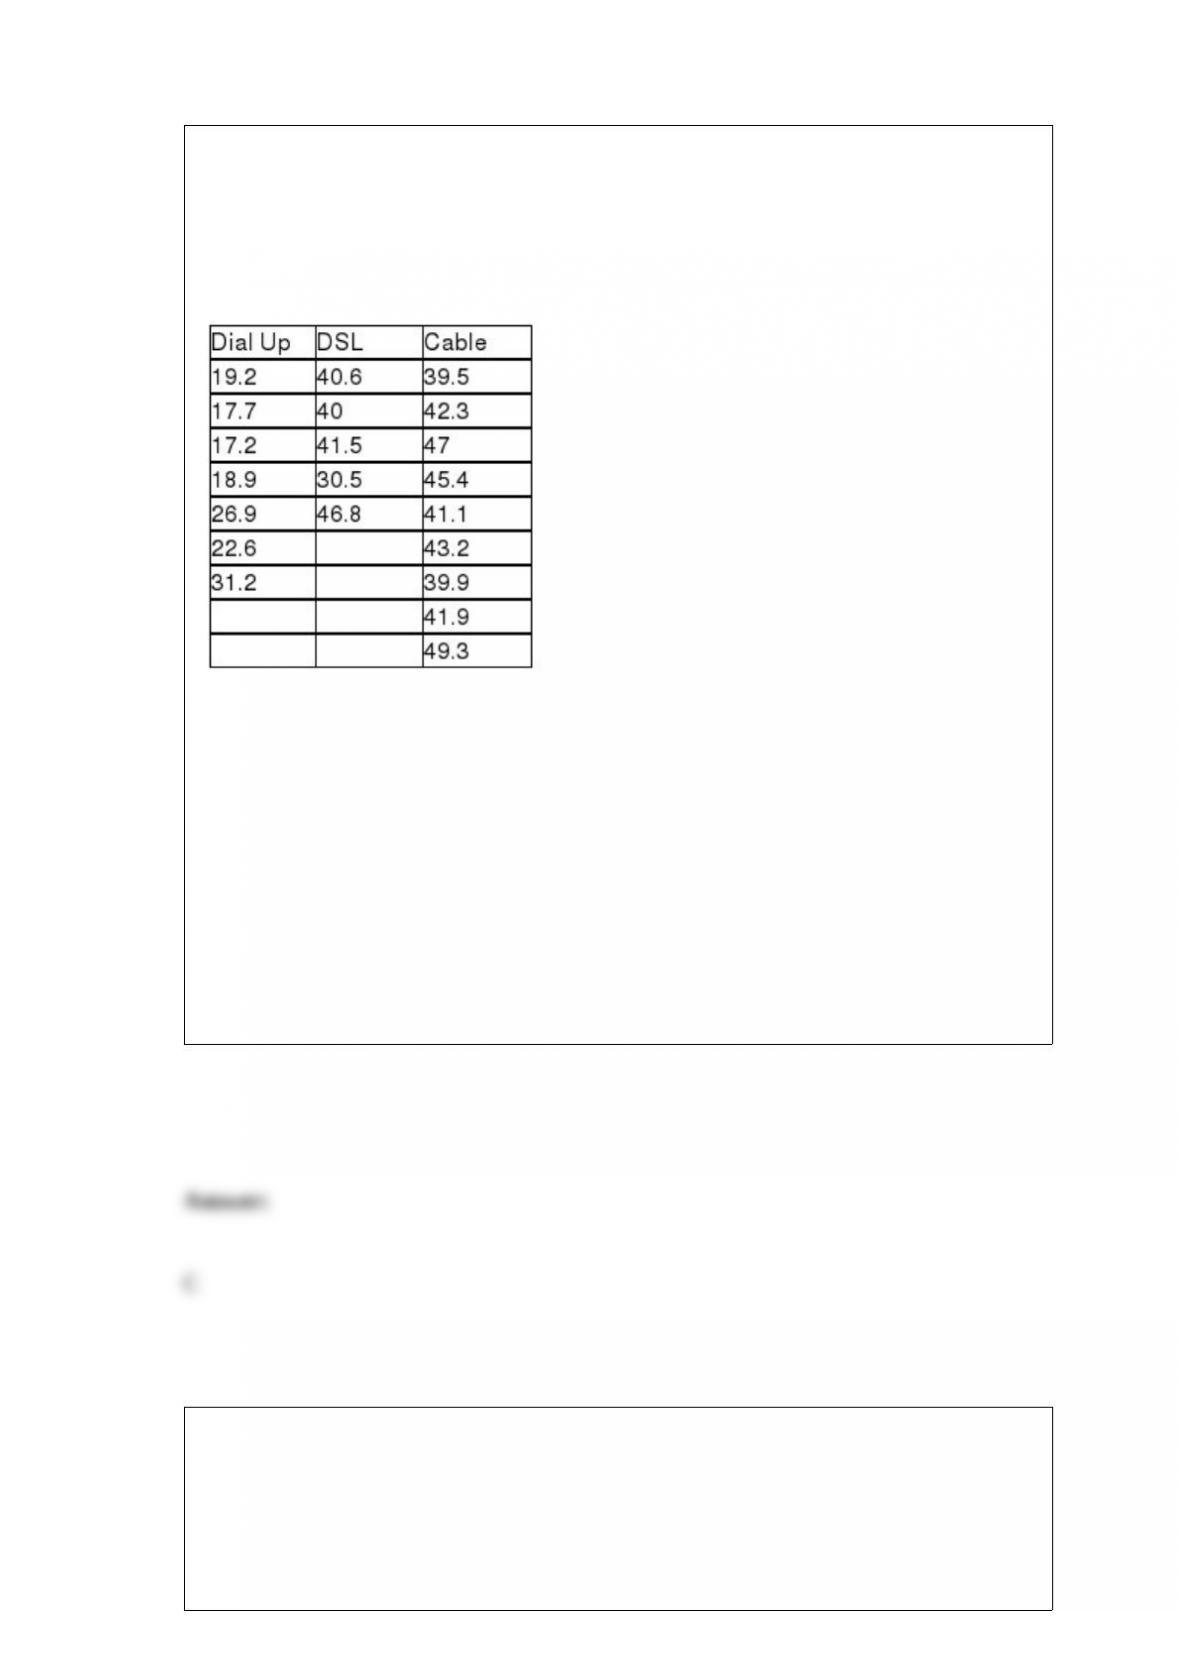
An Internet service provider is interested in testing to see if there is a difference in the
mean weekly connect time for users who come into the service through a dial-up line,
DSL, or cable Internet. To test this, the ISP has selected random samples from each
category of user and recorded the connect time during a week period. The following
data were collected:
Which of the following would be the correct alternative hypotheses for the test to be
conducted?
A) H0 : μ1 = μ2 = μ3
B) H0 : μ1 ≠ μ2 ≠μ3
C) Not all population means are equal.
D) σ1 = σ2 = σ3 = σ4
The manager of a computer help desk operation has collected enough data to conclude
that the distribution of time per call is normally distributed with a mean equal to 8.21
minutes and a standard deviation of 2.14 minutes. The manager has decided to have a
signal system attached to the phone so that after a certain period of time, a sound will
occur on her employees’ phone if she exceeds the time limit. The manager wants to set
the time limit at a level such that it will sound on only 8 percent of all calls. The time

limit should be:
A) 10.35 minutes.
B) approximately 5.19 minutes.
C) about 14.58 minutes.
D) about 11.23 minutes.
A random sample of 340 people in Chicago showed that 66 listened to WJKT-1450, a
radio station in South Chicago Heights. Based on this information, what is the upper
limit for the 95 percent confidence interval estimate for the proportion of people in
Chicago that listen to WJKT-1450?
A) 1.96
B) Approximately 0.0009
C) About 0.2361
D) About 0.2298
If a decision maker wishes to develop a regression model in which the University Class
Standing is a categorical variable with 5 possible levels of response, then he will need
to include how many dummy variables?

A) 5
B) 4
C) 1
D) 3
A test is conducted to compare three different income tax software packages to
determine whether there is any difference in the average time it takes to prepare income
tax returns using the three different software packages. Ten different person’s income
tax returns are done by each of the three software packages and the time is recorded for
each. Assuming that results show that blocking was effective, this means that:
A) there are significant differences in the average times needed by the 3 different
software packages.
B) there are significant differences in the average times needed for the 10 different
person’s tax returns.
C) the analysis should be redone using a one-way analysis of variance.
D) the randomized complete block was the wrong method to use.
In a local community there are three grocery chain stores. The three have been carrying
out a spirited advertising campaign in which each claims to have the lowest prices. A
local news station recently sent a reporter to the three stores to check prices on several

items. She found that for certain items each store had the lowest price. This survey
didn’t really answer the question for consumers. Thus, the station set up a test in which
20 shoppers were given different lists of grocery items and were sent to each of the
three chain stores. The sales receipts from each of the three stores are recorded in the
data file Groceries.
Based on these sample data, can you conclude the three grocery stores have different
sample means? Test using a significance level of 0.05. Use a p-value approach.
A) Since the p-value of 2.68E – 10 < 0.05 reject H0 and conclude that at least two
means are different.
B) Since the p-value of 2.68E-10 < 0.05 do not reject H0 and conclude that means are
all the same.
C) Since the p-value of 0.027 < 0.05 reject H0 and conclude that at least two means are
different.
D) Since the p-value of 0.027 < 0.05 do not reject H0 and conclude that means are all
the same.
Assuming you have data for a variable with 2,000 values, using the 2k ≥ n guideline,
what is the least number of groups that should be used in developing a grouped data
frequency distribution?
A) 9
B) 11
C) 13
D) 12

For the following hypothesis test:
With n = 80, σ = 9, and = 47.1, state the calculated value of the test statistic z.
A) 3.151
B) -2.141
C) 2.087
D) -3.121
What does the term expected cell frequencies refer to?
A) The frequencies found in the population being examined
B) The frequencies found in the sample being examined
C) The frequencies computed from H0
D) the frequencies computed from H1

When testing for independence in a contingency table with 3 rows and 4 columns, there
are ________ degrees of freedom.
A) 5
B) 6
C) 7
D) 12
A histogram can be created for discrete or continuous data.
Which of the following statements is true in simple linear regression?
A) The standard error of the estimate is equal to the standard error of the slope.
B) The total degrees of freedom are (n-2).
C) The coefficient of determination is equal to the correlation of x and y.
D) The p-value of the F test will equal the p-value of the t-test of the slope.
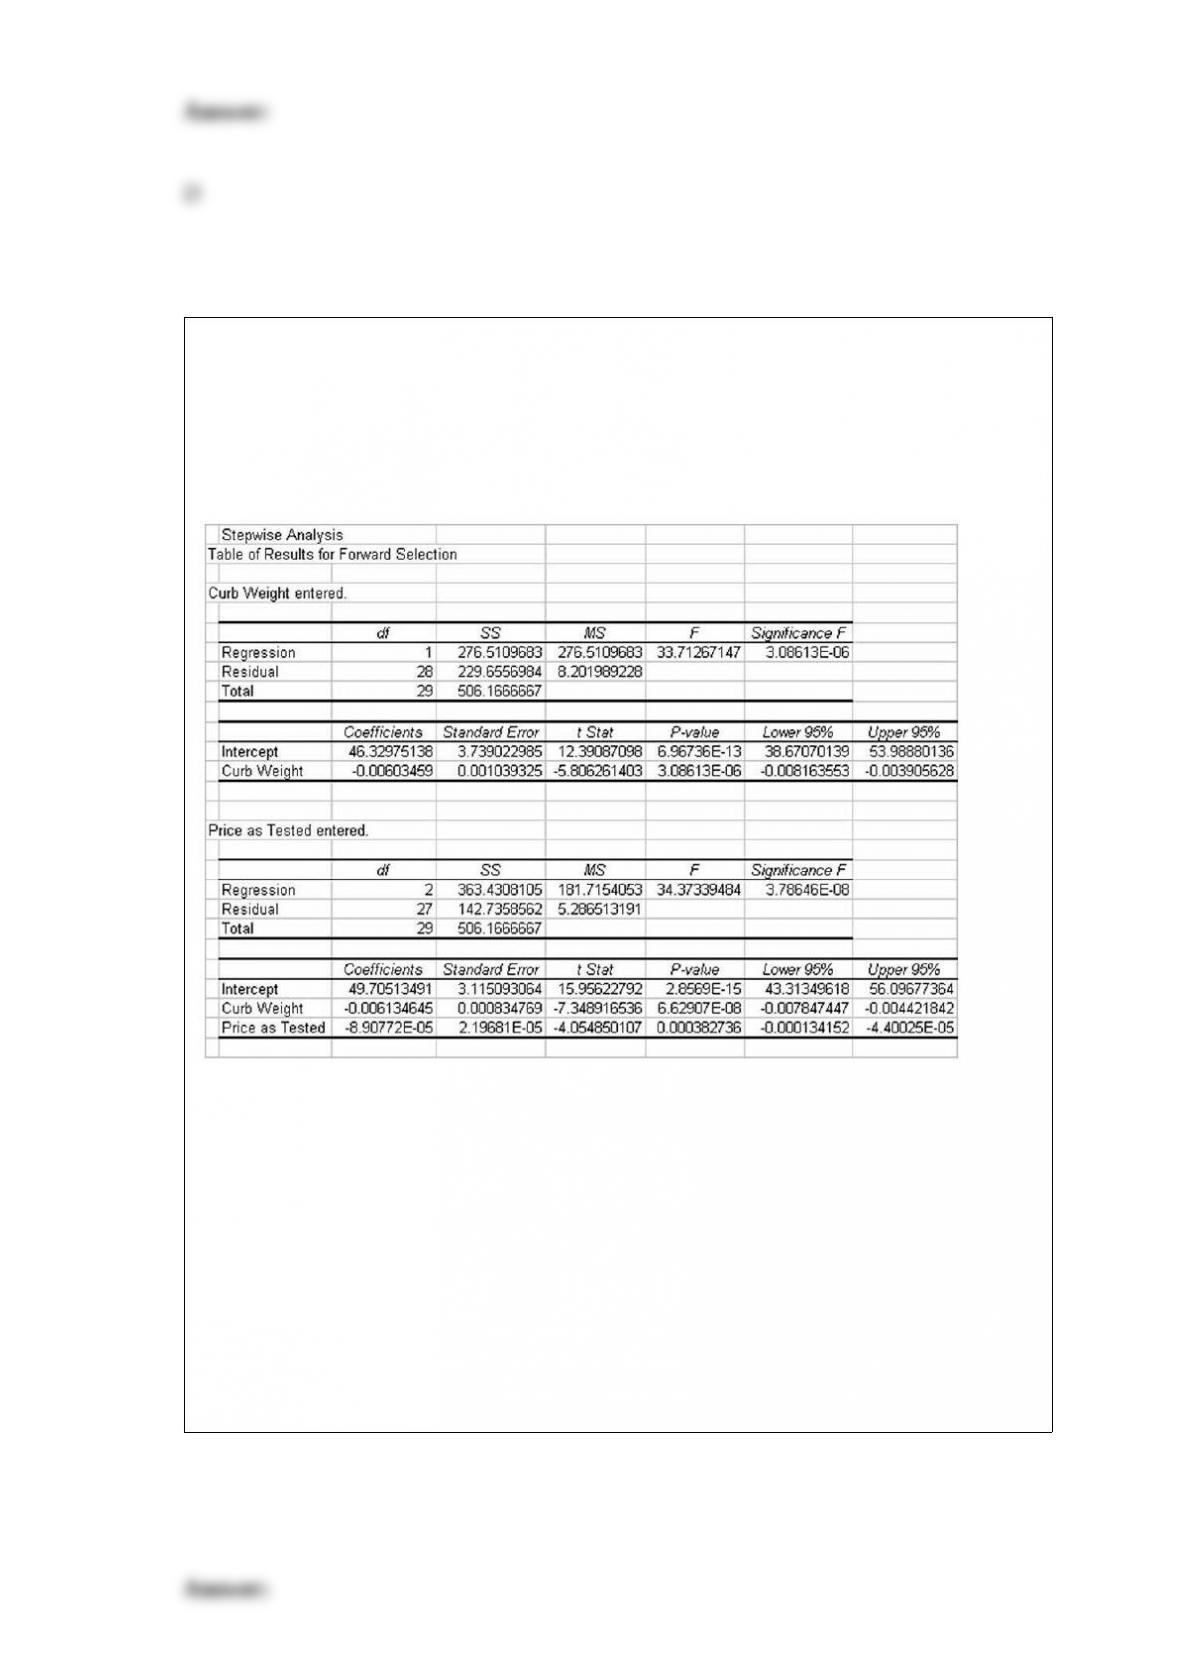
The editors of a national automotive magazine recently studied 30 different automobiles
sold in the United States with the intent of seeing whether they could develop a multiple
regression model to explain the variation in highway miles per gallon. A number of
different independent variables were collected. The following regression output is the
result of using a forward selection stepwise regression approach.
Based on the regression output, which of the following statements is true?
A) There is a multicollinearity problem since the standard error of the estimate actually
increased when the second variable, “Price as Tested,” entered the model.
B) The R-square value increased when the second variable entered the model.
C) Neither variable in the model is statistically significant at the alpha = 0.05 level.
D) The reason that only two variables entered the model is due to the small sample size
used in this study.

Suppose a recent random sample of employees nationwide that have a 401(k)
retirement plan found that 18% of them had borrowed against it in the last year. A
random sample of 100 employees from a local company who have a 401(k) retirement
plan found that 14 had borrowed from their plan. Based on the sample results, is it
possible to conclude, at the α = 0.025 level of significance, that the local company had a
lower proportion of borrowers from its 401(k) retirement plan than the 18% reported
nationwide?
A) The z-critical value for this lower tailed test is z = -1.96. Because -1.5430 is greater
than the z-critical value we do not reject the null hypothesis and conclude that the
proportion of employees at the local company who borrowed from their 401(k)
retirement plan is not less than the national average.
B) The z-critical value for this lower tailed test is z = -1.96. Because -1.0412 is greater
than the z-critical value we do not reject the null hypothesis and conclude that the
proportion of employees at the local company who borrowed from their 401(k)
retirement plan is not less than the national average.
C) The z-critical value for this lower tailed test is z = 1.96. Because 1.5430 is less than
the z-critical value we do not reject the null hypothesis and conclude that the proportion
of employees at the local company who borrowed from their 401(k) retirement plan is
not less than the national average.
D) The z-critical value for this lower tailed test is z = 1.96. Because 1.0412 is less than
the z-critical value we do not reject the null hypothesis and conclude that the proportion
of employees at the local company who borrowed from their 401(k) retirement plan is
not less than the national average.
In an article entitled “Childhood Pastimes Are Increasingly Moving Indoors,” Dennis
Cauchon asserts that there have been huge declines in spontaneous outdoor activities
such as bike riding, swimming, and touch football. In the article, he cites separate
studies by the national Sporting Goods Association and American Sports Data that
indicate bike riding alone is down 31% from 1995 to 2004. According to the surveys,

68% of 7- to 11-year-olds rode a bike at least six times in 1995 and only 47% did in
2004. Assume the sample sizes were 1,500 and 2,000, respectively.
Calculate a 95% confidence interval to estimate the proportion of 7- to 11-year-olds
who rode their bike at least six times in 2004.
A) (0.4481, 0.4919)
B) (0.4324, 0.4676)
C) (0.4021, 0.5179)
D) (0.4712, 0.4888).
For a chi-square test involving a contingency table, suppose H0 is rejected. We
conclude that the two variables are:
A) curvilinear.
B) linear.
C) related.
D) not related.
Model specification is the process of determining how well a forecasting model fits the
past data.
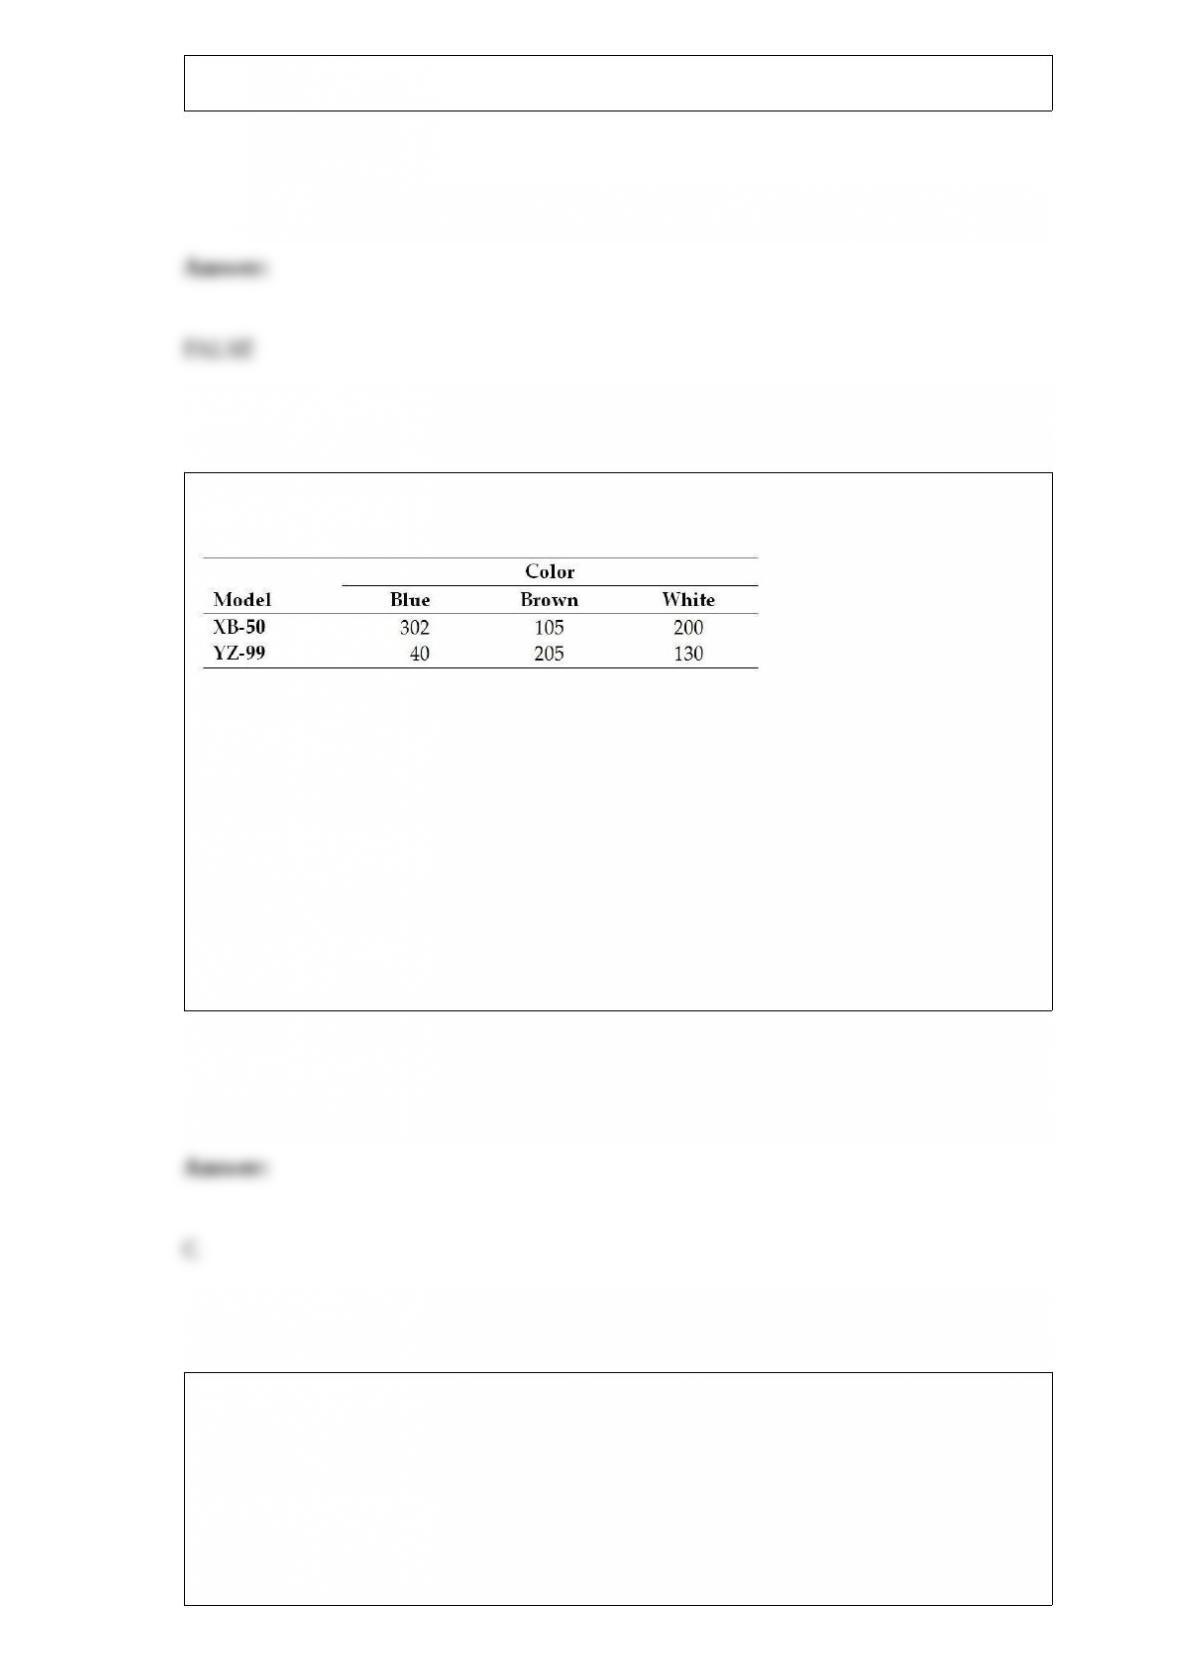
Cross County Bicycles makes two mountain bike models that each come in three
colors. The following table shows the production volumes for last week:
Based on the relative frequency assessment method, what is the probability that a
manufactured item is brown?
A) 0.2088
B) 0.3819
C) 0.3157
D) 0.1324
A corporation has 11 manufacturing plants. Of these, 7 are domestic and 4 are located
outside the United States. Each year a performance evaluation is conducted for 4
randomly selected plants.
What is the probability that a performance evaluation will include 2 or more plants
from outside the United States?
A) 0.4242
B) 0.3776
C) 0.3523
D) 0.4696
The cost of a college education has increased at a much faster rate than costs in general
over the past twenty years. In order to compensate for this, many students work part- or
full-time in addition to attending classes. At one university, it is believed that the
average hours students work per week exceeds 20. To test this at a significance level of
0.05, a random sample of n = 20 students was selected and the following values were
observed:
Based on these sample data, the critical value expressed in hours:
A) is approximately equal to 25.26 hours.
B) is approximately equal to 25.0 hours.
C) cannot be determined without knowing the population standard deviation.
D) is approximately 22 hours.

In conducting a Kruskal-Wallis one-way analysis of variance, the test statistic is
assumed to have approximately which distribution when the null hypothesis is true?
A) A t-distribution
B) An F-distribution
C) A normal distribution
D) A chi-square distribution
When sampling from a population, the sample mean will:
A) typically exceed the population mean.
B) likely be different from the population mean.
C) always be closer to the population mean as the sample size increases.
D) likely be equal to the population mean if proper sampling techniques are employed.
A major consumer group recently undertook a study to determine whether automobile
customers would rate the quality of cars differently whether they were manufactured in
the U.S., Europe, or Japan. To conduct this test, a sample of 20 individuals was asked to
look at mid-range model cars made in each of the three countries. The individuals in the
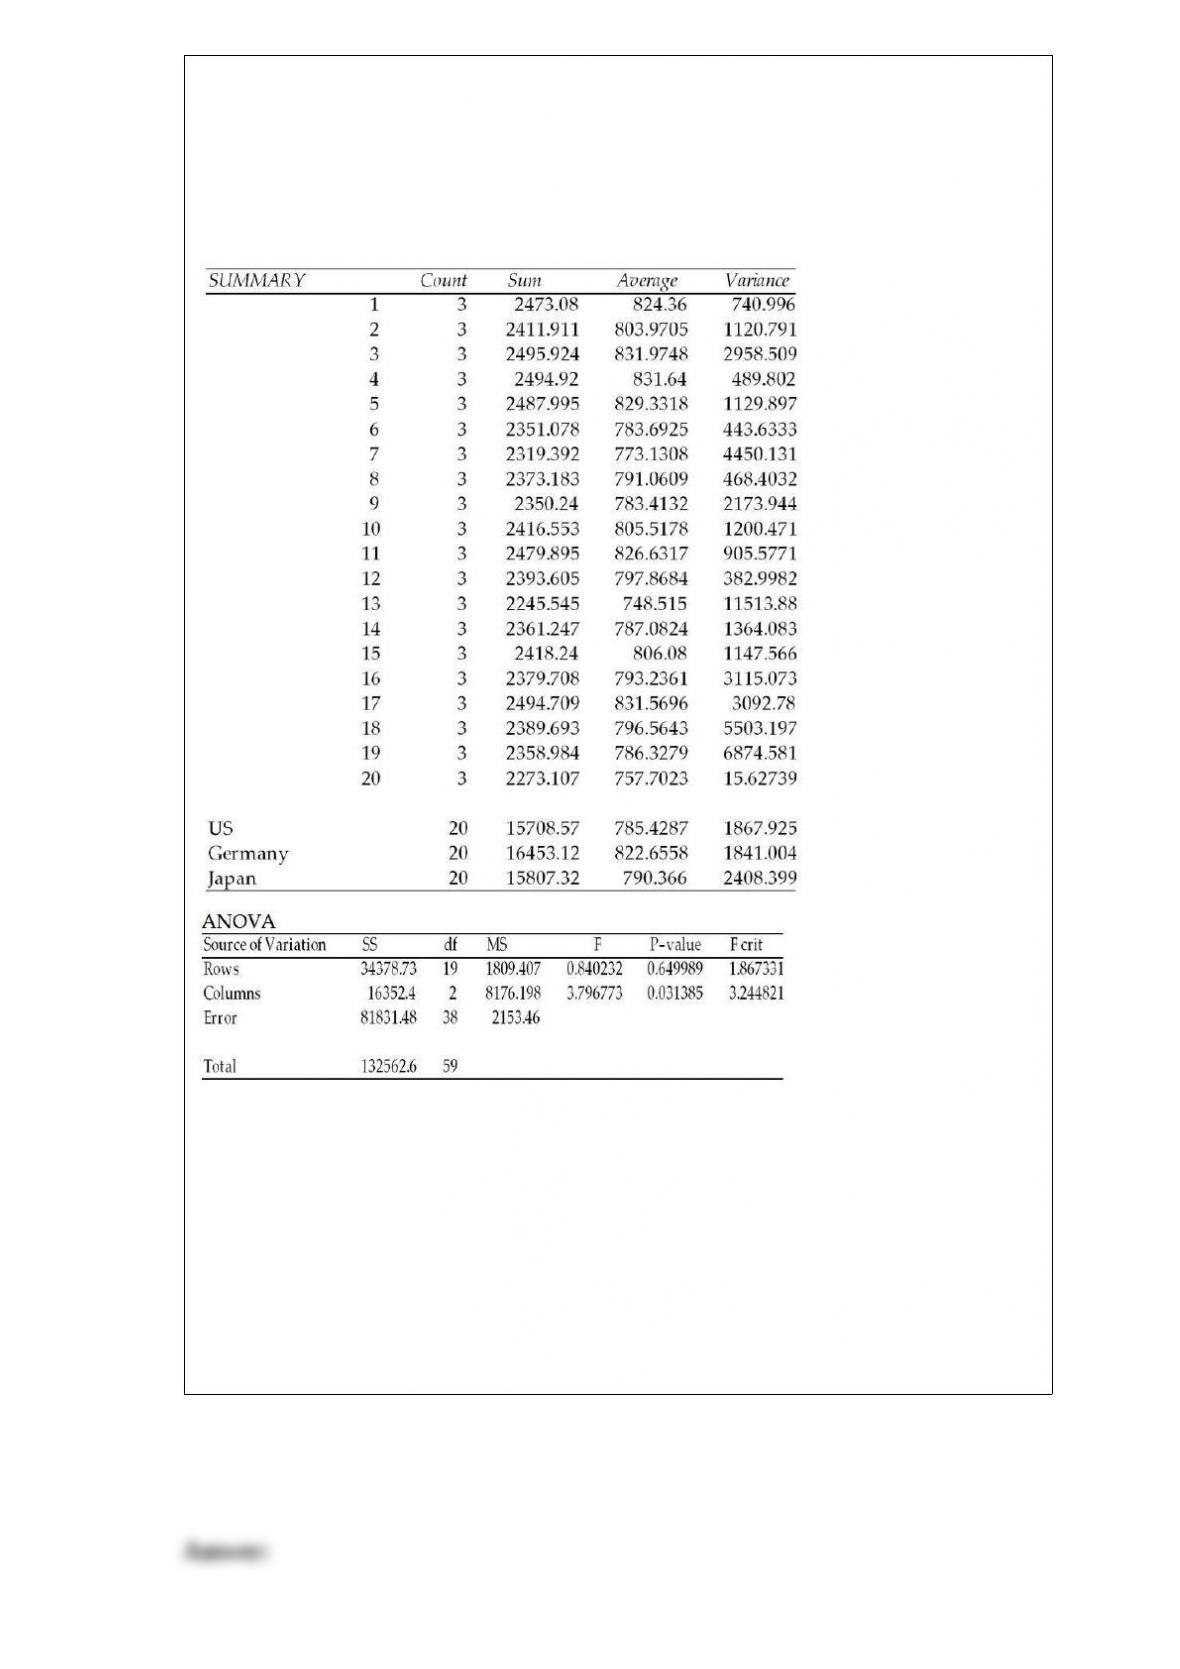
sample were then asked to provide a rating for each car on a scale of 1 to 1000. The
following computer output resulted, and the tests were conducted using a significance
level equal to 0.05.
ANOVA: Two-Factor Without Replication
Based upon the data, which of the following statements is true?
A) Blocking was effective.
B) Blocking was not effective.
C) The primary null hypothesis should not be rejected.
D) The averages for the 20 people are not all the same.

A company that sells an online course aimed at helping high-school students improve
their SAT scores has claimed that SAT scores will improve by more than 90 points on
average if students successfully complete the course. To test this, a national school
counseling organization plans to select a random sample of n = 100 students who have
previously taken the SAT test. These students will take the company’s course and then
retake the SAT test. Assuming that the population standard deviation for improvement
in test scores is thought to be 30 points and the level of significance for the hypothesis
test is 0.05, what is the probability that the counseling organization will incorrectly
“accept” the null hypothesis when, in fact, the true mean increase is actually 95 points?
A) Approximately 0.508
B) About 0.492
C) Approximately 0.008
D) Can’t be determined without knowing the sample results.
A walk-in medical clinic believes that arrivals are uniformly distributed over weekdays
(Monday through Friday). It has collected the following data based on a random sample
of 100 days.
Based on this information how many degrees for freedom are involved in this goodness
of fit test?
A) 99
B) 100
C) 4
D) 5
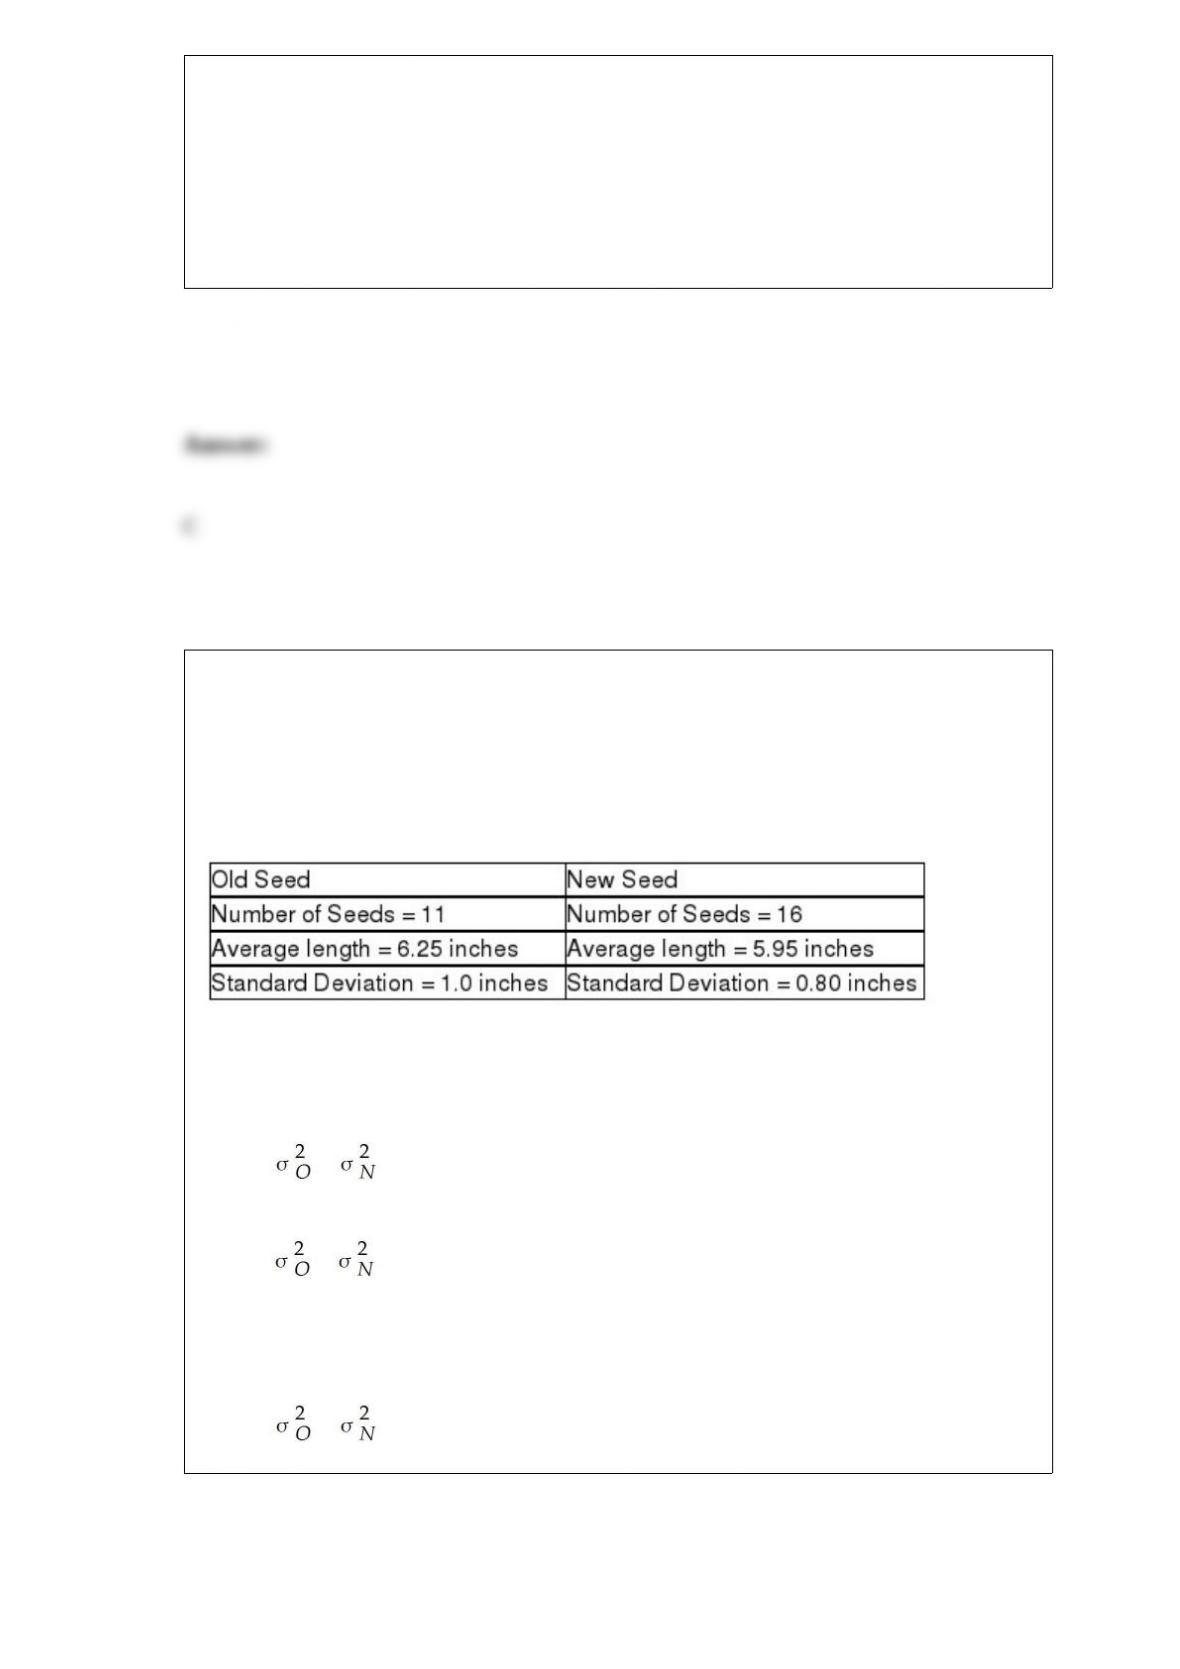
The Russet Potato Company has been working on the development of a new potato
seed that is hoped to be an improvement over the existing seed that is being used.
Specifically, the company hopes that the new seed will result in less variability in
individual potato length than the existing seed without reducing the mean length. To test
whether this is the case, a sample of each seed is used to grow potatoes to maturity. The
following information is given:
The correct null hypothesis for testing whether the variability of the new seed is less
than the old seed is:
A) H0 : ≤
B) H0 : ≥
C) H0 : σO ≥ σN
D) H0 : =
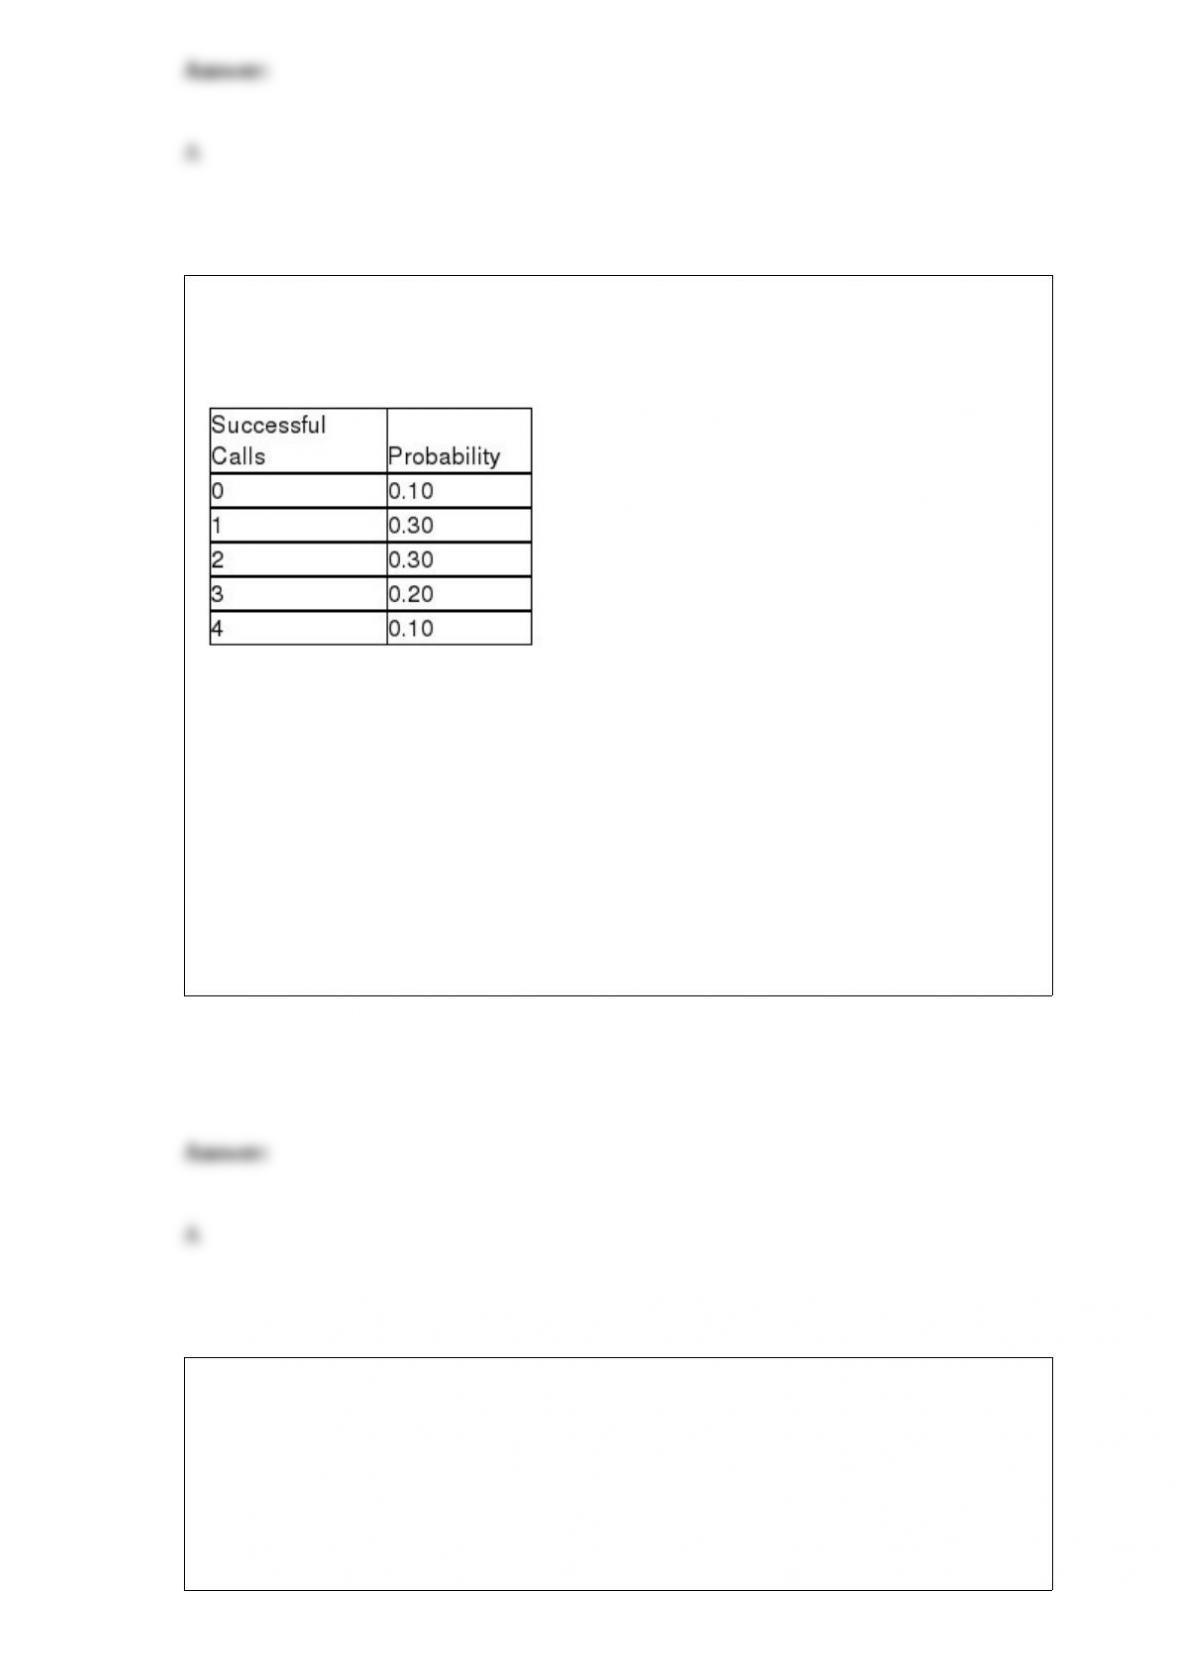
A sales rep for a national clothing company makes 4 calls per day. Based on historical
records, the following probability distribution describes the number of successful calls
each day:
Based on the information provided, what is the probability of having at least 2
successful calls in one day?
A) 0.60
B) 0.20
C) 0.30
D) 0.10
A bar chart is most likely used to display which of the following?
A) A continuous variable
B) A nominal level variable
C) An ordinal level variable
D) Either B or C
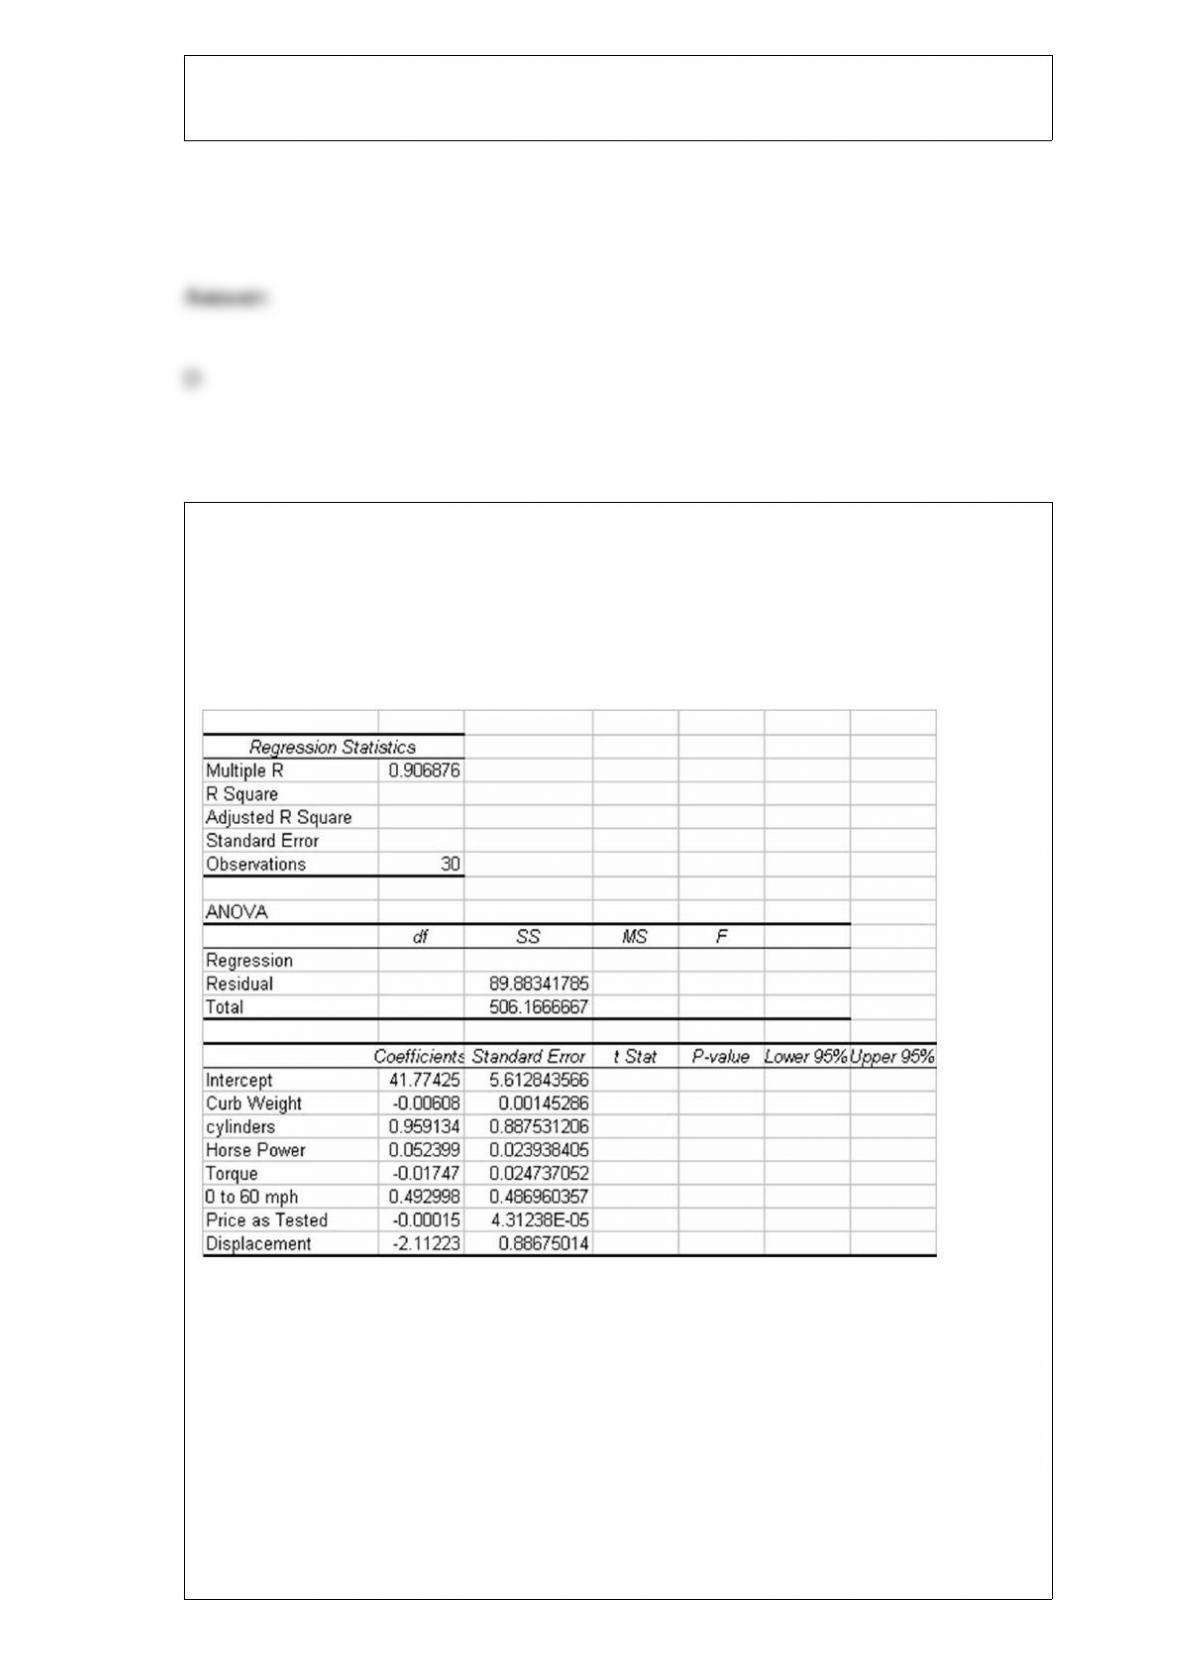
The editors of a national automotive magazine recently studied 30 different automobiles
sold in the United States with the intent of seeing whether they could develop a multiple
regression model to explain the variation in highway miles per gallon. A number of
different independent variables were collected. The following regression output (with
some values missing) was recently presented to the editors by the magazine’s analysts:
Based on this output and your understanding of multiple regression analysis, how many
degrees of freedom are associated with the Residual in the ANOVA table?
A) 19
B) 22
C) 7
D) 29

One of the leading dot-com companies has found that the proportion of customers who
come into its Web site that actually makes a purchase is 0.045. The company plans to
see whether this rate still holds by selecting a random sample of 200 hits on its Web
site. Given that the 0.045 rate still applies, what is the standard deviation of the
sampling distribution?
A) Approximately 0.0147
B) About 0.0002
C) About 0.0354
D) Can’t be determined without knowing the mean.