
For a one-tail (upper) hypothesis test, if the z- or t-test statistic exceeds the critical
value, we do not reject the null hypothesis.
The null hypothesis is believed to be true unless there is overwhelming evidence to the
contrary.
Model building is the process of deciding which dependent variables should be part of a
final regression model.
The difference between the actual data value and the dependent variable is known as the
residual.

The sum of the relative frequencies for the relative frequency distribution should be
equal to or very close to 1.0 due to rounding.
Because Ttreflects the overall trend component in the time series up to period t, we need
to set this value equal to 1 for the first period as a starting point when using exponential
smoothing with trend adjustment.
As the true population mean moves away from the hypothesized mean, the power of the
test decreases.

A probability is a numerical value that indicates the chance, or likelihood, of a specific
event occurring.
ANOVA provides a lower probability of a Type I error when compared to multiple
t-tests when comparing three or more population means.
The average forecasting error for a time-series technique can be determined through the
mean absolute deviation.
The independent variable on scatter plots is placed on the vertical axis on the graph.

The purpose of calculating a centered moving average is to remove the trend
component from the time series.
The average month end closing stock price for Company A over the past year is $34.57
with a standard deviation of $4.65. The average month end closing stock price for
Company B over the same period is $26.15 with a standard deviation of $7.45. Based
on this data, we can conclude that the stock price for Company A is more consistent
when compared to the stock price for Company B.
Information is the basic foundation for the field of statistics and can be defined as the
value assigned to a specific observation or measurement.

A listing of all the possible outcomes of an experiment for a discrete random variable
along with the relative frequency of each outcome is called a discrete probability
distribution.
The least squares method is a mathematical procedure used to identify the linear
equation that best fits a set of ordered pairs.
The standard error of the difference between population proportions describes the result
of subtracting one sample proportion from a second sample proportion.
When there is an even number of data values, the median is always the middle value in
the data set.

The coefficients for the dummy variables reflect the change in the dependent variable
when comparing one category of the qualitative variable to the base category (the one
with all zeros).
All analysis of variance procedures require that the observations are dependent on one
another.
The probability that Event A and Event B will occur refers to the union of Event A and
Event B.

The binomial distribution can be approximated by the Student’s t-distribution when the
following conditions are met: and .
The adjusted multiple coefficient of determination modifies, or adjusts, the multiple
coefficient of determination by accounting for the number of independent variables and
the sample size used to develop a multiple regression model.
Because outliers are extreme values that could distort the analysis, they should always
be eliminated from the data set.

When the chi-square test statistic is greater than the chi-square critical value when
comparing two or more population proportions, we fail to reject the null hypothesis.
A hypothesis is an assumption about a population parameter such as a mean or a
proportion.
The exponential smoothing technique works well for generating forecasts from data that
have significant trend or seasonal components.
Parametric statistics are procedures that rely on fewer assumptions about the probability
distribution for a population of interest than nonparametric statistics do.

When graphing a time series, the convention is to place the time data on the vertical
axis of the graph.
There can be more than one mode in a data set.
When there are an odd number of data values, the median is halfway between the two
middle values in the data set.

For a given sample size, reducing the value of α will result in an decrease in the value
of β.
The test statistic for the Wilcoxon rank-sum test equals the sum of the ranks for the
sample with the larger sample size. If the sample sizes are equal, either sample can be
used to calculate the test statistic.
Larger values of alpha with exponential smoothing tend to make the forecast less
responsive to previous forecasts errors.
The confidence interval for the proportion is a point estimate around the sample
proportion that provides us with a value for the true population proportion.

For a chi-square test of independence, the expected frequencies are calculated under the
assumption that the null hypothesis is true.
The presence of sampling error is an indication that an improper sampling technique
was used.
A level in an ANOVA test accounts for the variation outside of the main factor.
When constructing a frequency distribution with grouped qualitative data, occasionally
you will end up with k + 1 or k 1 classes to cover the entire data set.
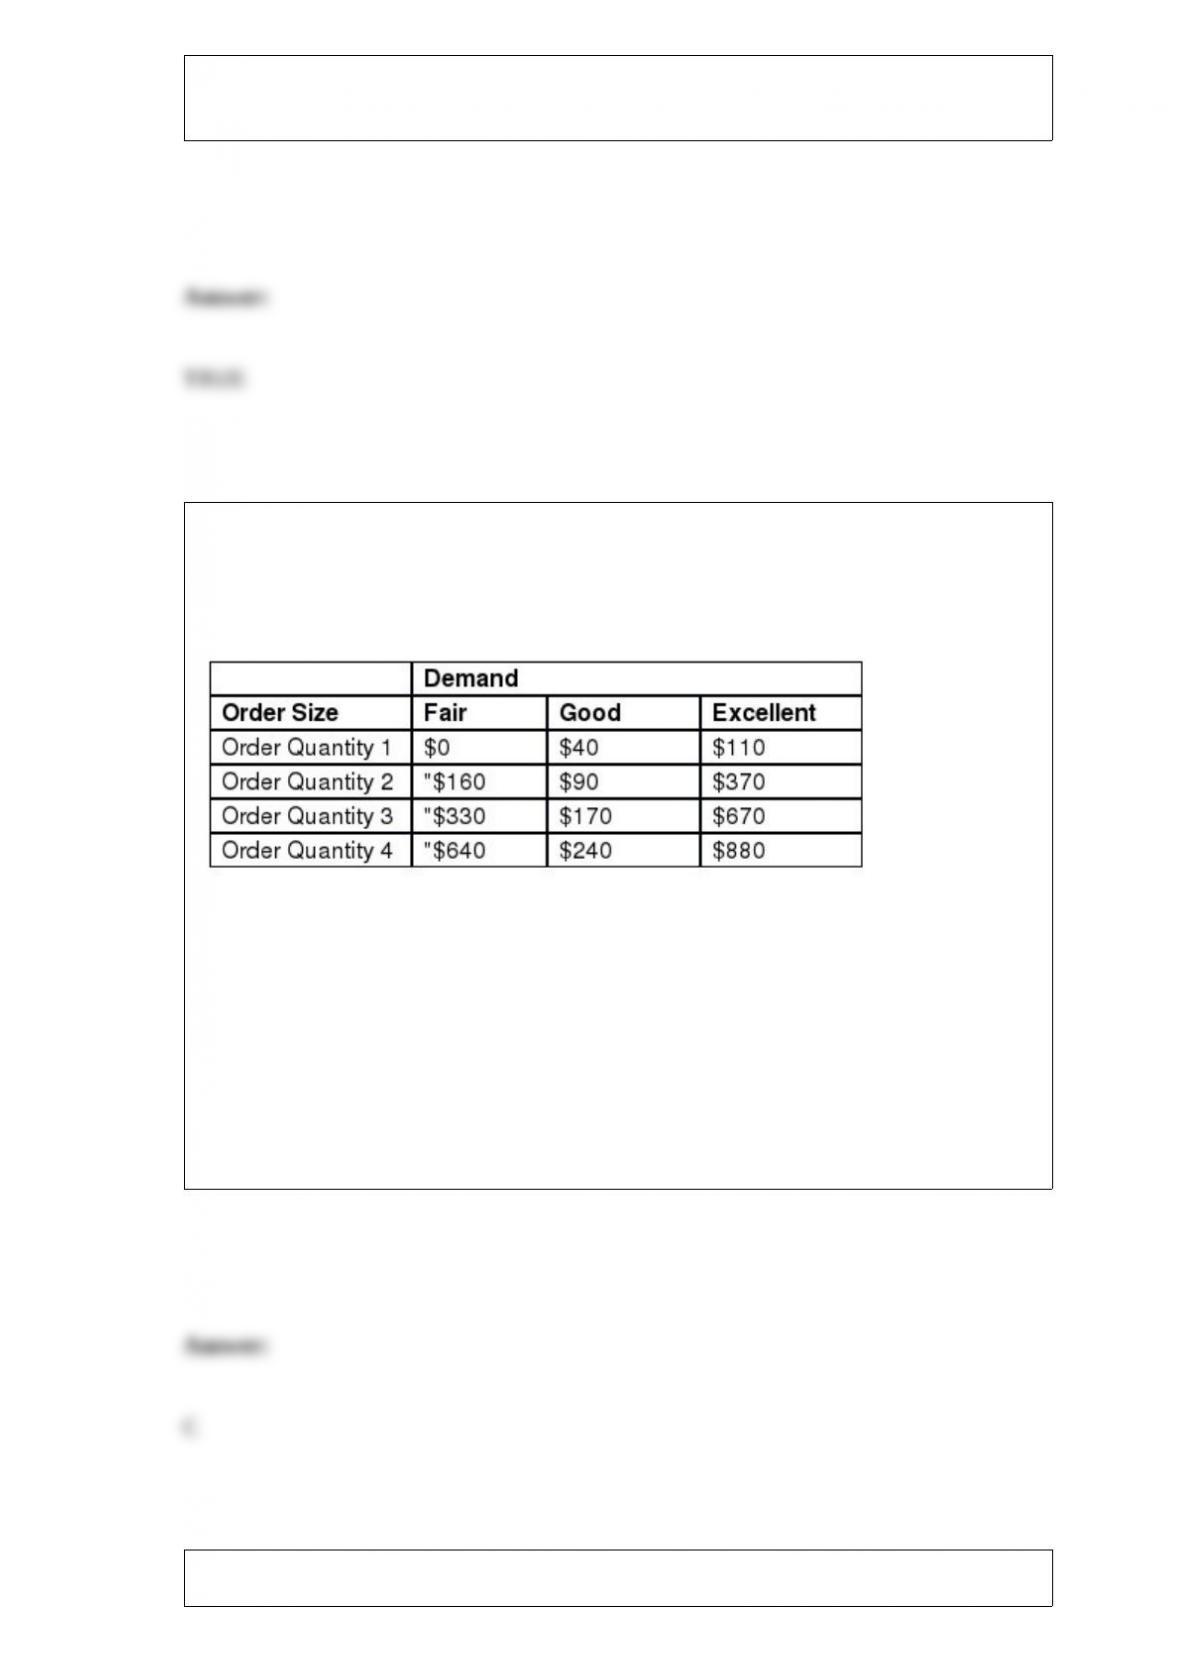
Debbie is a buyer for a retail chain and needs to decide what order quantity to place for
women’s coats for the upcoming winter season. Below is a payoff table, in thousands of
dollars, for various order quantities (1 = lowest, 4 = highest) and demand levels for the
winter coats.
If the Debbie uses the equally likely criterion, which order size will she place?
A) Order Quantity 1
B) Order Quantity 2
C) Order Quantity 3
D) Order Quantity 4
A chocolate chip cookie producer claims that its cookies average 3 chocolate chips and
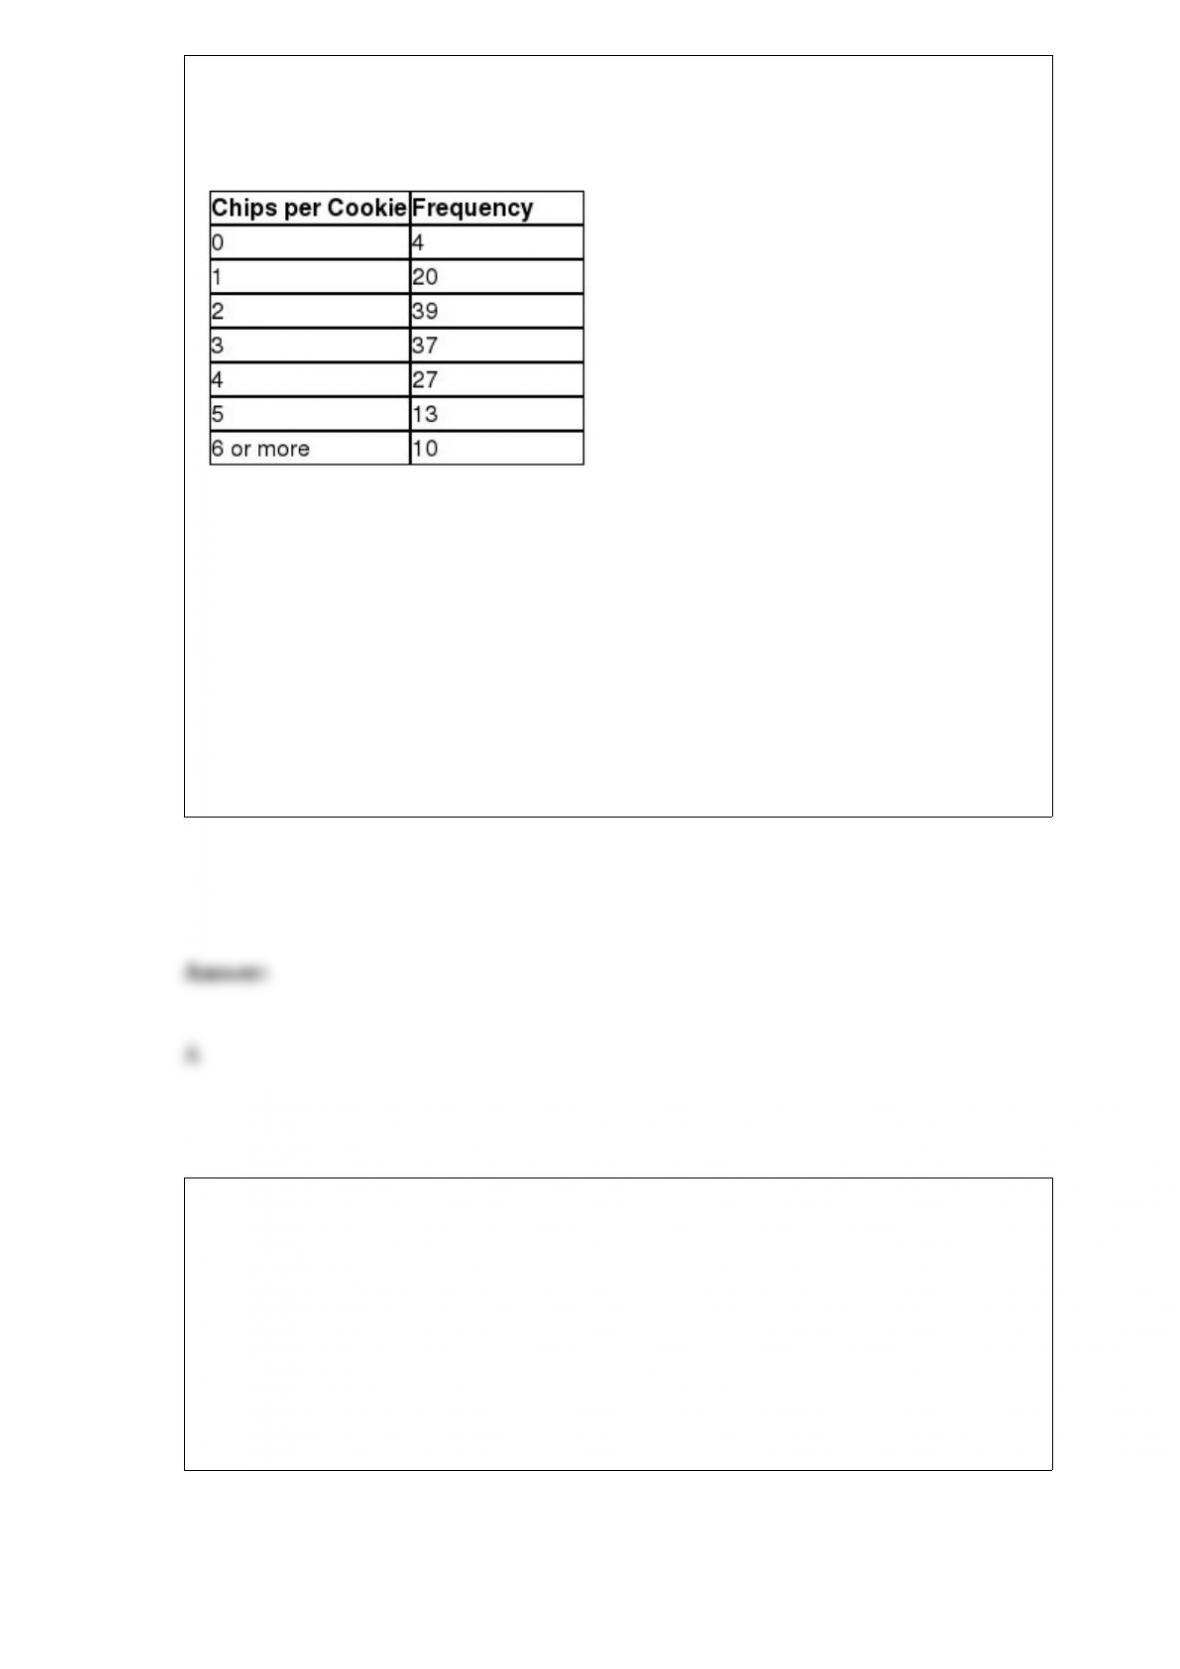
that the distribution follows the Poisson. A consumer group wanted to test this claim
and randomly sampled 150 cookies. The resulting frequency distribution is shown
below.
The expected number of cookies from this sample that will have exactly one chip is
________.
A) 22.41
B) 25.20
C) 27.72
D) 33.60
________ data has the benefit of a true zero point.
A) Nominal
B) Ordinal
C) Interval
D) Ratio

Using income data to determine the credit worthiness of a consumer who wishes to
purchase a new car is an example of using statistics in the field of ________.
A) marketing research
B) advertising
C) operations
D) finance
Use the following information to answer the question(s) below.
A home appraisal company would like to develop a regression model that would predict
the selling price of a house based on the age of the house in years (Age), the living area
of the house in square feet (Living Area) and the number of bedrooms (Bedrooms). The
following Excel output shows the partially completed regression output from a random
sample of homes that have recently sold.
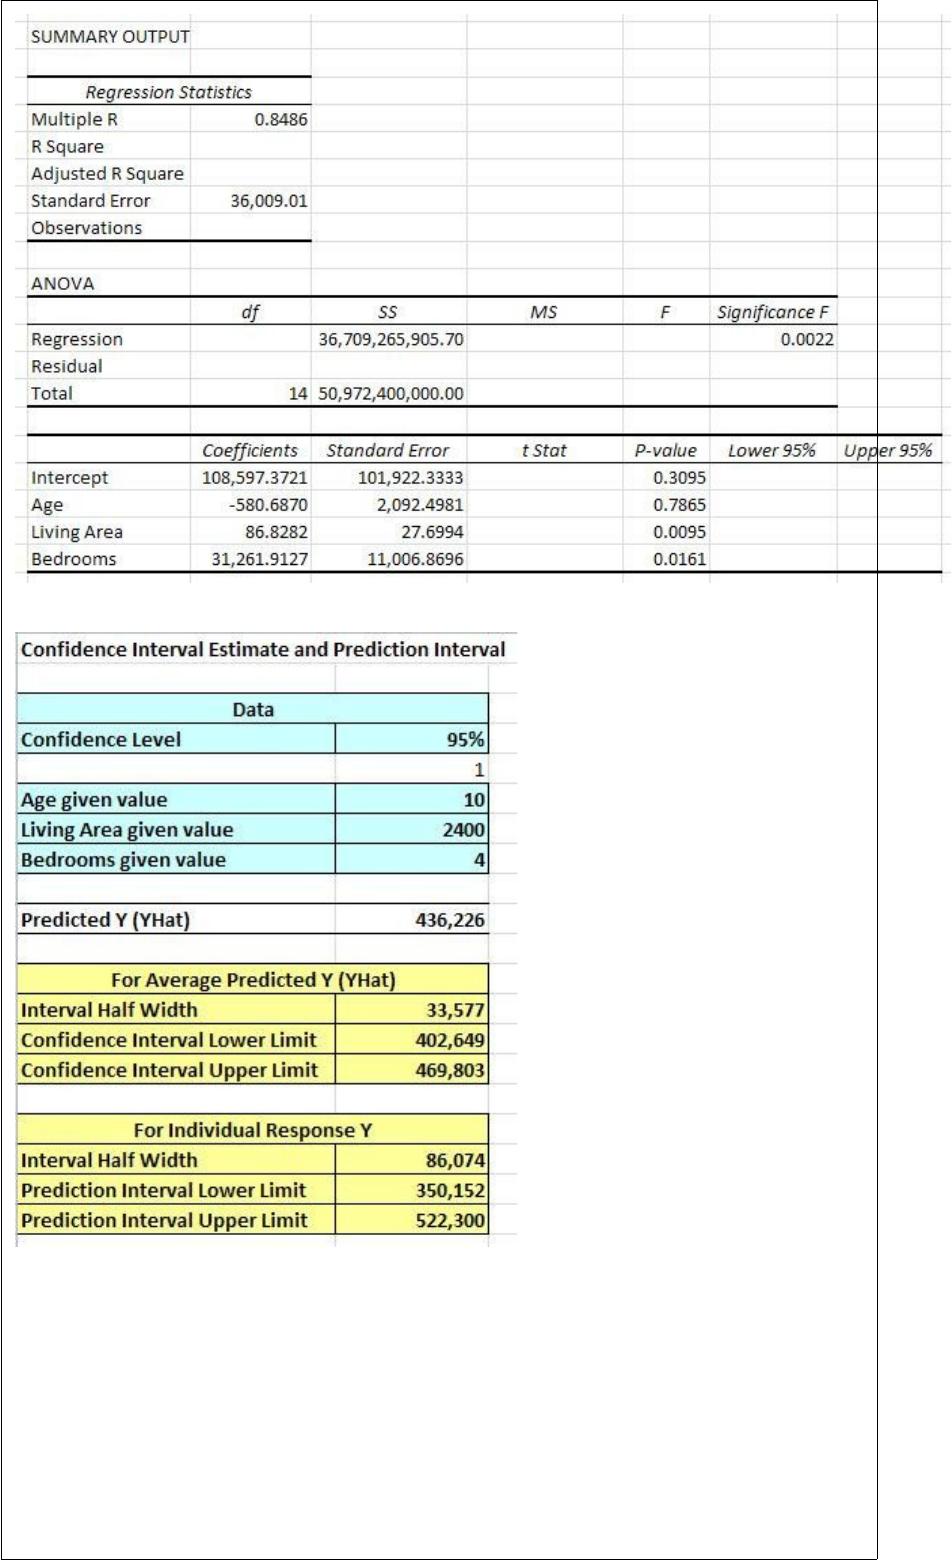
The test statistic for testing the significance of the Bedrooms variable is ________.
A) 2.191
B) 2.840
C) 3.326
D) 3.570
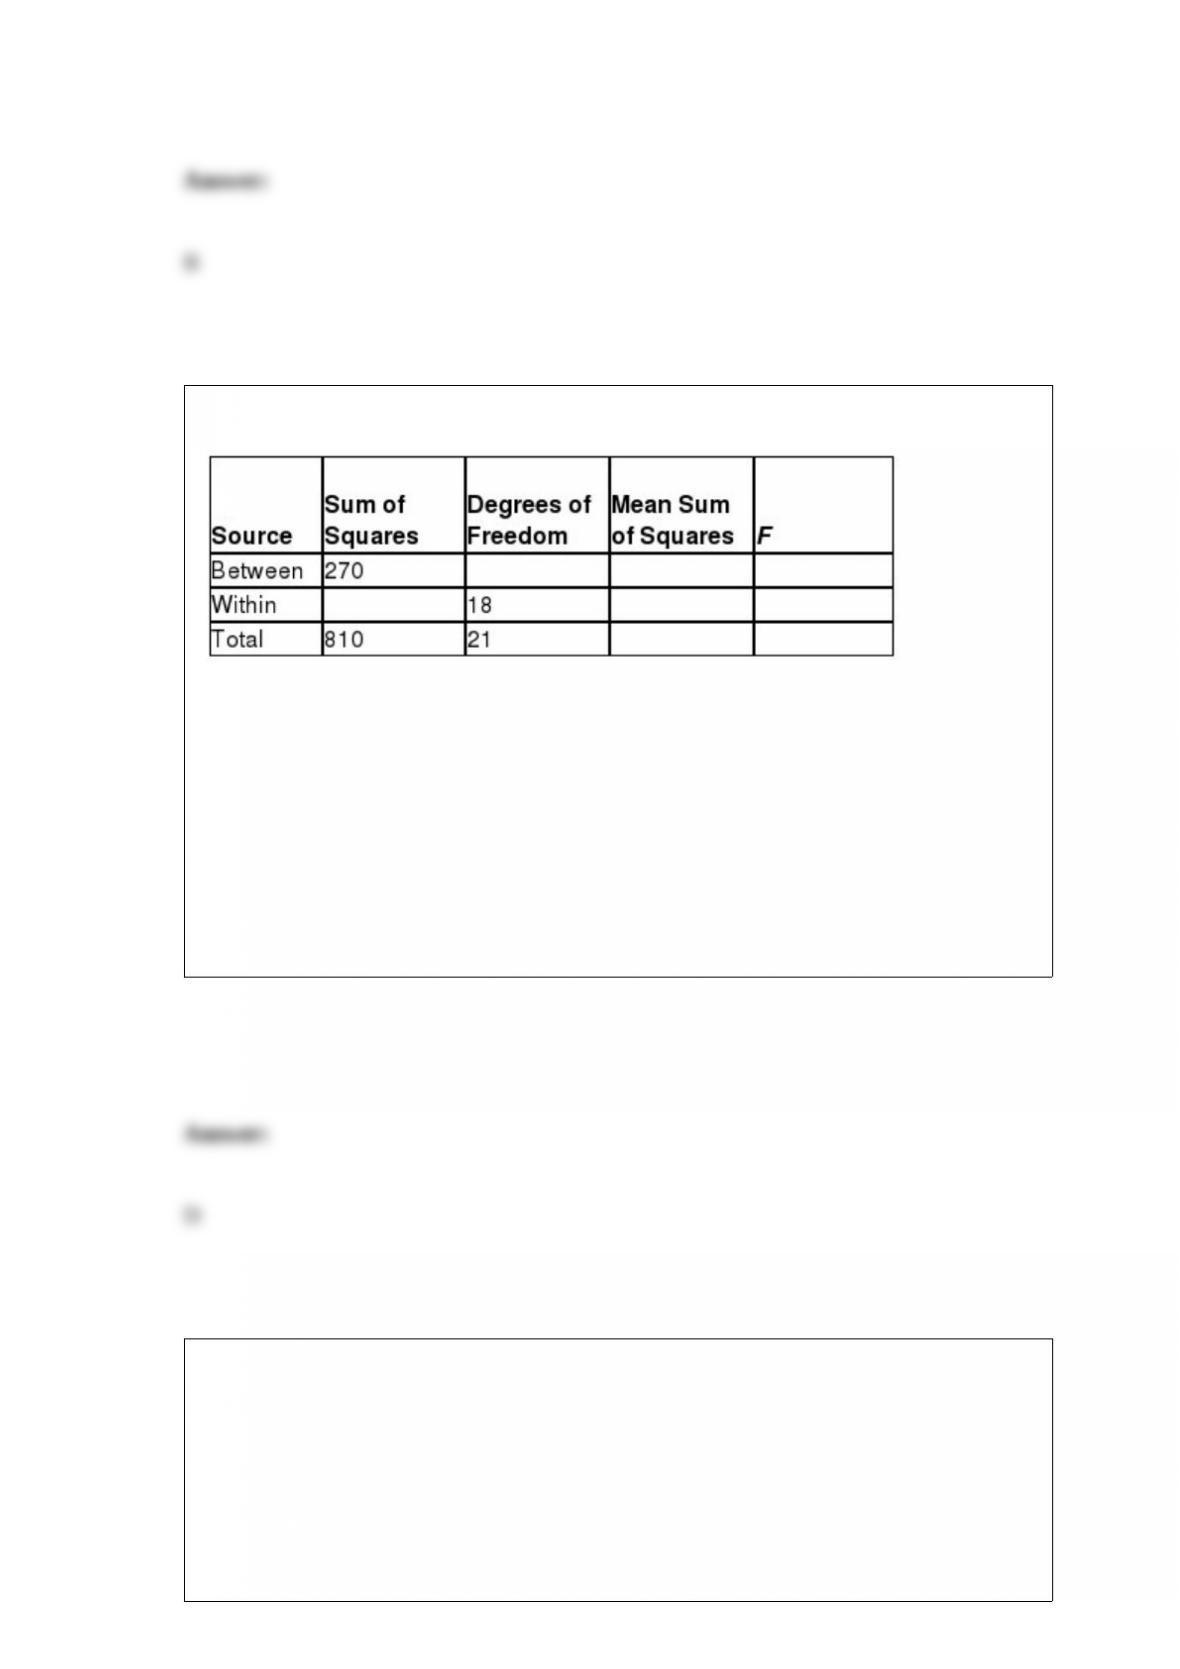
Consider the partially completed one-way ANOVA summary table.
Using α = 0.025, the critical F-score for this ANOVA procedure is ________.
A) 2.416
B) 3.160
C) 3.608
D) 3.954
The test statistic for testing the significance for the regression coefficient follows the
_______________________.
A) normal distribution
B) Student’s t-distribution
C) F-distribution
D) chi-square distribution
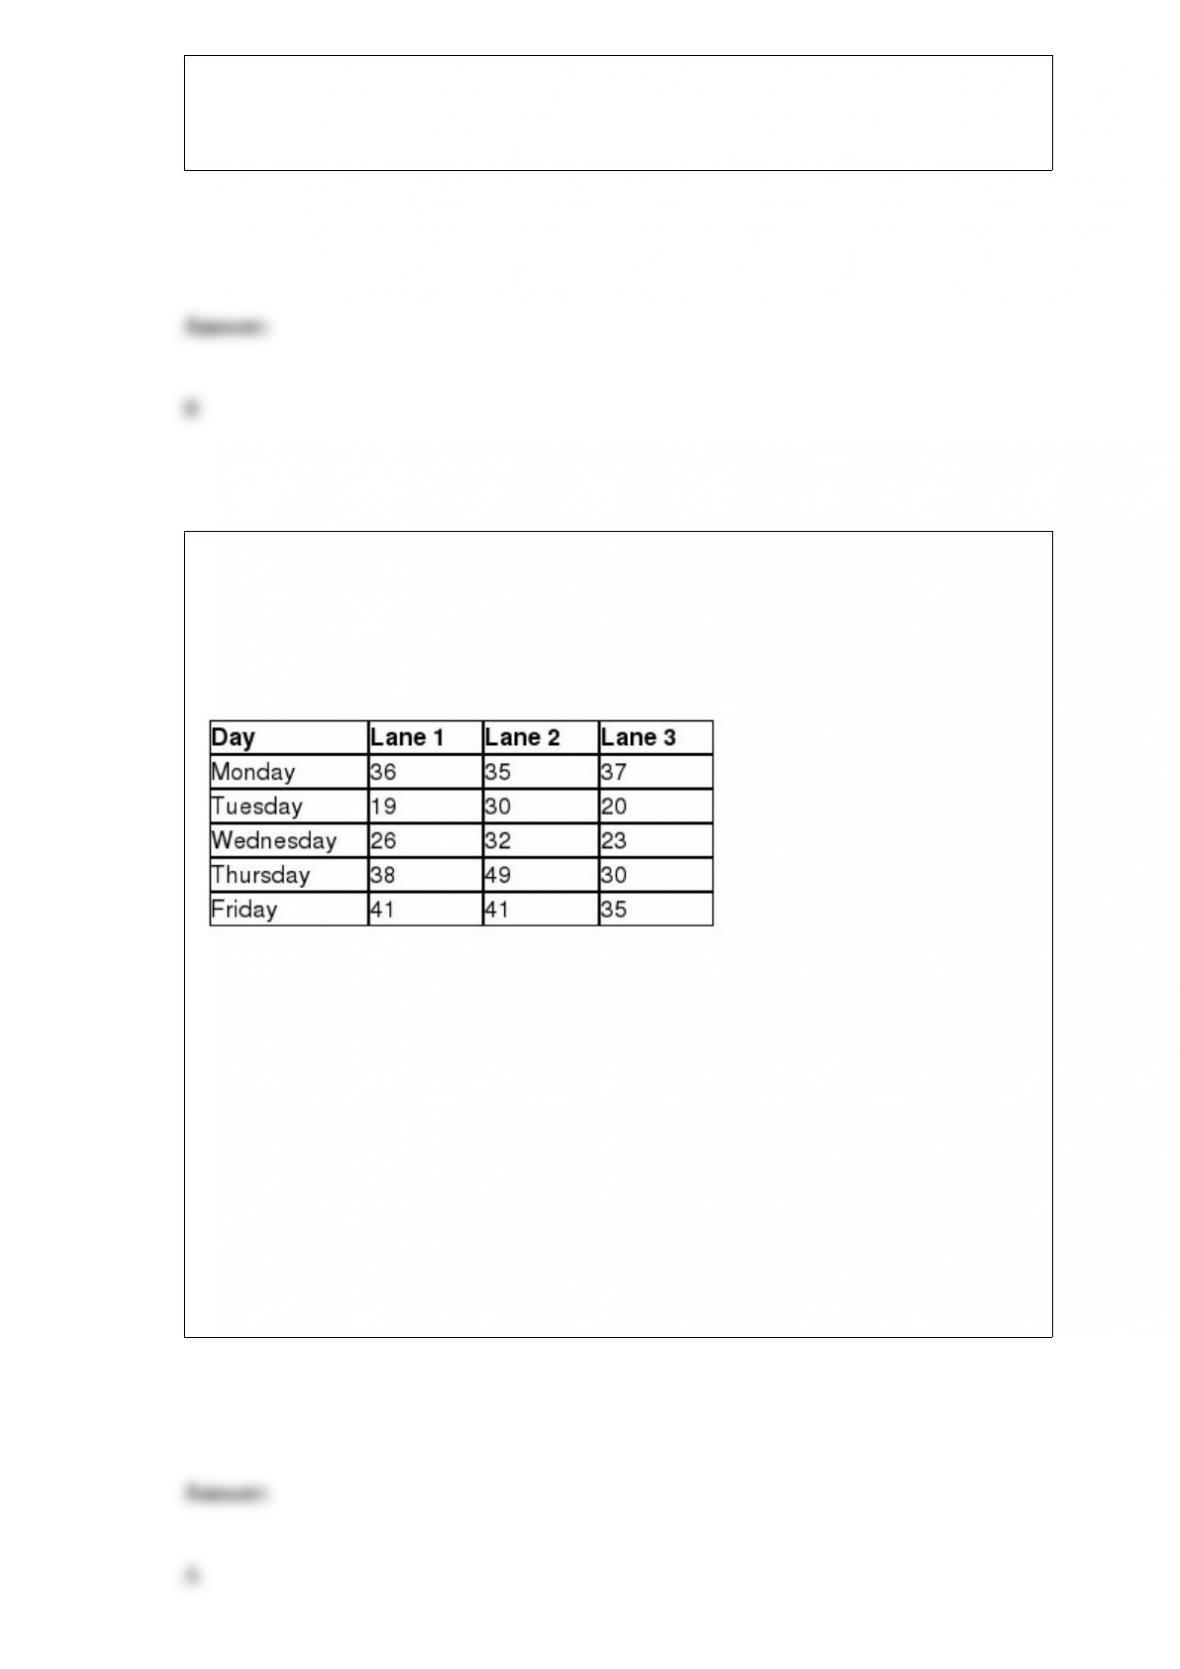
In Delaware, cars are inspected each year using state-operated inspection centers. The
Wilmington center has three drive-through lanes where cars are inspected in a sequence
of steps. The following data show the number of minutes that a random sample of
drivers spent waiting and having their cars inspected in the three lanes each day of the
week.
The state of Delaware would like to perform a randomized block ANOVA to test for a
difference in the average times the drivers spend in the three lanes using the weekday as
a blocking factor with α = 0.05. The mean square total for these observations is
________.
A) 69.6
B) 75.8
C) 81.9
D) 88.4
________ probability requires that you count the frequency that an event occurs
through an experiment and calculate the probability from the experiment’s relative
frequency distribution.
A) Classical
B) Simple
C) Empirical
D) Subjective
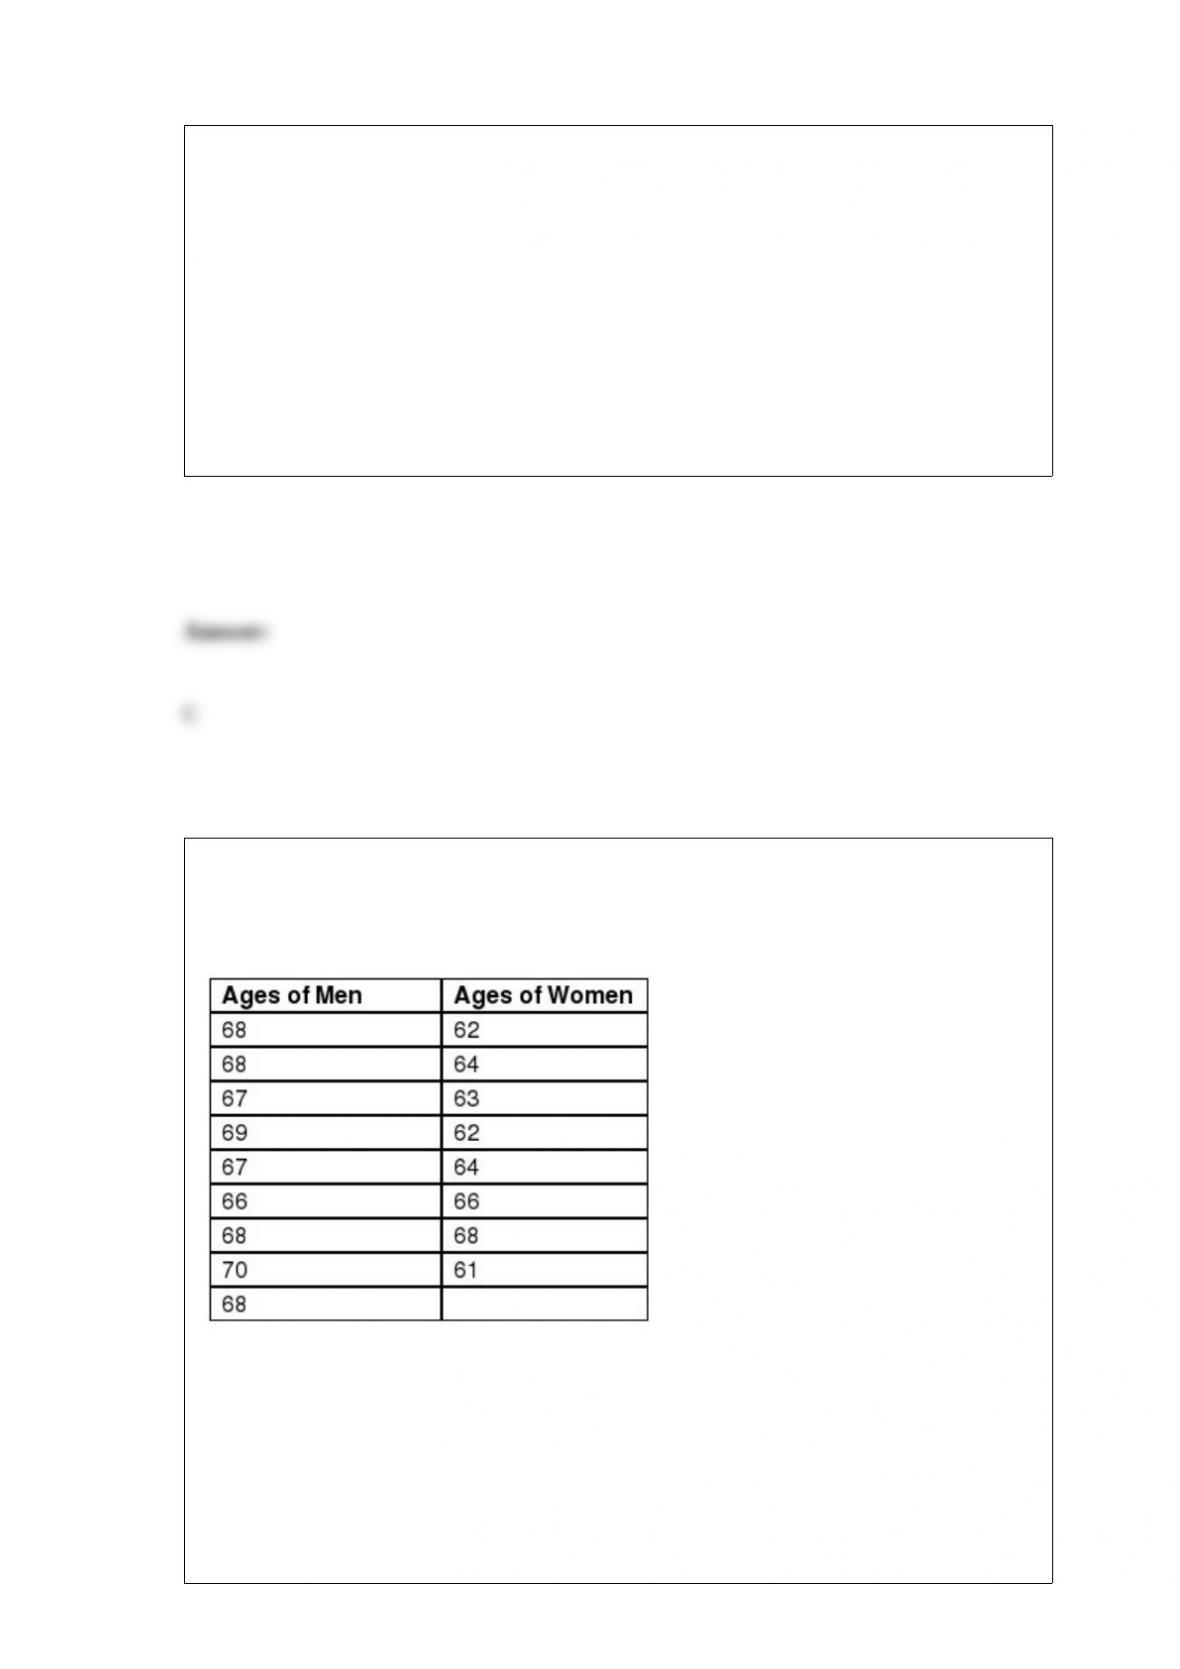
The federal government would like to test the hypothesis that the median age of men
filing for Social Security is higher than the median age of women set using α = 0.05
with the following sample data:
The test statistic for this hypothesis test is ________.
A) 36.0
B) 41.5
C) 87.0
D) 103.0
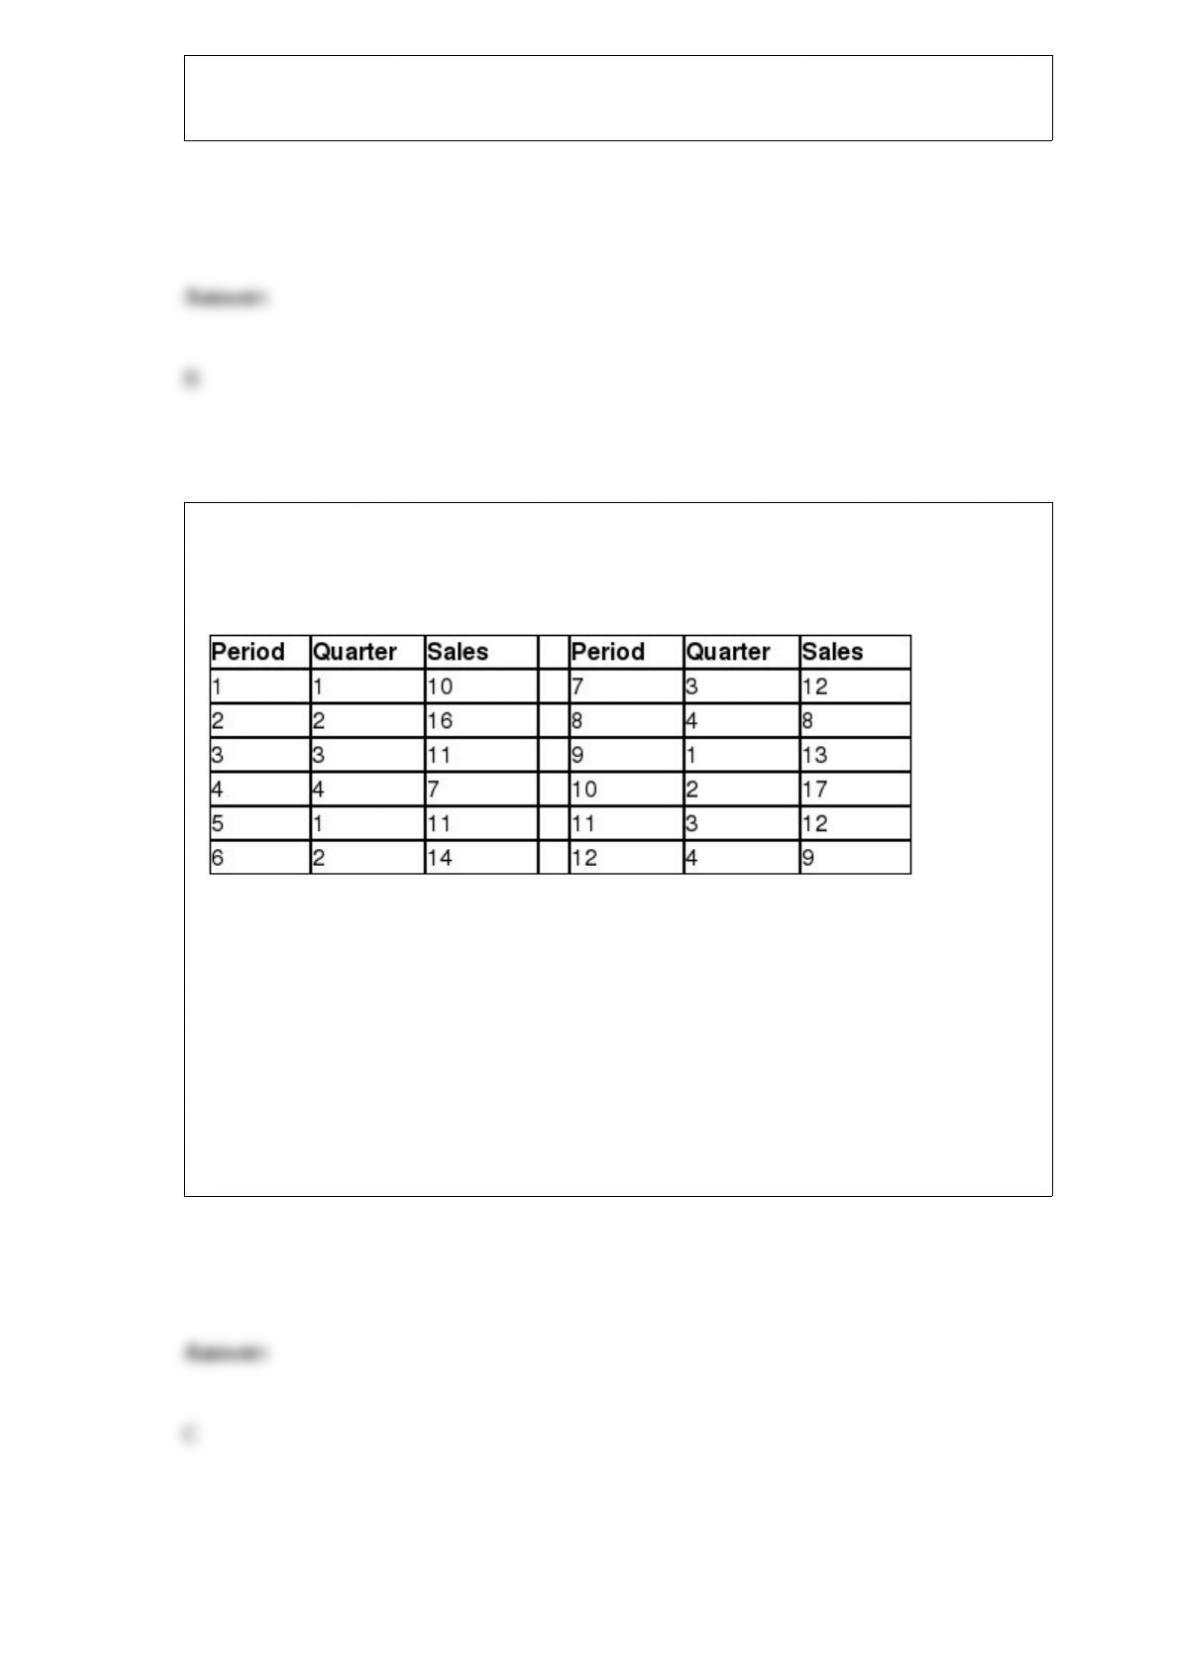
Chris is employed by Silver Lake Resort in Orlando, Florida, and sells timeshares. The
following table shows the number of timeshare sales for Chris for each quarter over the
past three years.
The deseasonalized number of sales for Period 9 is ________.
A) 11.0
B) 11.5
C) 12.6
D) 13.3

Recently, Experian reported that the average credit score for a new-car loan was 753.
Suppose Ally Financial, a bank holding company that finances car loans, would like to
test the hypothesis that the average credit score has increased since the Experian report.
A random sample of 20 new-car loans had an average credit score of 764.2 with a
sample standard deviation of 34.5. Ally Financial would like to set α = 0.05. The correct
hypothesis statement for this hypothesis test would be __________________________.
A)
B)
C)
D)
Sony would like to test the hypothesis that the average age of a PlayStation user is
different from the average age of an Xbox user. A random sample of 36 PlayStation
users had an average age of 34.2 years while a random sample of 30 Xbox users had an
average age of 32.7 years. Assume that the population standard deviation for the age of
PlayStation and Xbox users is 3.9 and 4.0 years, respectively. Sony would like to set α
= 0.10. The standard error of the difference between two means for this hypothesis test
would be ________.
A) 0.503
B) 0.978
C) 1.630
D) 1.945

Two variables have a correlation coefficient equal to +0.55 from a sample size of 8.
Which one of the following statements describes the results of the hypothesis test that
the population correlation coefficient is greater than zero using α = 0.05?
A) Because the test statistic is greater than the critical value, we fail to reject the null
hypothesis and conclude that the population correlation coefficient is not greater than
zero.
B) Because the test statistic is greater than the critical value, we can reject the null
hypothesis and conclude that the population correlation coefficient is greater than zero.
C) Because the test statistic is less than the critical value, we fail to reject the null
hypothesis and conclude that the population correlation coefficient is not greater than
zero.
D) Because the test statistic is less than the critical value, we can reject the null
hypothesis and conclude that the population correlation coefficient is not greater than
zero.
Use the following information to answer the question(s) below.
The National Football League has developed a regression model to predict the number
of wins during a season for a team using the following independent variables:
•Average points per game during the season (PPG)
•Average number of penalties committed per game during the season (PEN)
•Turnover differential during the season (TO)
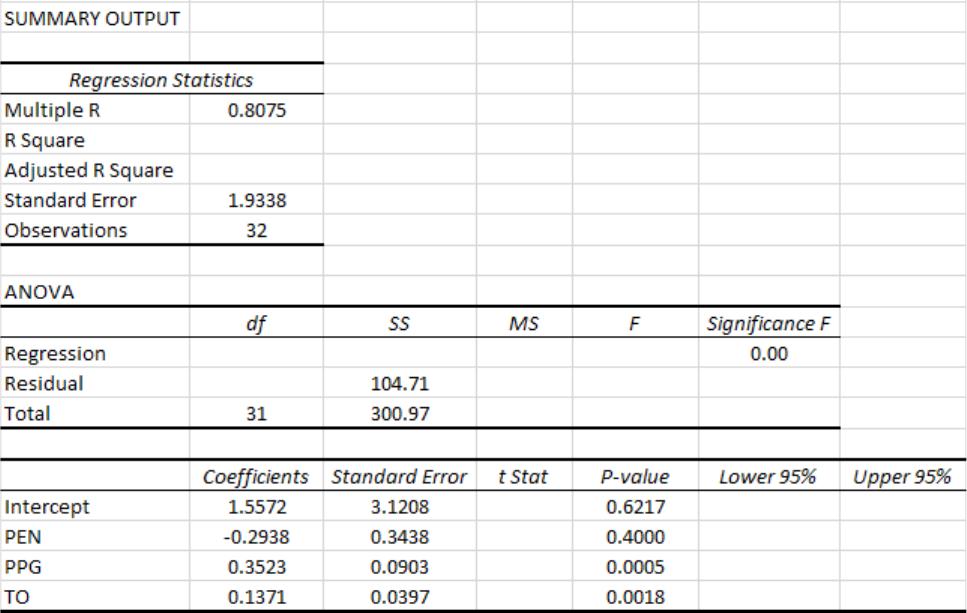
Turnover differential is defined as the number of times the team took the ball away from
their opponent with a turnover minus the number of times the team gave the ball away to
their opponent with a turnover. For example, if TO = +5, the team had five more
takeaways than giveaways. If TO = “7, the team had seven more giveaways than
takeaways during the season.
The following Excel output shows the partially completed regression output from a
random season.
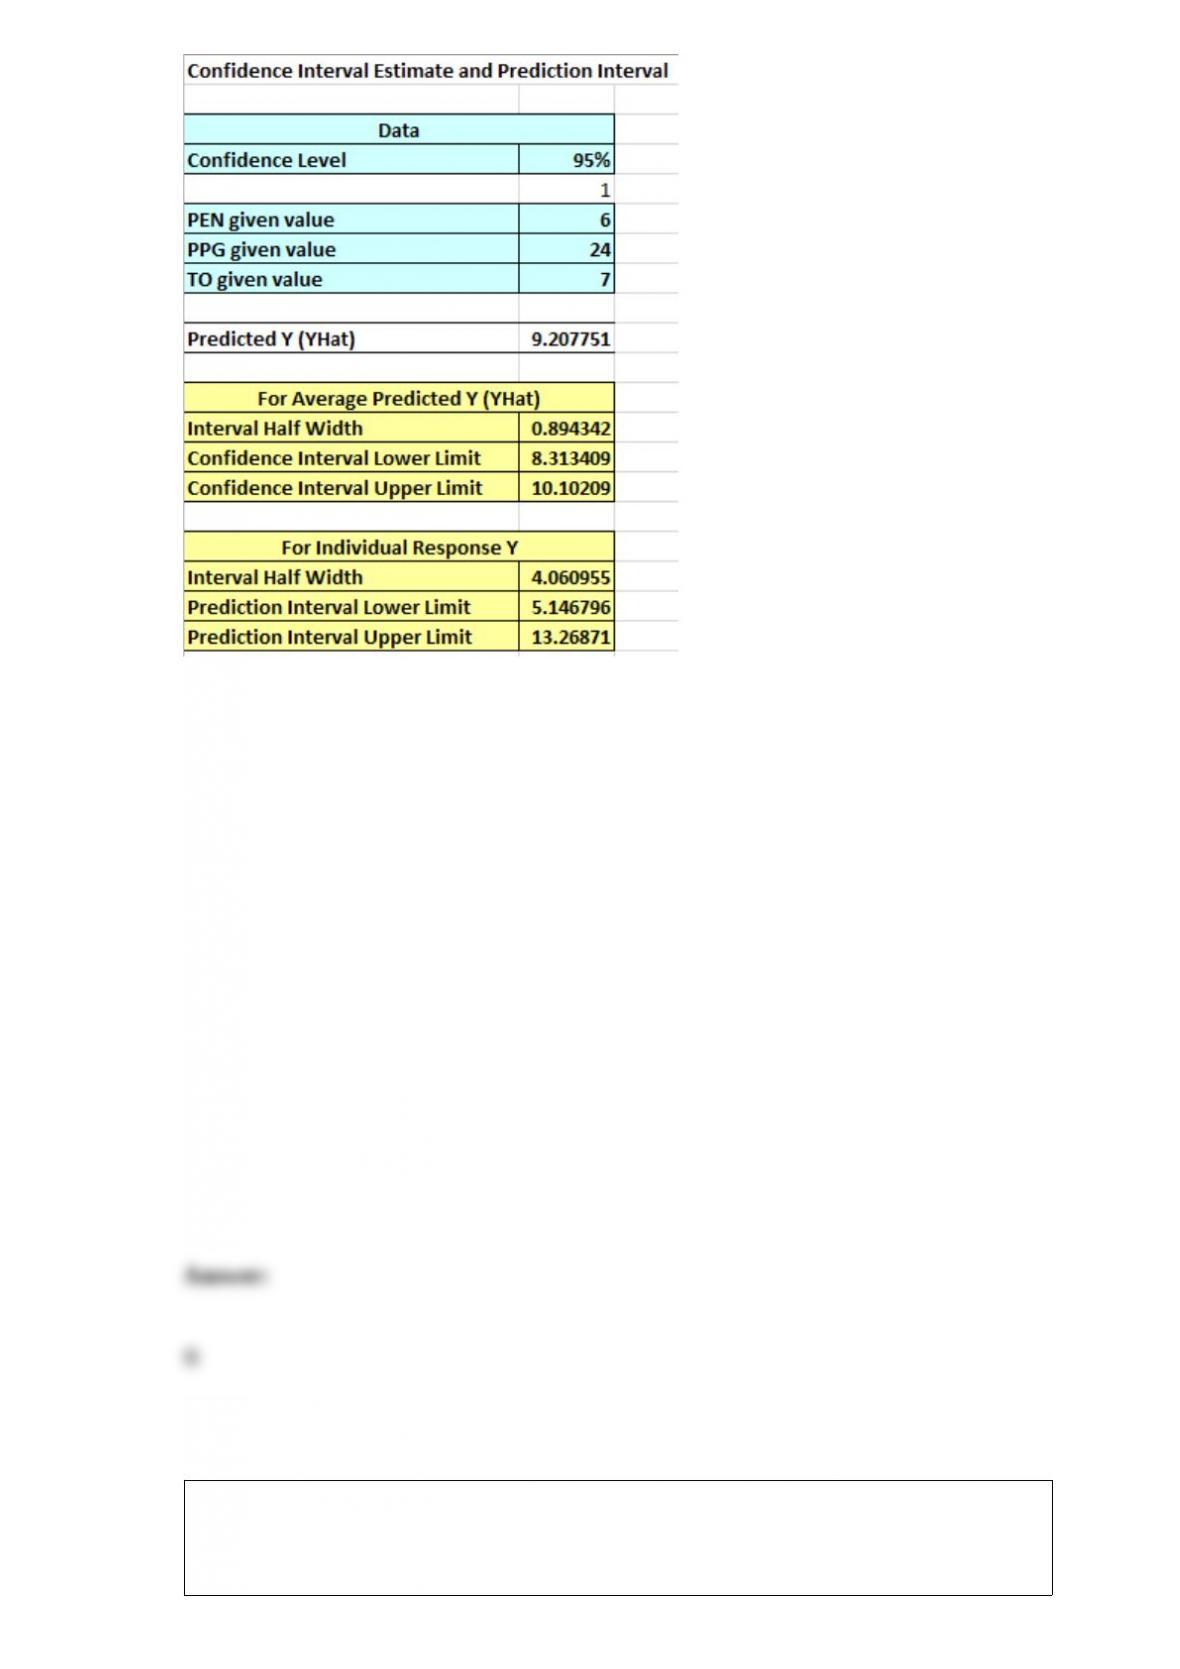
The degrees of freedom for the critical value to test the significance of the regression
coefficients using α = 0.05 are ________.
A) 27
B) 28
C) 31
D) 32
In Delaware, cars are inspected each year using state-operated inspection centers. The
Wilmington center has three drive-through lanes where cars are inspected in a sequence
of steps. The following data show the number of minutes that a random sample of
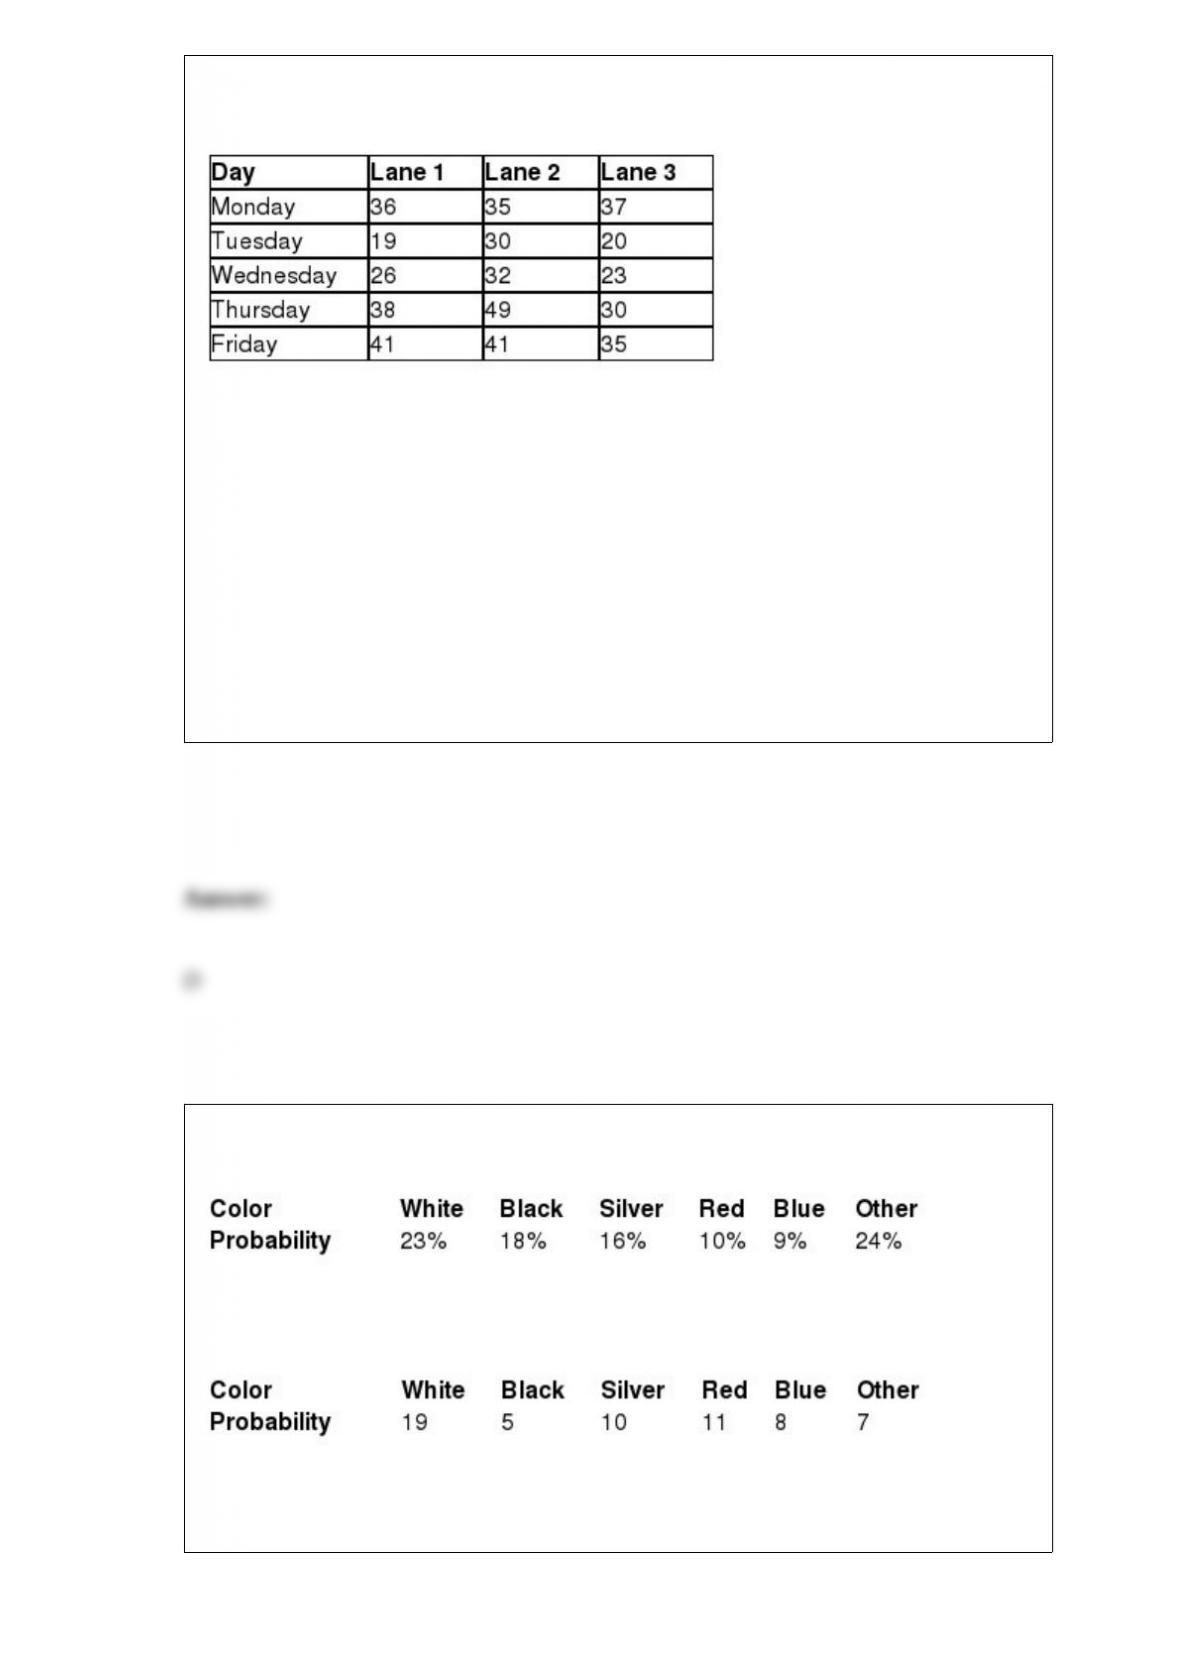
drivers spent waiting and having their cars inspected in the three lanes each day of the
week.
The state of Delaware would like to perform a randomized block ANOVA to test for a
difference in the average times the drivers spend in the three lanes using the weekday as
a blocking factor. The Tukey-Kramer critical range using α = 0.05 is ________.
A) 2.40
B) 6.00
C) 7.05
D) 7.64
DuPont Automotive releases a Color Popularity Report which provides the percentages
of car colors in North America. The most recent report is shown in the following table.
A random sample of cars was selected and the colors were recorded and shown in the
following table.
Using the α = 0.10, does this sample provide enough evidence to support Diller and
Fisher’s belief about the probability distribution?
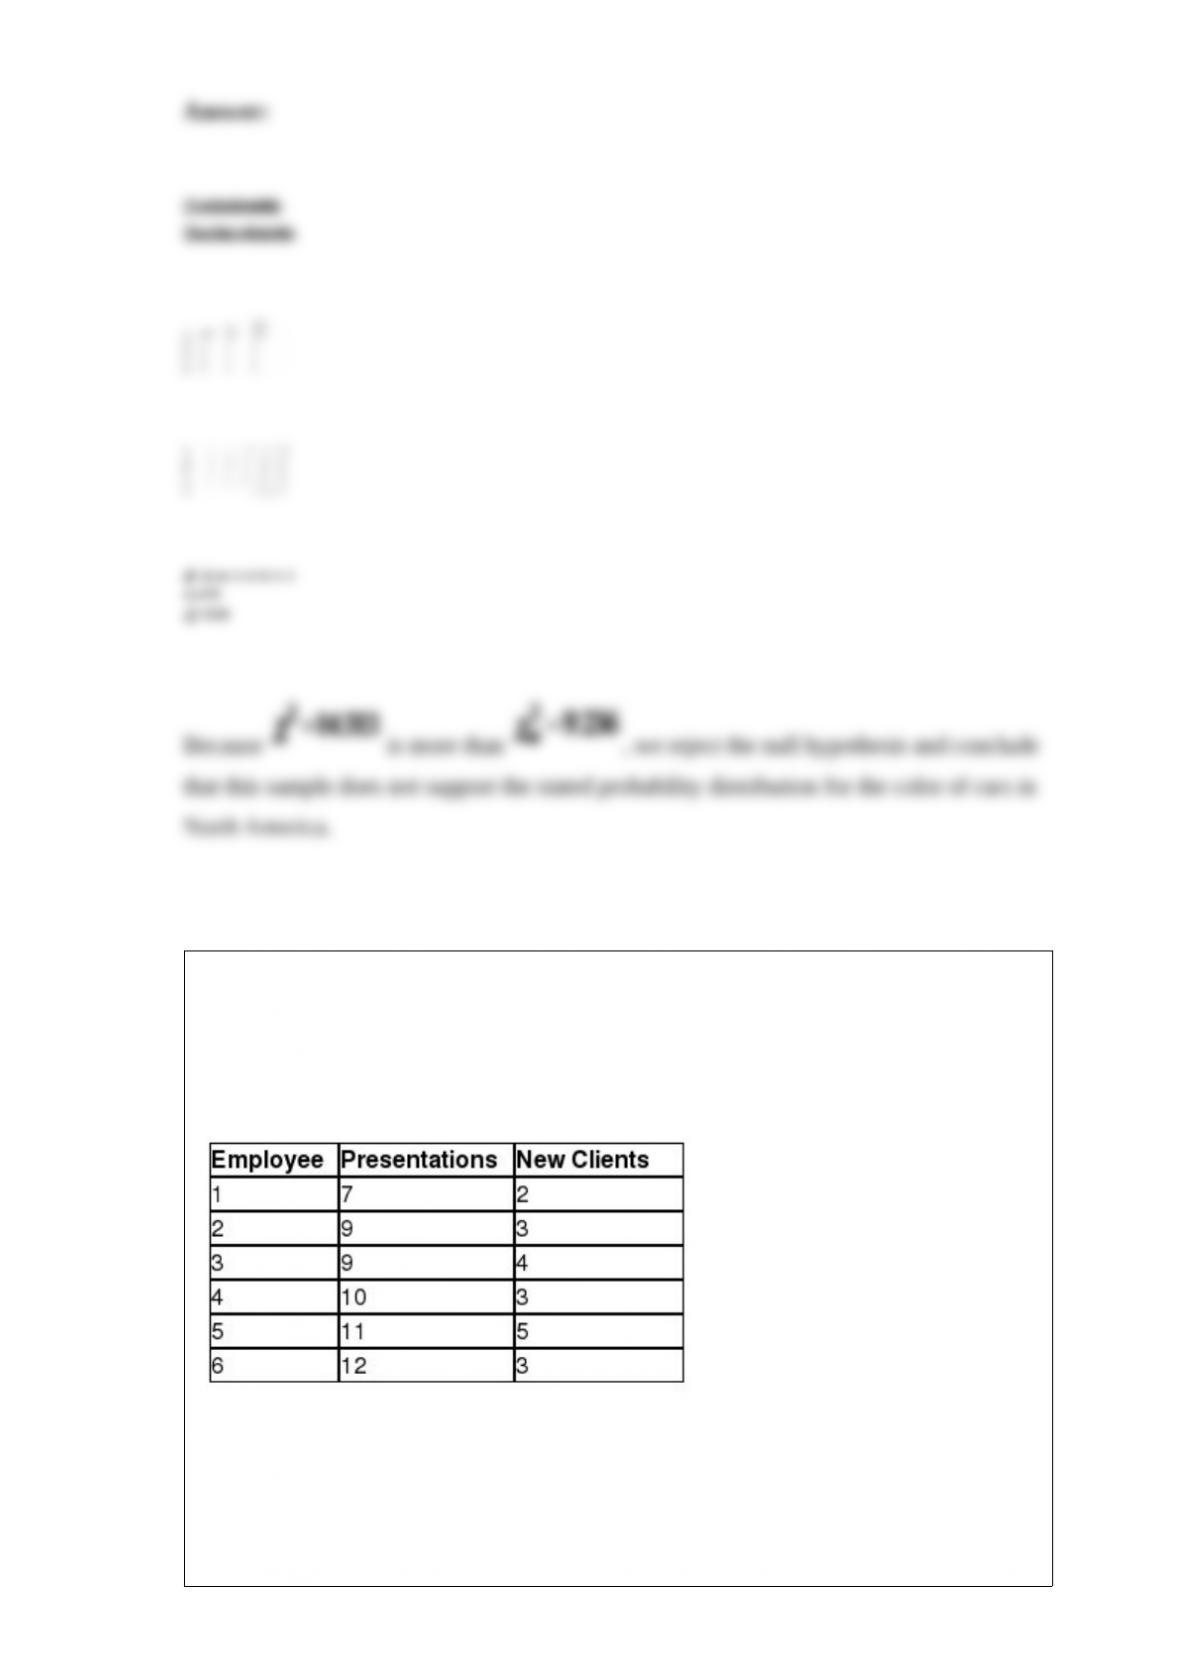
Sarah is the office manager for a group of financial advisors who provide financial
services for individual clients. She would like to investigate whether a relationship
exists between the number of presentations made to prospective clients in a month and
the number of new clients per month. The following table shows the number of
presentations and corresponding new clients for a random sample of six employees.
Sarah would like to use simple regression analysis to estimate the number of new
clients per month based on the number of presentations made by the employee per
month. The 90% confidence interval that estimates the average number of new clients
per month for an employee who makes nine presentations per month is ________.
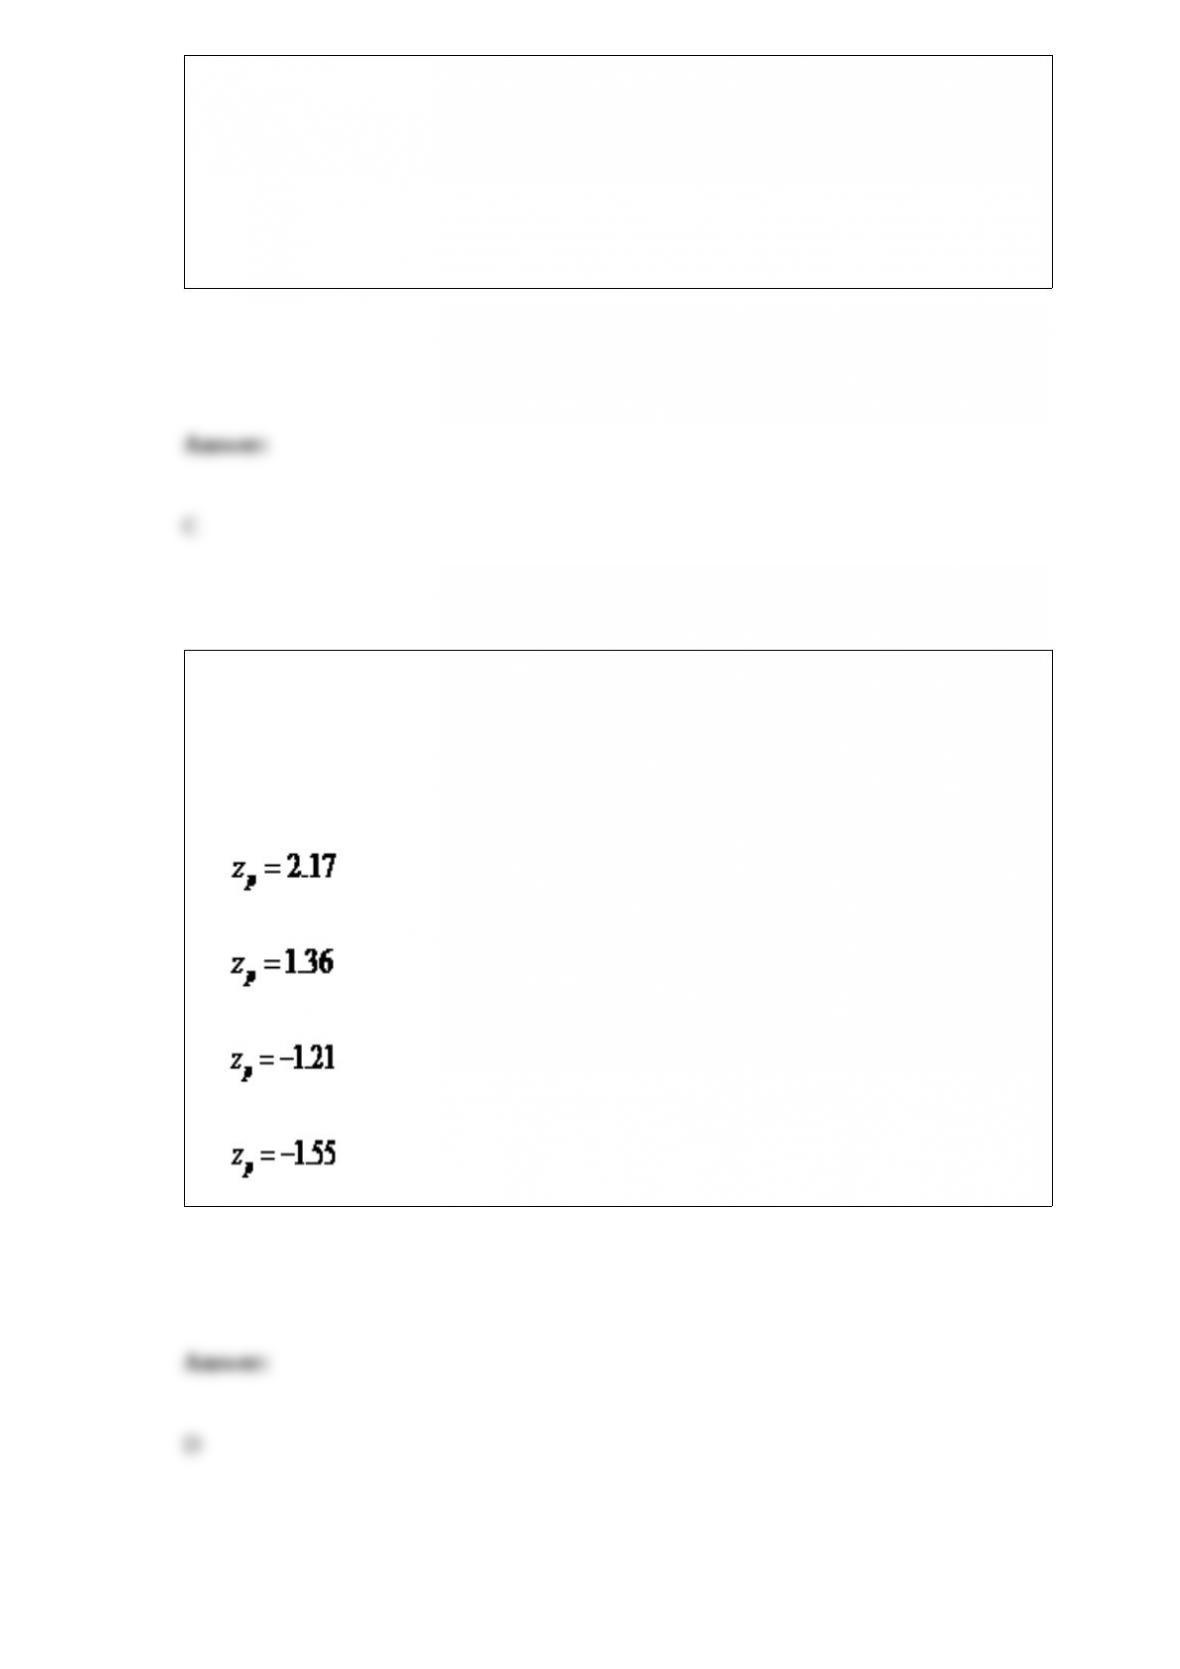
A) (2.90, 3.97)
B) (2.56, 4.31)
C) (2.20, 4.06)
D) (1.91, 4.96)
The National Center for Education Statistics would like to test the hypothesis that the
proportion of Bachelor’s degrees that were earned by women equals 0.60. A random
sample of 140 college graduates with Bachelor degrees found that 75 were women. The
National Center for Education Statistics would like to set α = 0.10. The test statistic for
this hypothesis test would be ________.
A)
B)
C)
D)
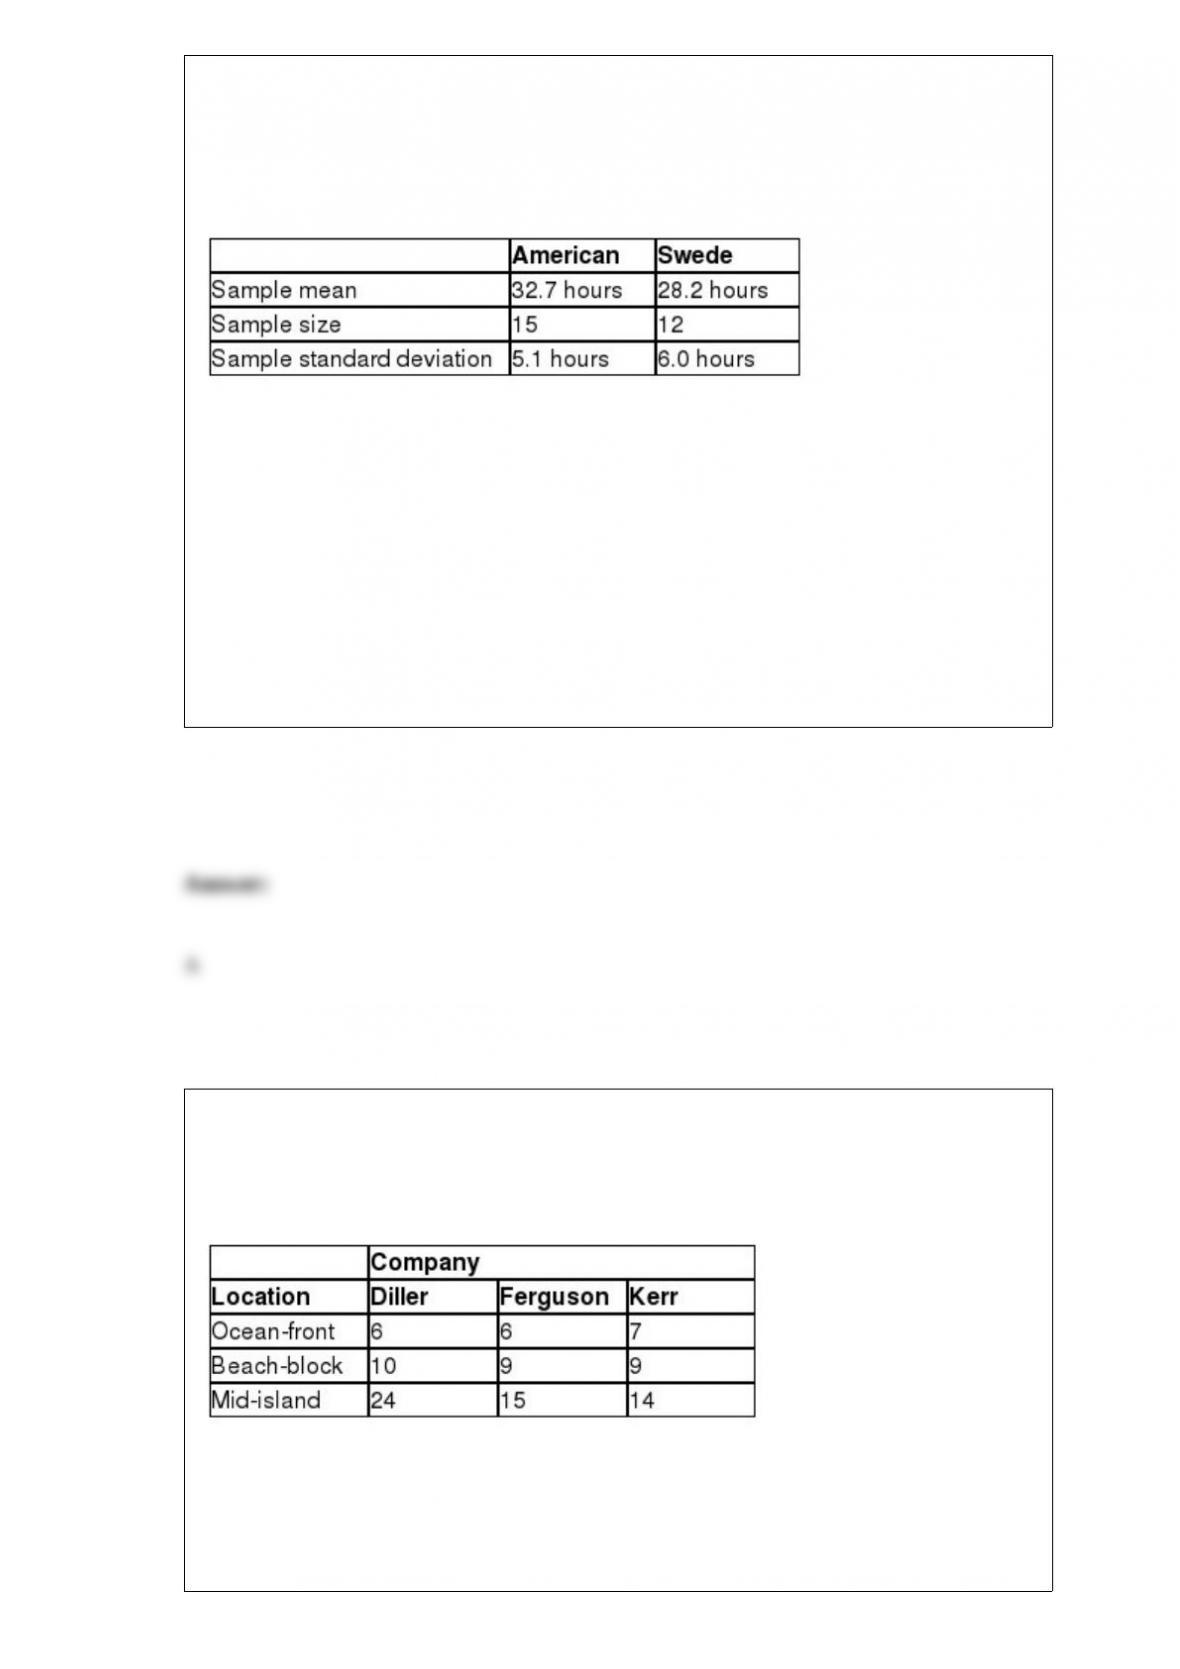
You have been assigned to test the hypothesis that the average number of hours per
week that an American works is higher than the average number of hours per week that
a Swede works. The following data summarizes the sample statistics for the number of
hours worked per week for workers in each country. Assume that the population
variances are unequal.
If Population 1 is defined as American workers and Population 2 is defined as Swedish
workers, the degrees of freedom for this hypothesis test are ________.
A) 21
B) 25
C) 26
D) 27
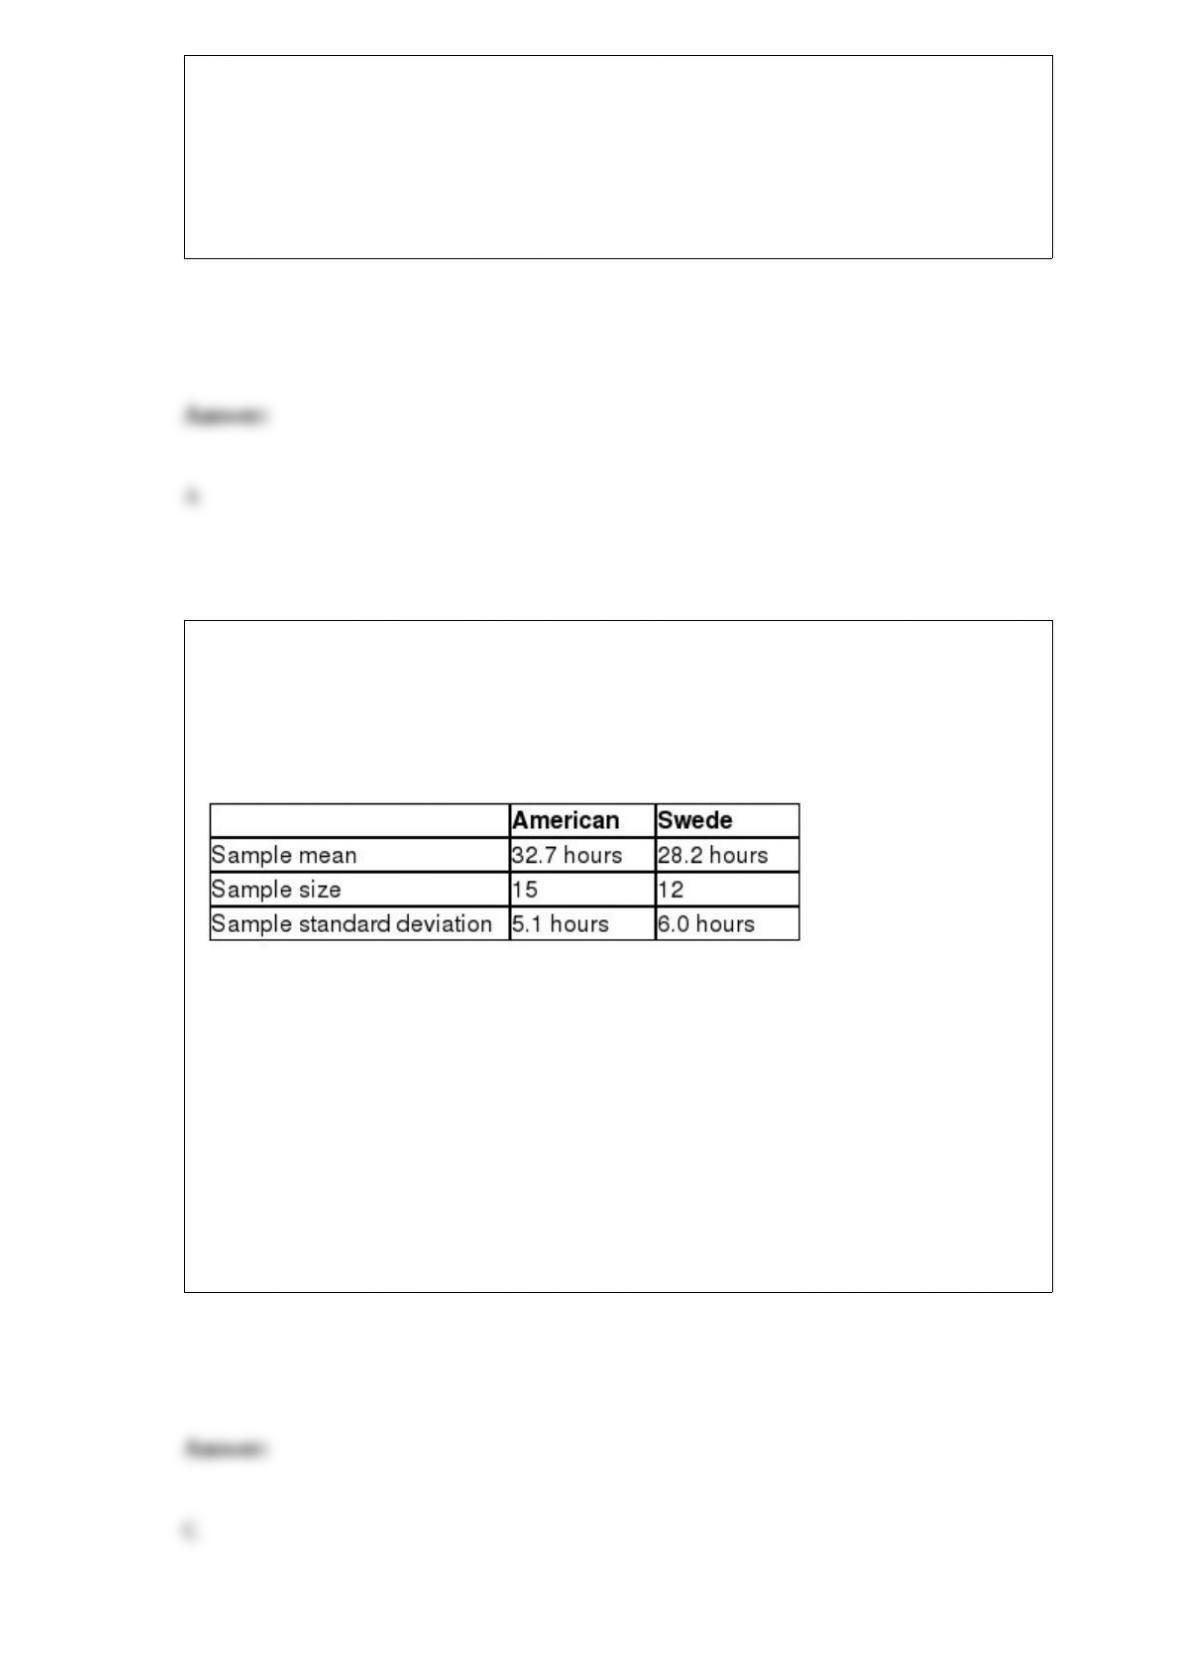
A beach community on a barrier island has three real estate companies that list rental
properties by location which are classified as ocean-front, beach-block, or mid-island.
The following contingency table shows the number of properties listed by each
company along with their location.
The expected number of listings for Ferguson that are an ocean-front location is
________.
A) 5.7
B) 7.6
C) 11.2
D) 21.2
You have been assigned to test the hypothesis that the average number of hours per
week that an American works is higher than the average number of hours per week that
a Swede works. The following data summarizes the sample statistics for the number of
hours worked per week for workers in each country. Assume that the population
variances are unequal.
If Population 1 is defined as American workers and Population 2 is defined as Swedish
workers, the p-value for this hypothesis test would be between ________.
A) 0.005 and 0.01
B) 0.01 and 0.025
C) 0.025 and 0.05
D) 0.05 and 0.10

In ________ sampling, we divide the population into mutually exclusive groups and
randomly sample from each of these groups.
A) stratified
B) cluster
C) probability
D) simple random
Class ________ are the number of observations for each class of a frequency
distribution using grouped quantitative data.
A) boundaries
B) frequencies
C) widths
D) numbers
Progressive Insurance would like to test the hypothesis that a difference exists in the
proportion of students in 12th grade who text while driving when compared to the
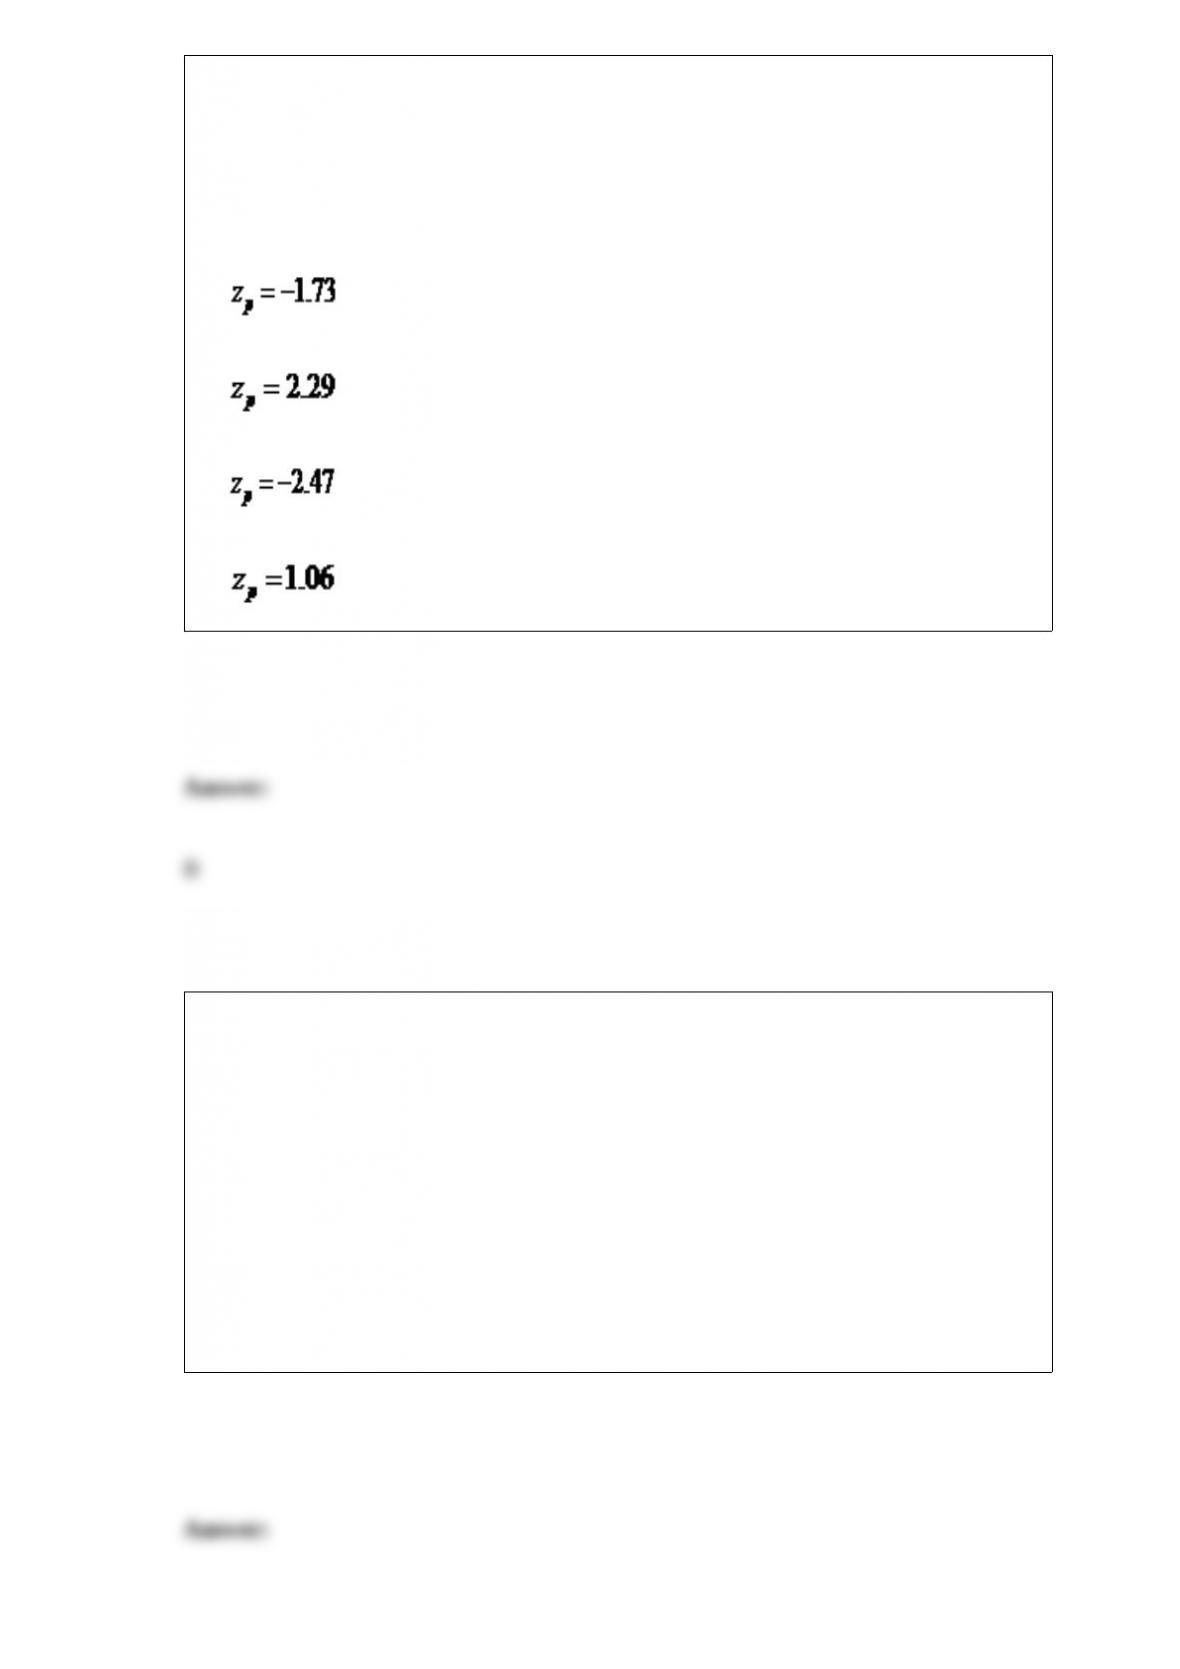
proportion of 11th grade drivers who text. A random sample of 160 12th grade students
found that 84 texted while driving. A random sample of 175 11th grade students found
that 70 texted while driving. If Population 1 is defined as 12th grade drivers and
Population 2 is defined as 11th grade drivers, the test statistic for this hypothesis test
would be ________.
A)
B)
C)
D)
A statistics class at Wilmington College has 25 students of which 15 are math majors
and 10 are business majors. The professor randomly selects five students to work
together on a group project. What is the standard deviation of this probability
distribution if selecting a business major is defined as a success?
A) 0.255
B) 0.850
C) 1.000
D) 1.507
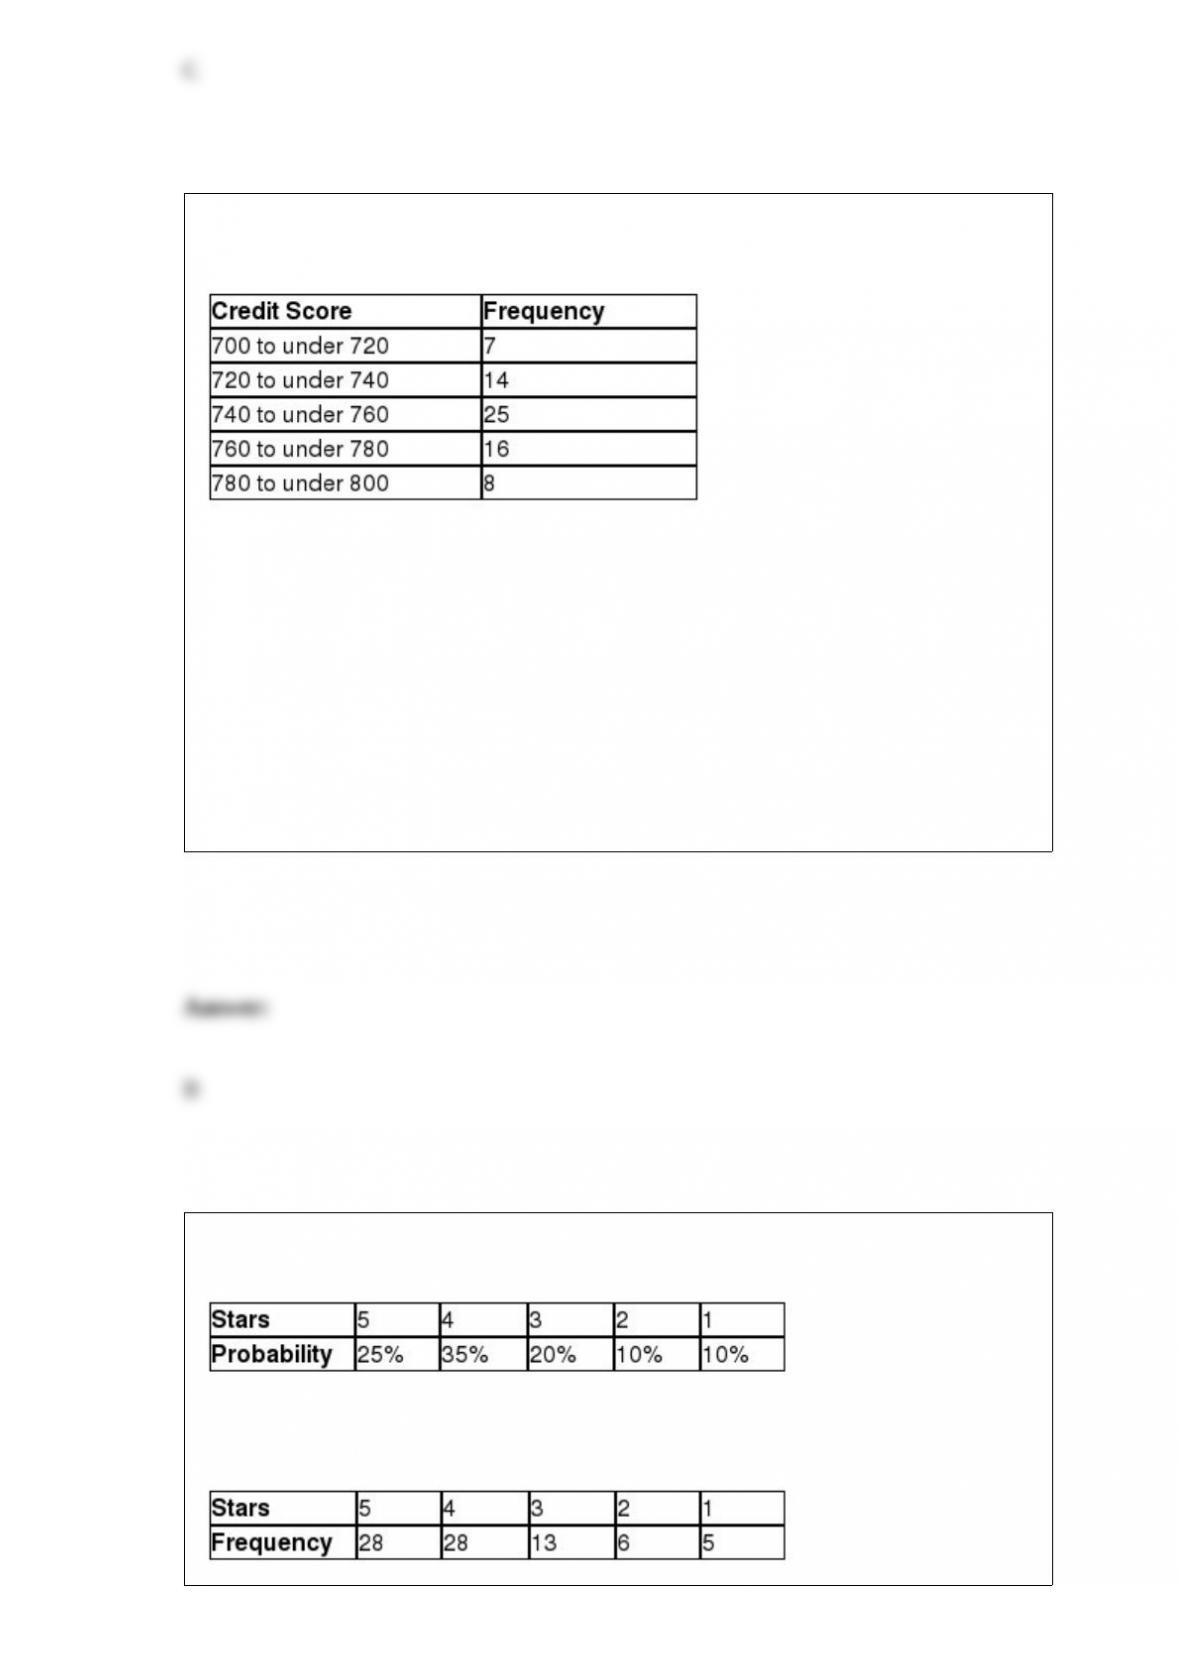
The following table shows the frequency distribution of the credit scores for a random
sample of homeowners who recently refinanced their mortgage at Delaware Bank.
The probability that a randomly homeowner has a credit score of 720 to under 740 is
________.
A) 0.114
B) 0.200
C) 0.520
D) 0.566
The following data represent the discrete probability distribution for the number of stars
that reviewers gave a first edition statistics reference book.
The second edition of this reference book has been released and a random sample of
people that have purchased the book has been collected with the following results.

The publisher would like to know if the probability distribution for reviews has changed
from the first edition to the second edition using α = 0.025. The test statistic for this
sample is ________.
A) 2.89
B) 5.39
C) 9.12
D) 10.40
Which of the following is not a rule for constructing a frequency distribution using
grouped quantitative data?
A) Use equal-size classes.
B) Use mutually exclusive classes.
C) Avoid empty classes.
D) Avoid close-ended classes.
Expedia would like to test the hypothesis that the average roundtrip airfare between
Philadelphia and Paris is higher for a flight originating in Philadelphia when compared
to a flight originating in Paris. The following data summarizes the sample statistics for

roundtrip flights originating in both cities. Assume that the population variances are
equal.
If Population 1 is defined as flights originating in Philadelphia and Population 2 is
defined as flights originating in Paris, which one of the following statements is true?
A) Because the 90% confidence interval includes zero, Expedia cannot conclude that
the average roundtrip airfare between Philadelphia and Paris is higher for a flight
originating in Philadelphia when compared to a flight originating in Paris.
B) Because the 90% confidence interval does not include zero, Expedia cannot
conclude that the average roundtrip airfare between Philadelphia and Paris is higher for
a flight originating in Philadelphia when compared to a flight originating in Paris.
C) Because the 90% confidence interval includes 0, Expedia can conclude that the
average roundtrip airfare between Philadelphia and Paris is higher for a flight
originating in Philadelphia when compared to a flight originating in Paris.
D) Because the 90% confidence interval does not include 0, Expedia can conclude that
the average roundtrip airfare between Philadelphia and Paris is higher for a flight
originating in Philadelphia when compared to a flight originating in Paris.
When the population standard deviations are not known to us when comparing two
population means, we substitute the sample standard deviations in their place. When we
make this substitution, we rely on the ________ to conduct the hypothesis test.
A) normal distribution
B) binomial distribution
C) Student’s t-distribution
D) uniform distribution
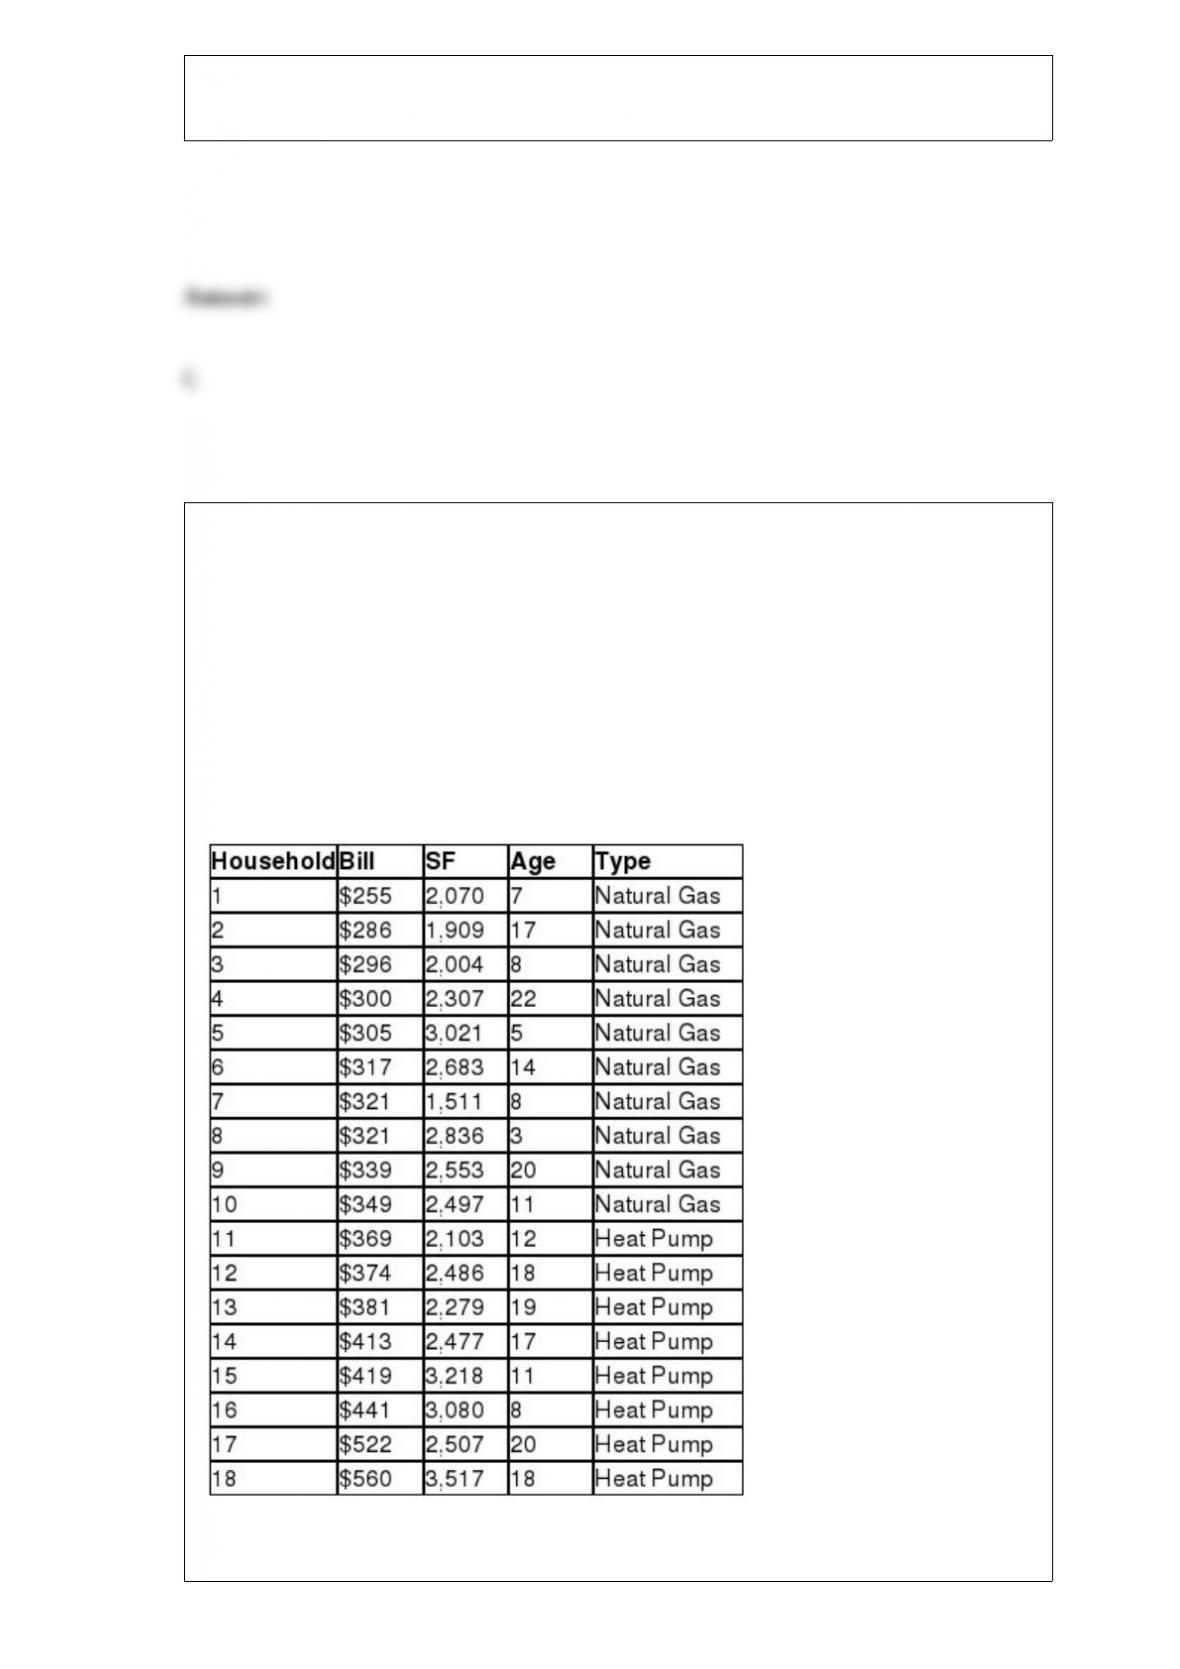
Use the following information to answer the question(s) below.
Delmarva Power is a utility company that would like to predict the monthly heating bill
for a household in Kent County during the month of January. A random sample of 18
households in the county were selected and their January heating bill recorded. This
data is shown in the table below along with the square footage of the house (SF), the
age of the heating system in years (Age,) and the type of heating system (heat pump = 1
or natural gas = 0).
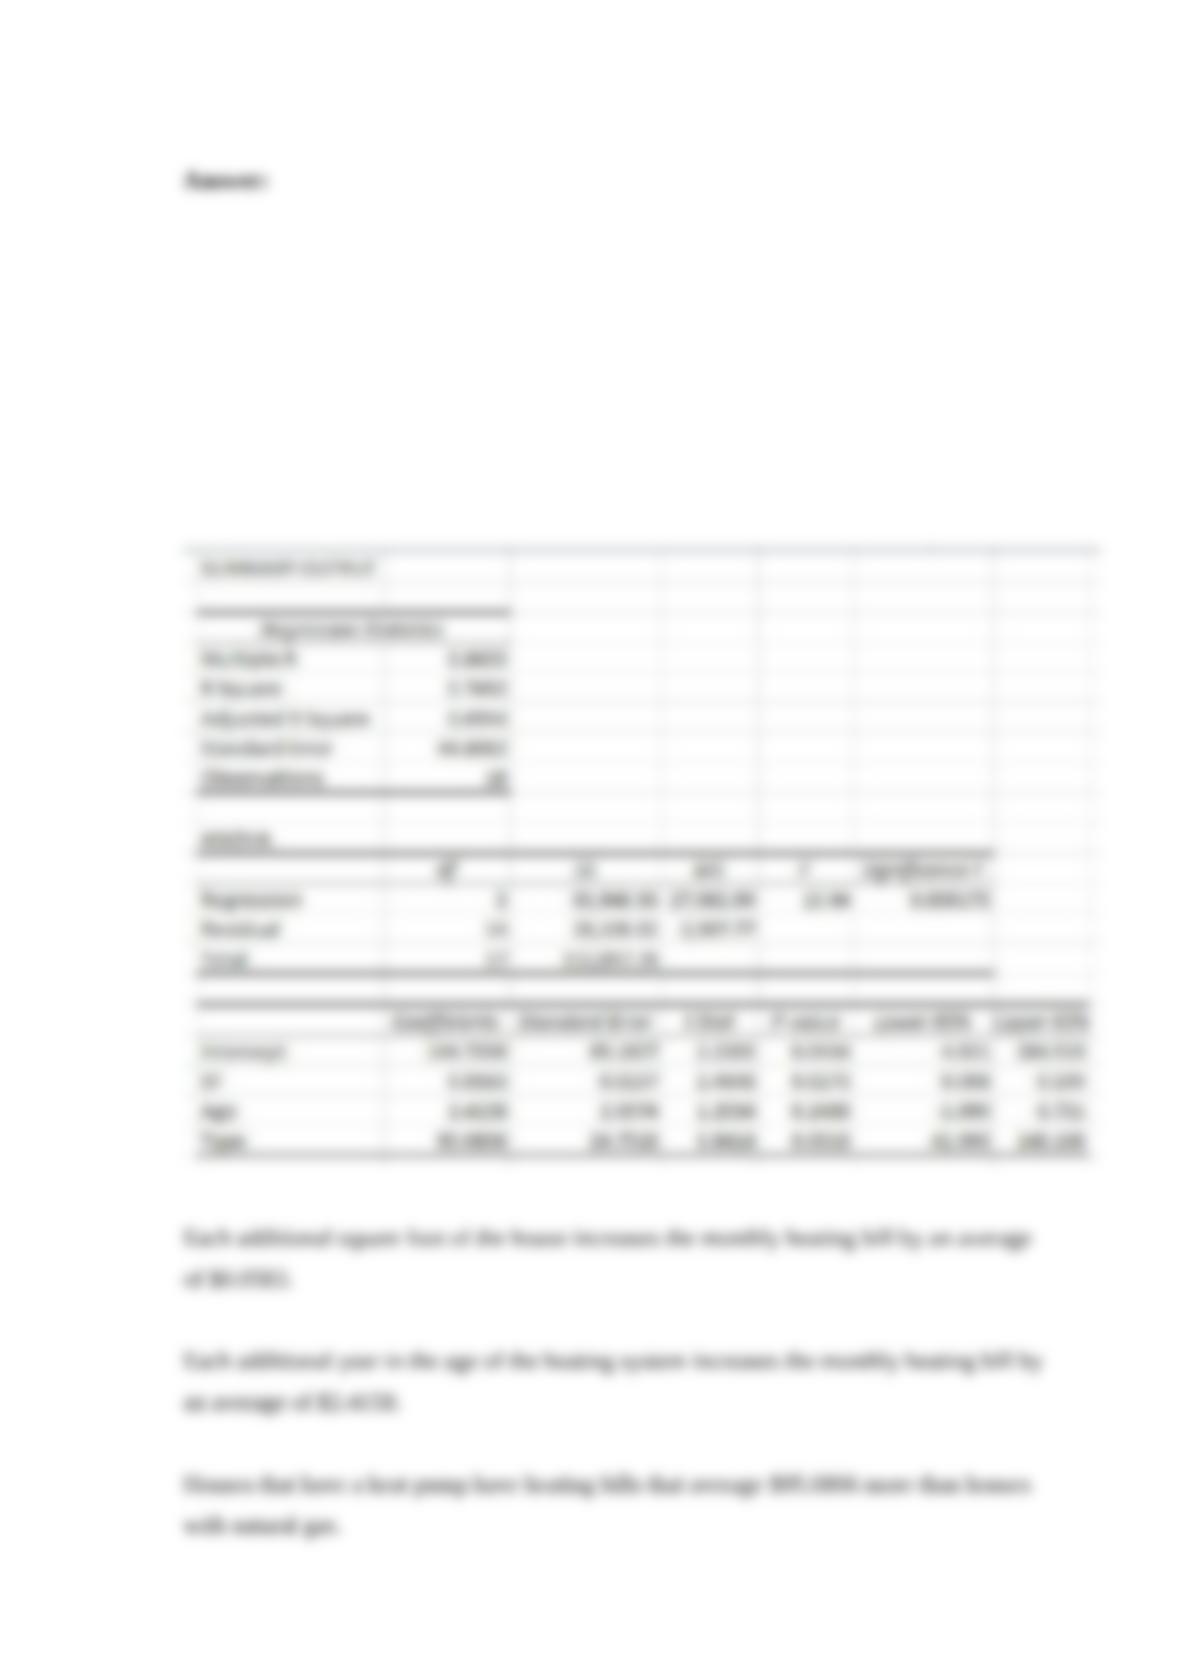
Interpret the meaning of the regression coefficients for the heating bill model.
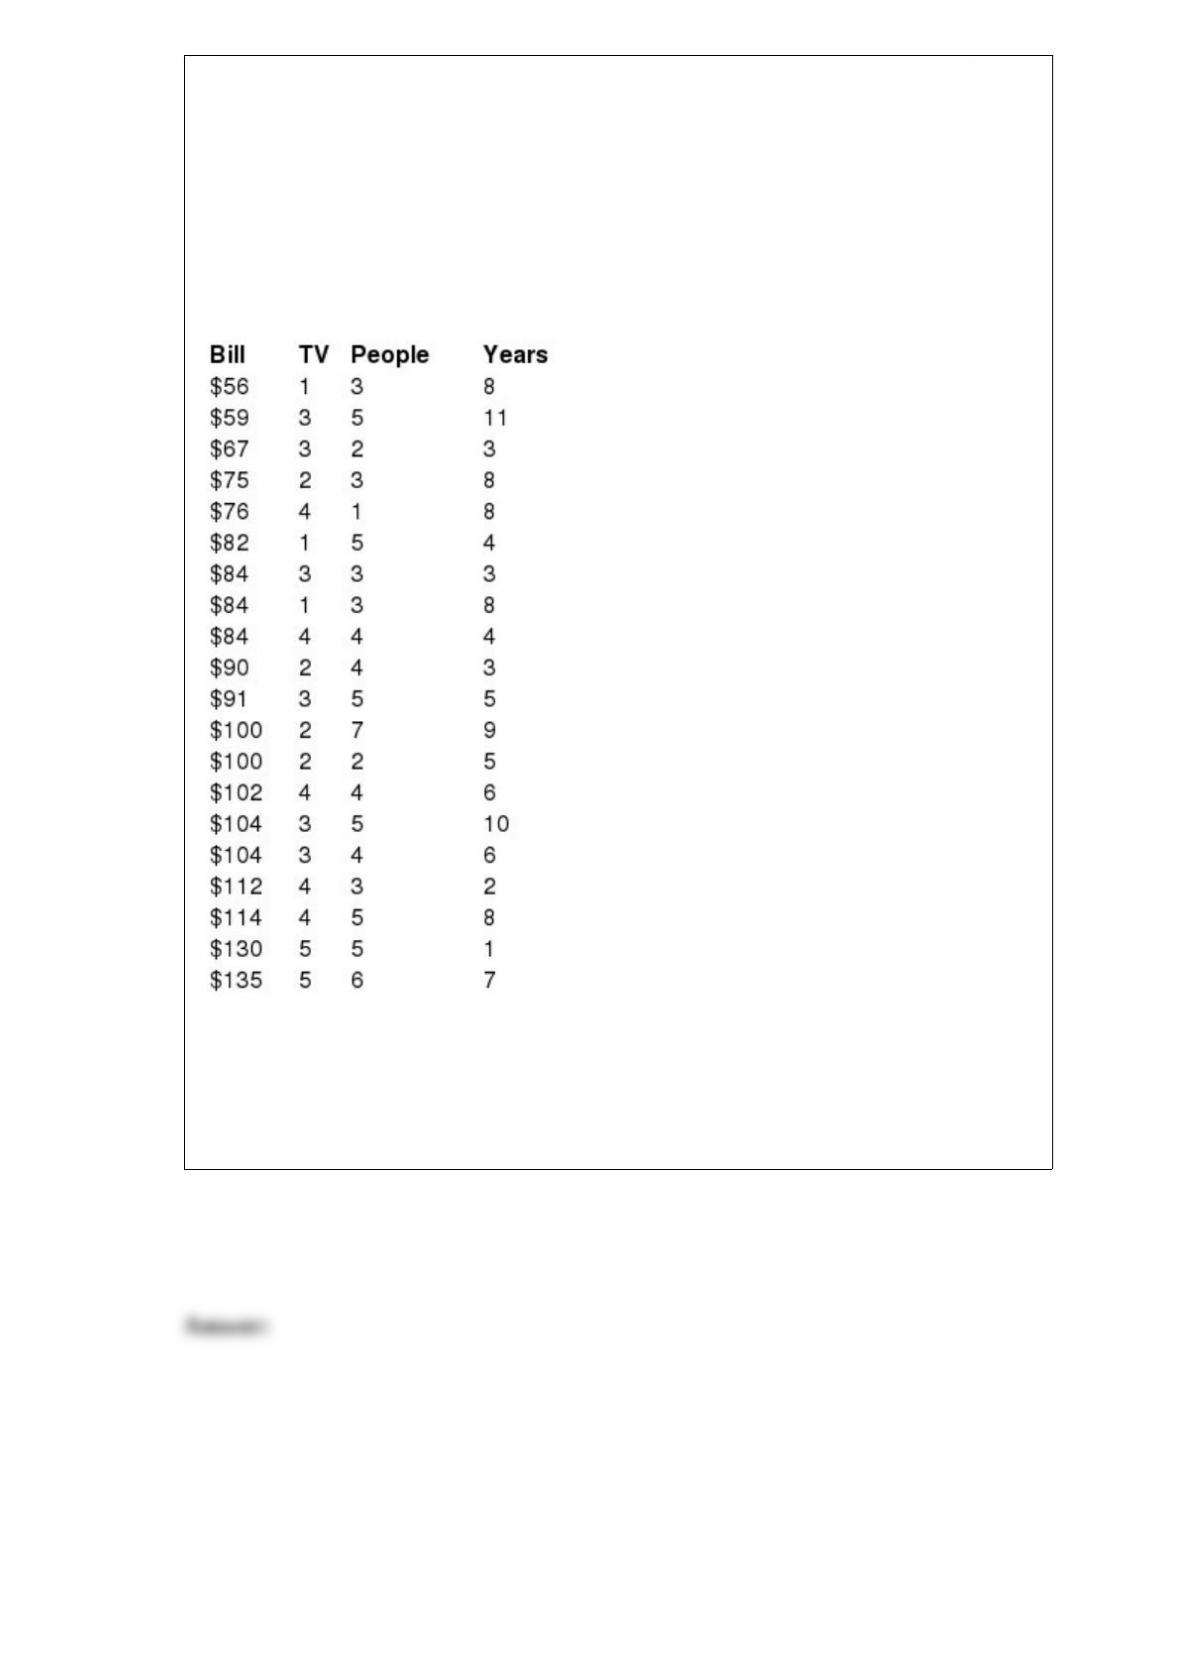
Use the following information to answer the question(s) below.
The following data provides the monthly Comcast cable bill for a random sample of 20
households along with the number of televisions in the household (TV), the number of
people living in the household (People), and the number of years that household has
been a Comcast customer (Years).
Develop a regression equation that will predict the monthly Comcast cable bill for a
household based on the number of televisions in the household, the number of people
living in the household, and the number of years that household has been a Comcast
customer.
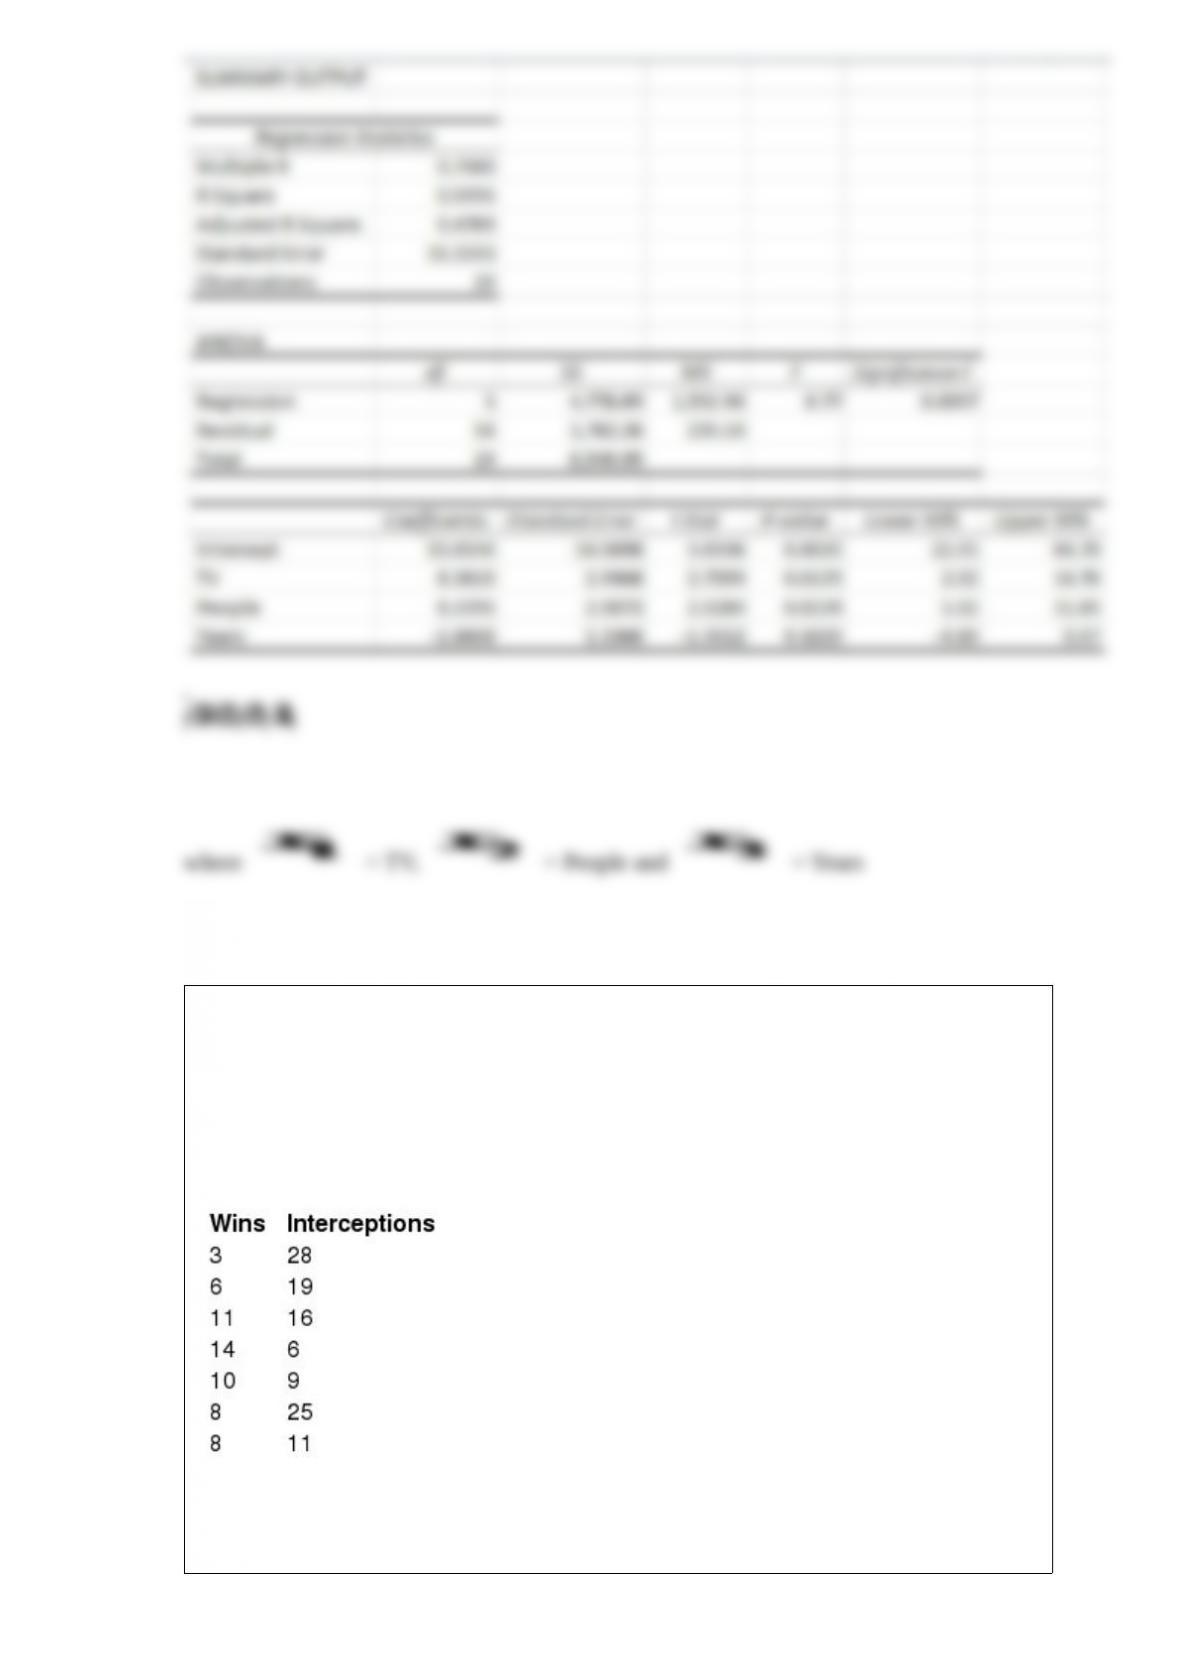
Use the information below to answer the following question(s).
The table below shows the number of interceptions thrown during the season by seven
randomly selected National Football League teams and the number of games those
teams won during the season.
Use the NFL team data to determine the 95% confidence interval for the slope and
interpret the results.
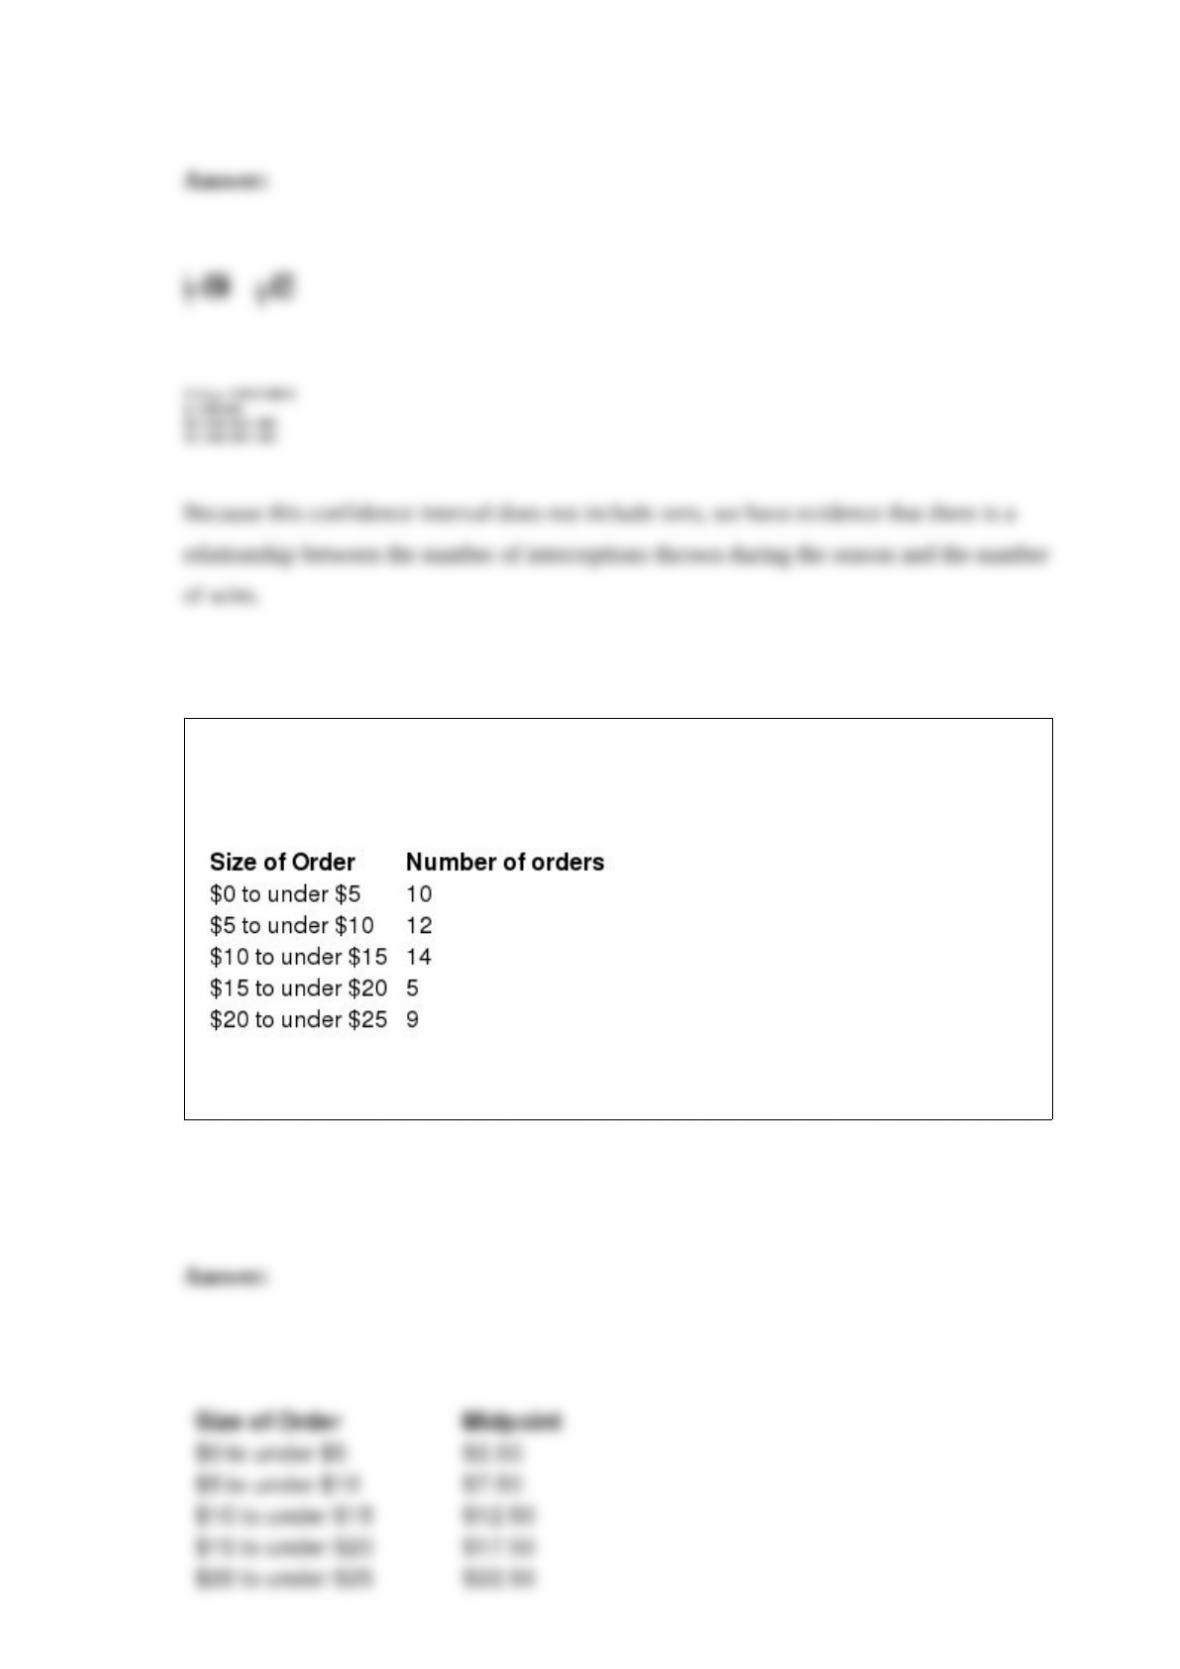
Avalon Bagel provides take-out service for a variety of breakfast items. The following
table shows the number of orders that have been recently placed grouped by the size of
the order in dollars.
What is the approximate variance for the order size for this sample?
AT&T would like to test the hypothesis that the average revenue per retail user for
Verizon Wireless customers equals $50. A random sample of 32 Verizon Wireless
customers provided an average revenue of $54.70. It is believed that the population
standard deviation for the revenue per retail user is $11.00. AT&T would like to set α =
0.05. Use the critical value approach to test this hypothesis.
A random sample of 20 cars was selected. The following table shows the number of
cars grouped by age in years.
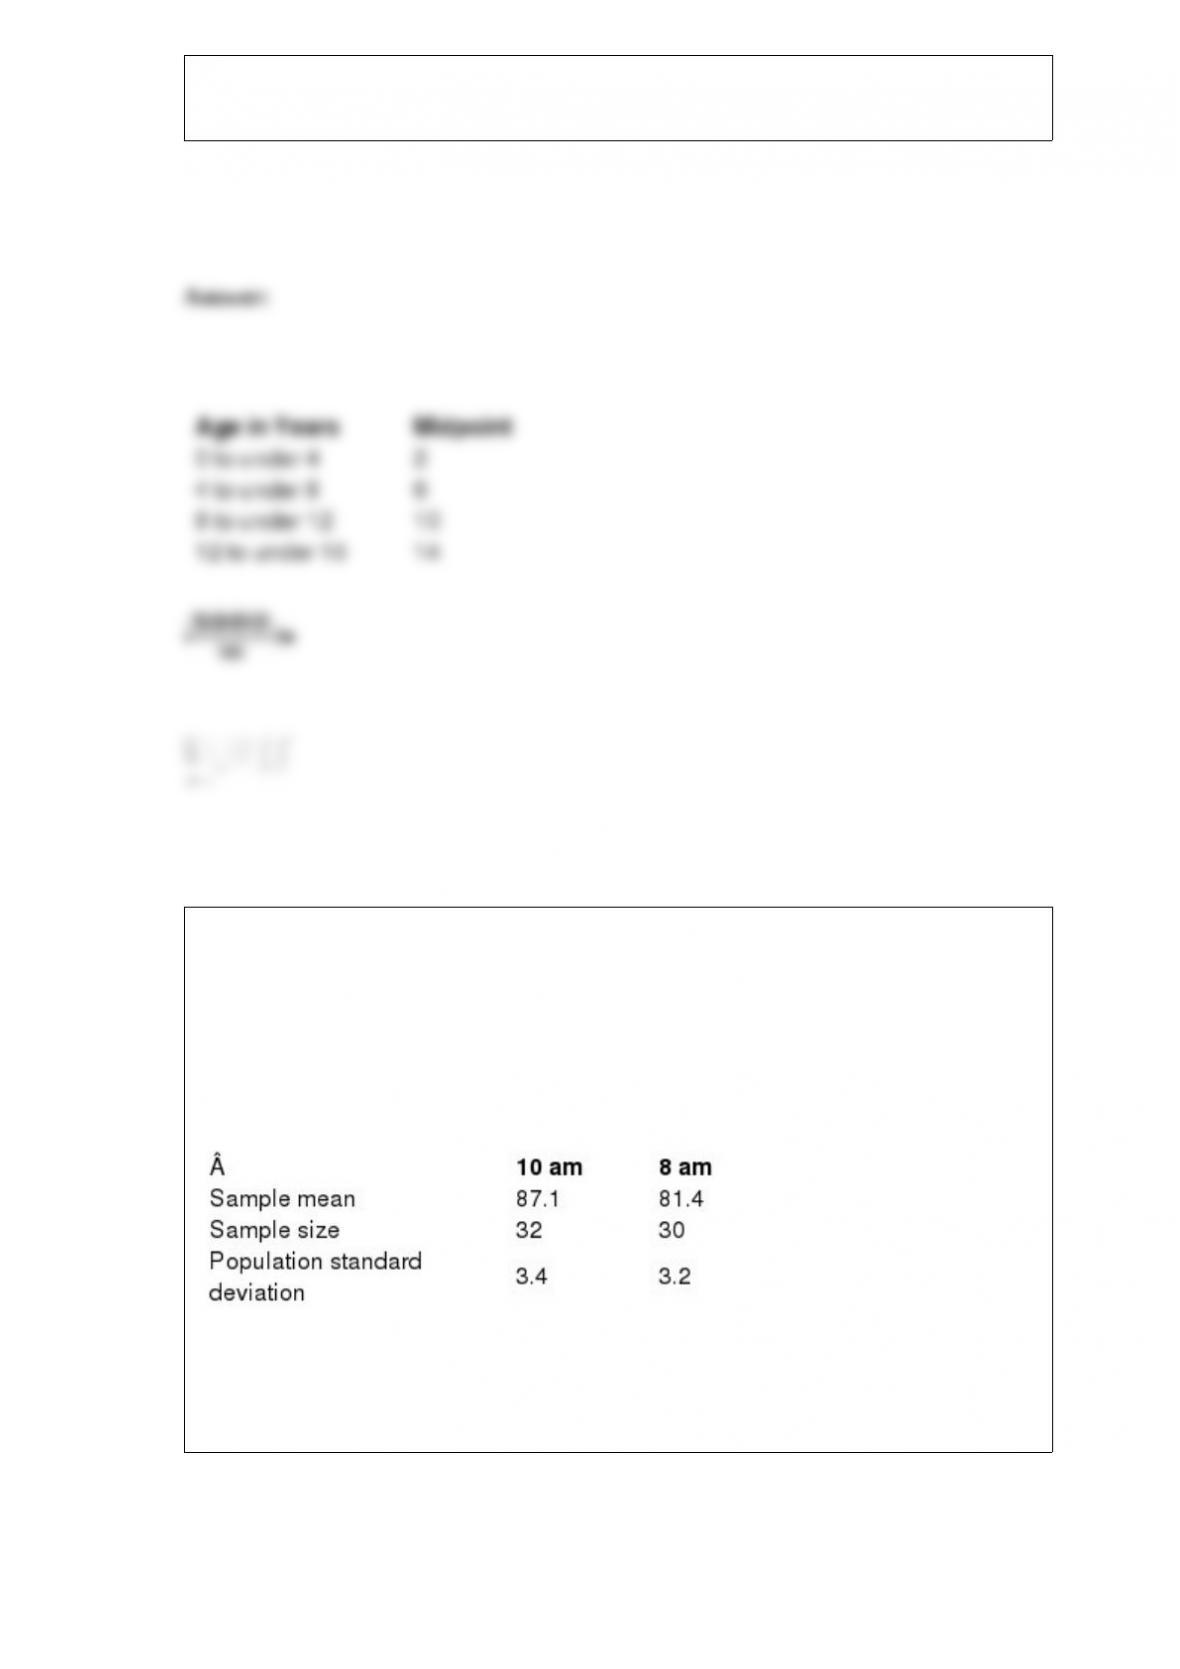
What is the approximate standard deviation for the age of cars from this sample?
A professor would like to test the hypothesis that the average grade for a student taking
a 10 am statistics class averages five points higher than the average grade from a
student in an 8 am statistics class. The following data shows the sample size and
average grades for students in the two class times along with the population standard
deviations.
Define Population 1 is defined as the 10 am class and Population 2 the 8 am class and
use the critical value approach to test this hypothesis with α = 0.10.

Candy Kitchen sells chocolate nonpareils in 8 oz. containers. Because the candy pieces
are not uniform, the weight of each individual container varies slightly. A random
sample of nine containers was weighed on a precision scale and the results are shown
below:
8.09 8.20 8.03 7.86 7.87 8.06 8.43 7.99 8.08
Determine the interquartile range for this sample. Are there any outliers in this data set?
The manager of a kiosk in a shopping mall that sells smartphone cases would like to
determine if the number of customers who make a purchase over a 15-minute time
interval follows the Poisson distribution. He randomly sampled 150 15-minute intervals
and recorded the number of purchases. The data is shown below.
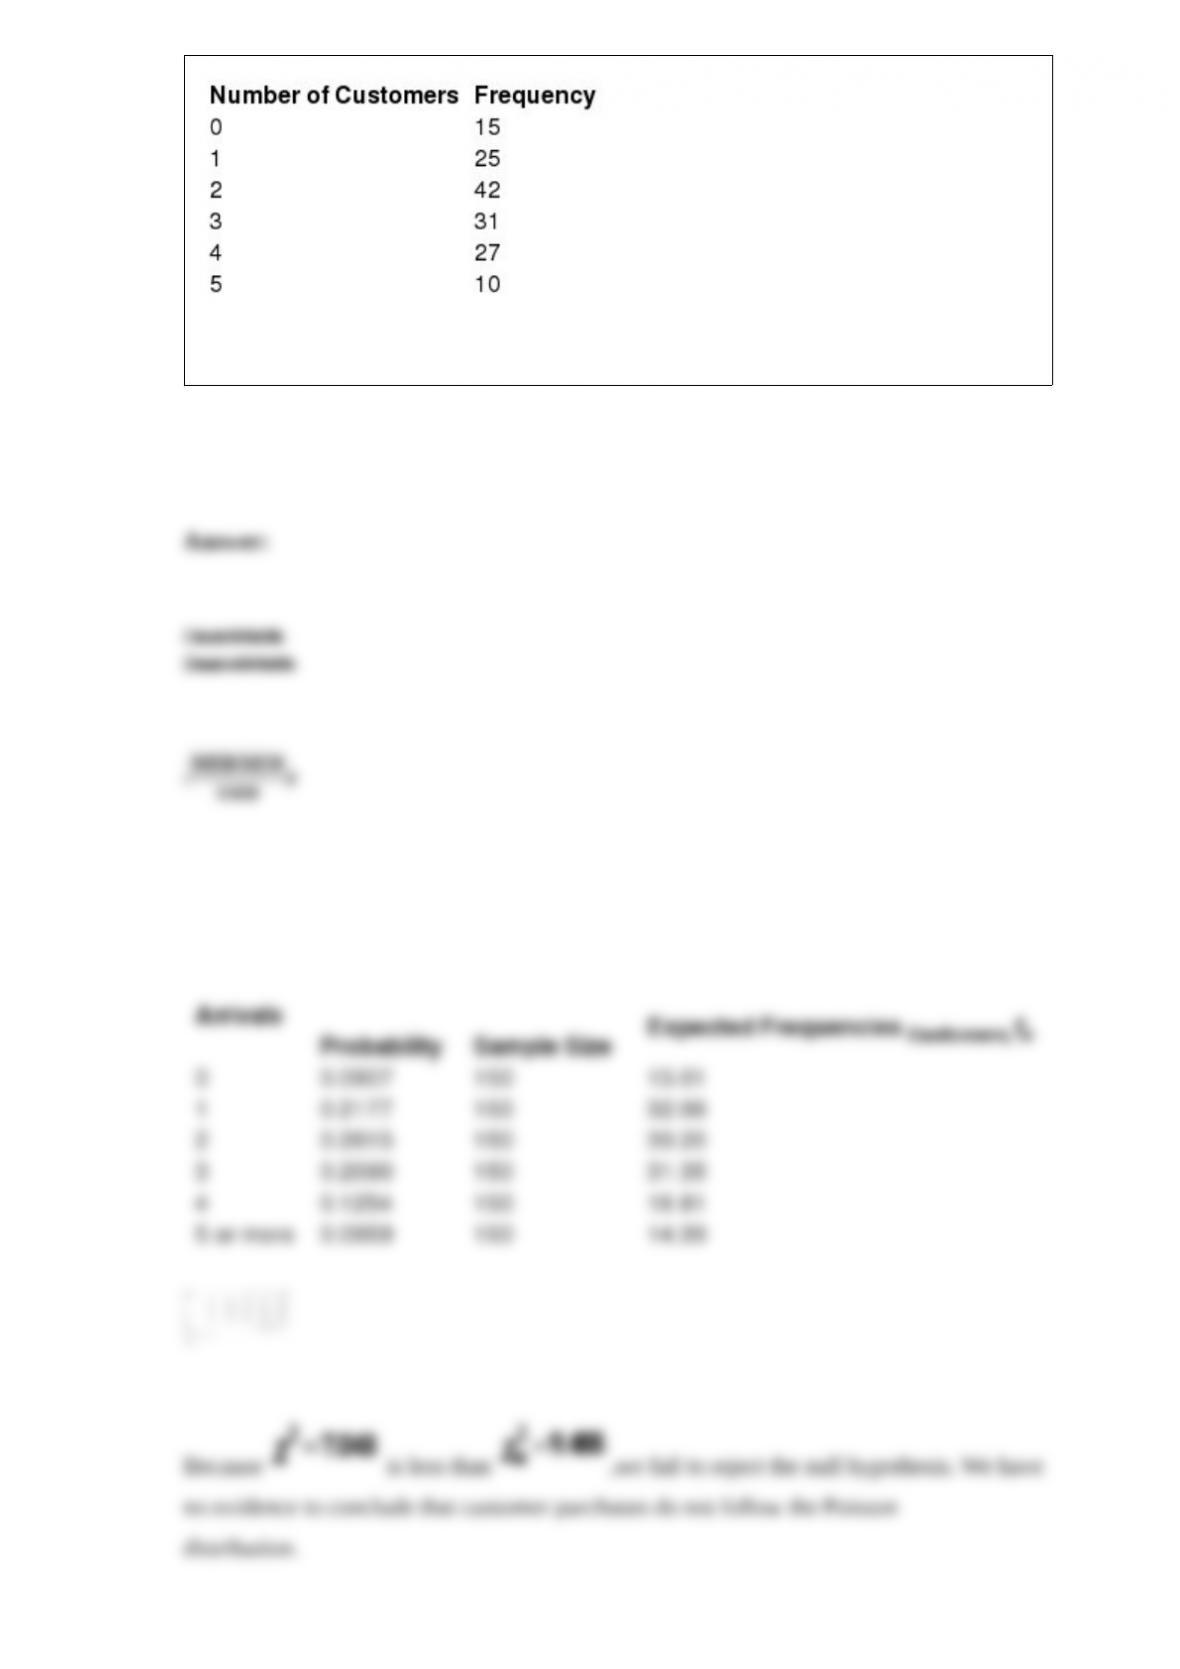
Perform this hypothesis test usingα = 0.05.

The following data represent a sample of games won per season by the San Francisco
49ers of the National Football League over an eight-year period.
13 6 8 7 5 7 4 2
Determine the mode of this sample.