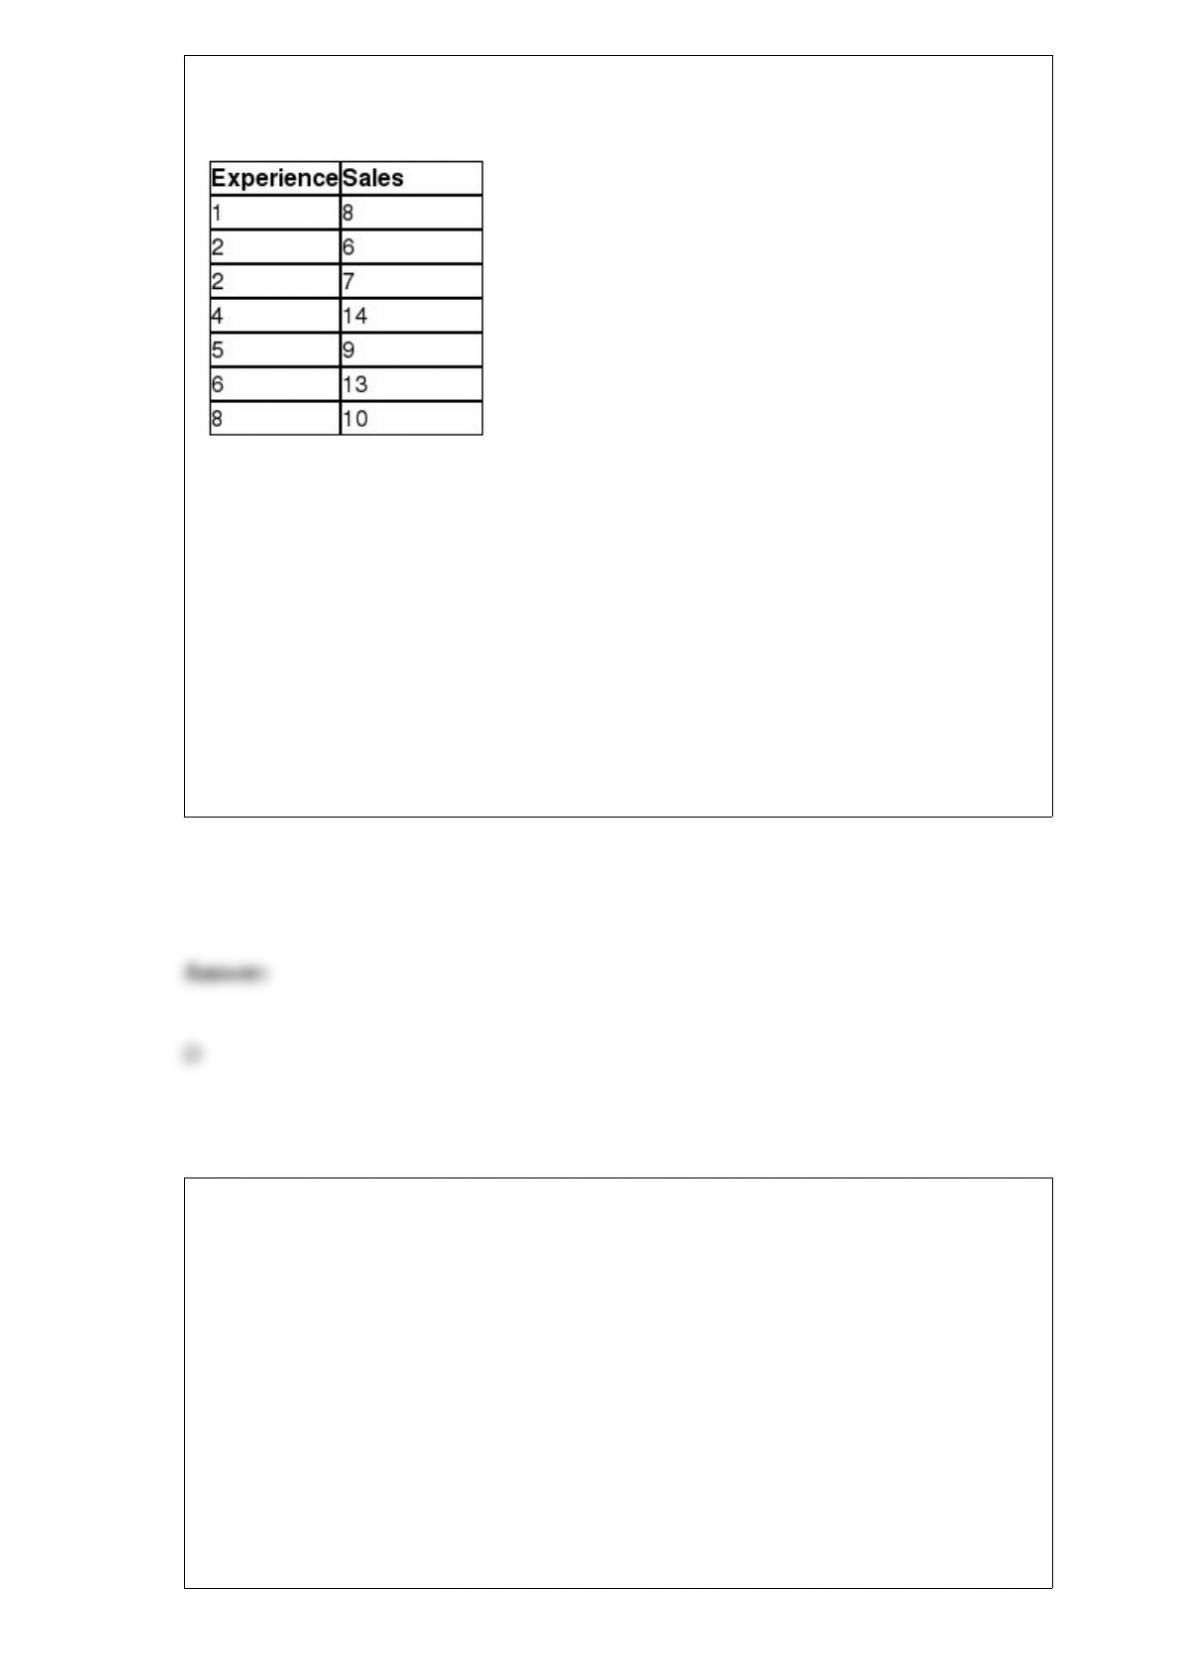
The table below shows the number of cars sold last month by seven employees at
Concord Motors and their number of years of sales experience.
Management would like to use simple regression analysis to estimate monthly car sales
using the number of years of sales experience. The 95% prediction interval that
estimates the monthly sales for an employee with 5 years of experience is ________.
A) (7.72, 12.73)
B) (5.79, 14.73)
C) (4.23, 16.23)
D) (2.64, 17.82)
The National Center for Education Statistics would like to test the hypothesis that the
proportion of Bachelor’s degrees that were earned by women equals 0.60. A random
sample of 140 college graduates with Bachelor degrees found that 75 were women. The
National Center for Education Statistics would like to set α = 0.10. The conclusion for
this hypothesis test would be that because the absolute value of the test statistic is
__________________________________.
A) more than the absolute value of the critical value, we can conclude that the
proportion of Bachelor’s degrees that were earned by women equals 0.60
B) more than the absolute value of the critical value, we can conclude that the
proportion of Bachelor’s degrees that were earned by women does not equals 0.60

C) less than the absolute value of the critical value, we cannot conclude that the
proportion of Bachelor’s degrees that were earned by women does not equals 0.60
D) less than the absolute value of the critical value, we can conclude that the proportion
of Bachelor’s degrees that were earned by women does not equals 0.60
John is the manager at a fast food restaurant and would like to determine the average
number of cars waiting for their order in the drive-through line during his hours of
operation. Every day at noontime, he counts the number of cars in the drive-through.
Because of the lunchtime traffic, his survey overestimates the actual average throughout
the day. This error is due to __________.
A) sampling error
B) nonsampling error
C) nonprobability error
D) periodicity
The ____________________ is the expected monetary value that corresponds to the
best alternative when making a decision under risk.
A) expected value of perfect information (EVPI)
B) expected value under risk (EVUR)
C) expected monetary value (EMV)
D) expected value under certainty (EVUC)
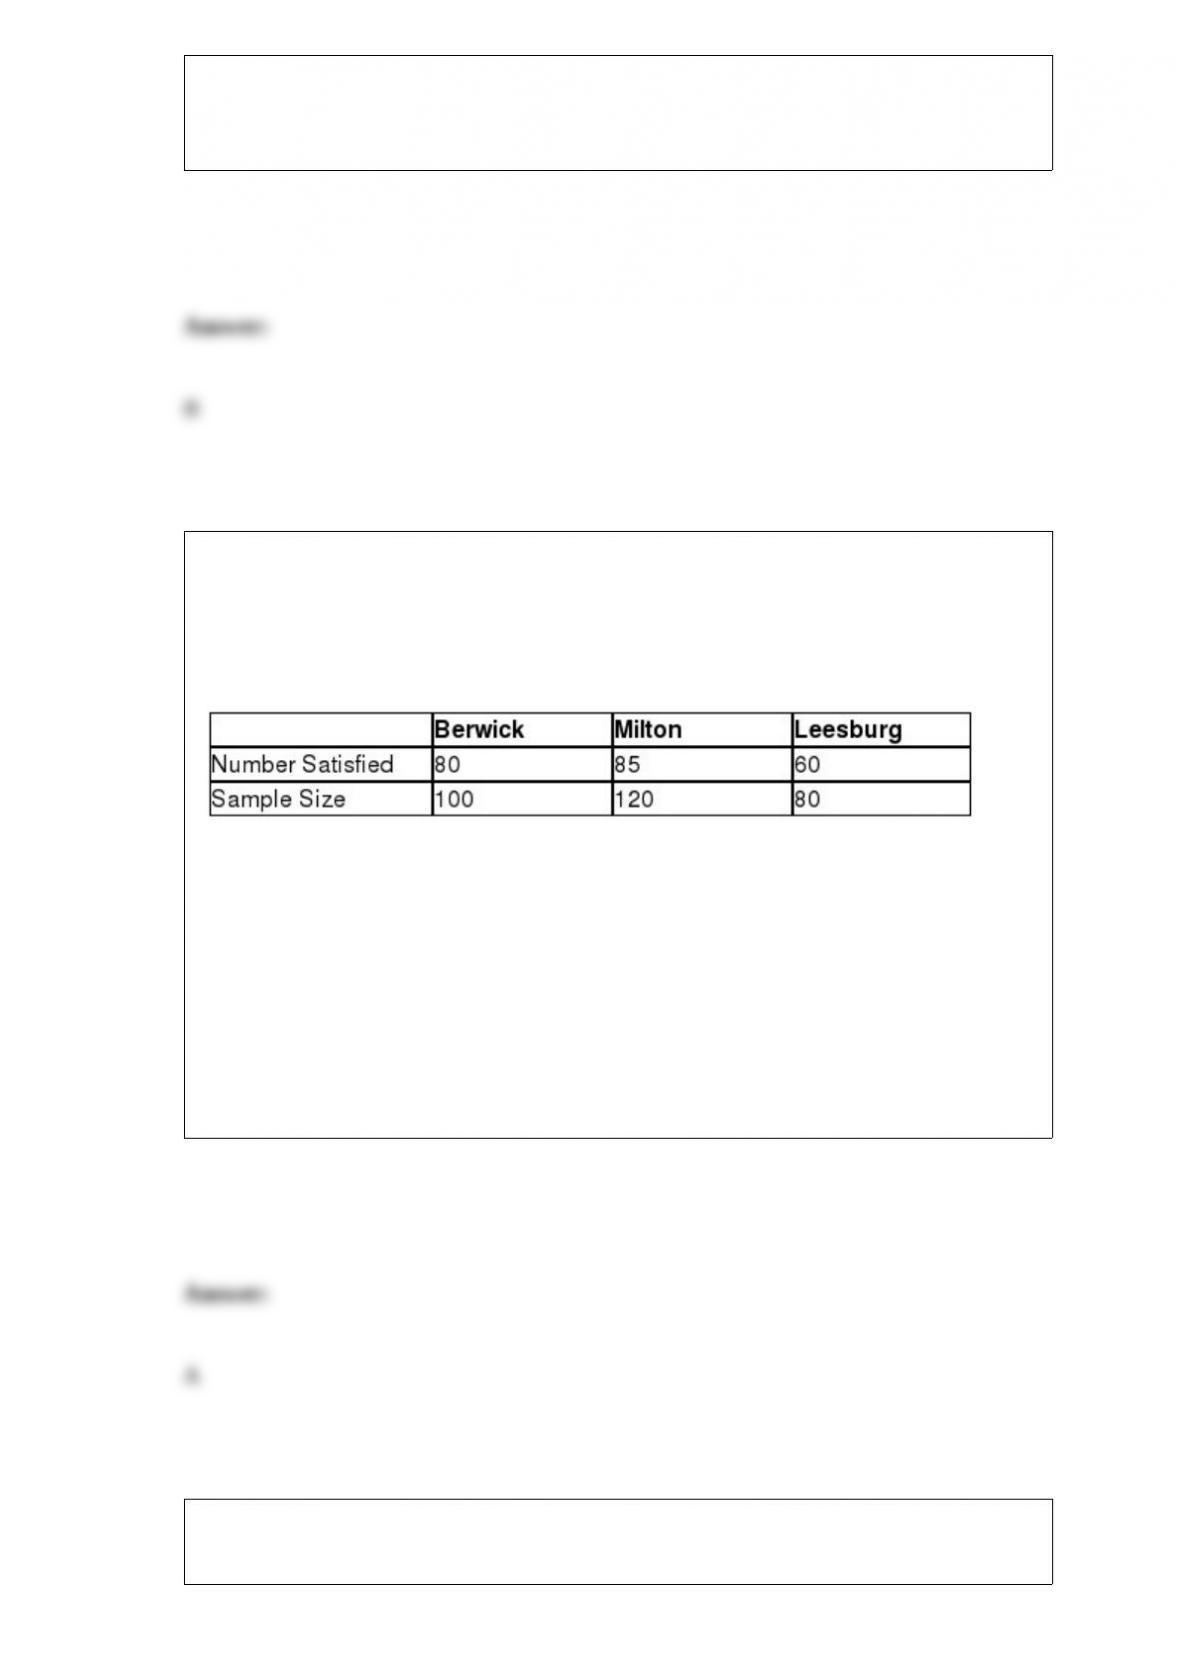
Lisa is a regional manager for a restaurant chain that has locations in the towns of
Berwick, Milton, and Leesburg. She would like to investigate if a difference exists in
the proportion of customers who rate their experience as satisfactory or better between
the three locations. The following data represent the number of customers who
indicated they were satisfied from random samples taken at each location.
The expected frequency of satisfied customers from the Leesburg sample is ________.
A) 60
B) 75
C) 80
D) 90
The Wall Street Journal reported that the average amount of time that a French person
spends eating lunch at a restaurant is 22 minutes. Perform a hypothesis test to determine
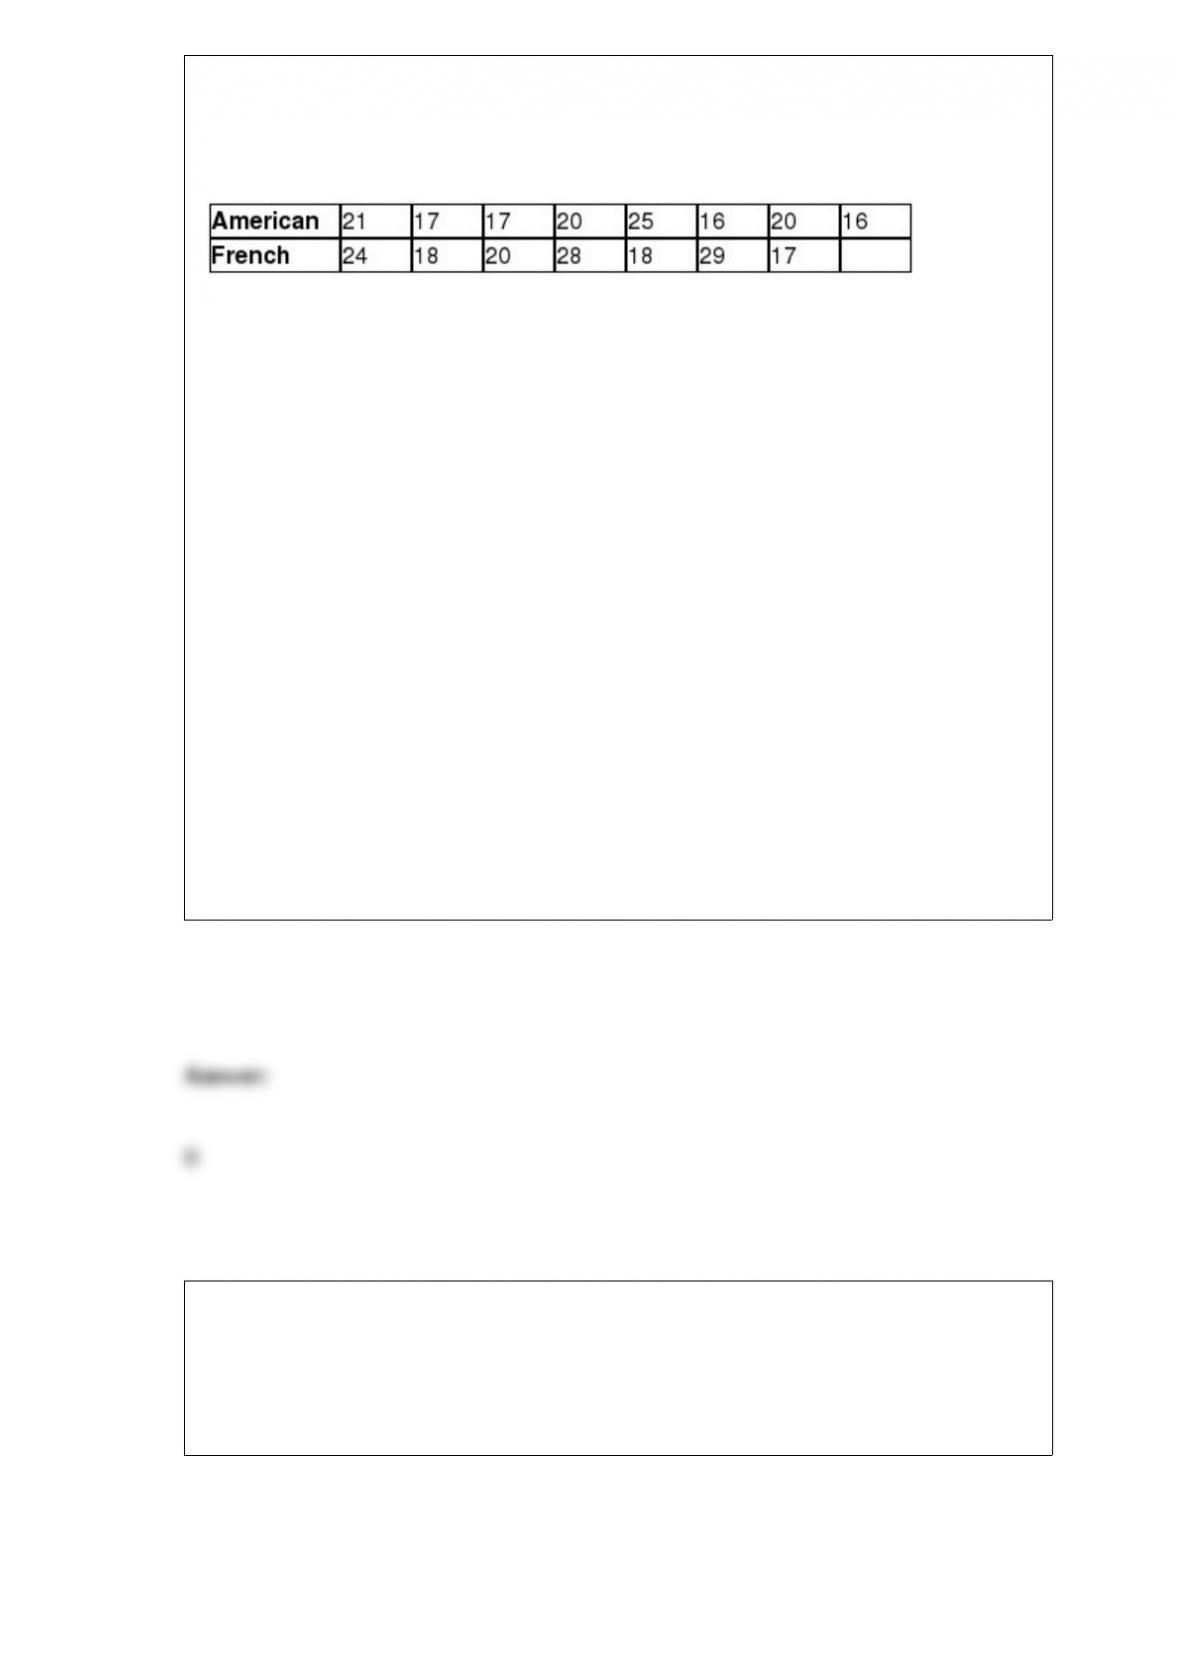
if a difference exists between the average time an American spends eating lunch when
compared to a person from France. The following data represents the time, in minutes,
that random French and American diners spent at lunch. Assume that the population
variances are equal.
If Population 1 is defined as French diners and Population 2 is defined as American
diners, and using α = 0.10, the conclusion for this hypothesis test would be that because
the absolute value of the test statistic is
______________________________________________________________.
A) less than the absolute value of the critical value, we can conclude that the average
time an American spends at lunch is equal to the average time that French diners spend
at lunch
B) less than the absolute value of the critical value, we cannot conclude that the average
time an American spends at lunch is different from the average time that French diners
spend at lunch
C) more than the absolute value of the critical value, we cannot conclude that the
average time an American spends at lunch is different from the average time that French
diners spend at lunch
D) more than the absolute value of the critical value, we can conclude that the average
time an American spends at lunch is different from the average time that French diners
spend at lunch
Use the following information to answer the question(s) below.
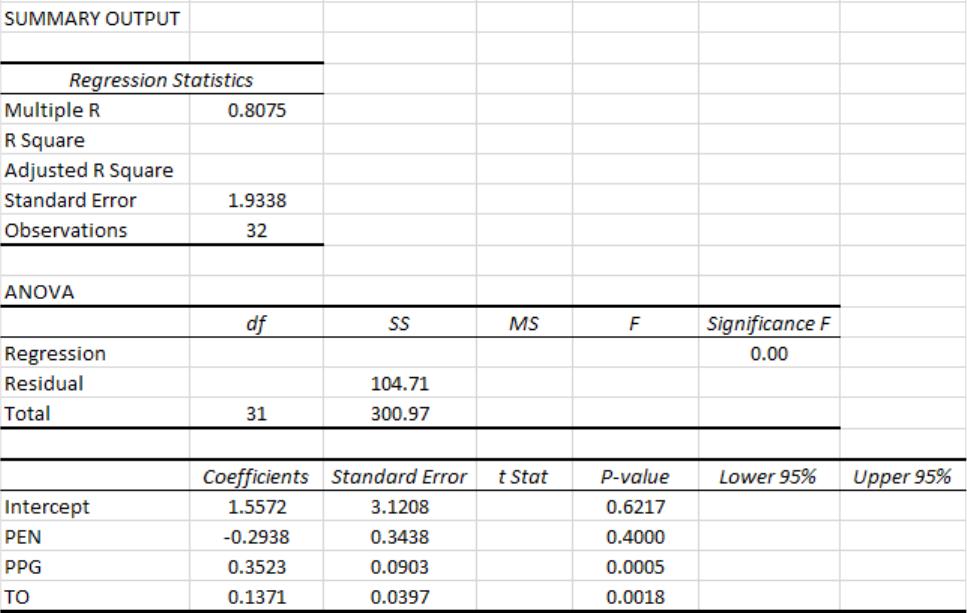
The National Football League has developed a regression model to predict the number
of wins during a season for a team using the following independent variables:
•Average points per game during the season (PPG)
•Average number of penalties committed per game during the season (PEN)
•Turnover differential during the season (TO)
Turnover differential is defined as the number of times the team took the ball away from
their opponent with a turnover minus the number of times the team gave the ball away to
their opponent with a turnover. For example, if TO = +5, the team had five more
takeaways than giveaways. If TO = “7, the team had seven more giveaways than
takeaways during the season.
The following Excel output shows the partially completed regression output from a
random season.
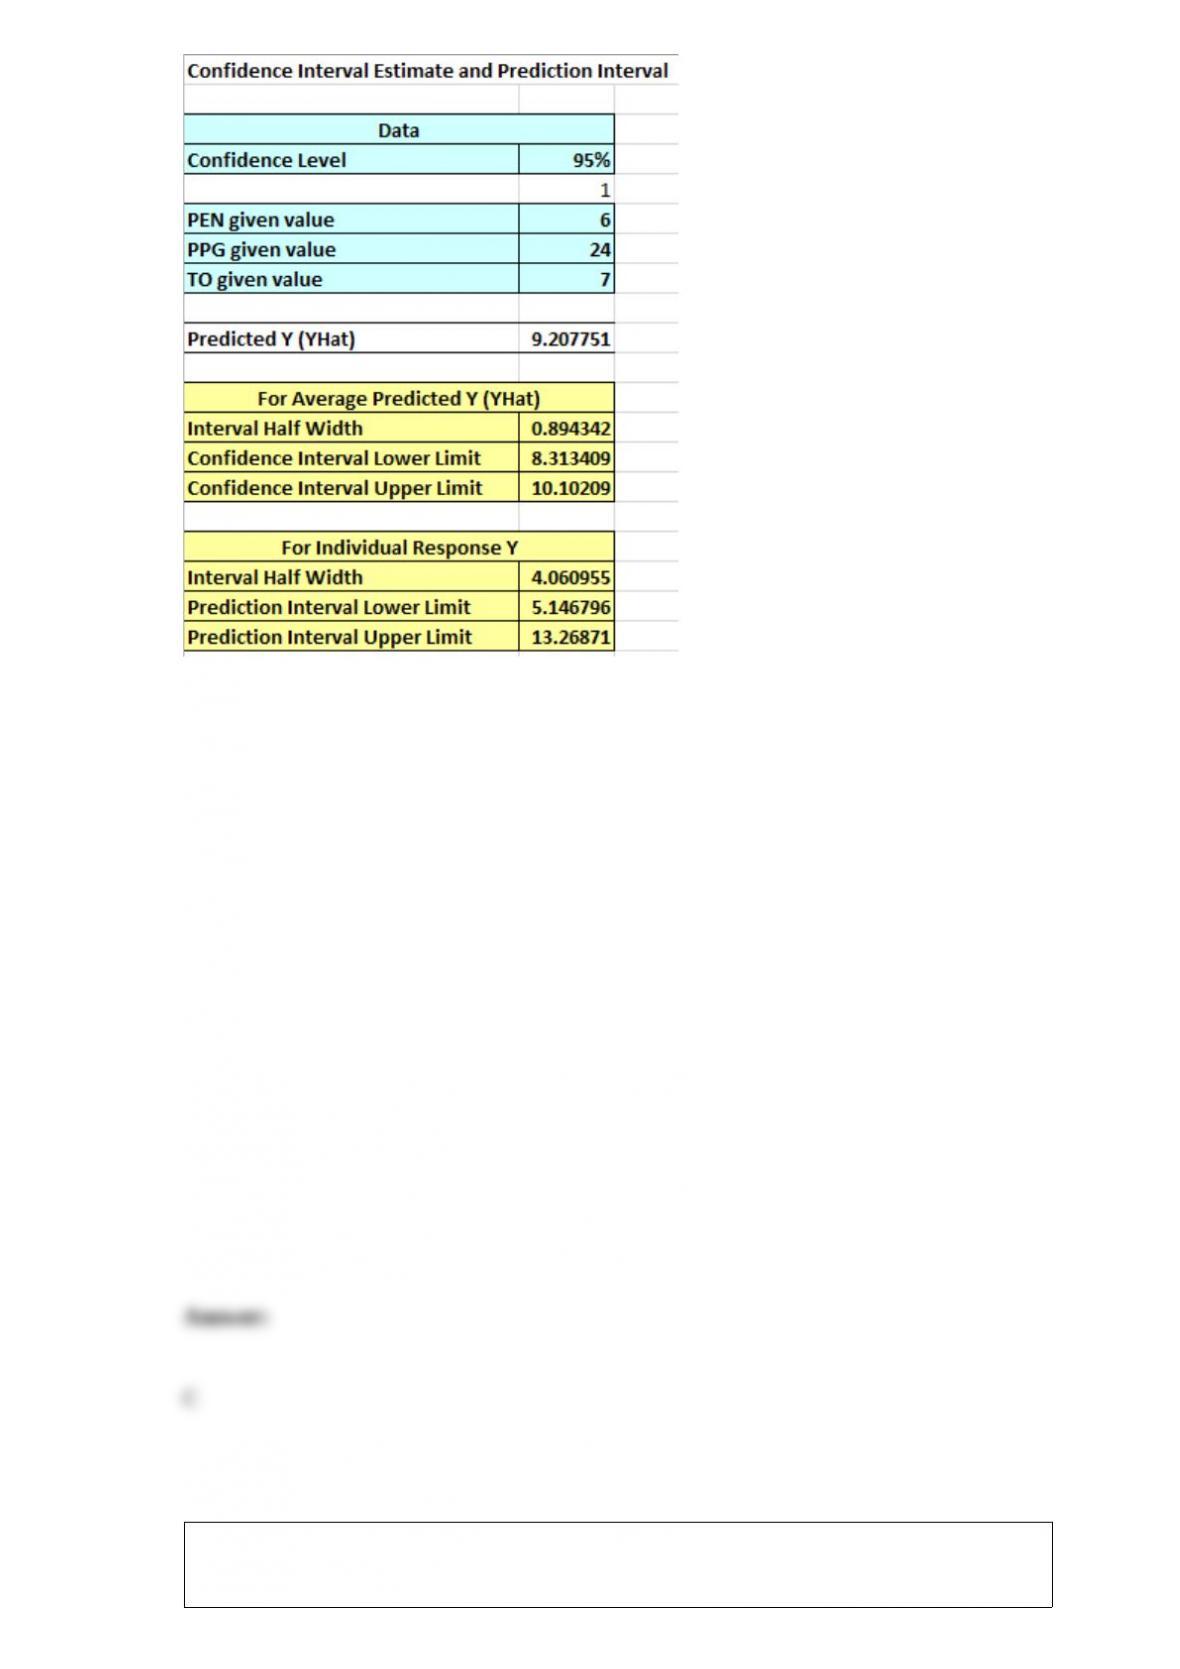
The 95% confidence interval for the average number of wins per season for teams that
average 6.0 penalties per game, average 24.0 points per game, and has a turnover
differential of +7 is ________.
A) (5.65, 12.77)
B) (8.98, 9.44)
C) (8.31, 10.10)
D) (3.44, 14.98)
The National Center for Education Statistics would like to test the hypothesis that the
proportion of Bachelor’s degrees that were earned by women equals 0.60. A random

sample of 140 college graduates with Bachelor degrees found that 75 were women. The
National Center for Education Statistics would like to set α = 0.10. The critical value
for this hypothesis test would be ________.
A) 1.28
B) 1.645
C) 1.96
D) 2.33
Two real estate companies, Century 21 and RE/MAX, compete with one another in a
local market. The manager of the Century 21 office would like to advertise that homes
listed with RE/MAX average more than 10 days on the market when compared to
homes listed with his company. The following data shows the sample size and average
number of days on the market for the two companies along with the population standard
deviations.
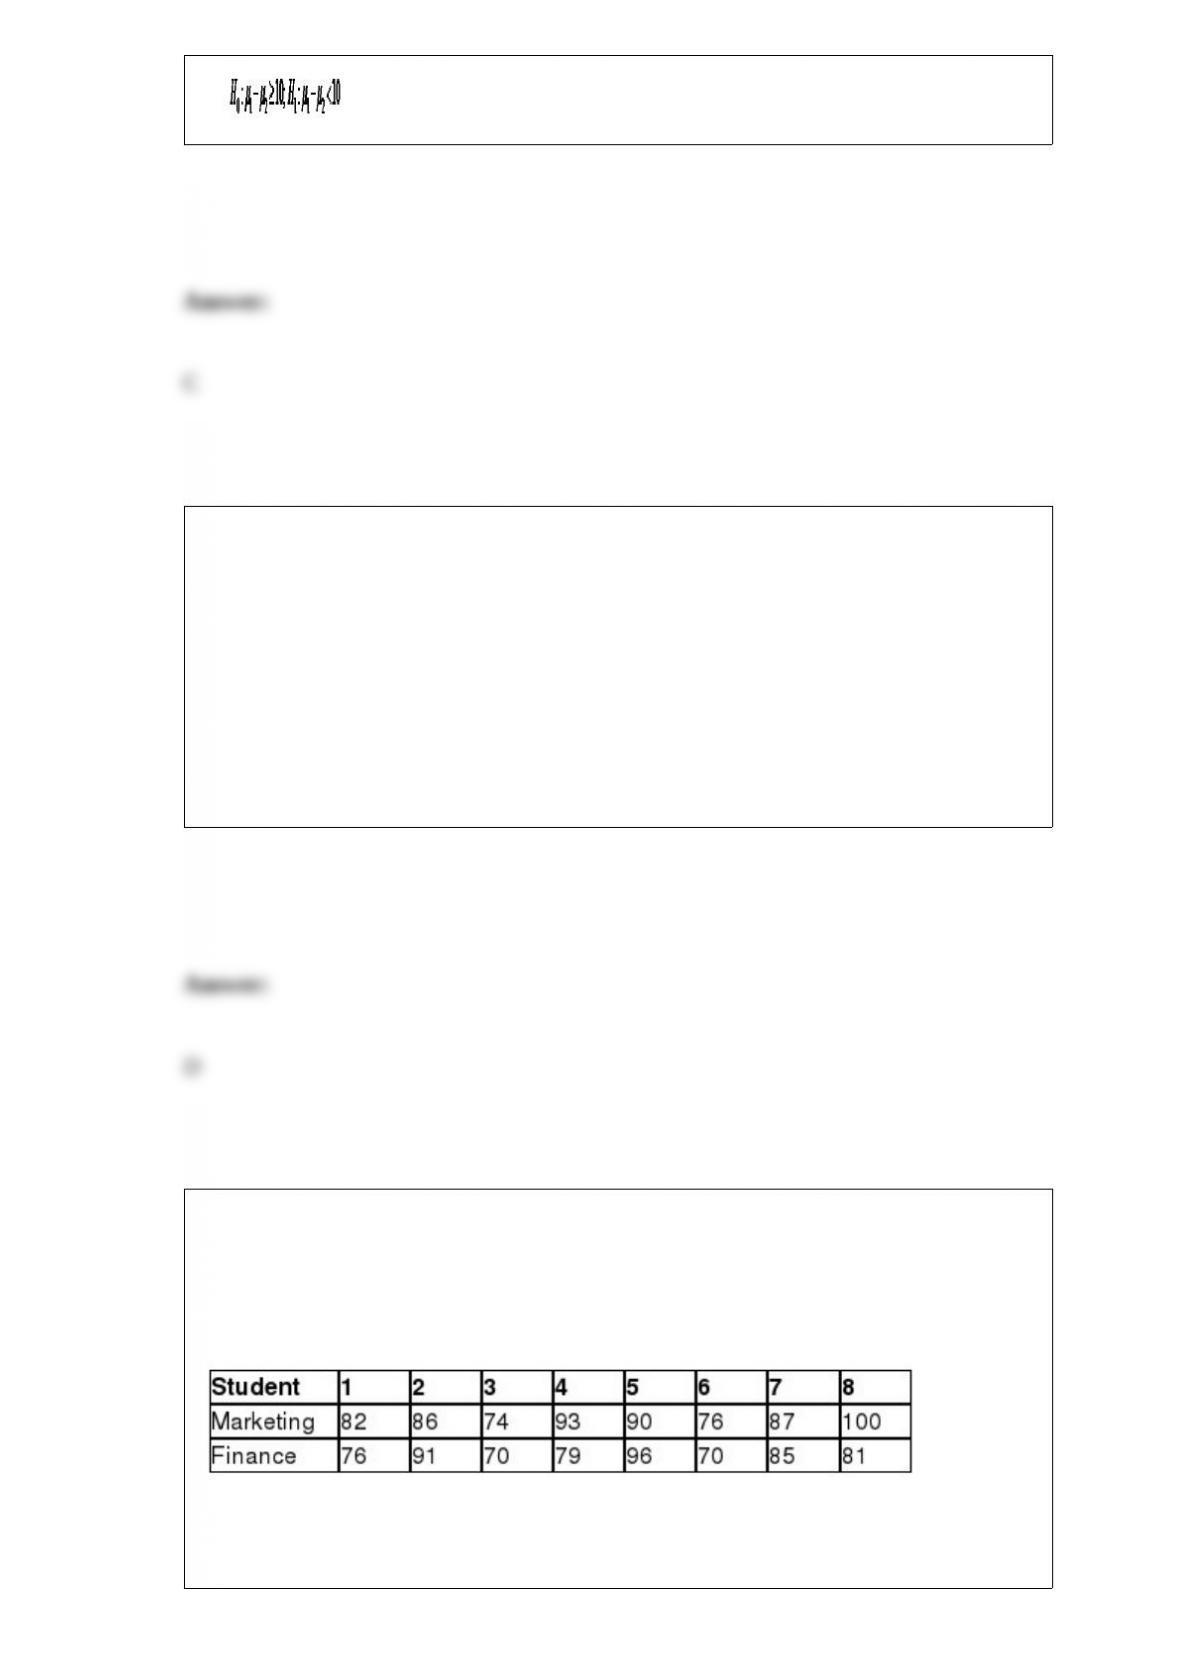
If Population 1 is defined as RE/MAX and Population 2 is defined as Century 21, the
correct hypothesis statement for this hypothesis test would be
___________________________.
A)
B)
C)
D)
When the discrete random variable is expressed in terms of dollars, the mean of the
distribution is known as the ____________________________.
A) expected value of sample information
B) expected value of the distribution
C) average value of the distribution
D) expected monetary value
The Dean of the Business School at State University would like to test the hypothesis
that no difference exists between the average final exam grades for the Introduction to
Marketing course and the Introduction to Finance course. A random sample of eight
students who took both courses was selected and their final exam grades for each
course are shown below.
If Population 1 is defined as the Marketing exam scores and Population 2 is defined as
the Finance exam scores, the 95% confidence interval for the difference in population

means is ________.
A) (“2.14, 12.14)
B) (“4.47, 14.47)
C) (0.26, 9.74)
D) (2.62, 7.38)
Use the following information to answer the question(s) below.
The National Football League has developed a regression model to predict the number
of wins during a season for a team using the following independent variables:
•Average points per game during the season (PPG)
•Average number of penalties committed per game during the season (PEN)
•Turnover differential during the season (TO)
Turnover differential is defined as the number of times the team took the ball away from
their opponent with a turnover minus the number of times the team gave the ball away to
their opponent with a turnover. For example, if TO = +5, the team had five more
takeaways than giveaways. If TO = “7, the team had seven more giveaways than
takeaways during the season.
The following Excel output shows the partially completed regression output from a
random season.
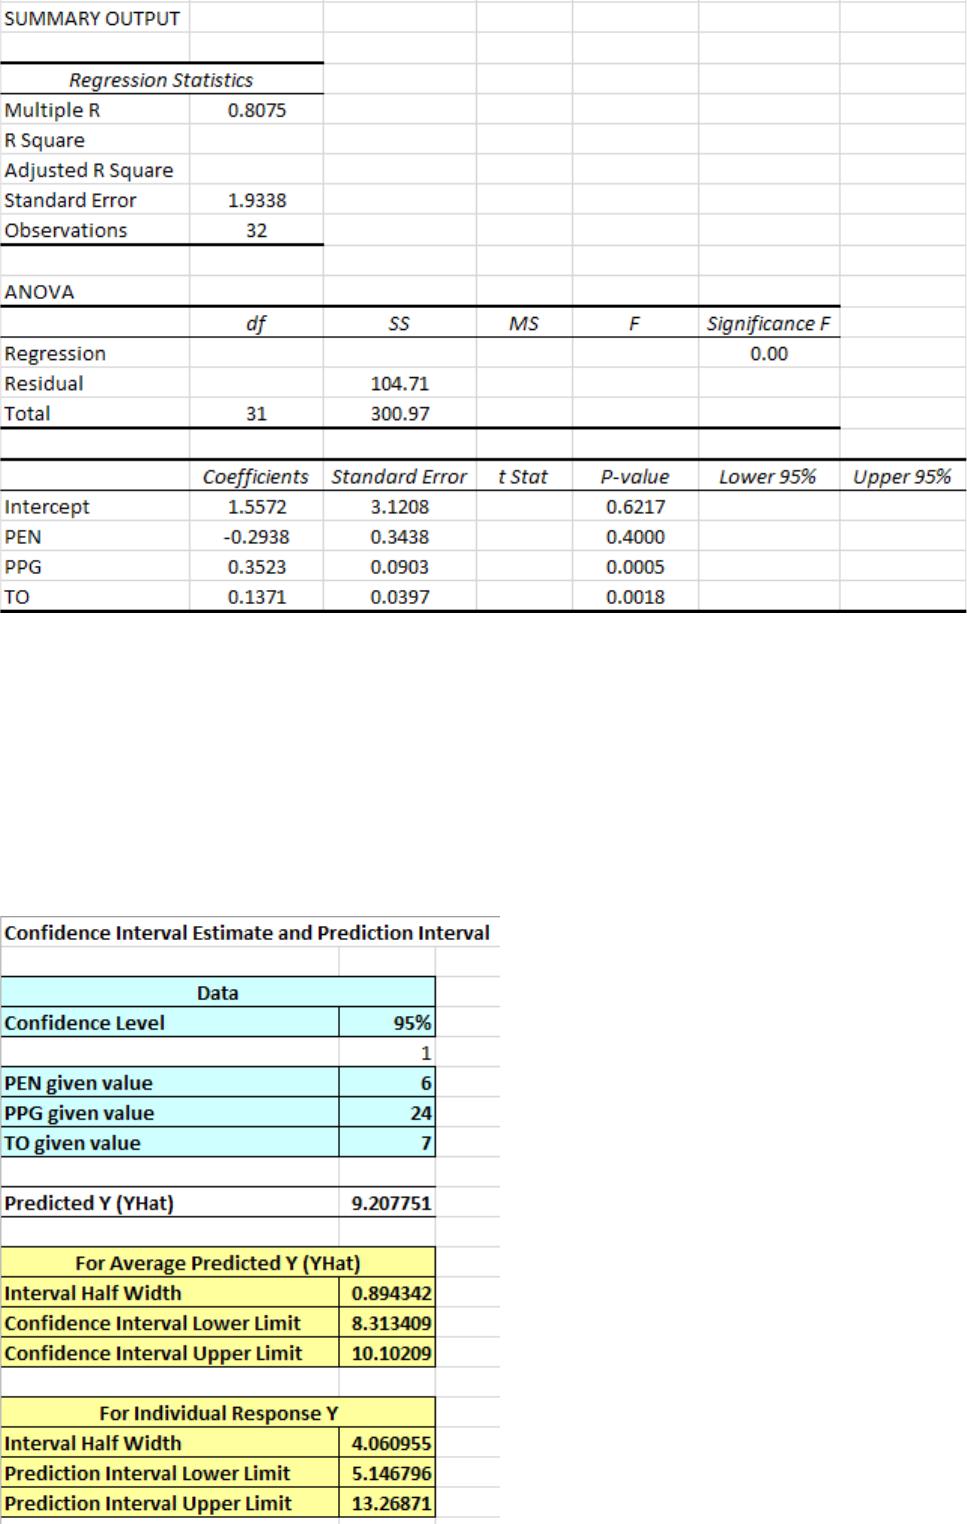

The number of teams that were included in the sample is ________.
A) 28
B) 30
C) 31
D) 32
Travelocity would like to test if the standard deviation for roundtrip airfares between
New York and London is less than $200. A random sample of 22 roundtrip airfares
between New York and London had a standard deviation of $142. The degrees of
freedom for this hypothesis test would be ________.
A) 18
B) 19
C) 20
D) 21
Steve’s average golf score at his local course is 93.6 from a random sample of 34 rounds
of golf. Assume that the population standard deviation for his golf score is 4.2. The
margin of error for a 95% confidence interval around this sample mean is ________.
A) 0.92
B) 1.18
C) 1.41
D) 1.68
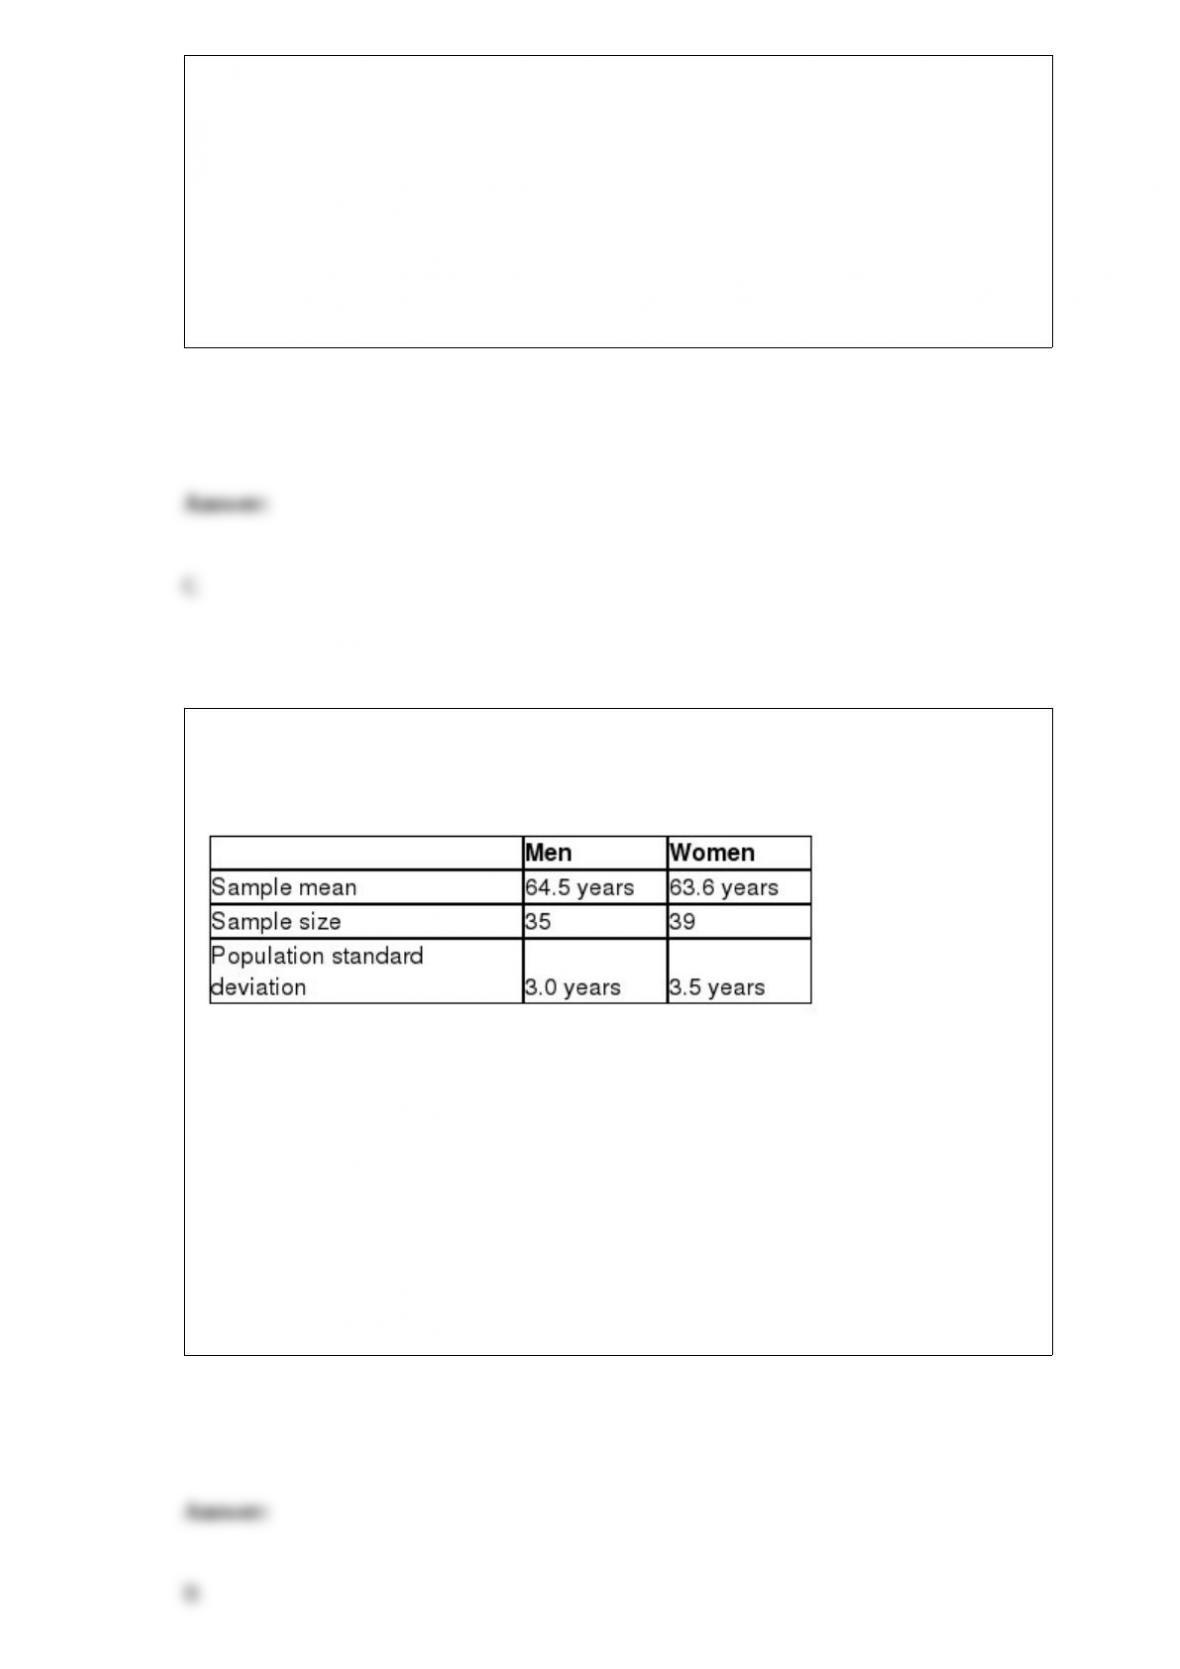
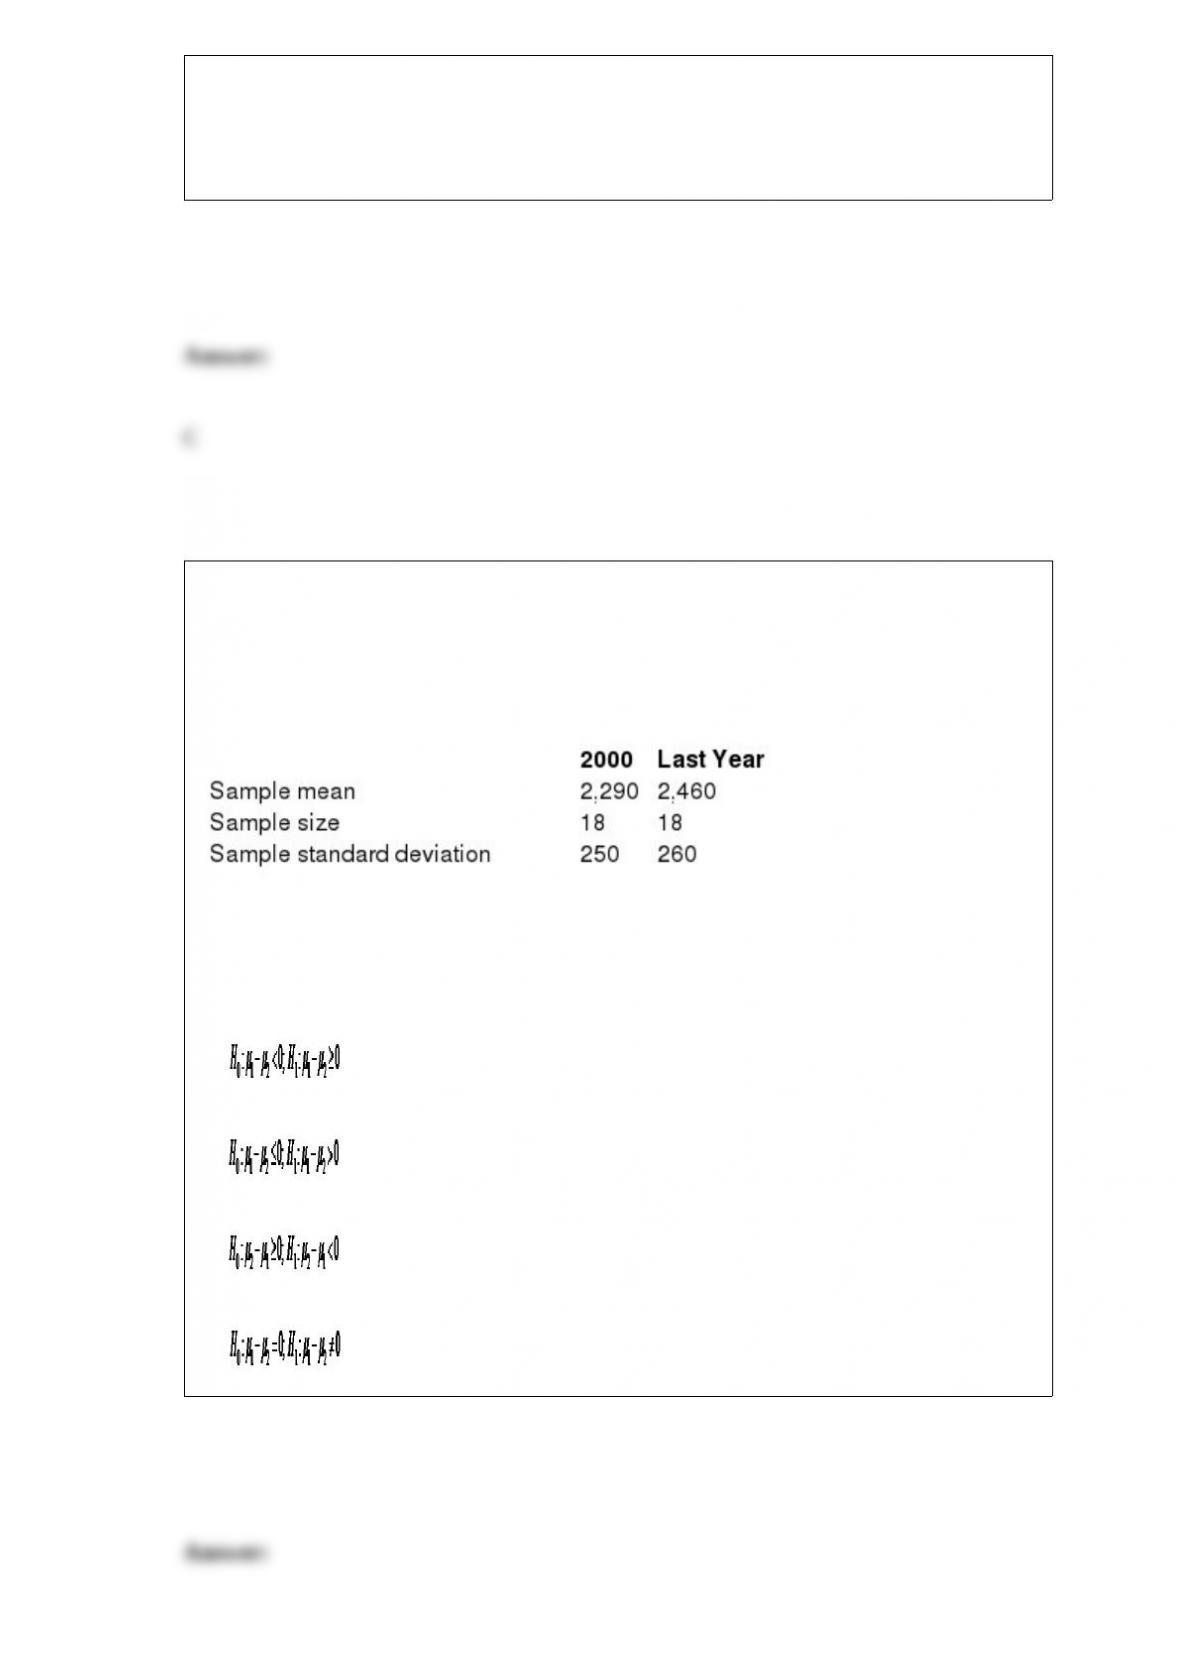
The federal government would like to test the hypothesis that the average age of men
filing for Social Security is higher than the average age of women set using α = 0.05
with the following data:
If Population 1 is defined as men and Population 2 is defined as women, the critical
value for this hypothesis test would be ________.
A) 1.28
B) 1.645
C) 1.96
D) 2.33
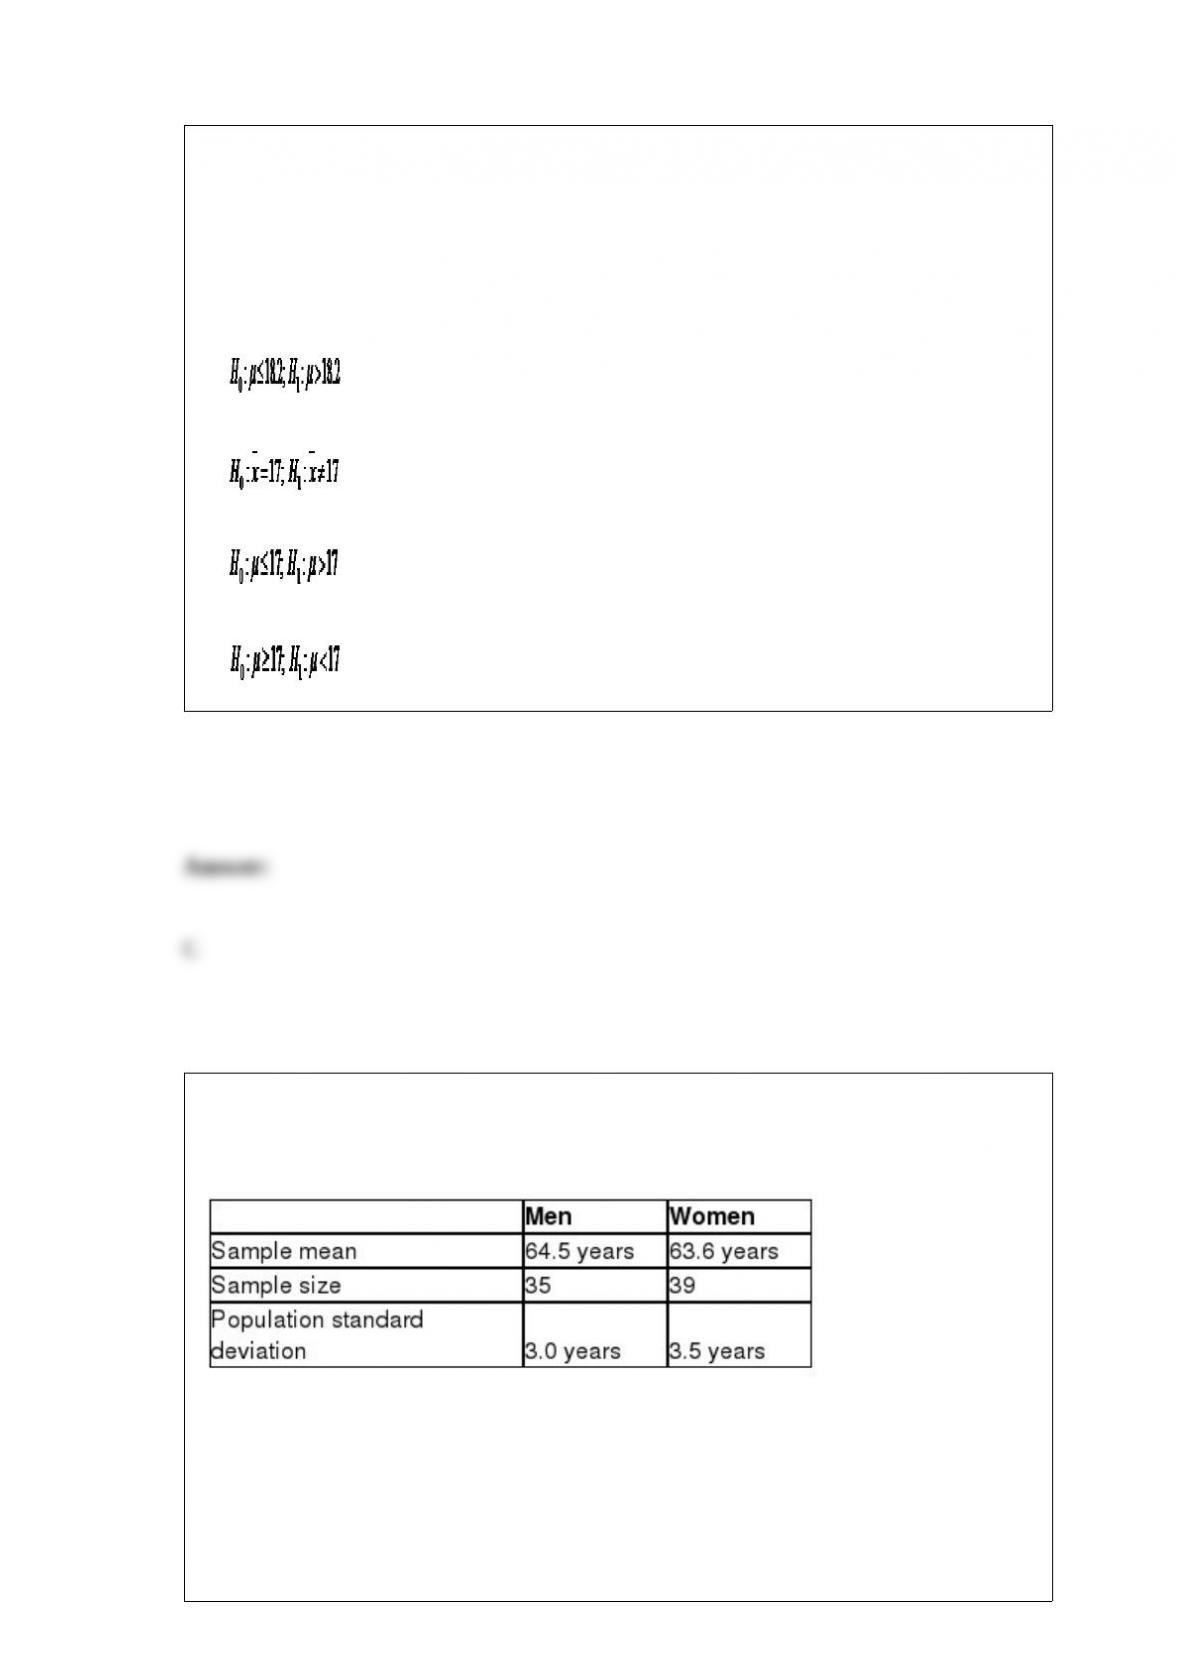
Breyers is a major producer of ice cream and would like to test the hypothesis that the
average American consumes more than 17 ounces if ice cream per month. A random
sample of 15 Americans was found to consume an average of 18.2 ounces of ice cream
last month. The standard deviation for this sample was 3.9 ounces. Breyers would like
to set α = 0.10. The correct hypothesis statement for this hypothesis test would be
___________________________.
A)
B)
C)
D)
The federal government would like to test the hypothesis that the average age of men
filing for Social Security is higher than the average age of women set using α = 0.05
with the following data:
If Population 1 is defined as men and Population 2 is defined as women, the p-value for
this hypothesis test would be ________.
A) 0.0122
B) 0.0262
C) 0.1170
D) 0.1492
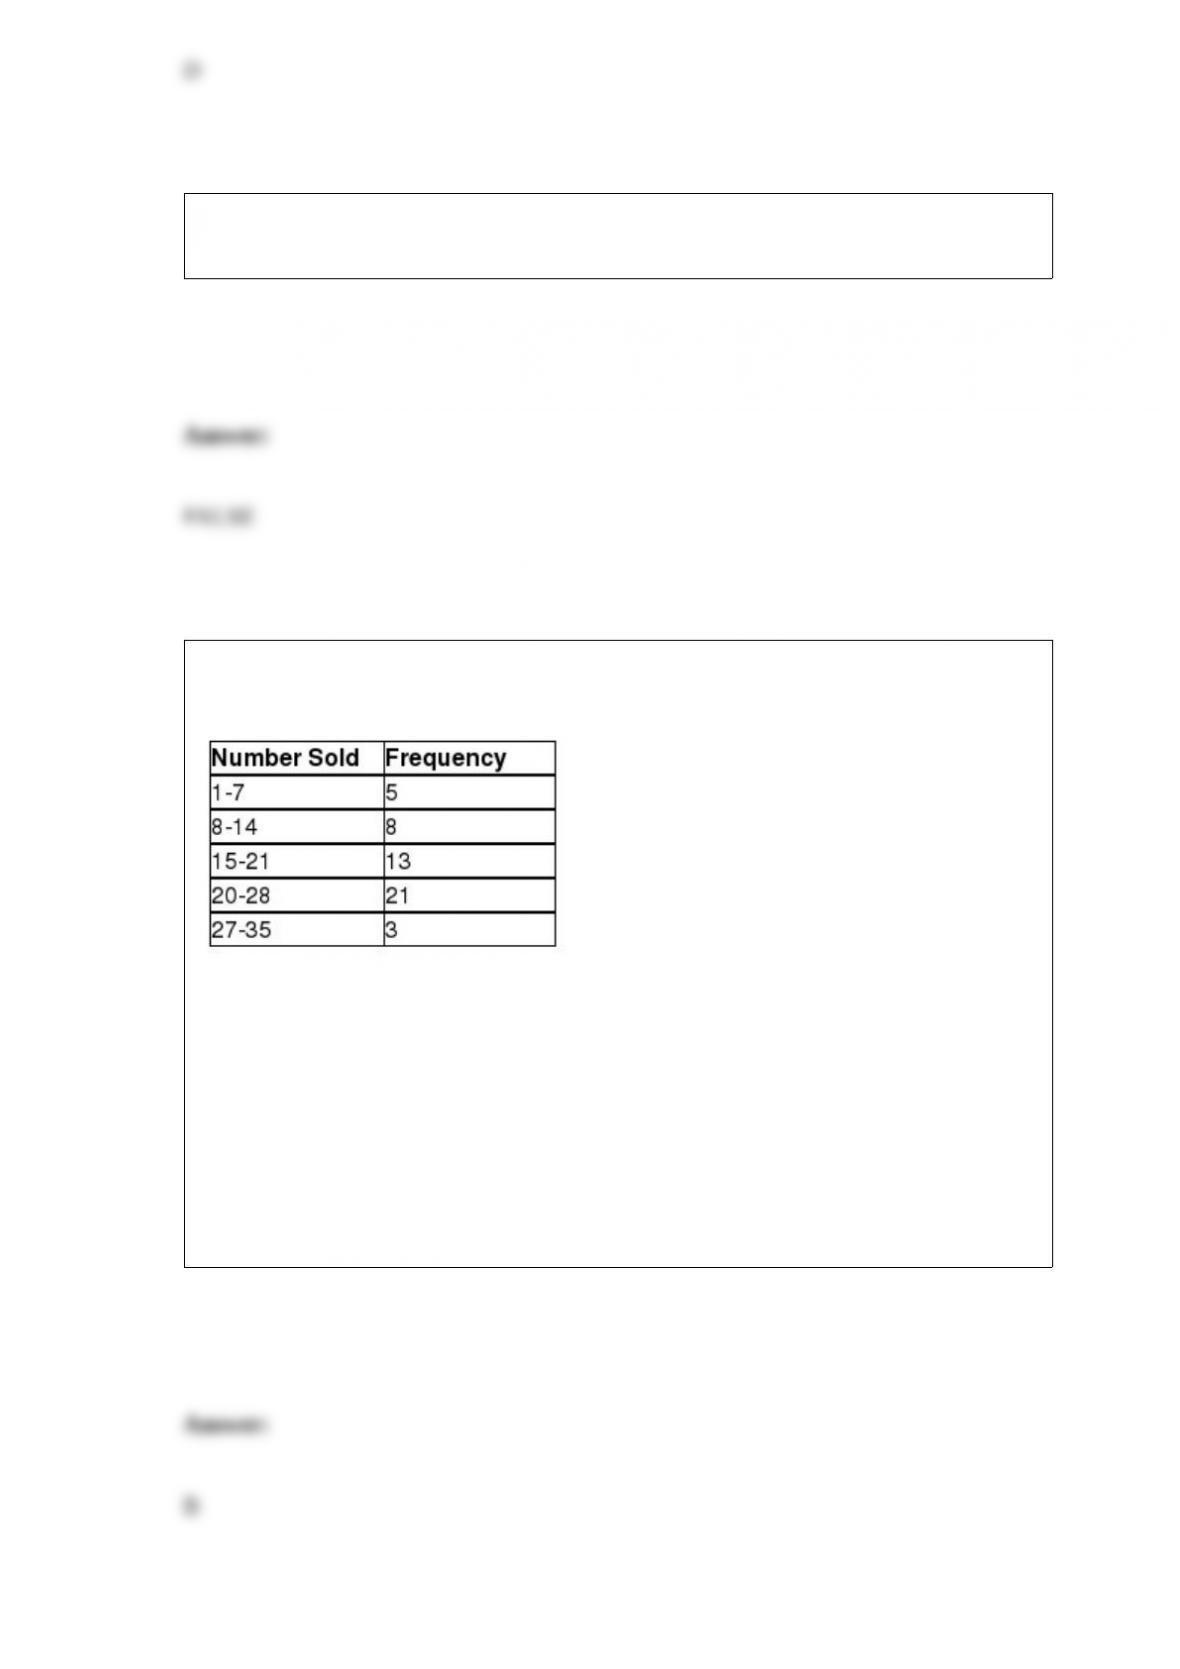
The Department of Housing and Urban Development (HUD) would like to test the
hypothesis that the average size of a newly constructed house last year is different from
the average size of a newly constructed house in 2000. The following data summarizes
the sample statistics for house sizes, in square feet, for both years. Assume that the
population variances are equal.
If Population 1 is defined as homes built in 2000 and Population 2 is defined as homes
built last year, the correct hypothesis statement for this hypothesis test would be
___________________.
A)
B)
C)
D)
Asking customers at the shopping mall about their voting intentions in the upcoming
political election is an example of secondary data.
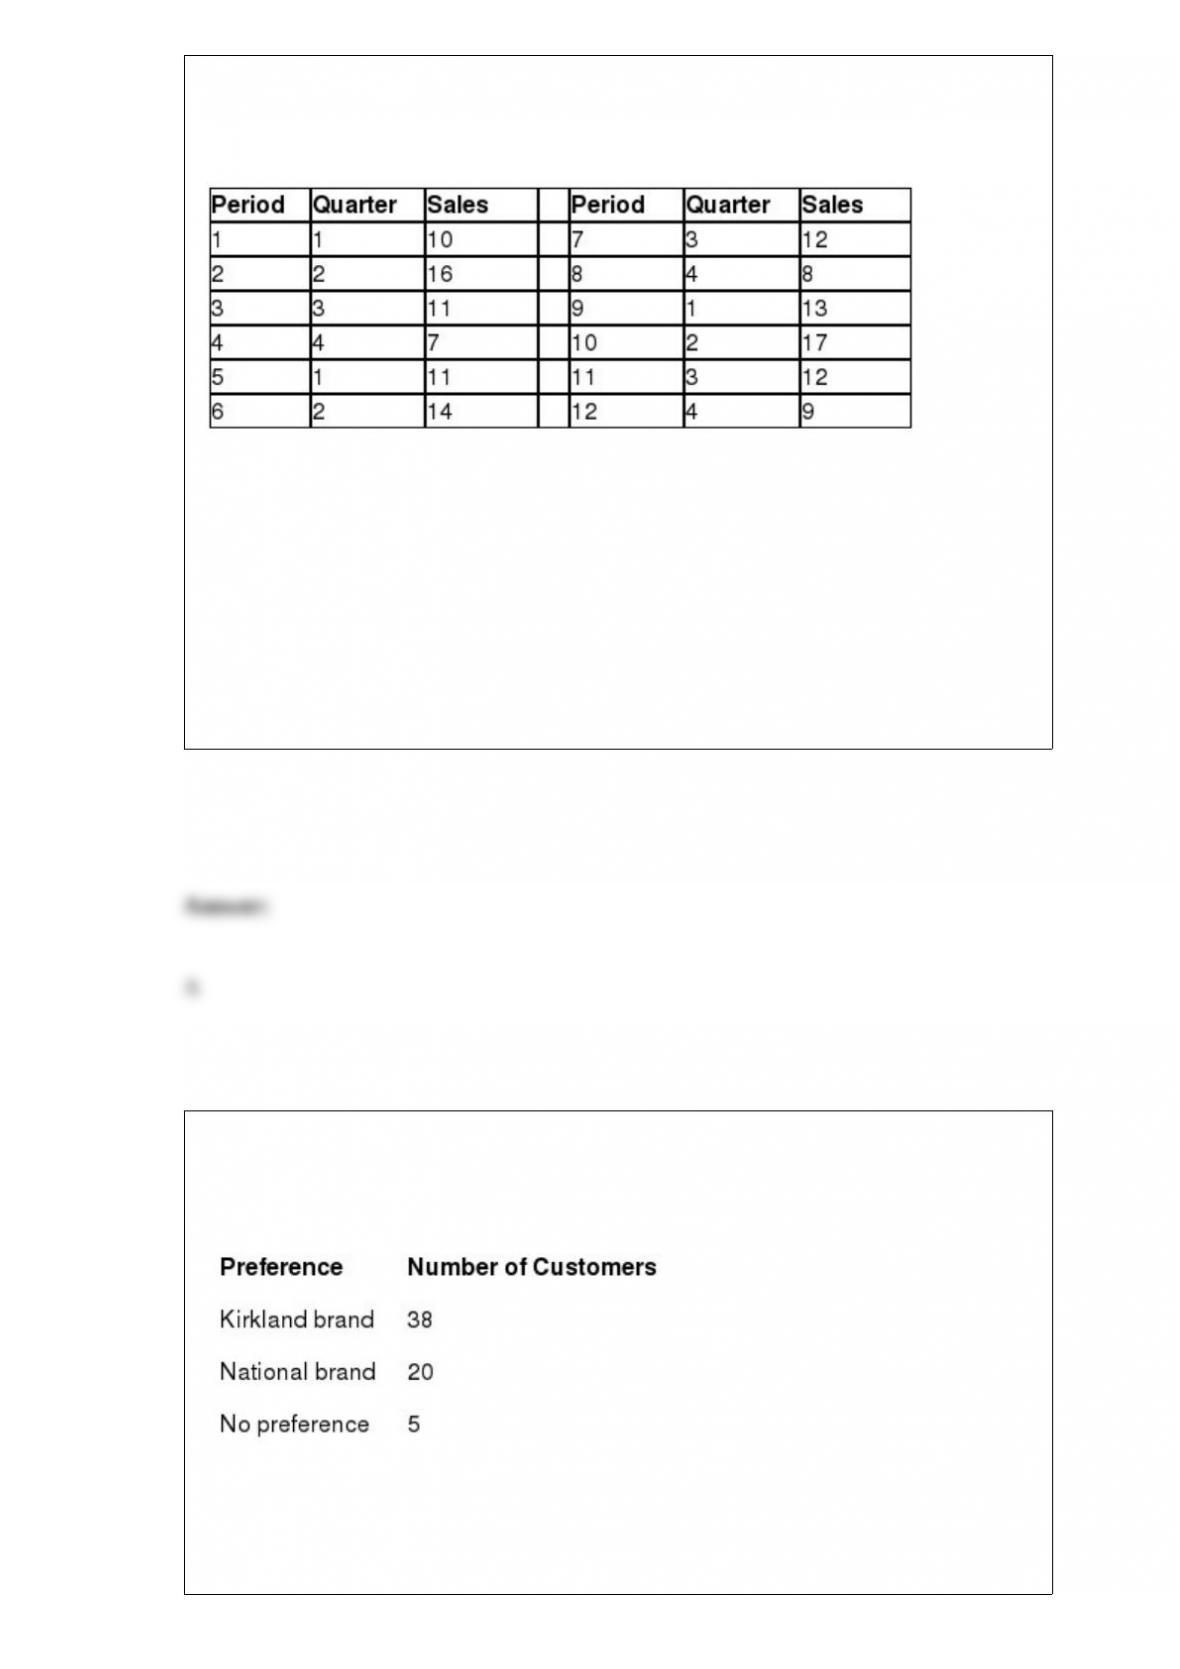
The following frequency distribution displays the daily sales of muffins at Avalon
Bakery.
What is the width of each class in this distribution?
A) 1
B) 7
C) 10
D) 35
Chris is employed by Silver Lake Resort in Orlando, Florida, and sells timeshares. The
following table shows the number of timeshare sales for Chris for each quarter over the
past three years.
The normalized seasonal factor for Quarter 4 is ________.
A) 0.6493
B) 0.9057
C) 1.1366
D) 1.2867
Costco Wholesale claims that Costco members prefer its Kirkland brand toilet paper
over the leading national brand. To test this claim, Costco recorded the preferences of a
random sample of customers which are summarized in the table below.
The correct hypothesis statement for this hypothesis test would be
______________________.

A)
B)
C)
D)
The mean and the variance are equal for a ________ probability distribution.
A) binomial
B) uniform
C) normal
D) Poisson
Hamburgers are on the menu tomorrow at a school cafeteria and the manager needs to
decide how many to have ready for the lunch hour. Each hamburger costs the school
$1.85 and is sold for $3.50. Leftover hamburgers have no monetary value. The manager
expects demand tomorrow to be 100, 150, 200, or 250 hamburgers and would like to
prepare one of these four quantities for lunchtime. If the manager uses the minimax
regret criterion, how many hamburgers will be prepared?
A) 100
B) 150
C) 200
D) 250
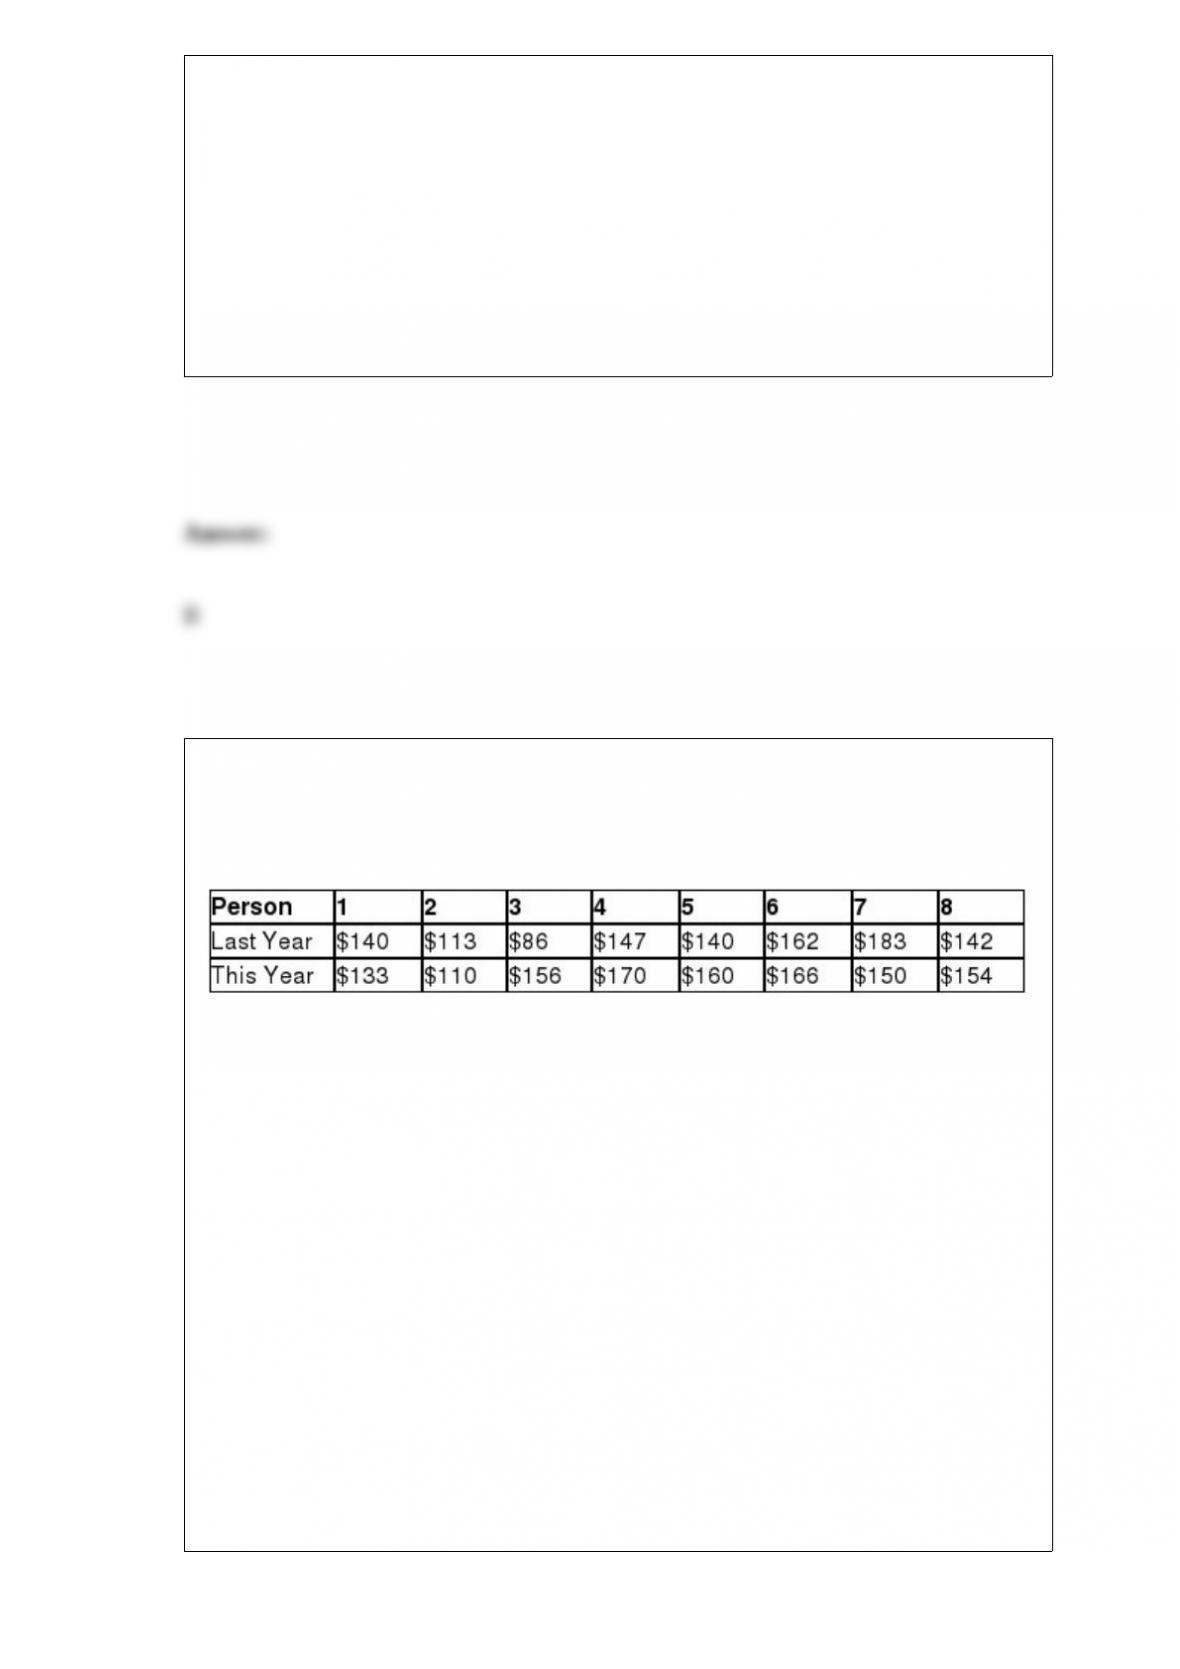
American Greetings would like to test the hypothesis that the median amount of money
spent per person on Mother’s Day increased this year when compared to last year. The
following data represents the amount of money that the same eight individuals spent on
Mother’s Day during the past two holidays.
Using α = 0.05, which one of the following statements is true?
A) Because the test statistic is greater than the critical value, we can conclude that the
median amount of money spent per person on Mother’s Day increased this year when
compared to last year.
B) Because the test statistic is greater than the critical value, we cannot conclude that
the median amount of money spent per person on Mother’s Day increased this year
when compared to last year.
C) Because the test statistic is less than the critical value, we can conclude that the
median amount of money spent per person on Mother’s Day increased this year when
compared to last year.
D) Because the test statistic is less than the critical value, we cannot conclude that the
median amount of money spent per person on Mother’s Day increased this year when
compared to last year.
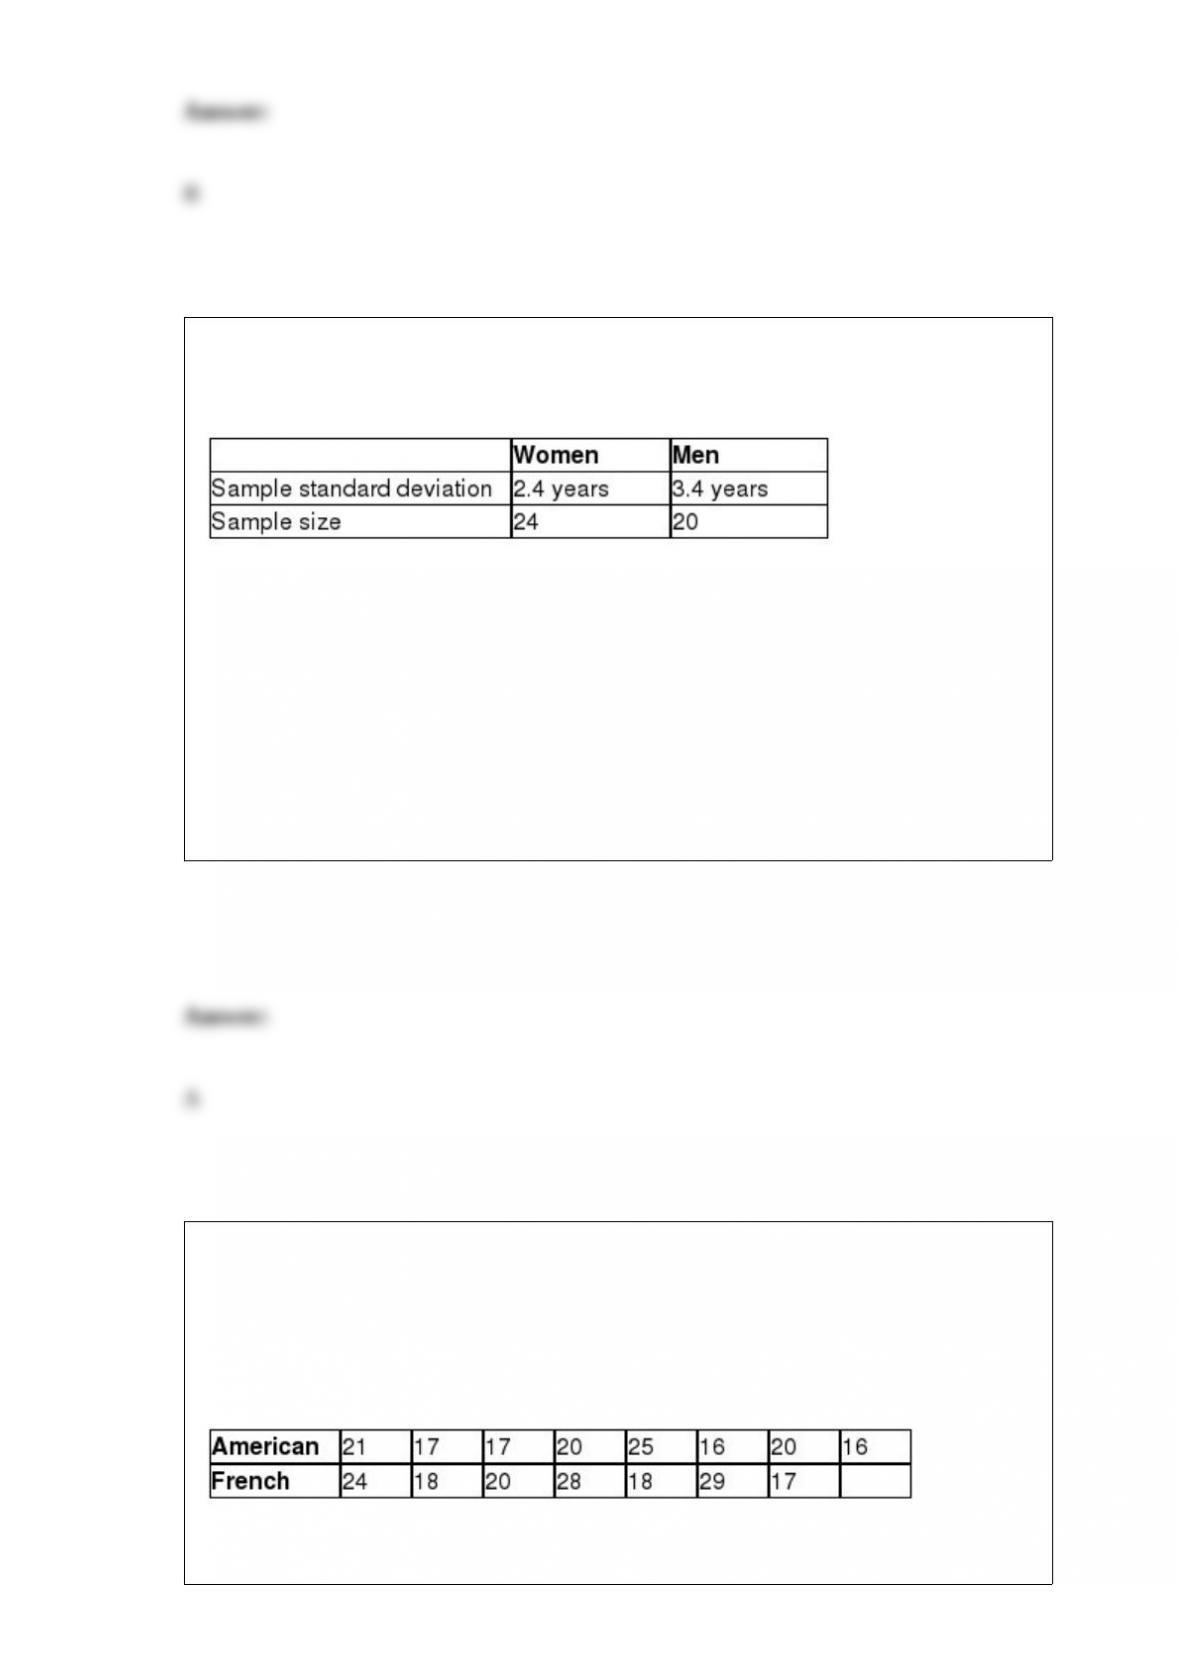
The federal government would like to test the hypothesis that the standard deviation for
the age of men filing for Social Security is higher than the standard deviation for the
age of women. The following table summarizes sample statistics from each population.
The test statistic for this hypothesis test would be ________.
A) 2.01
B) 4.87
C) 5.60
D) 7.74
The Wall Street Journal reported that the average amount of time that a French person
spends eating lunch at a restaurant is 22 minutes. Perform a hypothesis test to determine
if a difference exists between the average time an American spends eating lunch when
compared to a person from France. The following data represents the time, in minutes,
that random French and American diners spent at lunch. Assume that the population
variances are equal.
If Population 1 is defined as French diners and Population 2 is defined as American
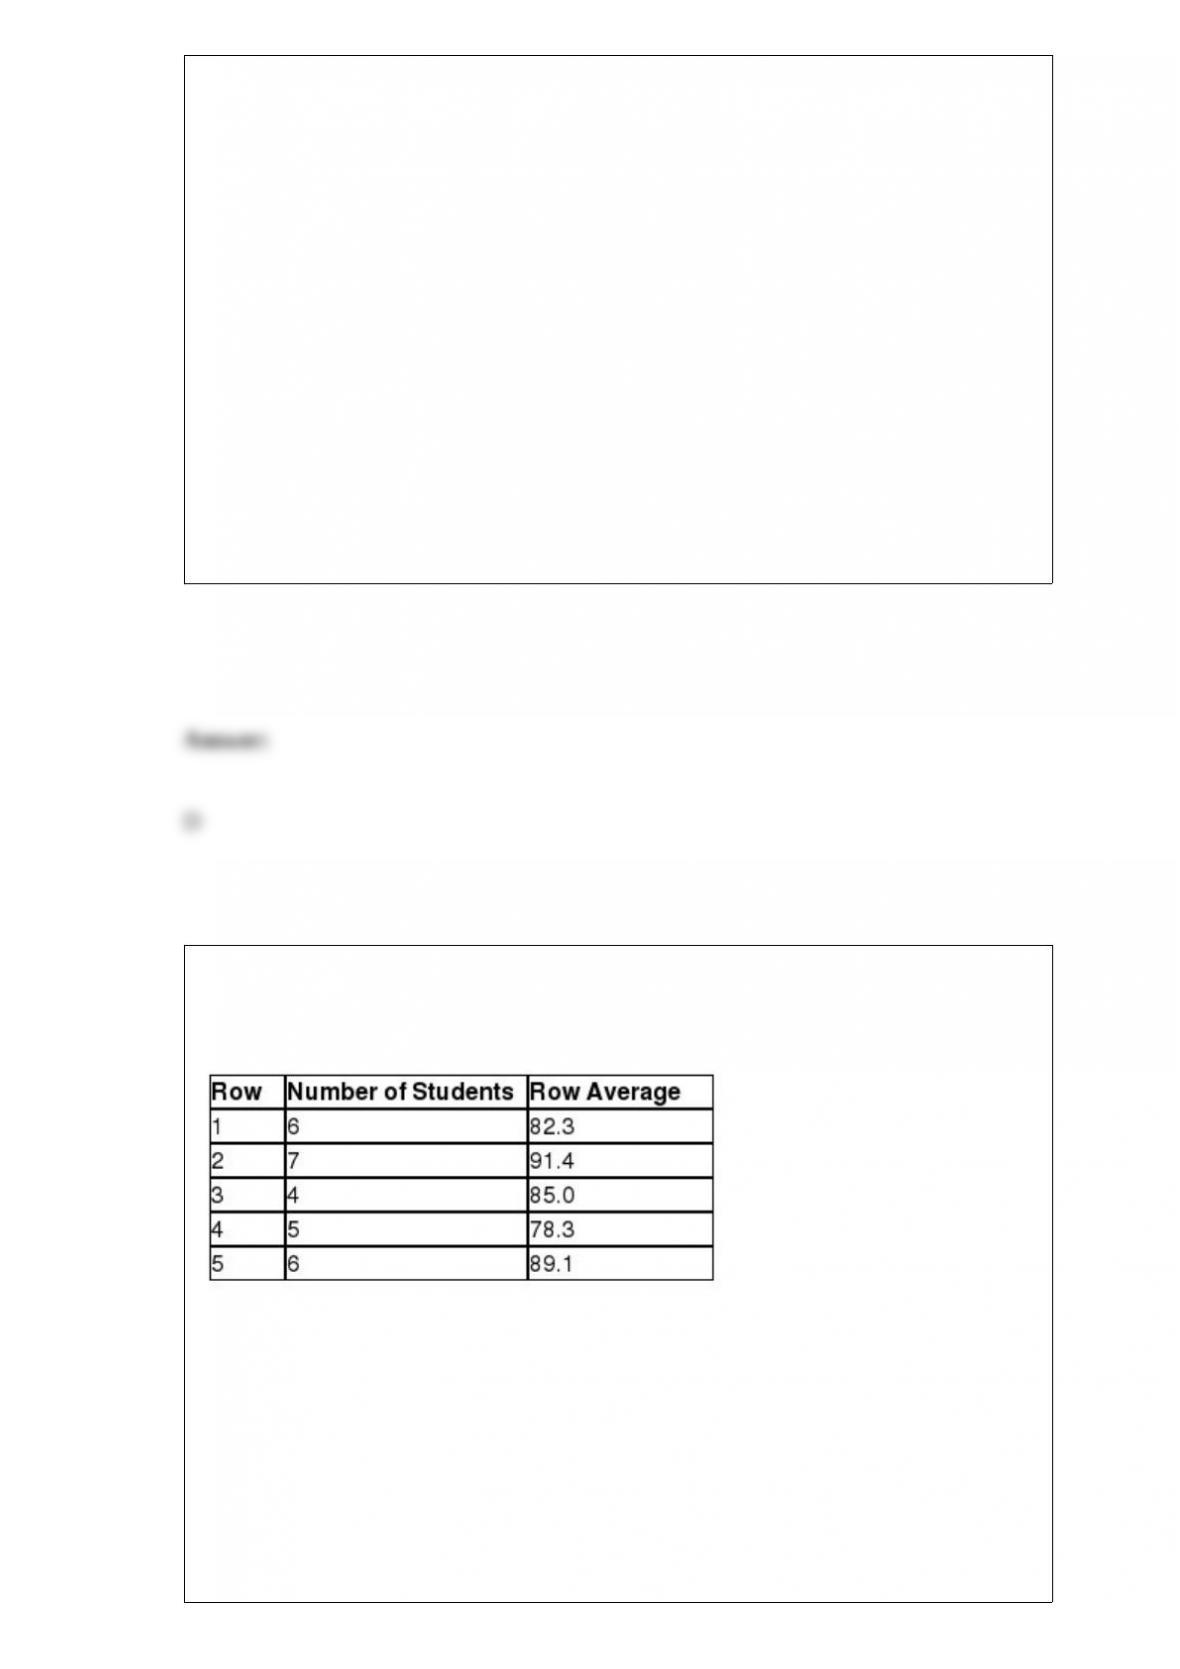
diners, and using α = 0.10, which one of the following statements is true?
A) Because the p-value is less than α, we can conclude that the average time an
American spends at lunch is different from the average time that French diners spend at
lunch.
B) Because the p-value is greater than α, we can conclude that the average time an
American spends at lunch is equal to the average time that French diners spend at
lunch.
C) Because the p-value is less than α, we cannot conclude that the average time an
American spends at lunch is different from the average time that French diners spend at
lunch.
D) Because the p-value is greater than α, we cannot conclude that the average time an
American spends at lunch is different from the average time that French diners spend at
lunch.
There are five rows of students seated in a statistics class. The following table shows
the number of students in each row and the average score of the most recent exam for
that row.
What is the average exam score for this class?
A) 83.0
B) 84.7
C) 85.7
D) 86.8

When testing for a normal distribution with the chi-square goodness-of-fit test with a
sample size of 240 observations, the number of intervals needed to satisfy the minimum
number of expected frequencies is ________.
A) 4
B) 5
C) 6
D) The sample size is too small to perform the chi-square goodness-of-fit test.
The ________ is used to test the significance of the population correlation coefficient.
A) normal distribution
B) Student’s t-distribution
C) F-distribution
D) chi-square distribution