
If a hypothesis test leads to incorrectly rejecting the null hypothesis, a Type II statistical
error has been made.
Three brands of running shoes are each tested by 10 different runners. The amount of
wear on the sole of the shoes is then measured. The objective is to determine if there is
any difference among the three brands of shoes based on how long the soles last. The
degrees of freedom for testing whether there is any blocking effect D1 = 9 and D2 = 18.
Given a regression equation of = 16 + 2.3x we would expect that an increase in x of
2.0 would lead to an average increase of y of 4.6.
In the model diagnosis step in regression modeling, we are interested in the sign and
size of the regression slope coefficients.

Suppose a distribution has a mean of 80 and standard deviation of 10. It is found that 84
percent of the values in the data set lie between 70 and 90. This implies that the
distribution is not bell-shaped.
A bank is interested in determining whether its customers’ checking balances are
linearly related to their savings balances. A sample of n = 20 customers was selected
and the correlation was calculated to be +0.40. If the bank is interested in testing to see
whether there is a significant linear relationship between the two variables using a
significance level of 0.05, the value of the test statistic is approximately t = 1.8516.
When developing a confidence interval estimate, the confidence level is calculated
based on the size of the sample and the population standard deviation.

All Wilcoxon signed rank tests are two-tailed tests since we are testing whether the
population median is the exact center of the population distribution.
If given a choice in collecting data on age for use as an independent variable in a
regression model, a decision maker would generally prefer to record the actual age
rather than an age category so as to avoid using dummy variables.
A major car magazine has recently collected data on 30 leading cars in the U.S. market.
It is interested in building a multiple regression model to explain the variation in
highway miles. The following correlation matrix has been computed from the data
collected:

Based on this information, if we test using a 0.05 level of significance, the critical value
for testing whether any of the independent variables are significantly correlated with the
dependent variable is t = 2.0484.
The frequency distribution of most processes’ statistics will begin to resemble the shape
of the normal distribution as the values are collected and grouped into classes.
In a one-tailed hypothesis test, the larger the significance level, the greater the critical
value will be.

Lube-Tech is a major chain whose primary business is performing lube and oil changes
for passenger vehicles. The national operations manager has stated in an industry
newsletter that the mean number of miles between oil changes for all passenger cars
exceeds 4,200 miles. To test this, an industry group has selected a random sample of
100 vehicles that have come into a lube shop and determined the number of miles since
the last oil change and lube. The sample mean was 4,278 and the sample standard
deviation was 780 miles. Based on this information, the test statistic is approximately t
= 1.000.
When developing a bar chart, it is usually preferable to organize the bars in order from
high to low.
Six managers at a company all enjoy golf. Each Saturday, four of the six get together
for 18 holes of golf. They have decided to set up a schedule so that the same foursome
does not play twice before all possible foursomes have played. The number of
weekends that will pass before the same group would play twice is 15.

One of the most common statistical sampling techniques is convenience sampling.
In order to identify a cyclical component in time-series data, one year of weekly data
should be sufficient.
A perfect correlation between two variables will always produce a correlation
coefficient of +1.0

The goodness-of-fit test is always a one-tail test with the rejection region in the upper
tail.
The State Transportation Department wishes to estimate the mean speed of vehicles on
a certain stretch of highway. They wish to estimate the mean within 0.75 mph and they
wish to have a confidence level equal to 99 percent. Based on this information only,
they can determine that the required sample size is 320 vehicles.
One of the nation’s biggest regional airlines has tracked 4,000 landings and take-offs
during the past month. Treating these data as the population of interest, the company
found that the average time the planes spent on the ground (called the turn time) was
17.23 minutes with a standard deviation of 3.79 minutes. Further, they determined that
the distribution of turn times is normally distributed. If a sample of size n = 16 turn
times was selected at random from the population, the chances of the mean of this
sample exceeding 20 minutes is 0.2327.

A study of cars arriving at a parking structure at the local airport shows that the time
between arrivals is 1.2 minutes and is exponentially distributed. Based on this
information, the mean number of cars arriving per minute is about 0.83.
A sampling distribution for a sample mean shows the distribution of the possible values
for the sample mean for a given sample size from a population.
In a Mann-Whitney U test, the test statistic will be equal to the sum of the ranks from
sample one, or sample two, whichever is larger.
First Pacific Bank has determined that the mean checking account balance for all its
customers is currently $743.50. Based on this, it is fair to say that about half the
customers have balances exceeding $743.50.

One example of a difference between discrete random variables and continuous random
variables is that in a discrete distribution P(x > 2) = P(x ≥ 3) while in a continuous
distribution P(x > 2) is treated the same as P(x ≥ 2).
In estimating the difference between two population means, if a 95 percent confidence
interval includes zero, then we can conclude that there is a 95 percent chance that the
difference between the two population means is zero.
In a two-factor ANOVA, the total sum of squares can be partitioned into four parts; the
variation due to factor A, the variation due to factor B, the variation due to blocking,
and the error variation.

The t-distribution is used for the critical value when estimating a population proportion
when the standard deviation of the population is not known.
You are given the following data:
Assuming that these data are a sample selected from a larger population, the median
value for these sample data is 25.5.
If two variables are highly correlated, it not only means that they are linearly related, it
also means that a change in one variable will cause a change in the other variable.

One of the differences between a stem and leaf diagram and a histogram is that even for
variables involving a large number of different values, the stem and leaf diagram shows
the individual data values whereas the histogram requires you to group the data and lose
the individual values.
Acme Taxi has two taxi cabs. The manager tracks the daily revenue for each cab. Over
the past 20 days, Cab A has averaged $76.00 per night with a standard deviation equal
to $11.00. Cab B has averaged $200.00 per night with a standard deviation of $18.00.
Based on this information, Cab B has the greatest relative variation.
Examine the following two-factor analysis of variance table:
Determine if interaction exists between factor A and factor B. Use alpha = 0.05.
A) Fail to reject H0. Conclude that there is not sufficient evidence to indicate interaction
exists between Factor A and Factor B

B) Reject H0. Conclude that there is sufficient evidence to indicate interaction exists
between Factor A and Factor B
C) Fail to reject H0. Conclude that there is sufficient evidence to indicate interaction
exists between Factor A and Factor B
D) Reject H0. Conclude that there is not sufficient evidence to indicate interaction exists
between Factor A and Factor B
For the following hypothesis:
With n = 20, = 71.2, s = 6.9, and α = 0.1, state the decision rule in terms of the critical
value of the test statistic.
A) This is a one-tailed test of the population mean with σ unknown. Therefore, the
decision rule is: accept the null hypothesis if the calculated value of the test statistic, t,
is greater than 1.3277. Otherwise, reject.
B) This is a one-tailed test of the population mean with σ unknown. Therefore, the
decision rule is: accept the null hypothesis if the calculated value of the test statistic, t,
is greater than 2.1727. Otherwise, reject.
C) This is a one-tailed test of the population mean with σ unknown. Therefore, the
decision rule is: reject the null hypothesis if the calculated value of the test statistic, t, is
greater than 1.3277. Otherwise, do not reject.
D) This is a one-tailed test of the population mean with σ unknown. Therefore, the
decision rule is: reject the null hypothesis if the calculated value of the test statistic, t, is
greater than 2.1727. Otherwise, do not reject.
In constructing a scatter diagram:
A) the independent variable should be on the vertical axis.
B) the independent variable should be on the horizontal axis.
C) the dependent variable should be on the horizontal axis.
D) It does not matter which variable goes on which axis.
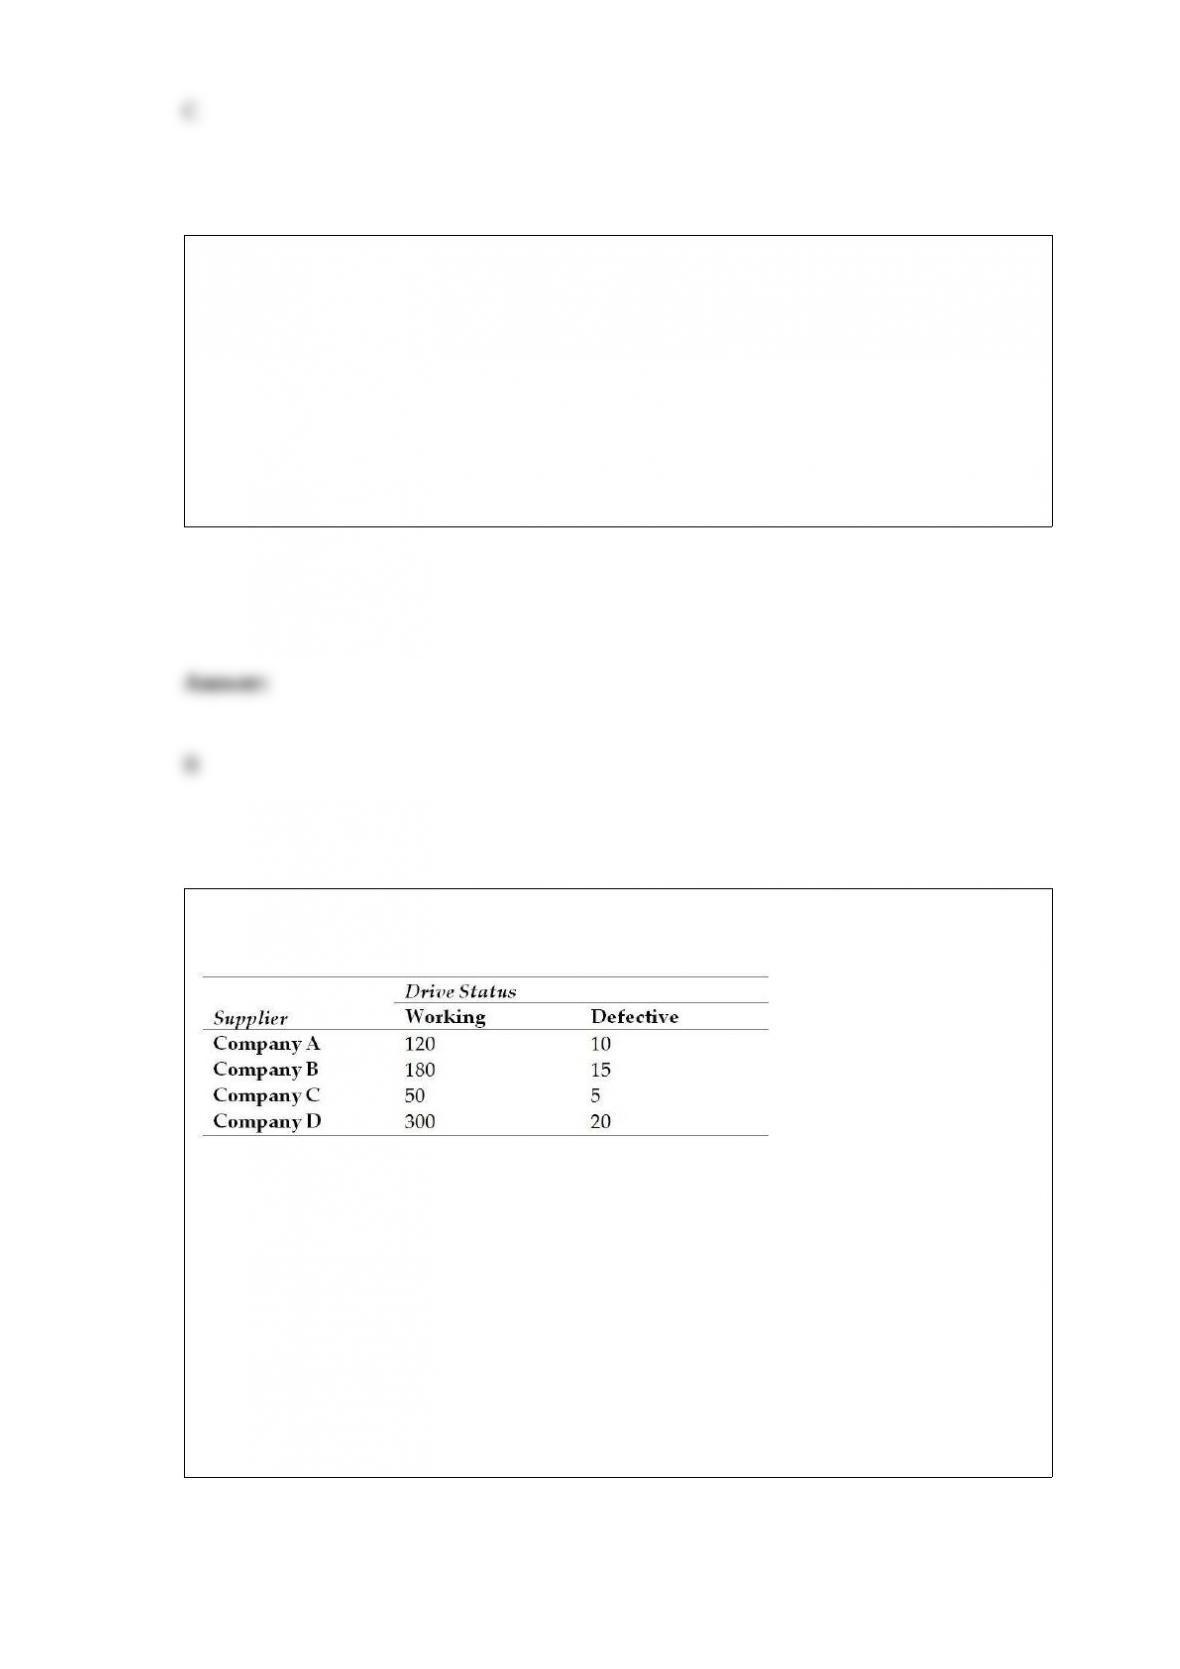
Suppose a quality manager for Dell Computers has collected the following data on the
quality status of disk drives by supplier. She inspected a total of 700 disk drives.
Based on these inspection data, what is the probability of randomly selecting a disk
drive from company B?
A) 0.07
B) 0.28
C) 0.021
D) 0.76

A commuter has two different routes available to drive to work. She wants to test
whether route A is faster than route B. The best hypotheses are:
A) H0 : μA – μβ ≥ 0
HA : μA– μβ < 0
B) H0 : μA – μβ ≤ 0
HA : μA– μβ > 0
C) H0 : μA – μβ = 0
HA : μA– μβ ≠ 0
D) H0 : μA – μβ < 0
HA : μA– μβ ≥ 0
A recent study by a major financial investment company was interested in determining
whether the annual percentage change in stock price for companies is linearly related to
the annual percent change in profits for the company. The following data was
determined for 7 randomly selected companies:
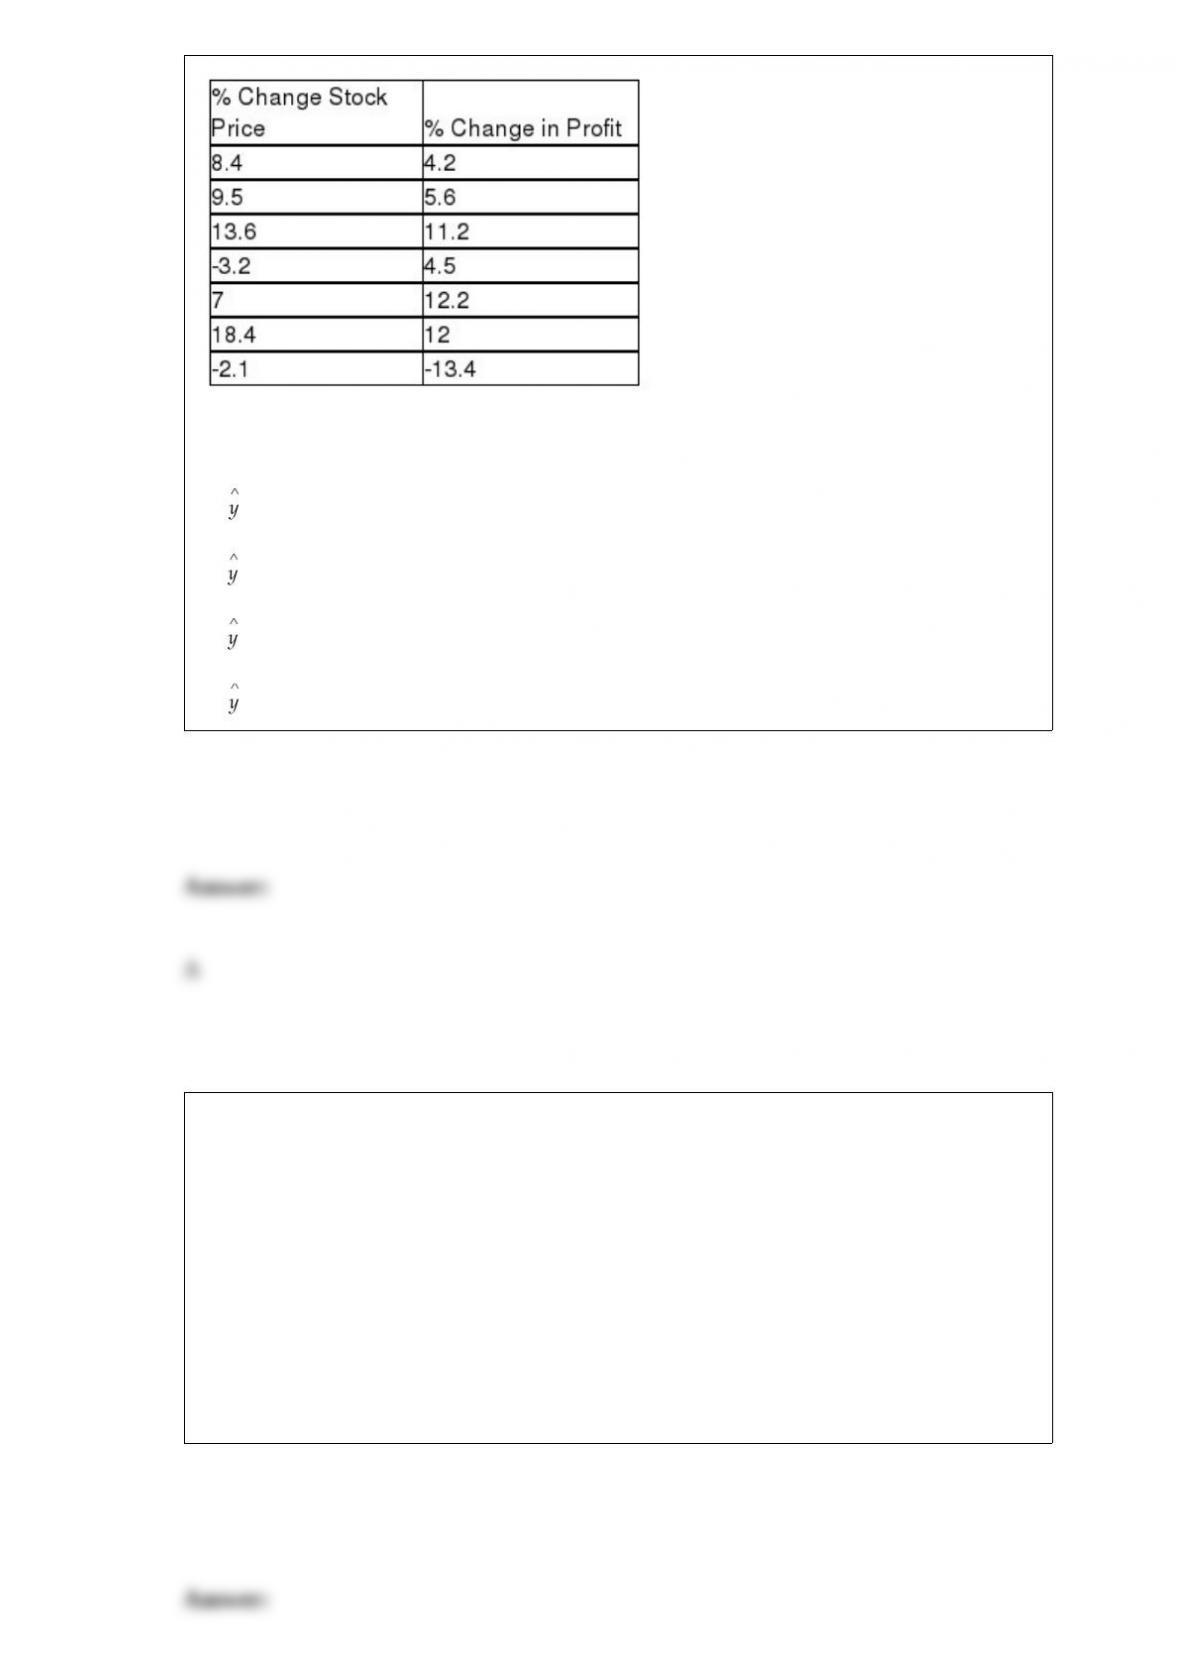
Based upon this sample information, which of the following is the regression equation?
A) = 4.19 + .61x
B) = 15.04 + 4.25x
C) = 1.19 – 3.00x
D) = 20.19 + .005x
It is thought that the time between customer arrivals at a fast food business is
exponentially distributed with λ equal to 5 customers per hour. Given this information,
what is the mean time between arrivals?
A) 12 minutes
B) 5 minutes
C) 5 hours
D) 2 minutes

A major textbook publisher has a contract with a printing company. Part of the contract
stipulates that no more than 5 percent of the pages should have any type of printing
error. As a quality control measure, the publisher periodically selects a random sample
of n = 100 pages. Then, depending on the proportion of pages with errors, they either
say nothing to the printer or they complain that the quality has slipped. Suppose the
publisher wants no more than a .10 chance of mistakenly blaming the printer for poor
quality, what should the cut-off proportion be?
A) About 0.0279
B) Approximately 0.0779
C) About 0.0221
D) About 0.10
Sales data measured each week for the past twenty weeks are examples of time-series
data.
The main process change that can be detected with a process control chart is:

A) the process average has shifted up or down from normal.
B) the process average is trending up or down from normal.
C) the process is behaving in such a manner that the existing variation is not random in
nature.
D) All of the above
Which of the following probability distributions would most likely be used to describe
the time between failures for electronic components?
A) Binomial distribution
B) Exponential distribution
C) Uniform distribution
D) Normal distribution
An advertising company has developed a new ad for one of the national car
manufacturing companies. The ad agency is interested in testing whether the proportion
of favorable response to the ad is the same between male adults versus female adults. It
plans on conducting the test using an alpha level equal to 0.05. A sample of 100 adults
of each gender will be used in the study. Each person will be asked to view the ad and
indicate whether they find the ad to be “pleasing” or not. The samples resulted in 57
males that liked the ad and 47 females that liked the ad. Based on this information, what

is the value of the test statistic?
A) z = 1.645
B) z = 1.42
C) t = 2.234
D) z = 1.024
In order to determine a parameter (such as a mean) of a population you would need to
conduct a:
A) population.
B) random sample.
C) census.
D) statistic.
If a sample with n = 60 subjects distributed over 3 categories was selected, a chi-square
test for goodness-of-fit will be used. How many degrees of freedom will be used in
determining the chi-square test statistic?
A) 1

B) 2
C) 16
D) 64
Consider a situation in which a used-car lot contains five Fords, four General Motors
(GM) cars, and five Toyotas. If five cars are selected at random to be placed on a
special sale, what is the probability that three are Fords and two are GMs?
A) 0.09
B) 0.03
C) 0.04
D) 0.06
A frequency histogram should be computed from which type of data?
A) Quantitative data
B) Categorical data
C) Nominal level data
D) Ordinal data

Drake Marketing and Promotions has randomly surveyed 200 men who watch
professional sports. The men were separated according to their educational level
(college degree or not) and whether they preferred the NBA or the National Football
League (NFL). The results of the survey are shown:
Suppose a survey participant is randomly selected and you are told that he has a college
degree. What is the probability that this man prefers the NFL?
A) 0.5250
B) 0.2000
C) 0.6050
D) 0.5880
A pet food producer manufactures and then fills 25-pound bags of dog food on two
different production lines located in separate cities. In an effort to determine whether
differences exist between the average fill rates for the two lines, a random sample of 19
bags from line 1 and a random sample of 23 bags from line 2 were recently selected.
Each bag’s weight was measured and the following summary measures from the
samples are reported:

Management believes that the fill rates of the two lines are normally distributed with
equal variances.
Calculate the point estimate for the difference between the population means of the two
lines.
A) 0.040
B) 0.034
C) -0.050
D) -0.042
Which of the following statements is true?
A) The mean of a population will always be larger than the population standard
deviation.
B) The mean of the population will generally be larger than the mean of the sample
selected from that population.
C) The population mean and a sample mean for a sample selected from that population
will usually be different values.
D) The population mean and sample mean will always be identical.
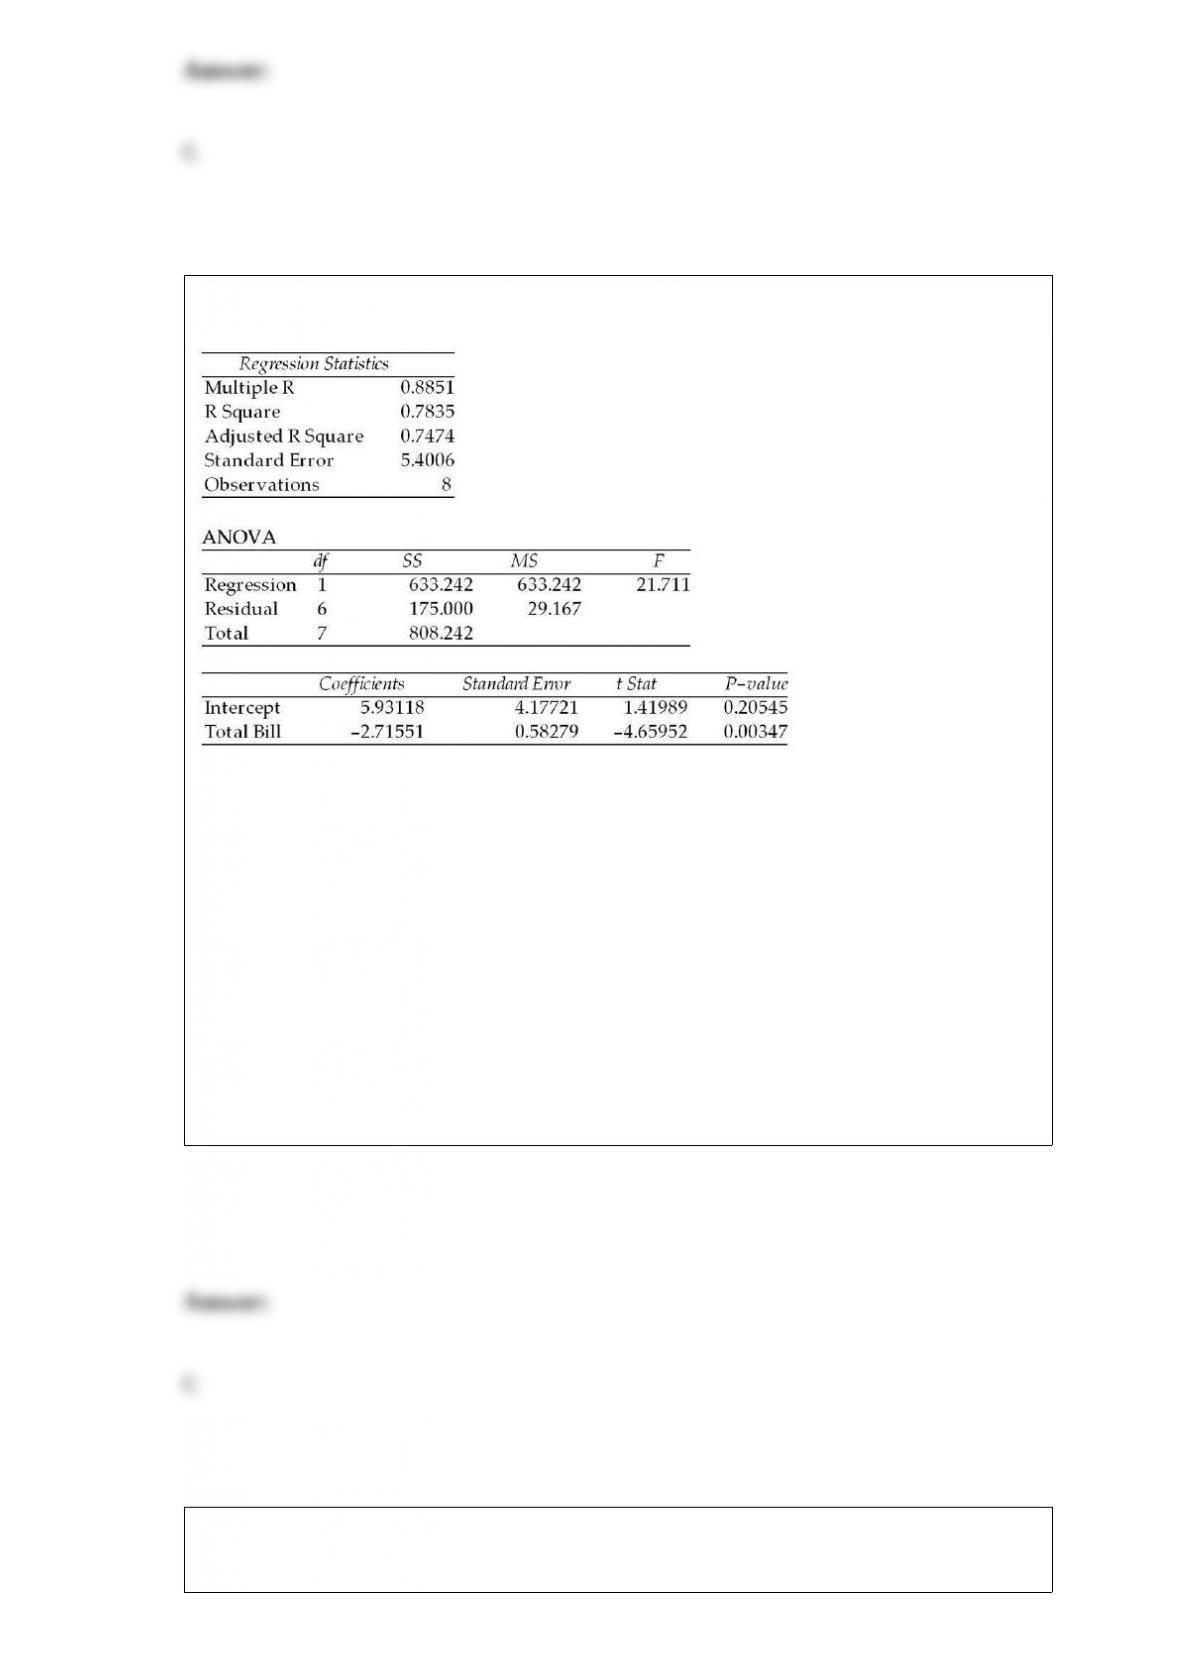
Use the following regression results to answer the question below.
In conducting a hypothesis test of the slope using a 0.05 level of significance, which of
the following is correct?
A) The slope differs significantly from 0 because p-value = 0.205 is greater than 0.05
B) The slope does not differ significantly from 0 because p-value = 0.205 is greater than
0.05
C) The slope differs significantly from 0 because p-value = 0.003 is less than 0.05
D) The slope does not differ significantly from 0 because p-value = 0.003 is less than
0.05
At gambling casinos all over the country, a popular dice game is called craps. The
probability of a player winning at this game can be assessed using:

A) subjective assessment.
B) classical probability.
C) relative frequency of occurrence.
D) None of the above
A company is interested in determining which of several advertising layouts is most
effective at generating additional sales. The data collection tool that would most likely
be used in this situation is:
A) telephone survey.
B) mail questionnaire.
C) experiment.
D) observation.
It is believed that number of people who attend a Mardi Gras parade each year depends
on the temperature that day. A regression has been conducted on a sample of years
where the temperature ranged from 28 to 64 degrees and the number of people
attending ranged from 8400 to 14,600. The regression equation was found to be =
2378 + 191x. Which of the following is true?

A) The average change in parade attendance is an additional 2378 people per
one-degree increase in temperature.
B) The average change in parade attendance is an additional 191 people per one-degree
increase in temperature.
C) If the temperature is 75 degrees, we can expect that 16,703 people will attend.
D) If the temperature is 0 degrees this year, then we should expect 2378 people to
attend.
A standardized residual is:
A) equal to the sum of the residuals divided by n-1.
B) the ratio of each residual divided by an estimate for the standard deviation of the
residuals.
C) a value that is normally distributed with a mean equal to zero and a standard
deviation equal to one.
D) None of the above
It is assumed that the time customers spend in a record store is uniformly distributed
between 3 and 12 minutes. Based on this information, what is the probability that a
customer will spend more than 9 minutes in the record store?

A) 0.33
B) 0.1111
C) 0.67
D) 0.25
A professor noted that the grades of his students were normally distributed with a mean
of 75.07 and a standard deviation of 11.65. If only 10 percent of the students received
grades of A, what is the minimum score needed to receive an A?
A) 80.00
B) 85.00
C) 90.00
D) 95.00
If we wish to test whether two related populations have equal medians, an appropriate
nonparametric test to use is:
A) the Mann-Whitney U test.
B) the Kruskal-Wallis test.
C) the Wilcoxon signed rank test.
D) the Wilcoxon matched-pairs signed rank test.
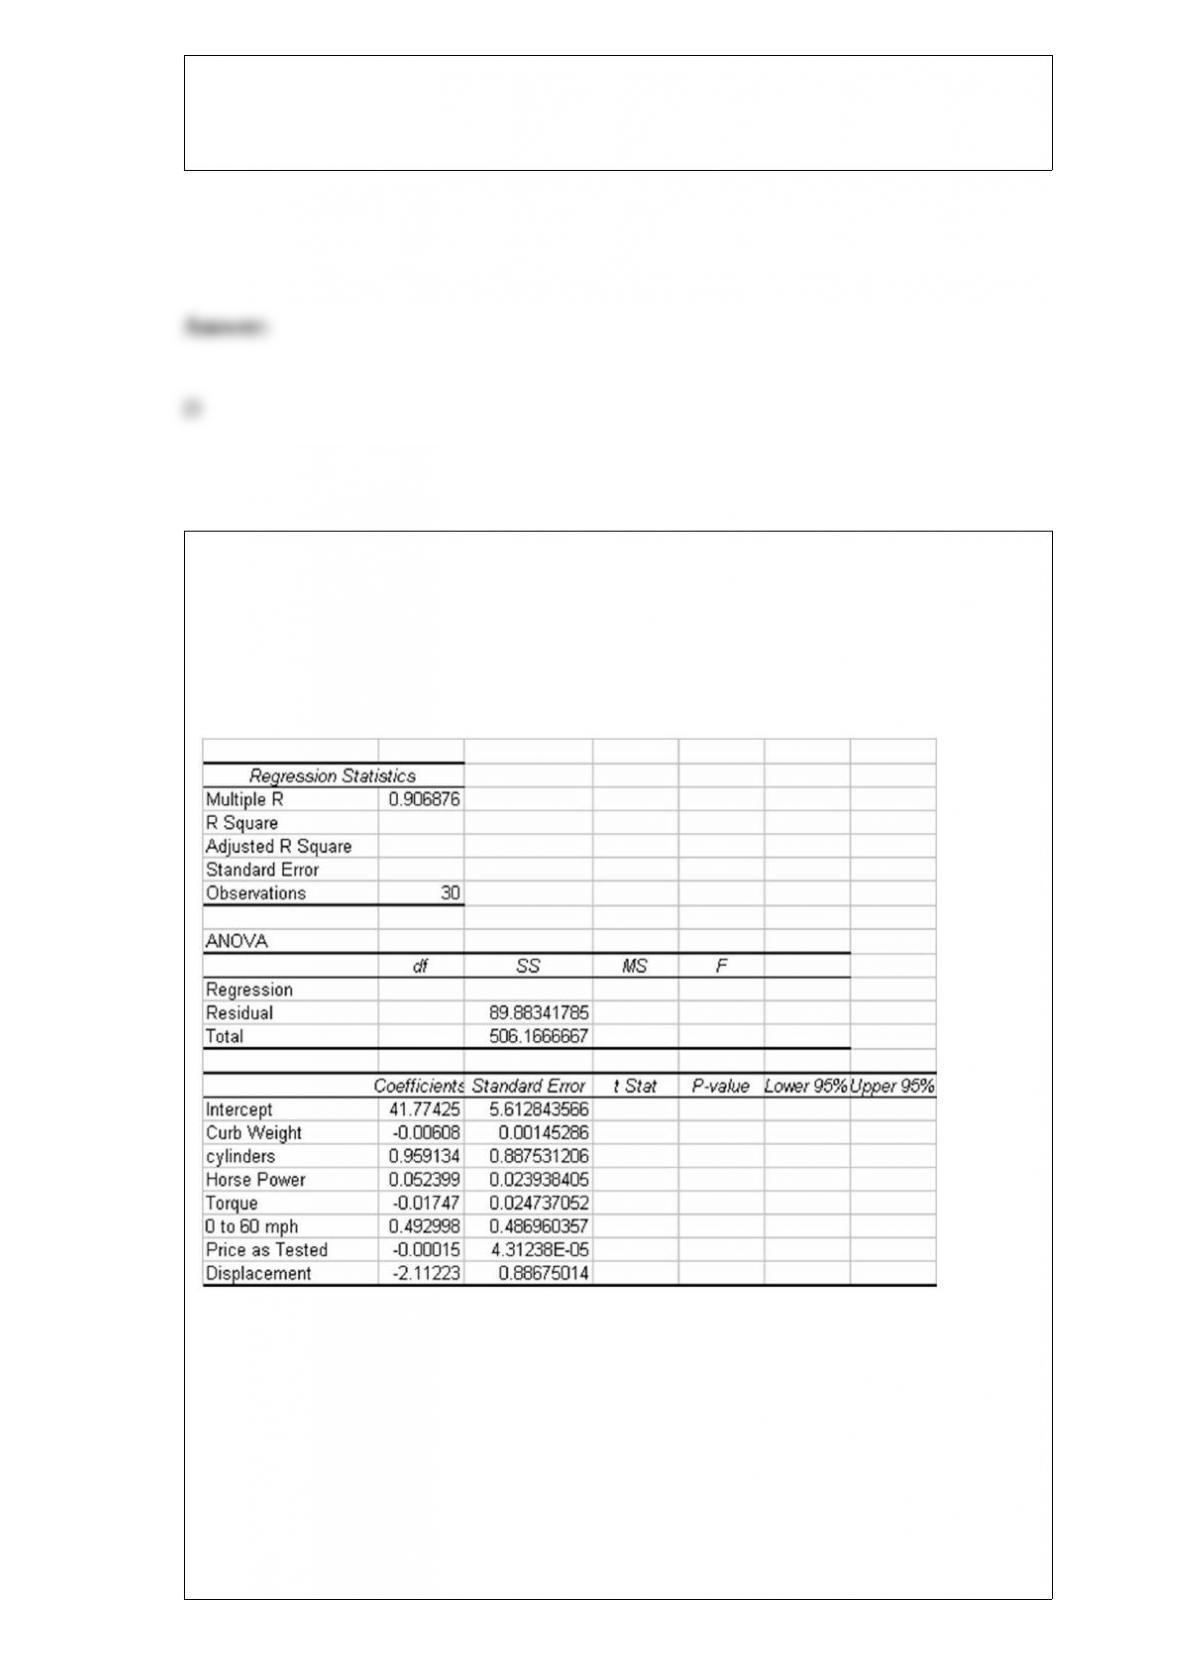
The editors of a national automotive magazine recently studied 30 different automobiles
sold in the United States with the intent of seeing whether they could develop a multiple
regression model to explain the variation in highway miles per gallon. A number of
different independent variables were collected. The following regression output (with
some values missing) was recently presented to the editors by the magazine’s analysts:
Based on this output and your understanding of multiple regression analysis, which of
the following statements is true?
A) The overall multiple regression model explains a significant portion of the variation
in highway mileage when tested at a significance level of 0.05.
B) Only the two independent variables are statistically significant in the presence of the
others when a significance level of 0.05 is used to test.
C) The standard error of the estimate is a negative value due to the multicollinearity
problems in the model.
D) None of the above is true.
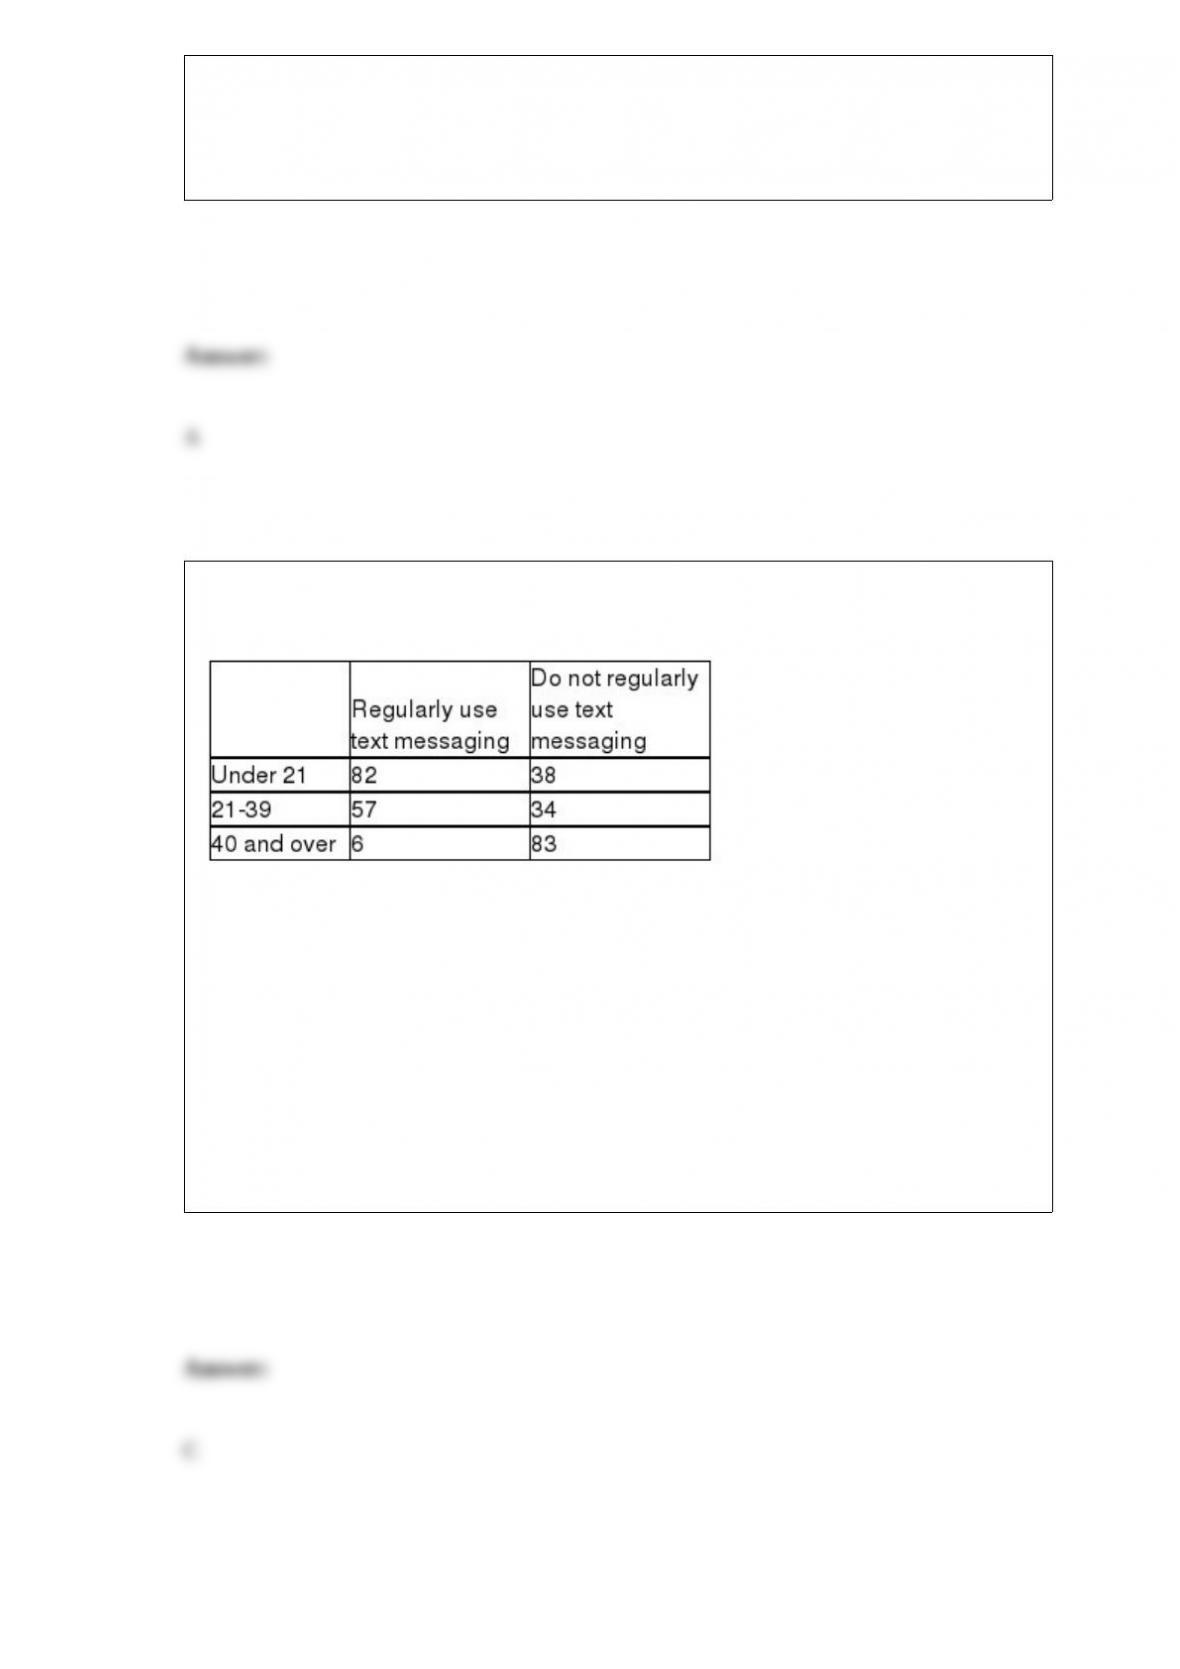
A cell phone company wants to determine if the use of text messaging is independent of
age. The following data has been collected from a random sample of customers.
To conduct a contingency analysis using a 0.01 level of significance, the value of the
critical value is:
A) 15.0863
B) 5.9915
C) 9.2104
D) 11.0705

Which of the following probability distributions could be used to describe the
distribution for a continuous random variable?
A) Exponential distribution
B) Normal distribution
C) Uniform distribution
D) All of the above
If we are performing a two-tailed test of whether μ = 100, the probability of detecting a
shift of the mean to 105 will be ________ the probability of detecting a shift of the
mean to 110.
A) less than
B) greater than
C) equal to
D) not comparable to
A p-chart is useful for:
A) analyzing whether a process for a measurable variable is in or out of control.

B) analyzing processes which yield attribute data.
C) determining what the most likely cause of defects is.
D) All of the above