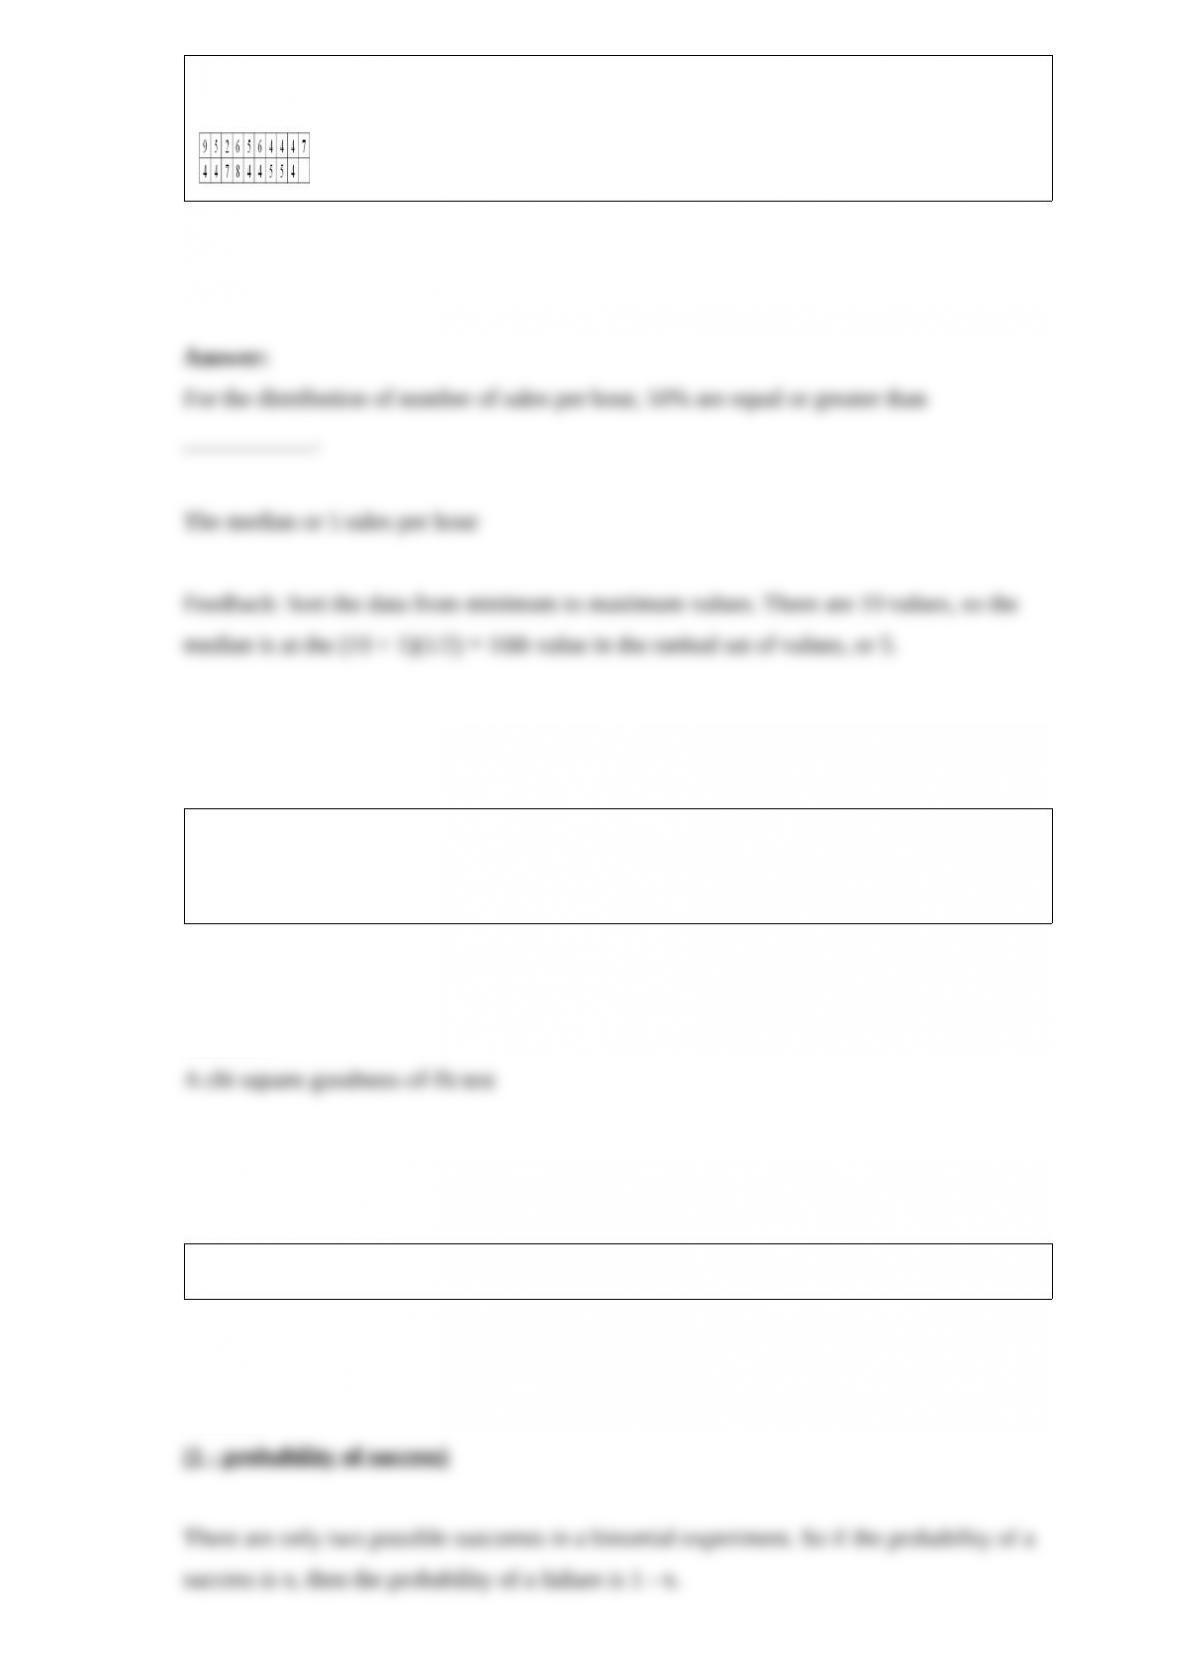
A telemarketing firm is monitoring the performance of its employees based on the
number of sales per hour. One employee had the following sales for the last 19 hours.
If we wanted to see if tossing a die (a cube with the sides numbered one through six)
had an equal chance of showing each side or number, what statistical test should be
applied?
In a binomial experiment, the probability of a failure equals _________.
When applying stepwise regression, the basis for including an independent variable in a
multiple regression model is __________.
For an inverse relationship between two variables, the sign of the correlation coefficient
is __________________.
Deciding on the number of observations to include in a sample is an important decision
when planning a research study. What information is required to make this decision?

In hypothesis testing, the probability of a Type I error is also called the
_________________.
The types of variables called _______________ are summarized in a contingency table.
A research firm conducted a survey to determine the mean amount people spend at a
popular coffee shop during a week. They found the amounts spent per week followed a
normal distribution with a population standard deviation of $4. A sample of 64
customers revealed that the mean is $25. What is the 99% confidence interval estimate
of ?
When we make an estimate or prediction, we use _______________.
A manufacturer wants to increase the shelf life of a line of cake mixes. Past records
indicate that the average shelf life of the mix is 216 days. After a revised mix has been
developed, a sample of nine boxes of cake mix had a mean of 217.222 and a standard
deviation of 1.2019. At the 0.025 significance level, what is the critical value?

A statistic computed by summing all of the values of a distribution and dividing by the
number of values is called the __________.
In a Poisson distribution, the mean and variance are ________________.
Perfect correlation means that the scatter diagram will appear as a _____________.