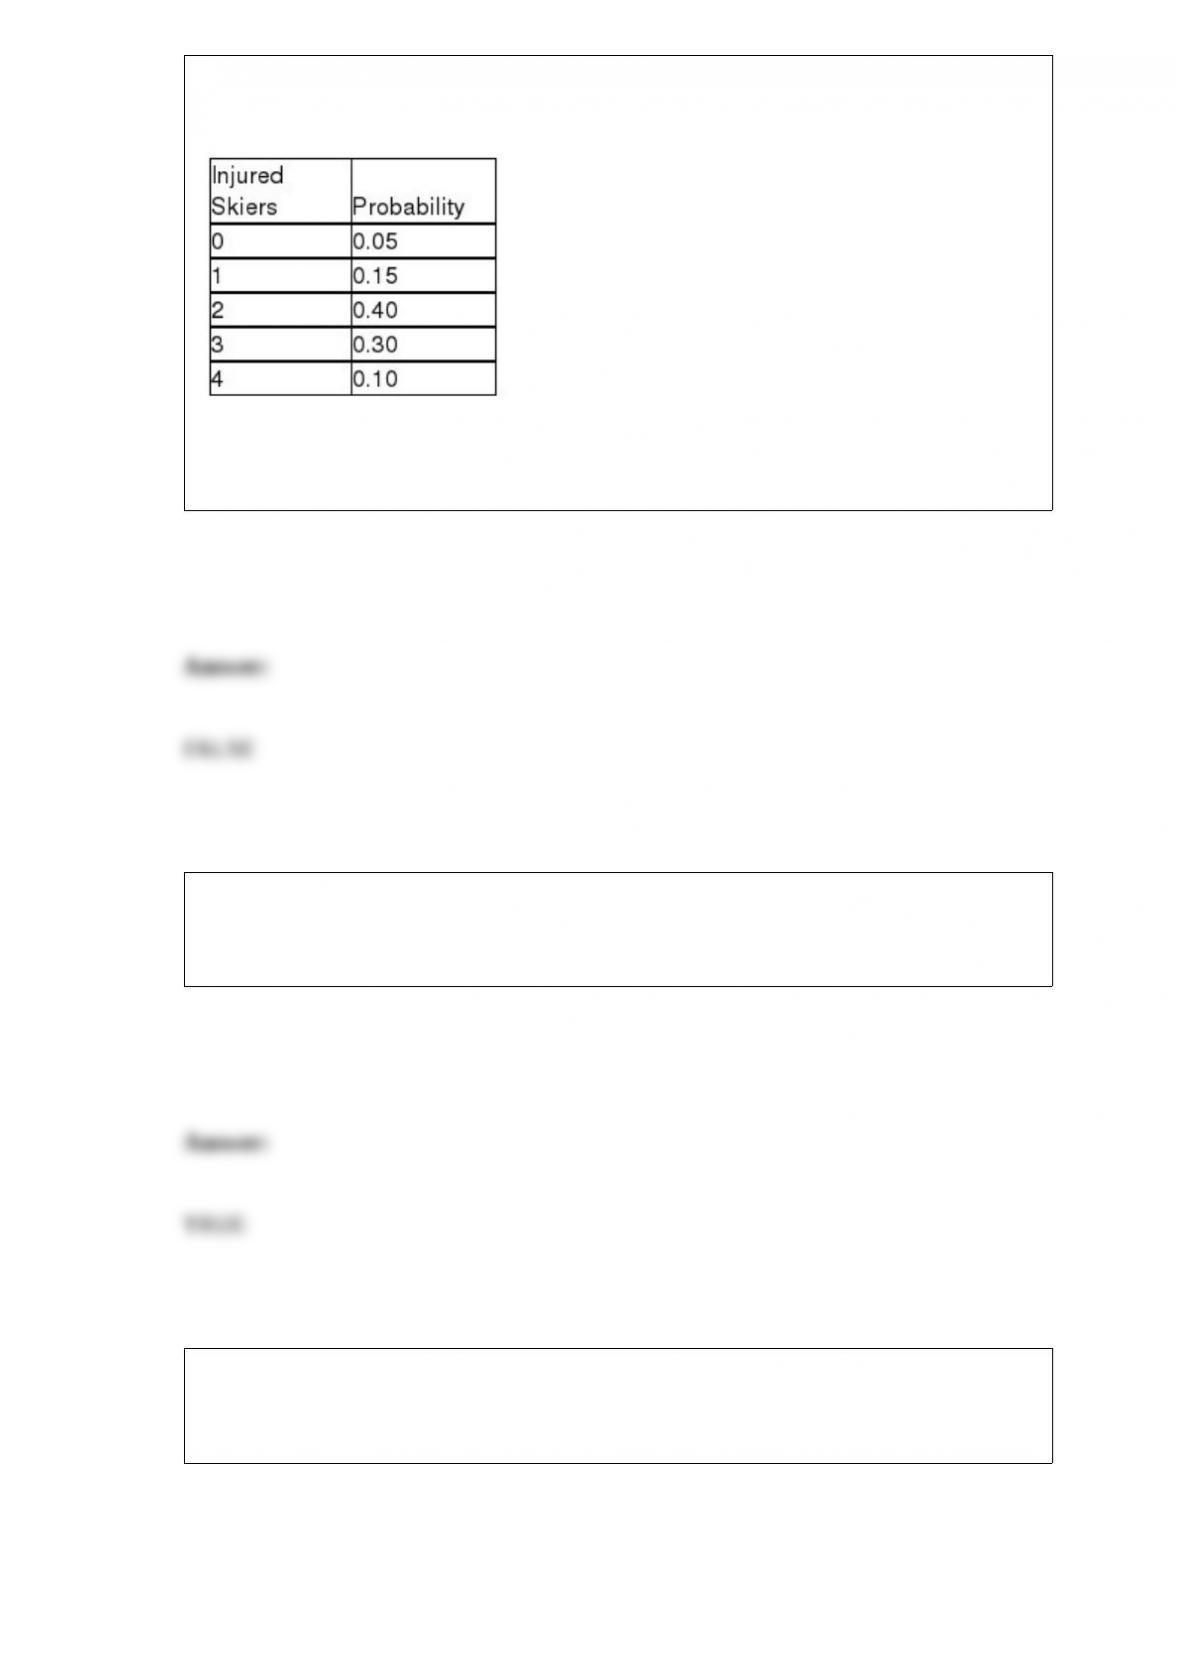
The Ski Patrol at Criner Mountain Ski Resort has determined the following probability
distribution for the number of skiers that are injured each weekend:
Based on this information, the standard deviation for the number of injuries per
weekend is 2.25.
If a population standard deviation is computed to be 345, it will almost always be the
case that a standard deviation computed from a random sample from that population
will be larger than 345.
Increasing the size of the samples in a study to estimate the difference between two
population means will increase the level of confidence that a decision maker can have
regarding the interval estimate.
Standard stepwise regression combines attributes of both forward selection and
backward elimination.
When finding sample size, cutting the margin of error in half requires that the sample
size be four times larger.
A distribution is said to be symmetric when the sample mean and the population mean
are equal.
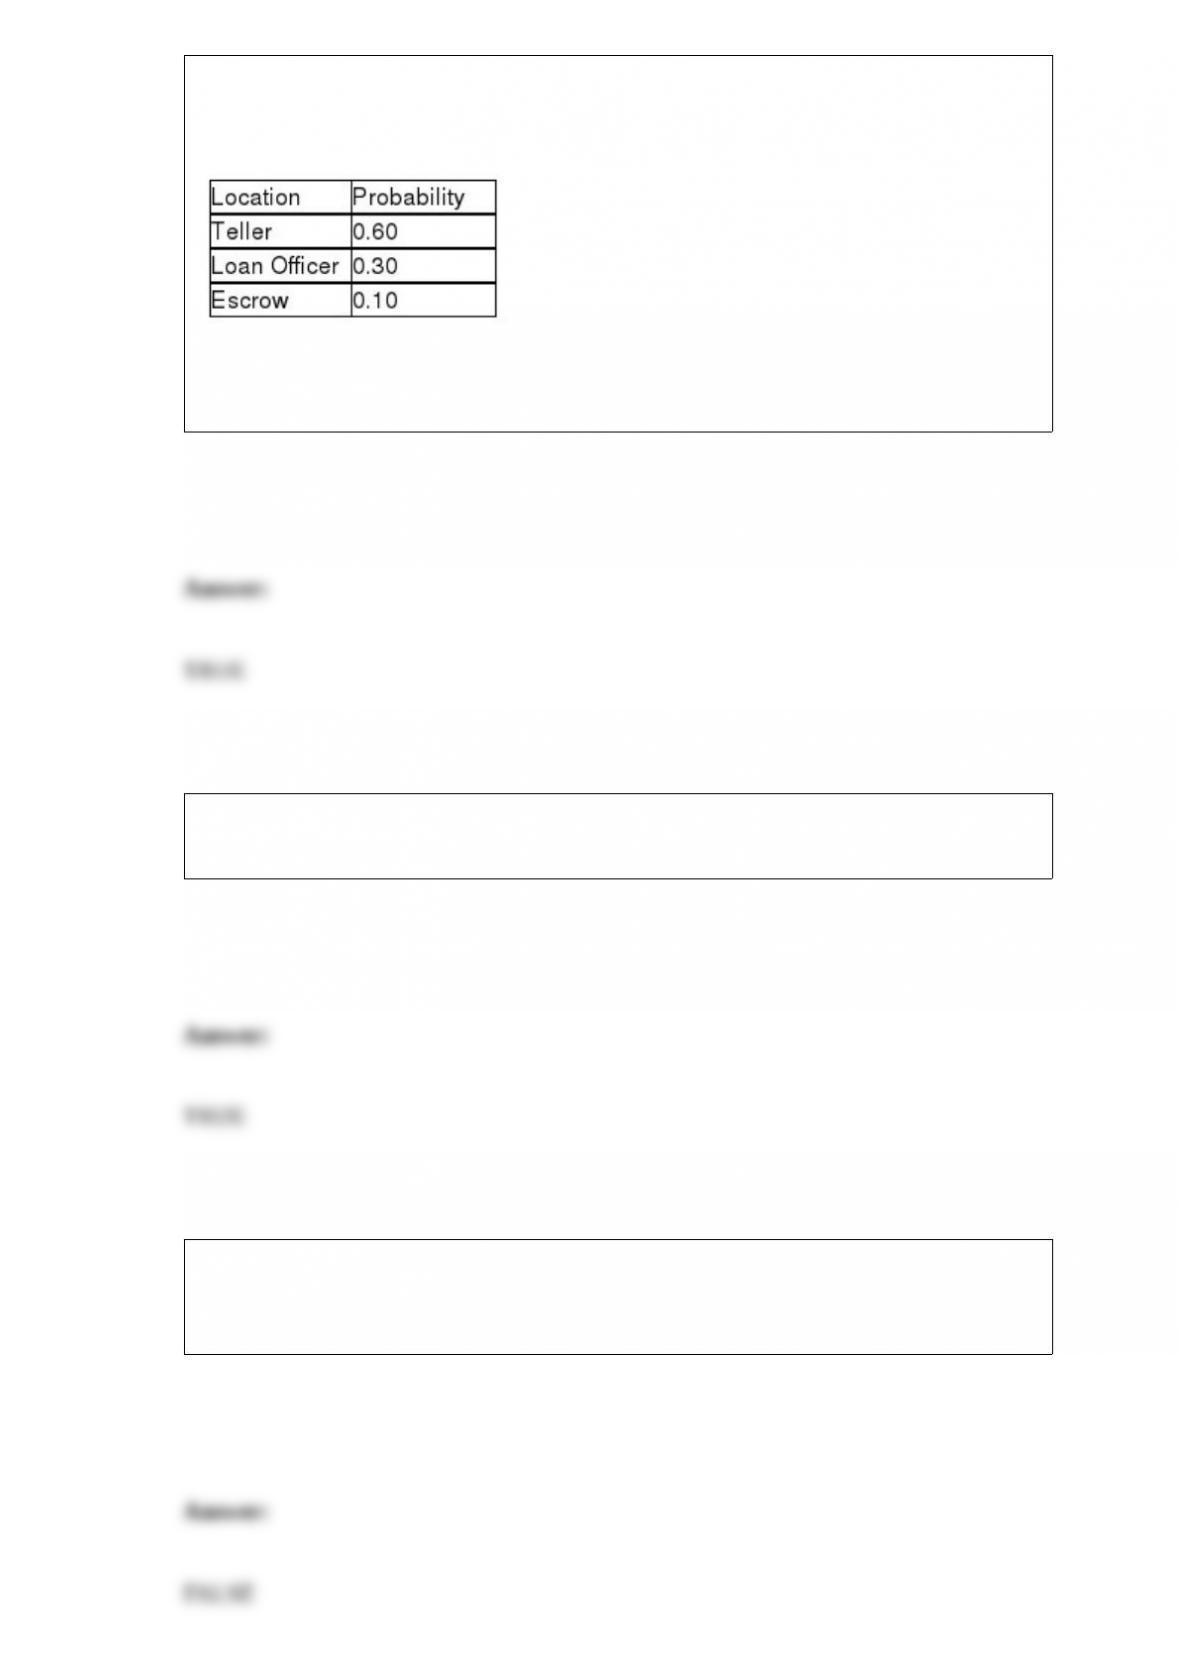
When customers come to a bank, there are three primary locations they may select to go
to: teller, loan officer, or escrow department. Based on past experience, the following
probability distribution applies:
Seventy percent of customers are males. The probability that the next customer will be
male and will go to either the teller or the escrow department is 0.49.
A variable, i.e., the length of time it takes for an employee to complete an assembly
procedure at an automotive plant, is a ratio level variable.
A random sample of 100 boxes of cereal had a sample mean weight of 396 grams. The
standard deviation is known to be 5 grams. The upper end of the confidence interval for
the mean is 405.8 grams.
The multiple coefficient of determination is the average of all the squared correlations
of the independent variables.
When using the t-distribution in a hypothesis test, the population does not need to be
assumed normally distributed.
If we are interested in estimating the population mean based on a sample from a
population for which we know neither the mean nor the standard deviation, the critical
value will be a t value from the t-distribution.
For a given sample size and a given confidence level, the closer p is to 1.0, the greater
the margin of error will be.
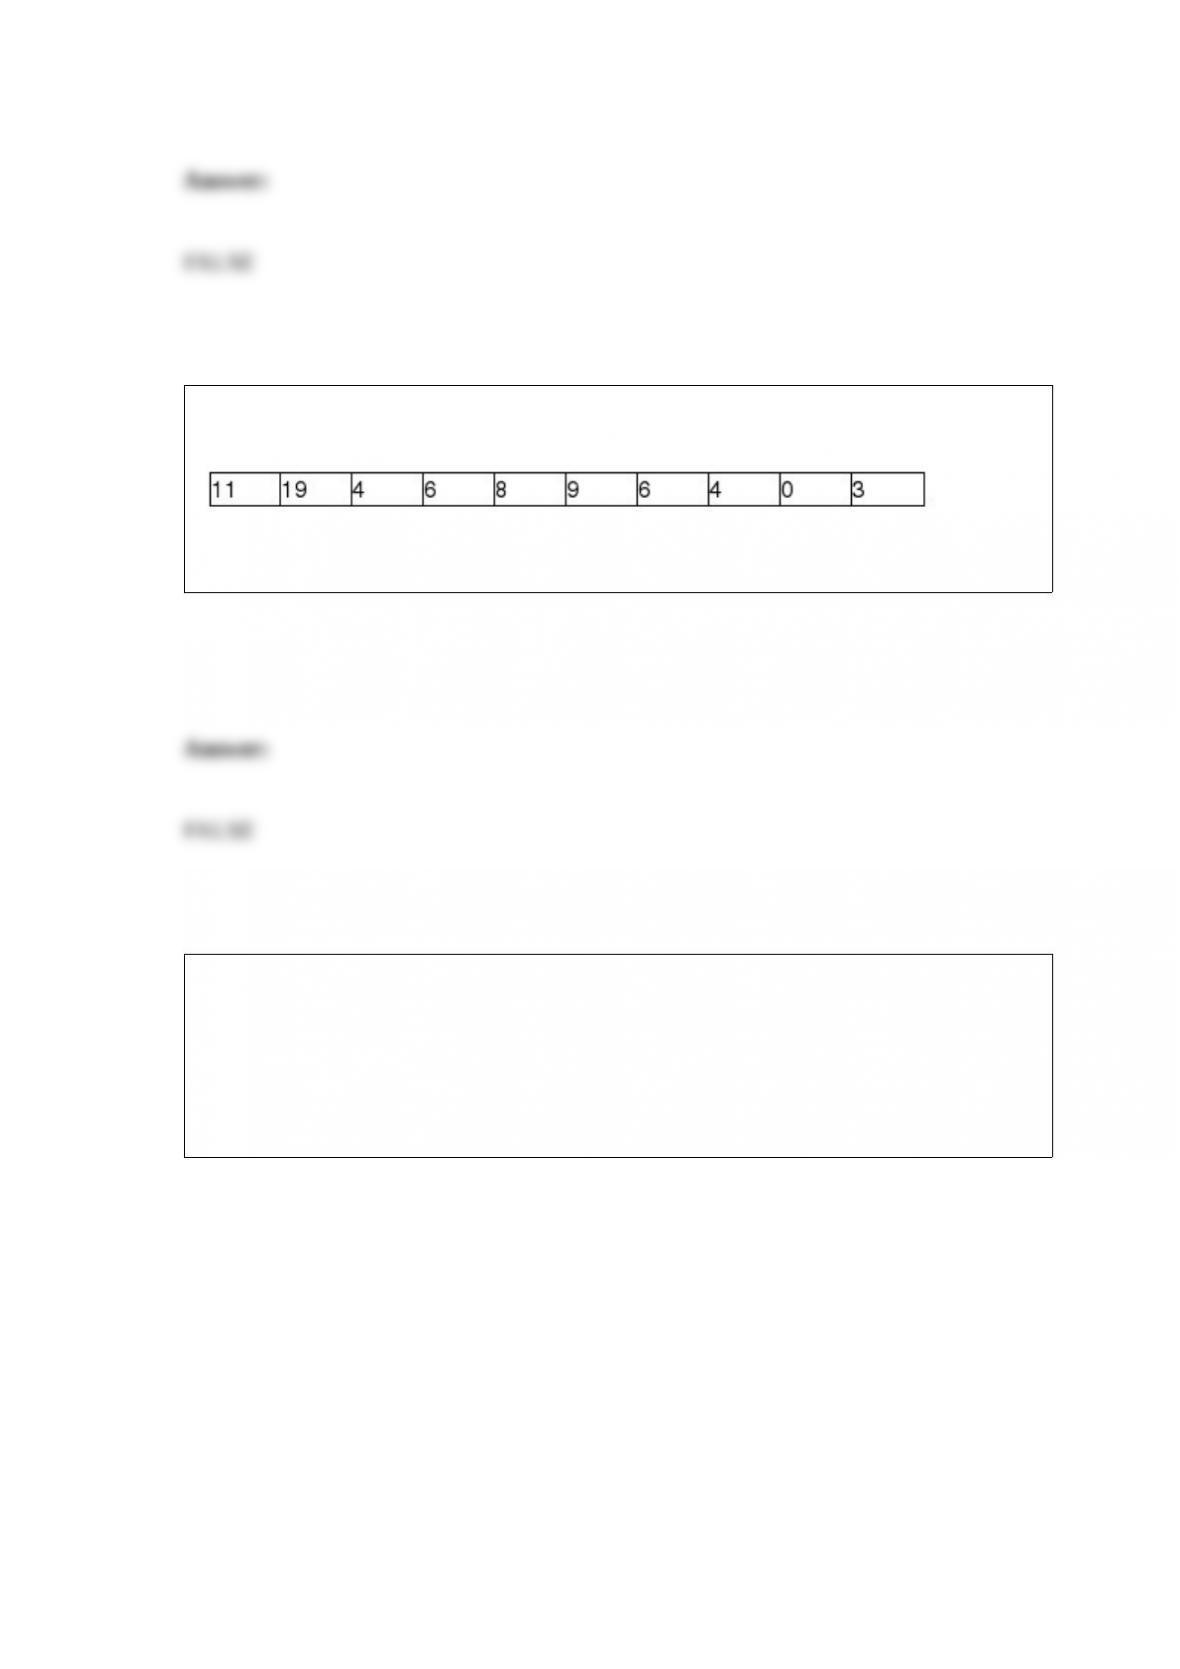
A store manager tracks the number of customer complaints each week. The following
data reflect a random sample of ten weeks.
The range for these data is 8.
A study has recently been conducted by a major computer magazine publisher in which
the objective was to develop a multiple regression model to explain the variation in
price of personal computers. Three quantitative independent variables were used along
with one qualitative variable. The qualitative variable was coded 1 if the computer
included a monitor, 0 otherwise. The following computer printout shows the final
output.
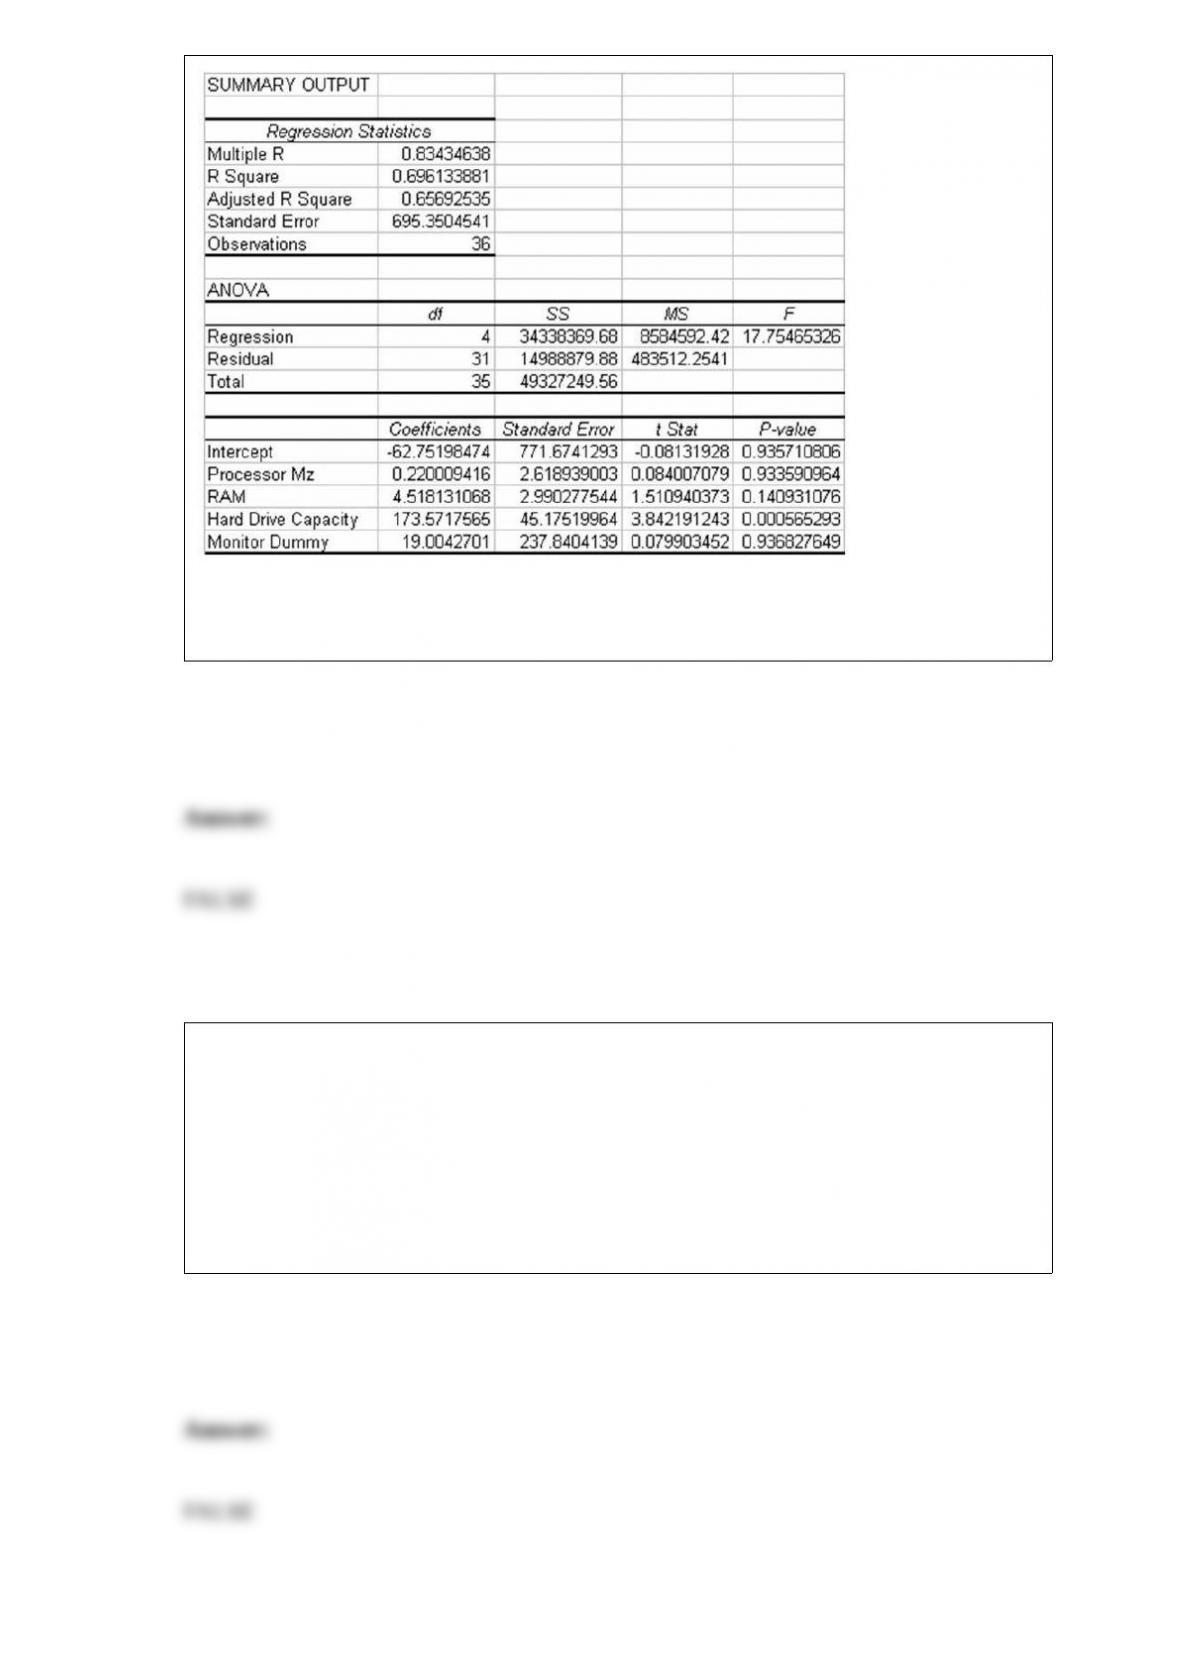
Based on this information, given the other variables in the model, whether or not a
monitor is included has a significant impact on the price of the personal computer.
A bank is interested in determining whether its customers’ checking balances are
linearly related to their savings balances. A sample of n = 20 customers was selected
and the correlation was calculated to be +0.40. If the bank is interested in testing to see
whether there is a significant linear relationship between the two variables using a
significance level of .05, the correct null and alternative hypotheses to test are:
H0 : r = 0.0
Ha : r ≠ 0.0
When the variables of interest are both categorical and the decision maker is interested
in determining whether a relationship exists between the two, a statistical technique
known as contingency analysis is useful.
When using a chi-square test for the variance of one population, we are assuming that
the population is normally distributed.
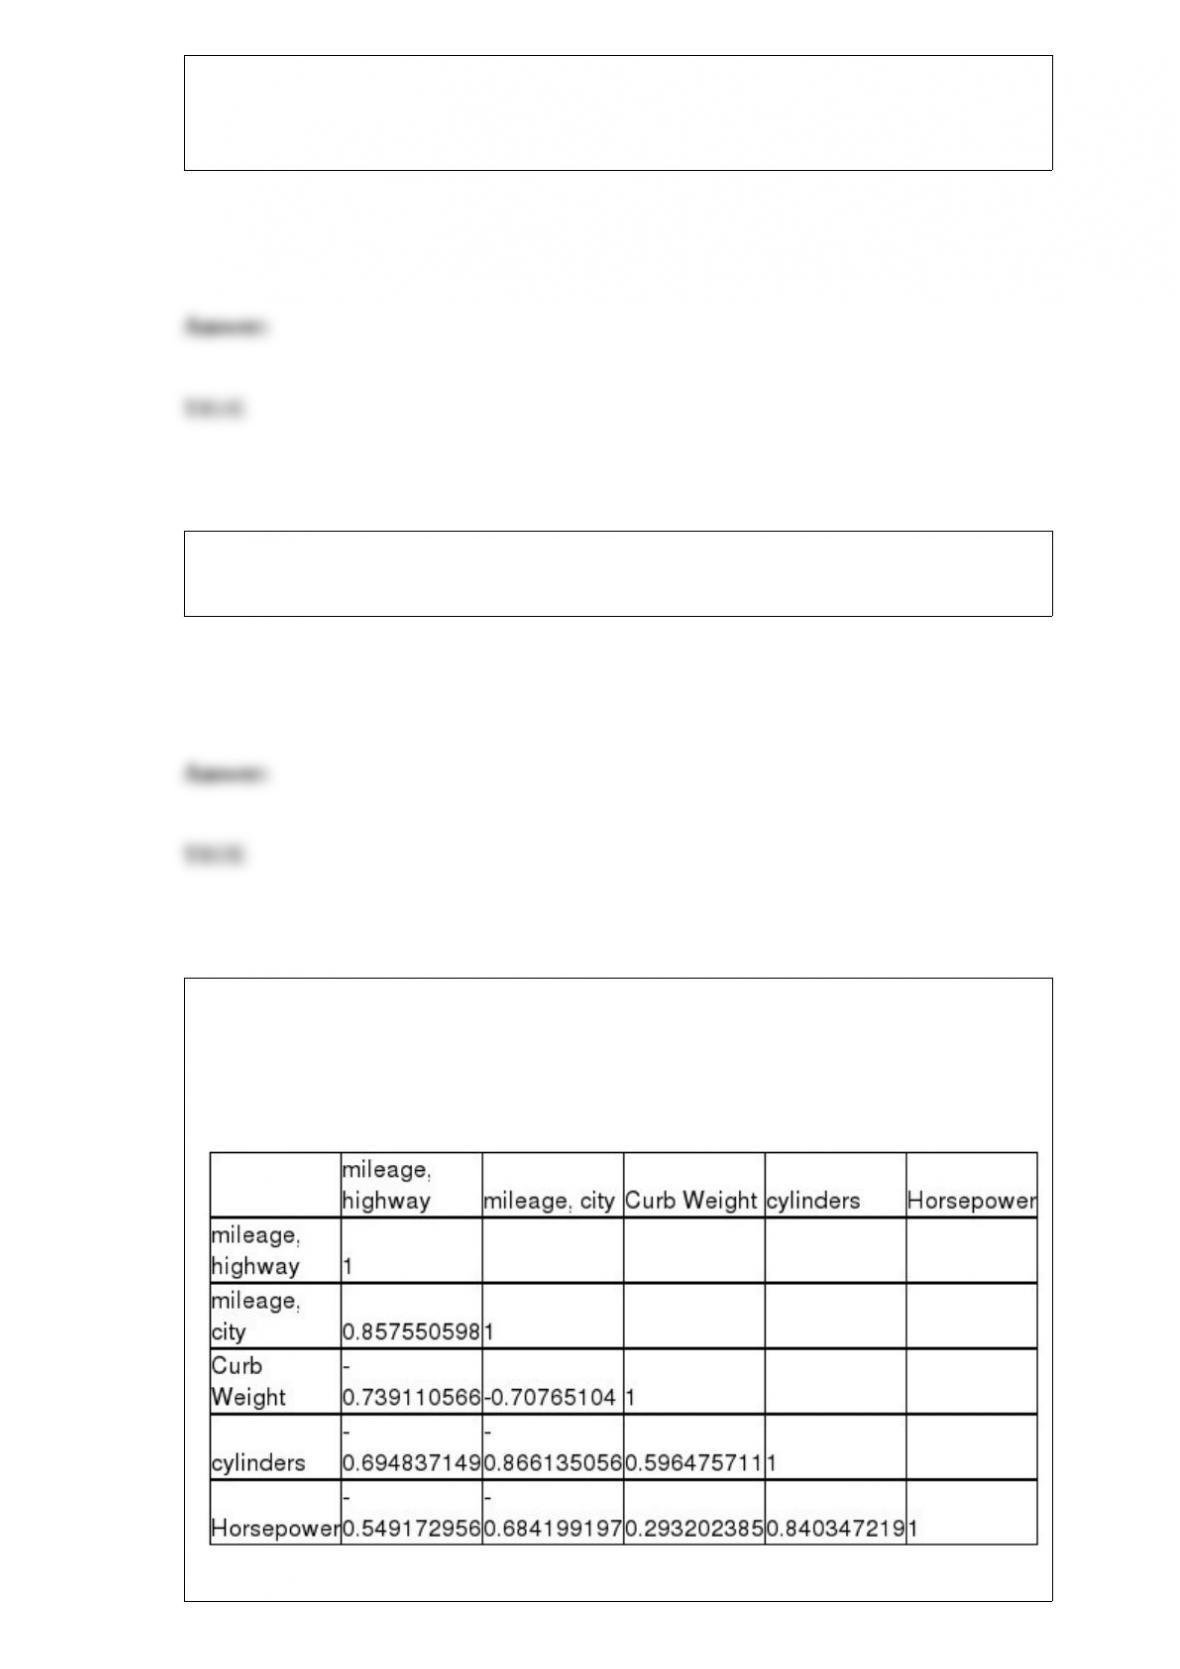
A major car magazine has recently collected data on 30 leading cars in the U.S. market.
It is interested in building a multiple regression model to explain the variation in
highway miles. The following correlation matrix has been computed from the data
collected:
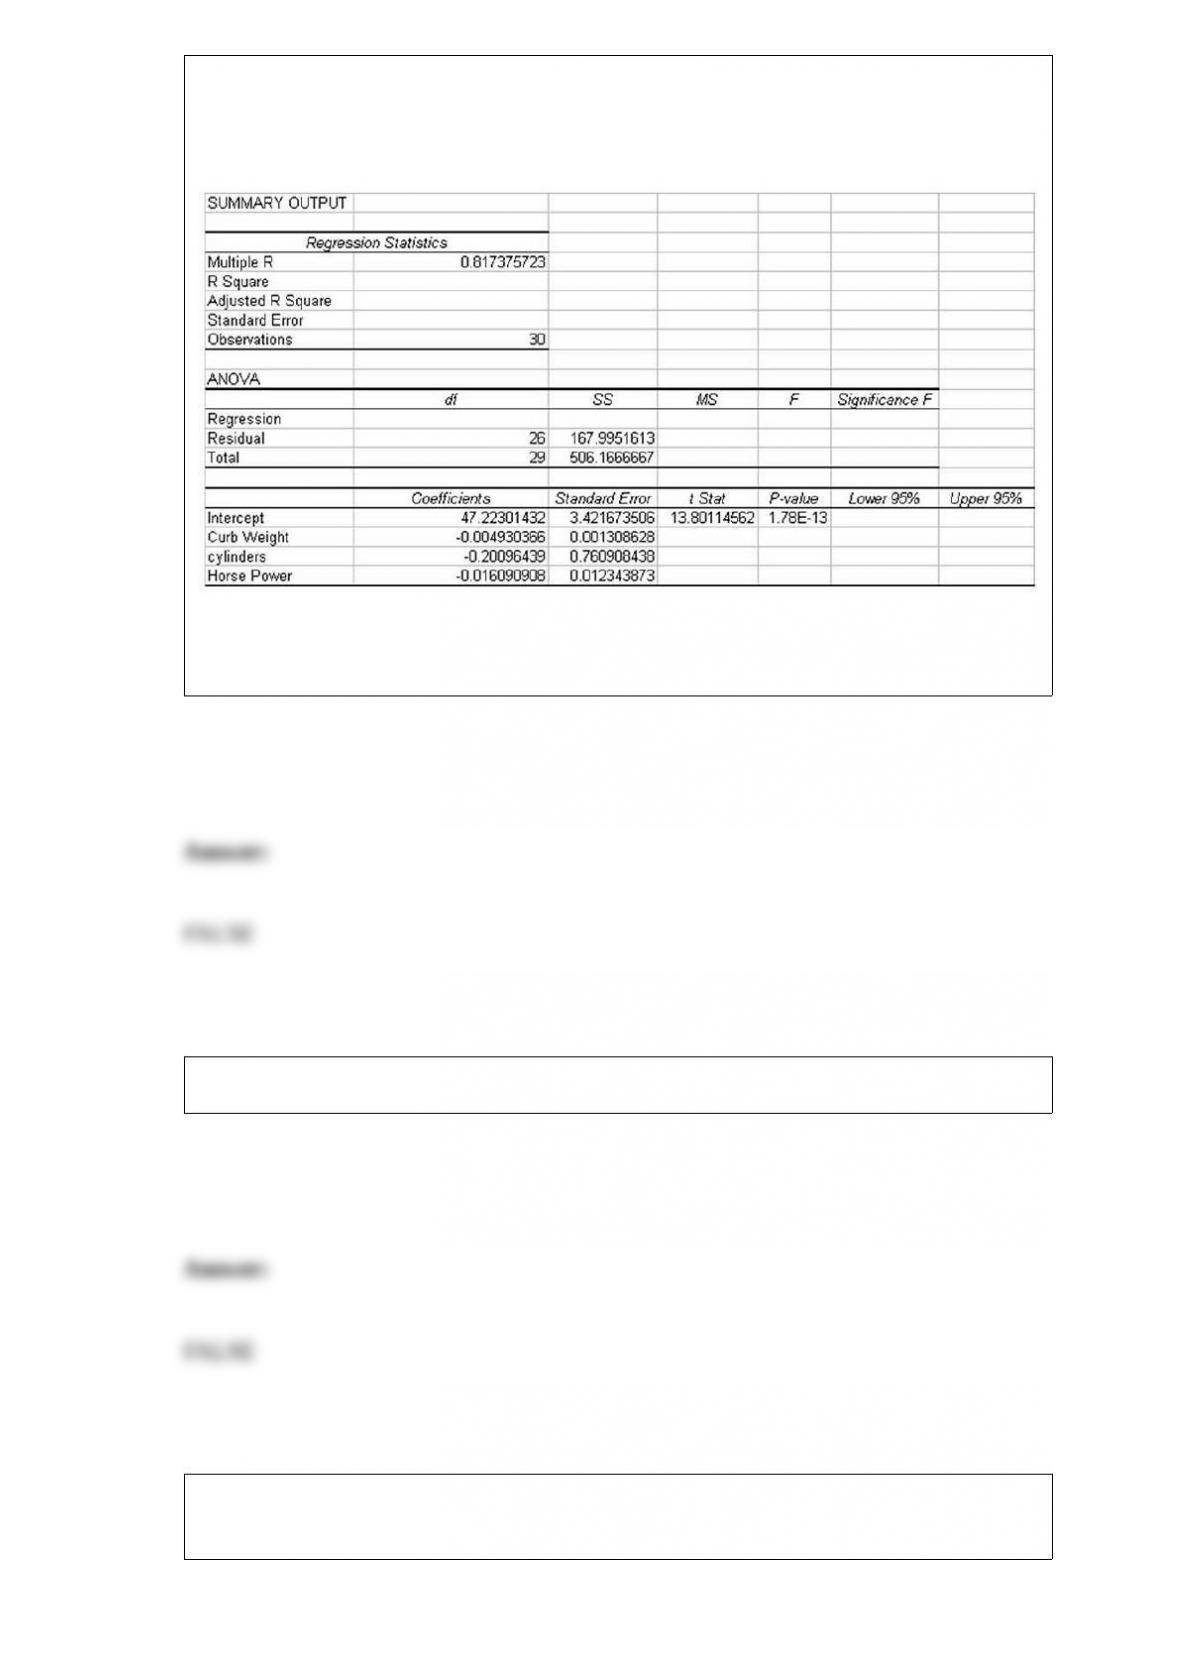
The analysts also produced the following multiple regression output using curb weight,
cylinders, and horsepower as the three independent variables. Note, a number of the
output fields are missing, but can be determined from the information provided.
Based on this information, the standard error of the estimate for the regression model is
approximately 6.46 miles per gallon.
A scatter diagram is a line graph without the points connected by a line.
A small engine repair shop tracks the number of customers who call each day. This
variable is a time-series variable and also ratio level.

In a particular city, the proportion of cars that would fail an air quality emissions test is
thought to be 0.13. Given this, the probability that a random sample of n = 200 cars will
have a sample proportion between 0.11 and 0.15 is approximately 0.60.
A university recently collected data for a sample of 200 business majors. One variable
collected was the number of credits left to be taken before graduation. This variable
could effectively be displayed using a line chart.
The number of defects discovered in a random sample of 100 products produced at the
Berdan Manufacturing Company is binomially distributed with p = .03. Based on this,
the standard deviation of the number of defects per sample of size 100 is 2.91.
In a two-tailed test for the equality of two variances, the critical value is determined by
going to the F-distribution table with an upper-tail area equal to alpha divided by two.
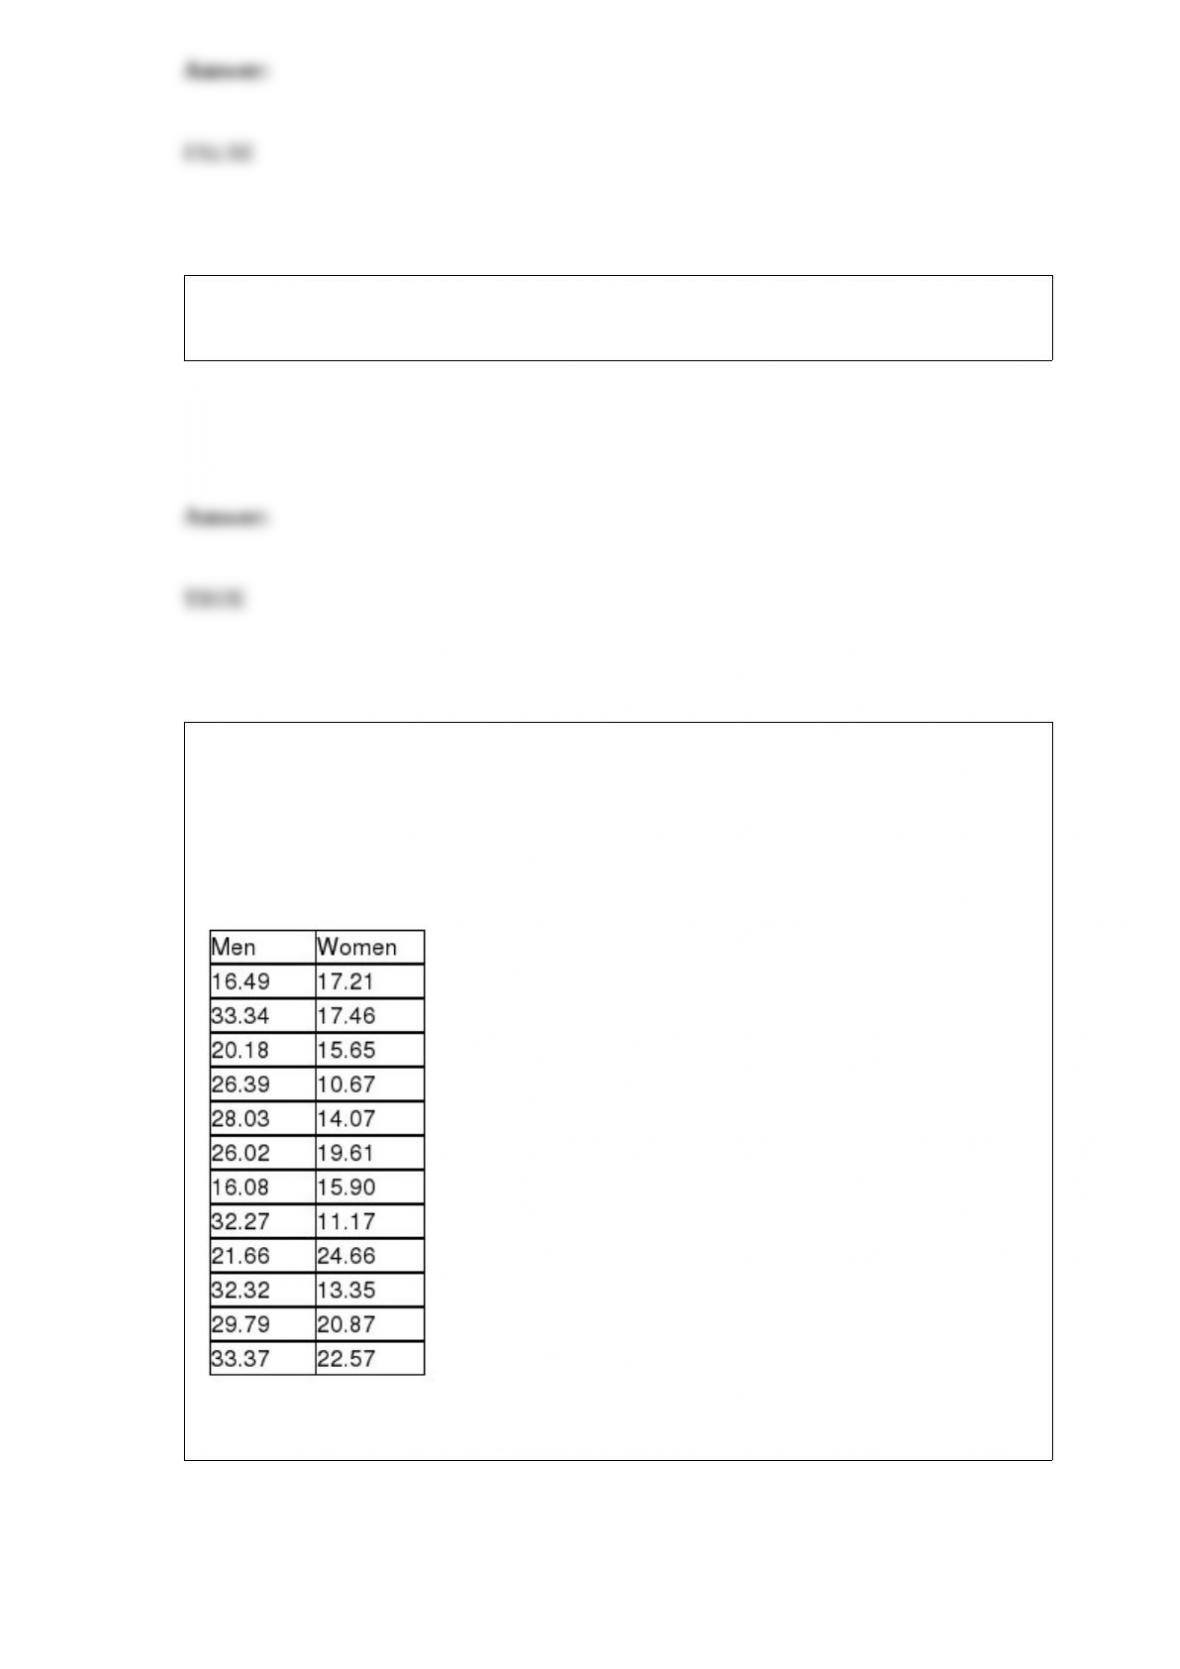
The Cranston Hardware Company is interested in estimating the difference in the mean
purchase for men customers versus women customers. It wishes to estimate this
difference using a 95 percent confidence level. Assume that the variances are equal and
the populations normally distributed. The following data represent independent samples
from each population:
Based on these data, the upper limit of the interval estimate is approximately $13.82.
The adjusted R2 value can be larger or smaller that the R2 values depending on the data
set.
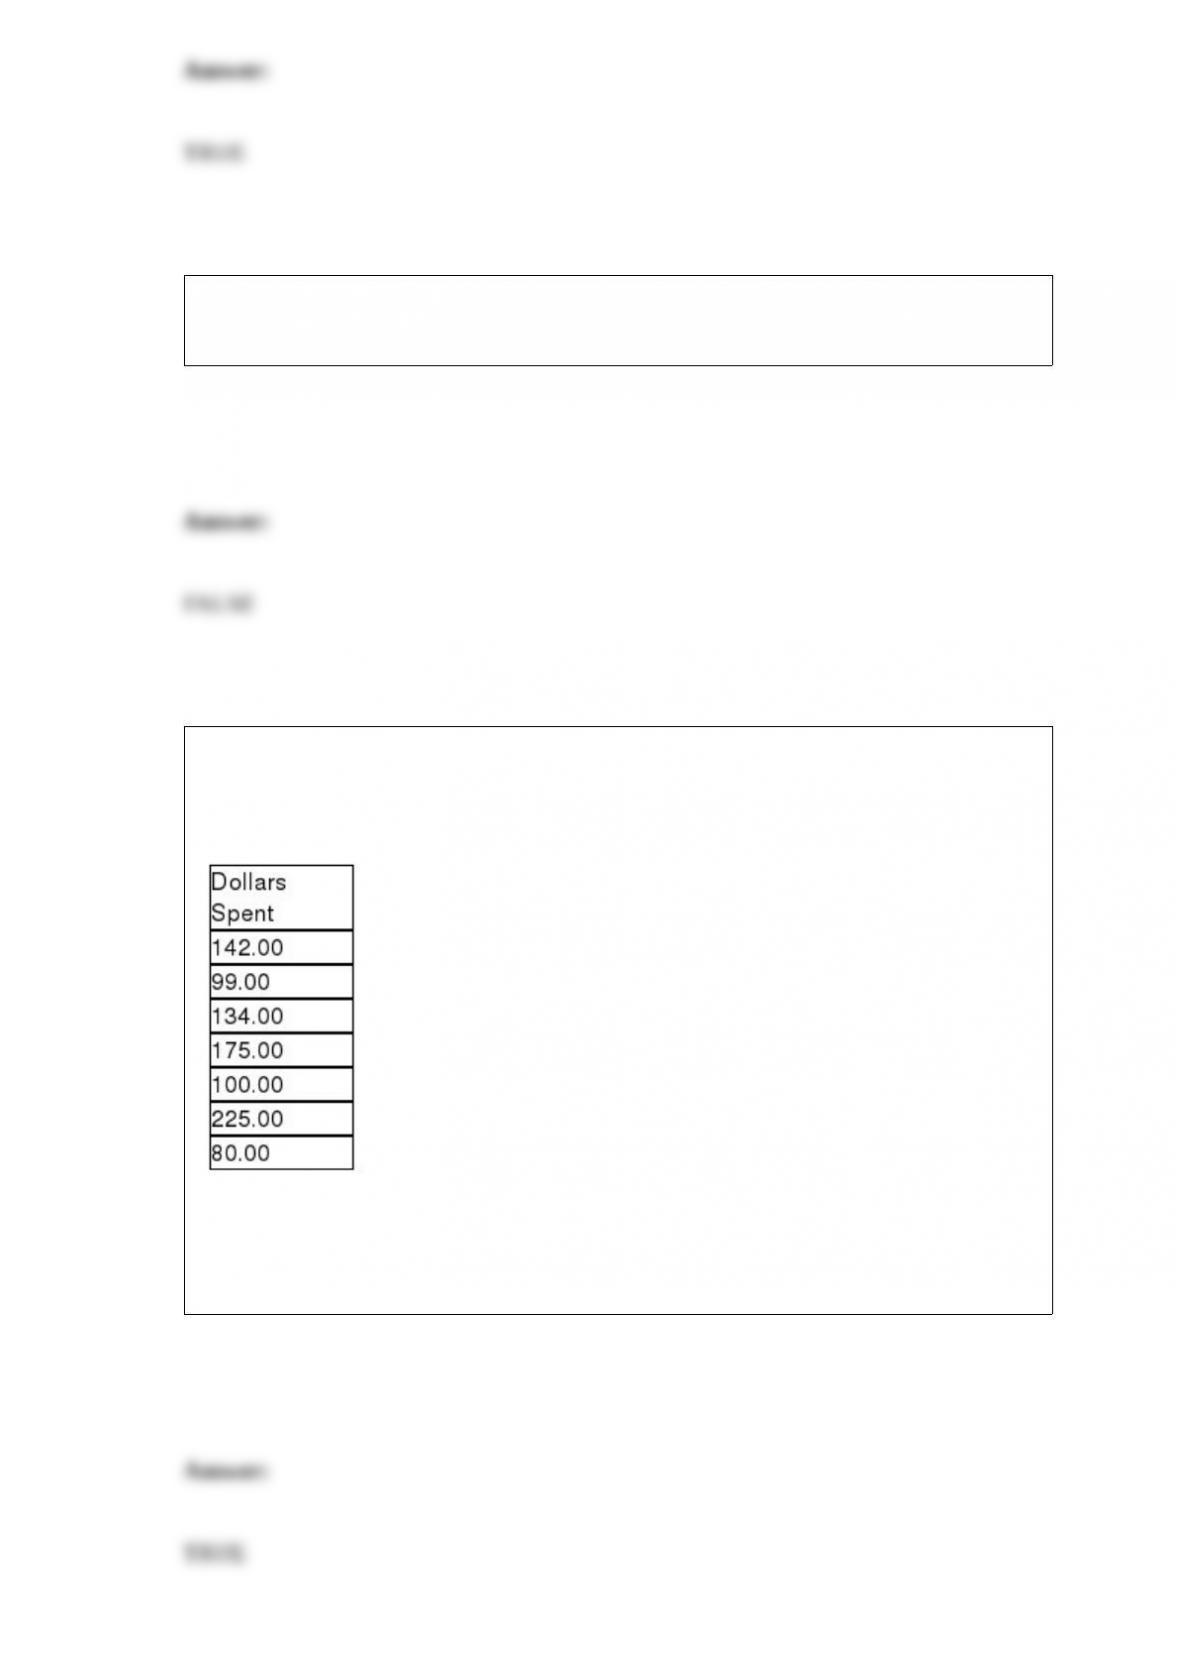
Recently, Major League Baseball officials stated that the median cost for a family of
four to attend a baseball game including, parking, tickets, food, and drinks did not
exceed $125.00. The following sample data were collected:
Assuming that the test of the owners’ claim is going to be conducted using an alpha = .
05 level, the null hypothesis that the median cost does not exceed $125 should not be
rejected.
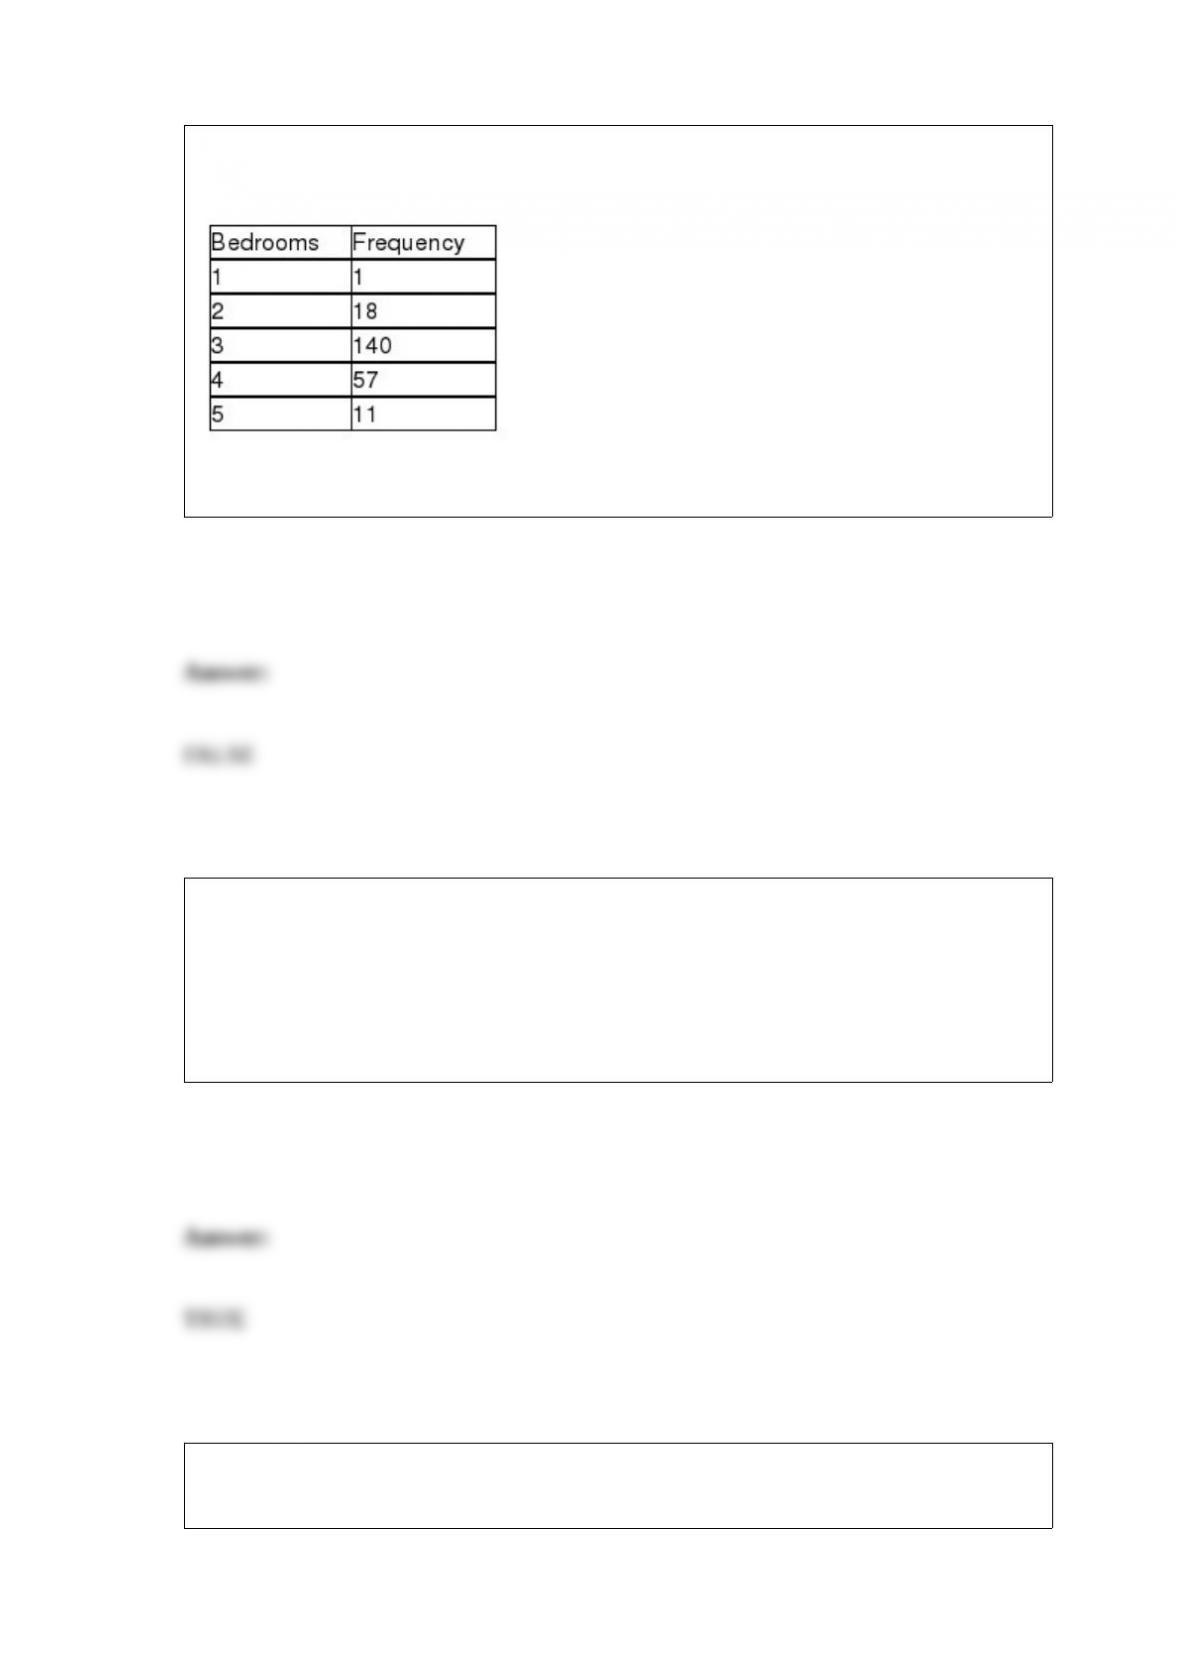
Suppose a study of houses that have sold recently in your community showed the
following frequency distribution for the number of bedrooms:
Based on this information, the mode for the data is 140.
The Conrad Real Estate Company recently conducted a statistical test to determine
whether the number of days that homes are on the market prior to selling is normally
distributed with a mean equal to 50 days and a standard deviation equal to 10 days. The
sample of 200 homes was divided into 8 groups to form a grouped data frequency
distribution. If a chi-square goodness-of-fit test is to be conducted using an alpha = .05,
the critical value is 14.0671.
In a one-way analysis of variance design, there is a single factor of interest but there
may be multiple levels of the factor.
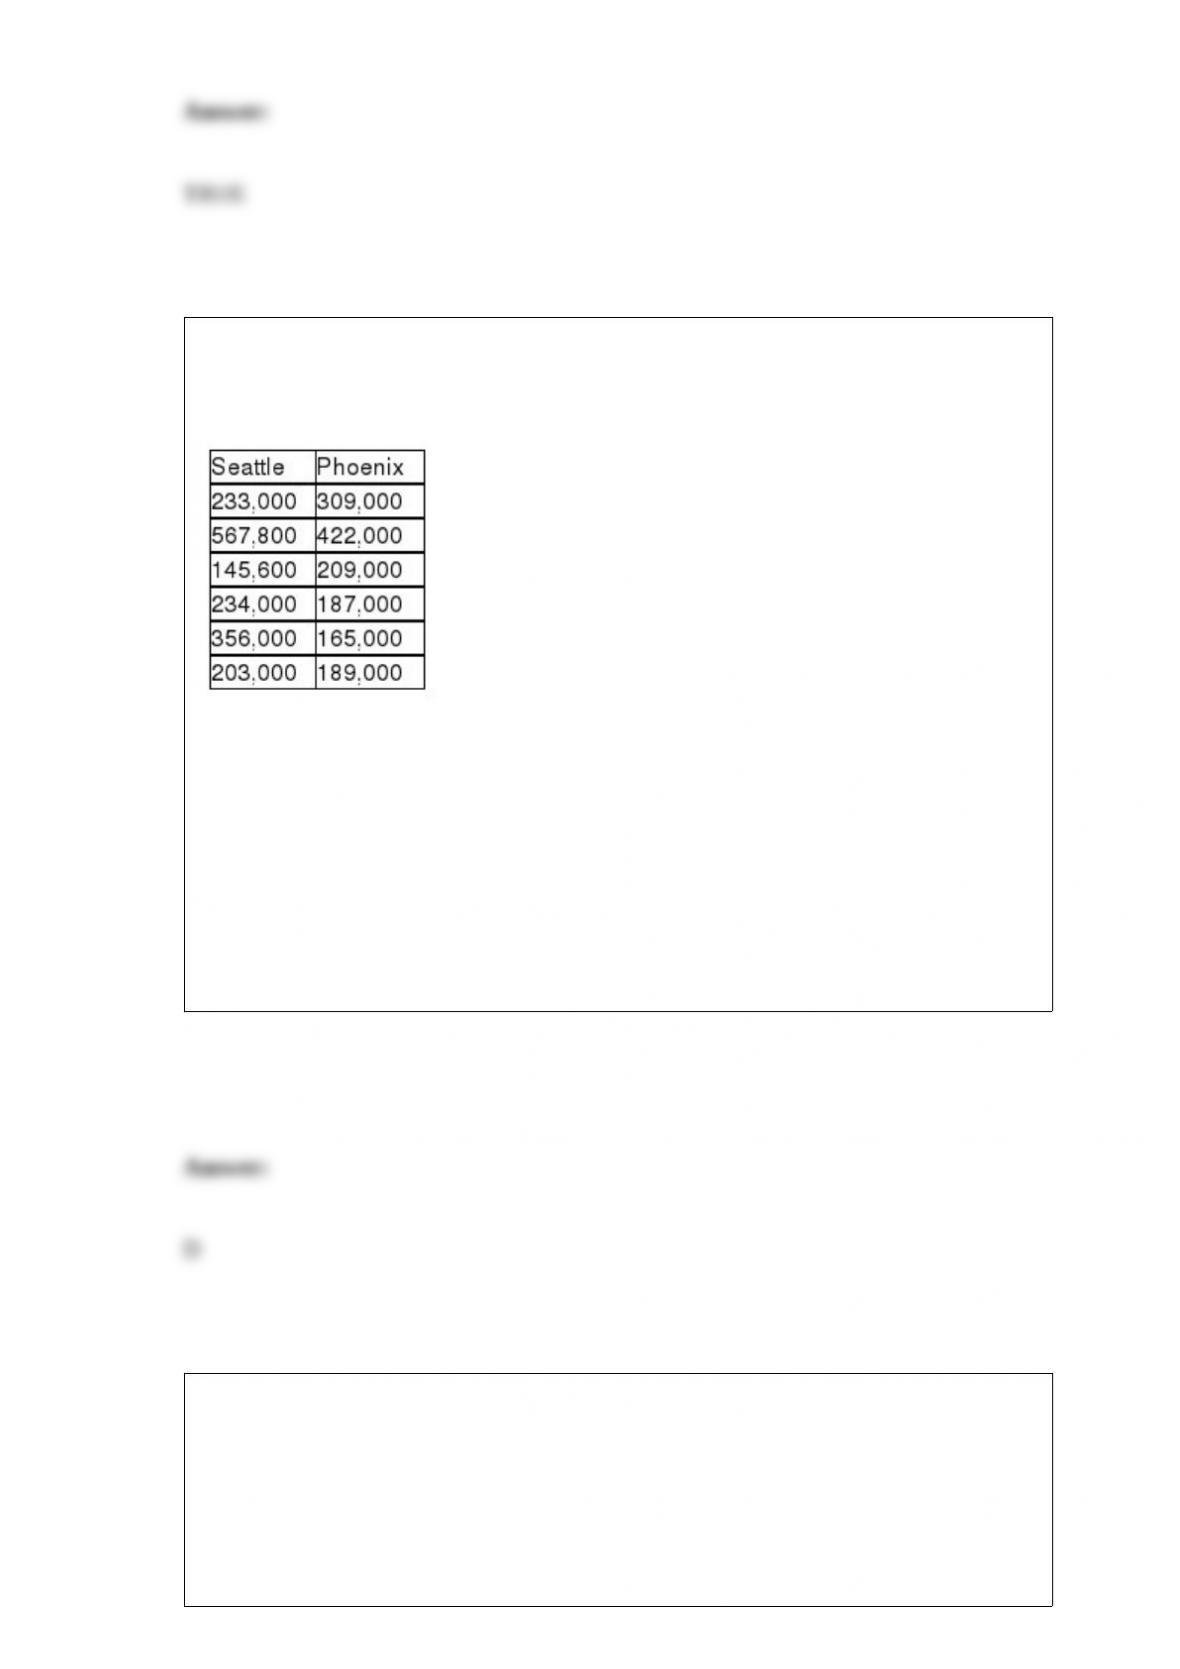
Consider the situation in which a study was recently conducted to determine whether
the median price of houses is the same in Seattle and Phoenix. The following data were
collected.
Given these data, if a Mann-Whitney U test is to be used, the U statistic for Seattle is:
A) 45
B) 35
C) 22
D) 14
The transportation manager for the State of New Jersey has determined that the time
between arrivals at a toll booth on the state’s turnpike is exponentially distributed with λ
= 4 cars per minute. Based on this, the average time between arrivals is:
A) 15 seconds.
B) 12 seconds.

C) 25 seconds.
D) 4 minutes.
A sample of 250 people resulted in a confidence interval estimate for the proportion of
people who believe that the federal government’s proposed tax increase is justified is
between 0.14 and 0.20. Based on this information, what was the confidence level used
in this estimation?
A) Approximately 1.59
B) 95 percent
C) Approximately 79 percent
D) Can’t be determined without knowing σ.
A pharmaceutical company claims that only 5 percent of patients experience nausea
when they take a particular drug. In a research study, n = 100 patients were given this
drug and 8 experienced nausea. Assuming that the company’s claim is true, what is the
probability of 8 or more patients experiencing nausea?
A) About 0.9162
B) About 0.0300
C) About 0.0838
D) About 0.4162
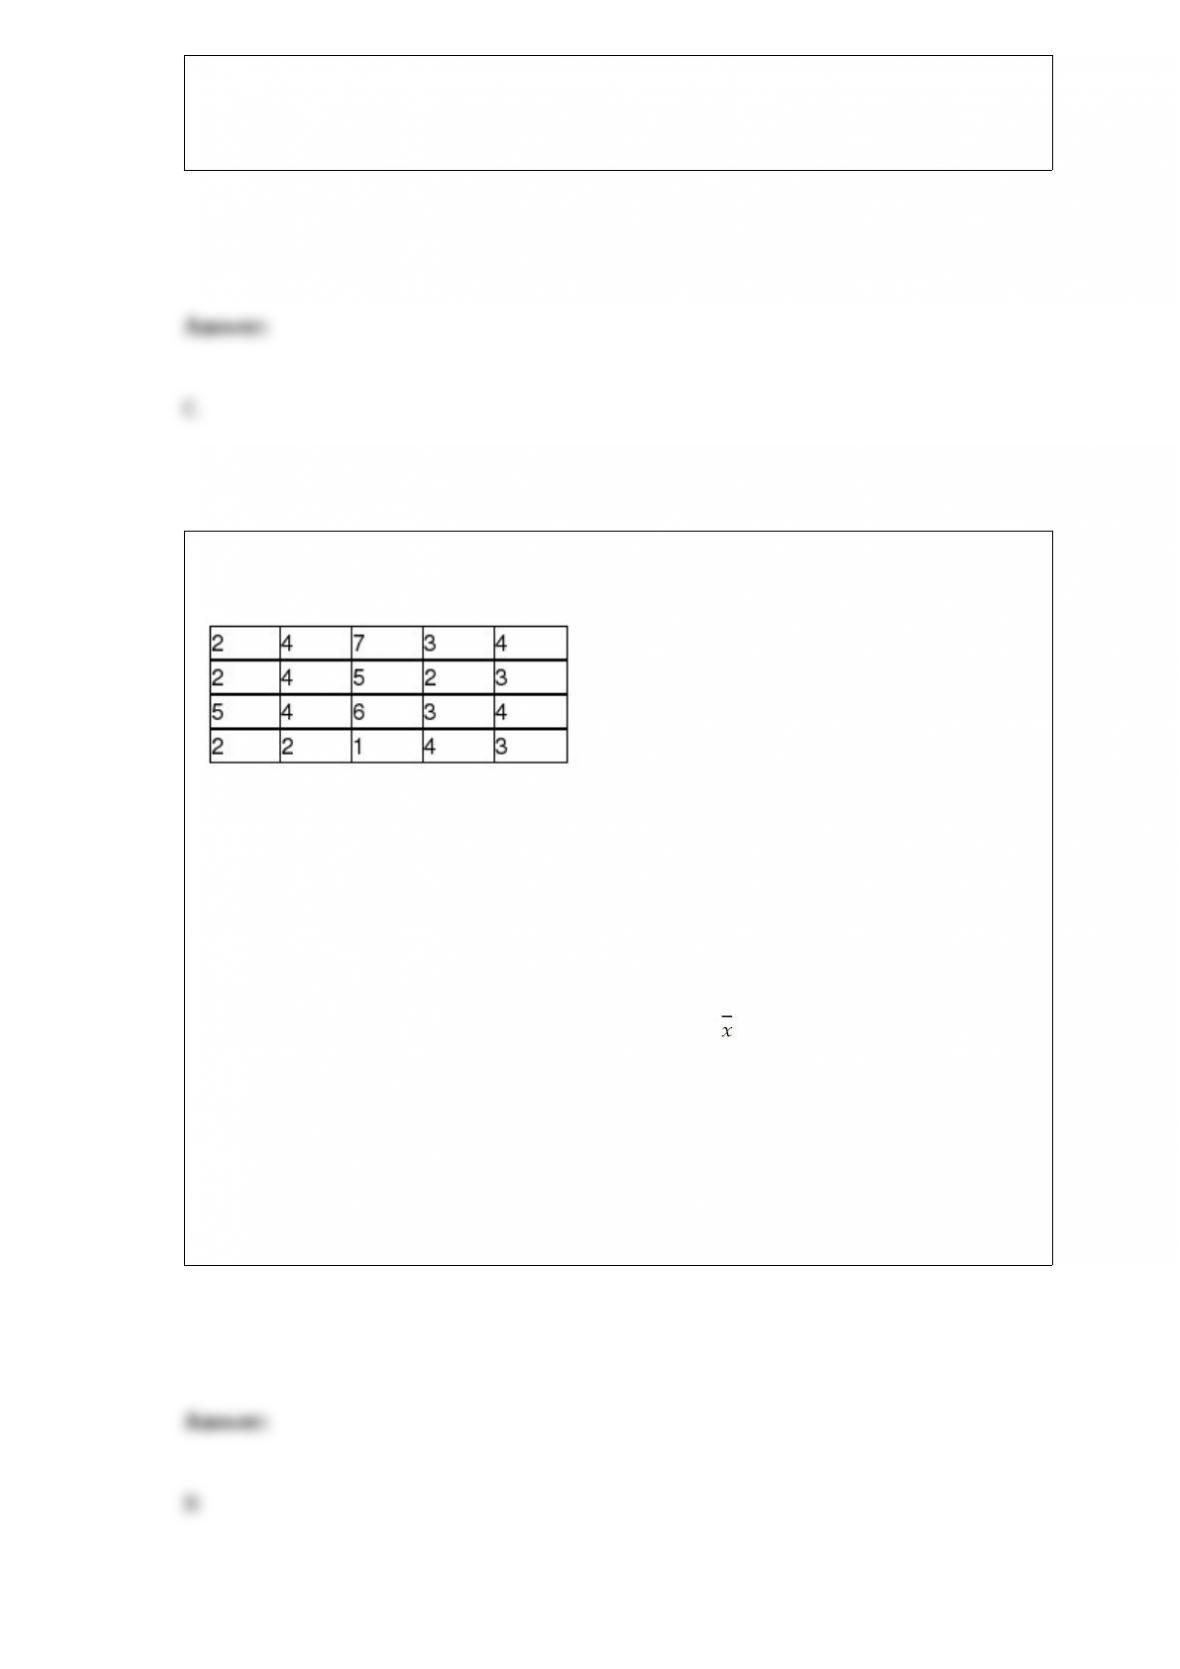
A particular subdivision has 20 homes. The number of people living in each of these
homes is listed as follows:
Which of the following statements is true when comparing a random sample of size
three homes selected from the population to a random sample of size 6 homes selected
from the population?
A) The amount of sampling error that will exist between the sample mean and the
population mean will be half for the larger sample.
B) The most extreme negative sampling error between and μ is reduced by about
0.167 person.
C) We can expect that the larger sample will produce more sampling error due to the
potential to make coding errors.
D) The sampling error that will result from the smaller sample will be less than what we
would see from the larger sample.
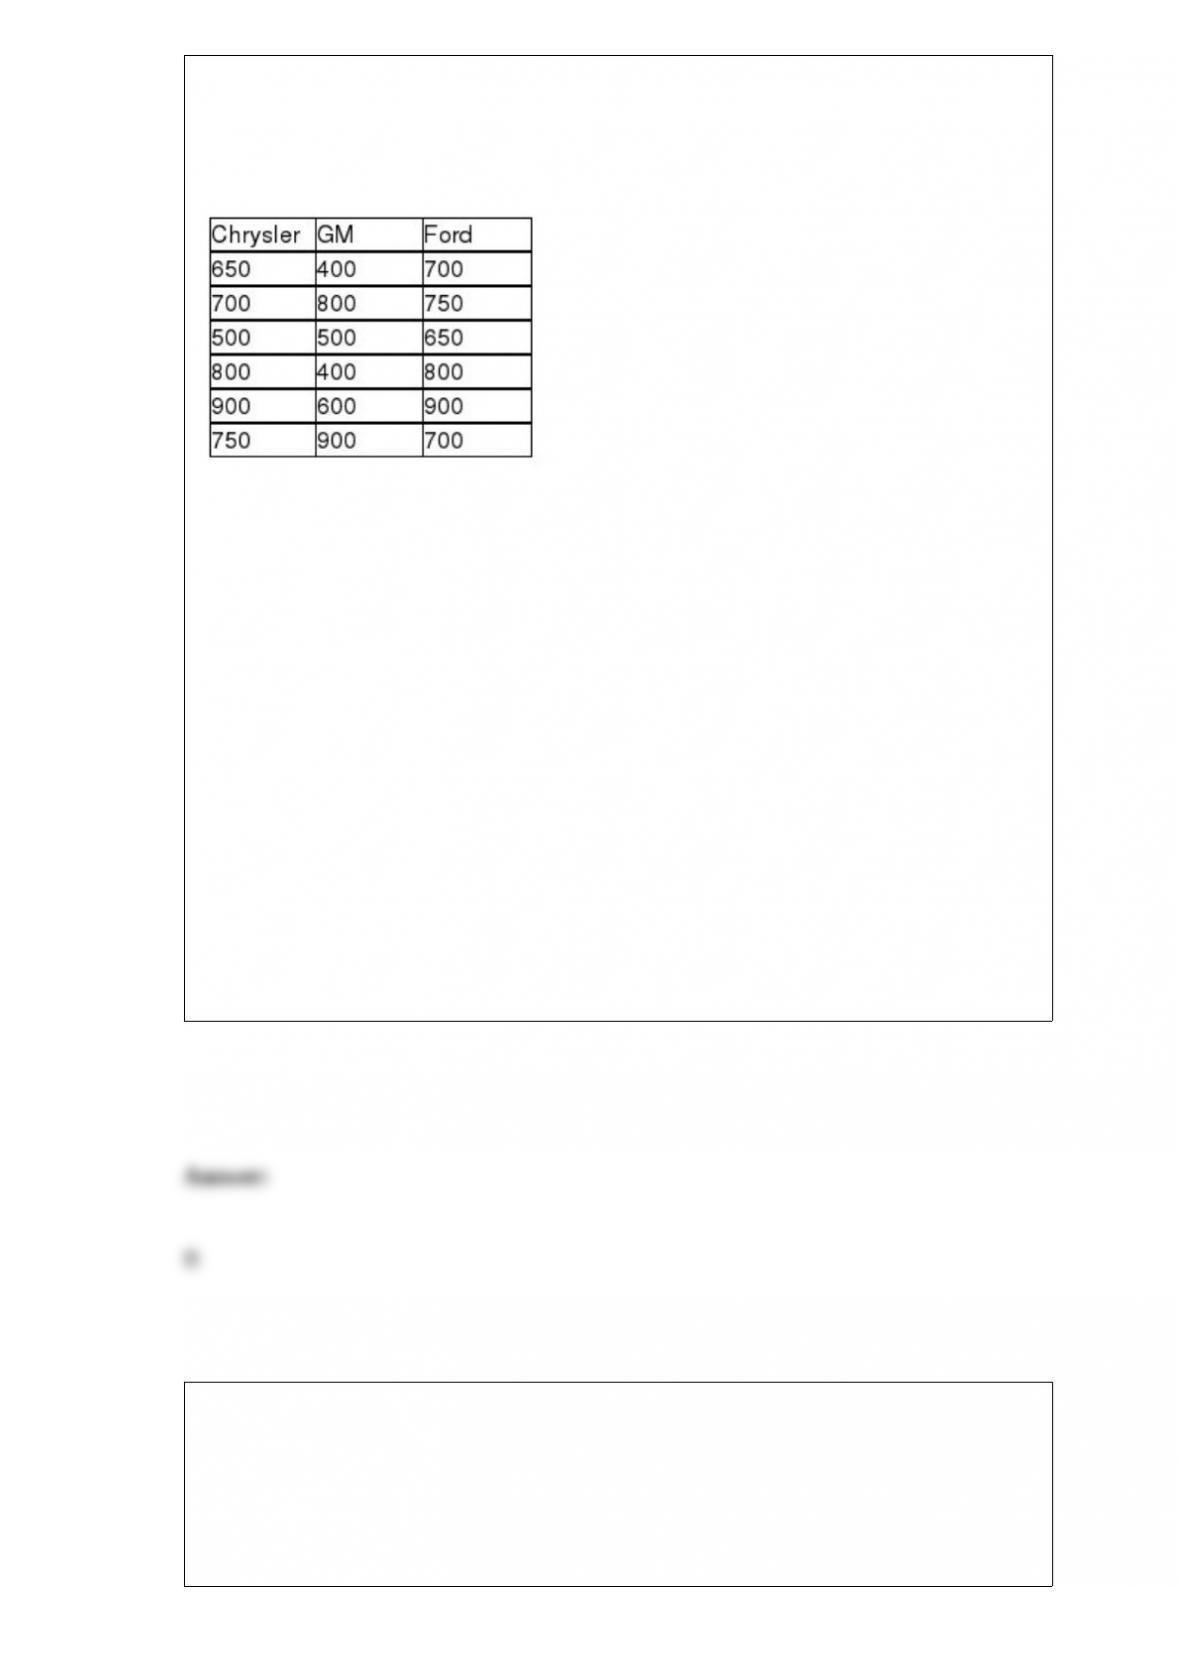
A survey was recently conducted in which random samples of car owners of Chrysler,
GM, and Ford cars were surveyed to determine their satisfaction. Each owner was
asked to rate overall satisfaction on a scale of 1 (poor) to 1000 (excellent). The
following data were recorded:
If the analysts are not willing to assume that the population ratings are normally
distributed and will use the Kruskal-Wallis test to determine if the three companies have
different median ratings, what is the correct conclusion if the test is to be conducted
using an alpha = .05 level?
A) H0 should be rejected and we conclude that there is no significant difference
between the 3 companies.
B) H0 should not be rejected and we conclude that there is no significant difference
between the 3 companies.
C) H0 should be rejected and we conclude that there is a significant difference between
the 3 companies.
D) H0 should not be rejected and we conclude that there is a significant difference
between the 3 companies.
A study published in the American Journal of Public Health was conducted to
determine whether the use of seat belts in motor vehicles depends on ethnic status in
San Diego County. A sample of 792 children treated for injuries sustained from motor
vehicle accidents was obtained, and each child was classified according to (1) ethnic
status (Hispanic or non-Hispanic) and (2) seat belt usage (worn or not worn) during the
accident. The number of children in each category is given in the table below.
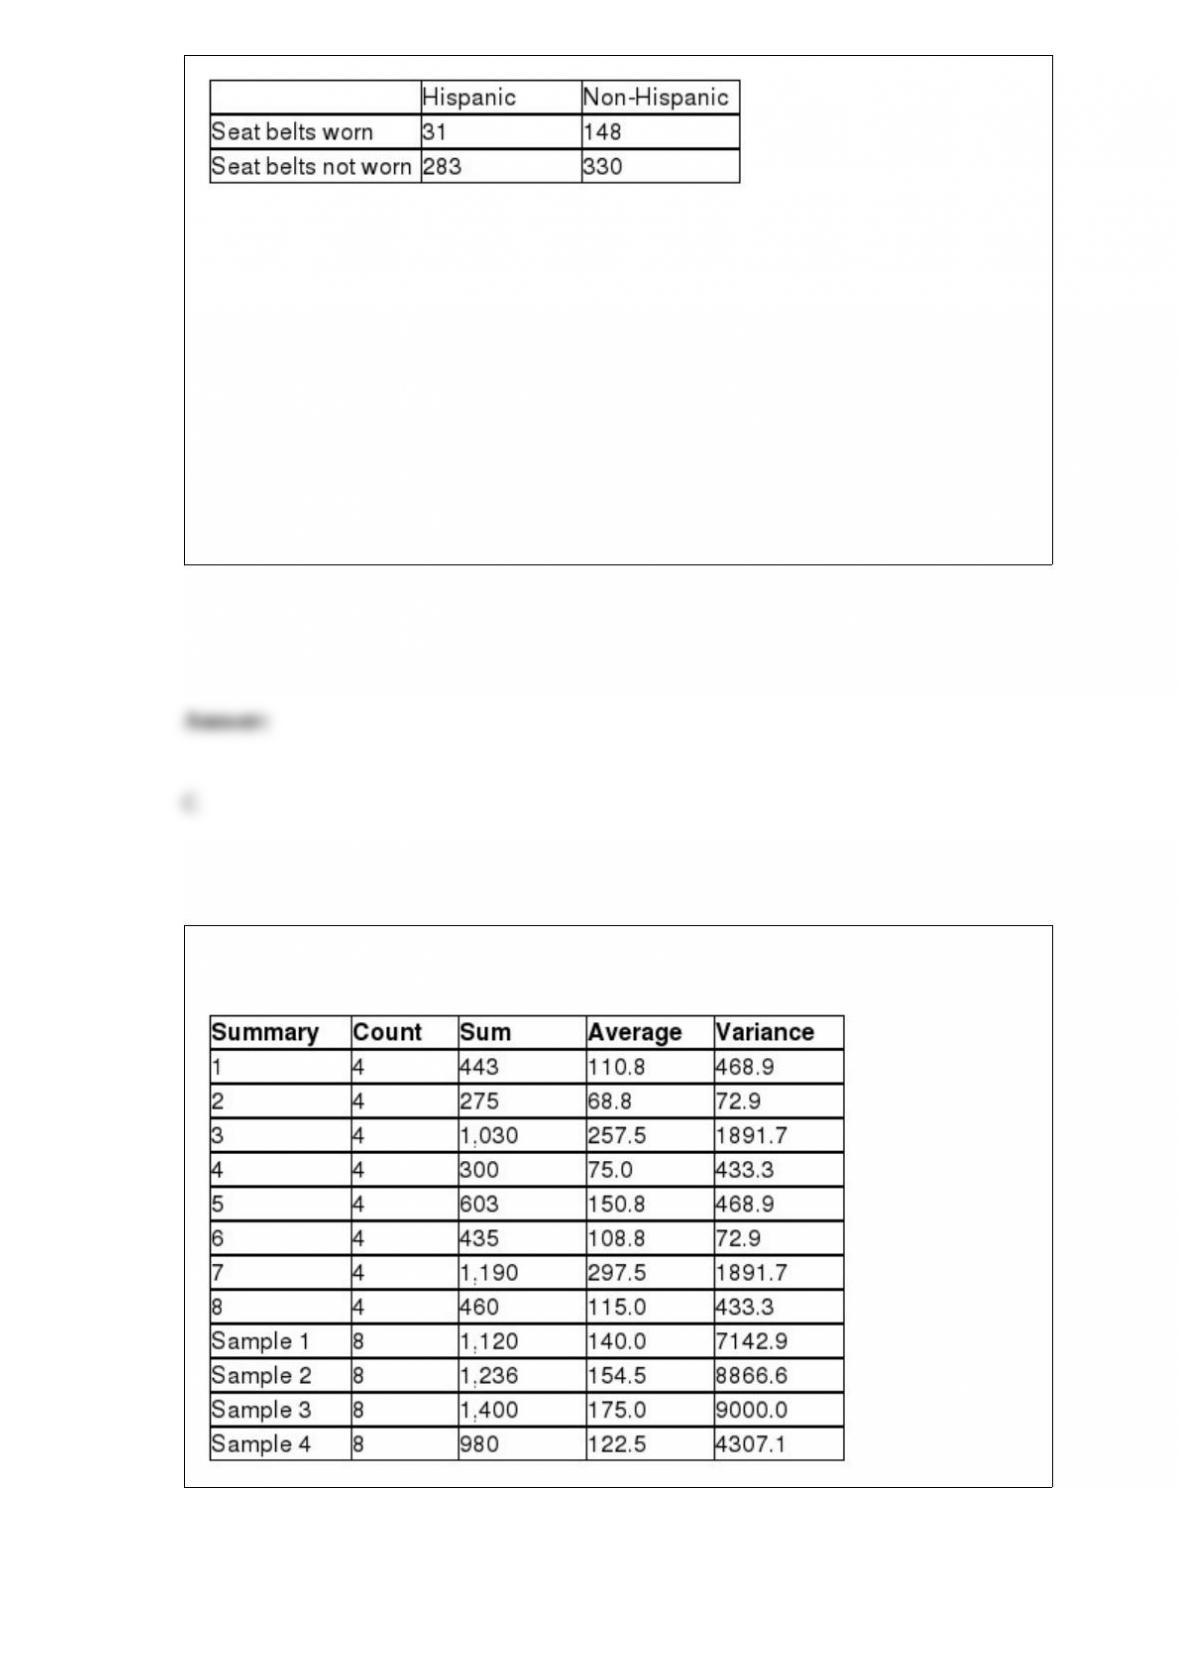
Referring to these data, which of the following conclusions should be reached if the
appropriate hypothesis is conducted using an alpha = .05 level?
A) The mean value for Hispanics is the same as for Non-Hispanics.
B) There is no relationship between whether someone is Hispanic and whether they
wear a seat belt.
C) The use of seat belts and whether a person is Hispanic or not is statistically related.
D) None of the above
Consider the following:
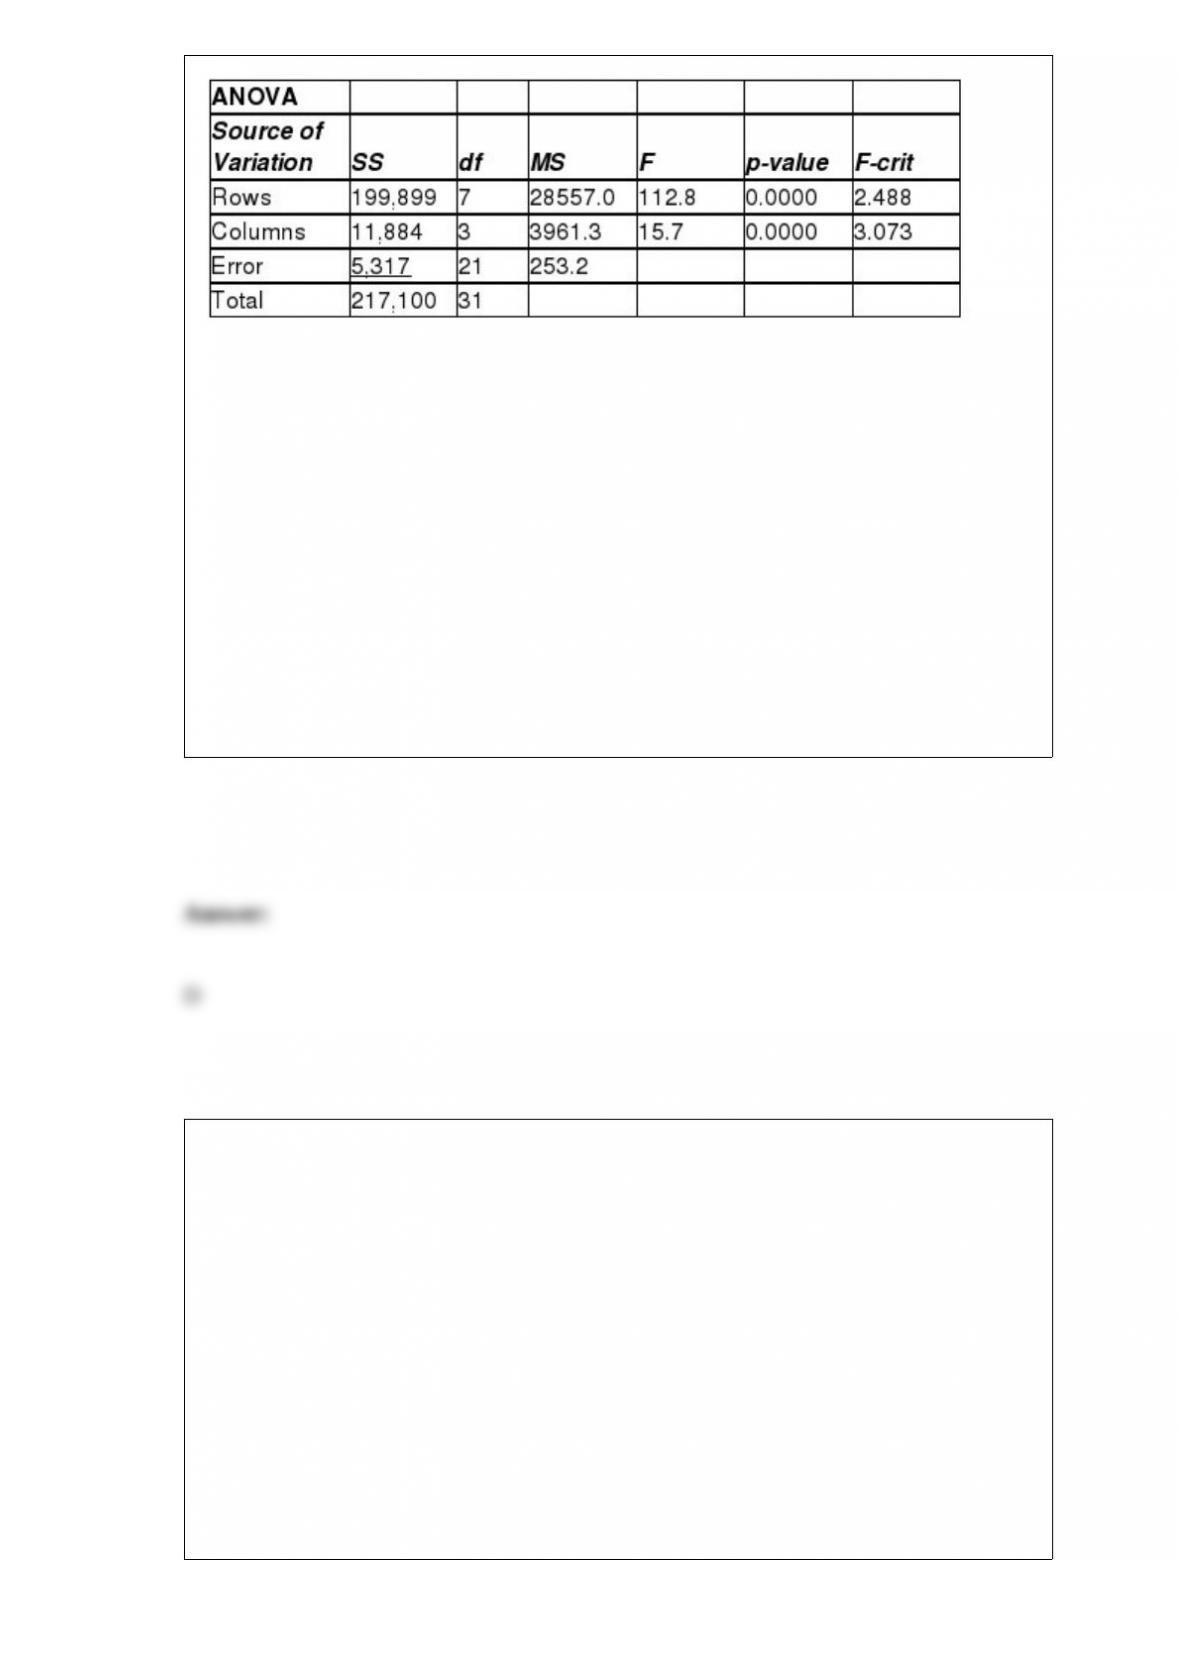
Test to determine whether blocking is effective using an alpha level equal to 0.05
A) Because F = 14.81 > critical F = 2.5, we do not reject the null hypothesis and
conclude that blocking is not effective.
B) Because F = 14.81 > critical F = 2.5, we reject the null hypothesis and conclude that
blocking is effective.
C) Because F = 112.79 > critical F = 2.5, we do not reject the null hypothesis and
conclude that blocking is not effective.
D) Because F = 112.79 > critical F = 2.5, we reject the null hypothesis and conclude
that blocking is effective.
A car company is interested in testing to see whether the mean miles that a car engine
will last without changing oil is the same or different depending on which brand of oil
is used. The engineers also wish to control for the type of transmission (manual or
automatic) that is used. To conduct this test, the car company obtains enough engines so
that all four oil brands can be tested in a design that involves no replication. Based on
this information, how many engines will be needed to conduct the test?
A) 4
B) 8
C) One for each oil type
D) One for each factor in the study

A recent study showed that the length of time that juries deliberate on a verdict for civil
trials is normally distributed with a mean equal to 12.56 hours with a standard deviation
of 6.7 hours. Given this information, what is the probability that a deliberation will last
between 10 and 15 hours?
A) Approximately 0.29
B) Nearly 0.75
C) About 0.48
D) About 0.68
Based on a survey of 400 students in a university in which 20 percent indicated that
they were business majors. The university student newspaper reported that “20 percent
of all the students at the university are business majors.” This report is an example of:
A) a sample.
B) a population.
C) statistical inference.
D) descriptive statistics.
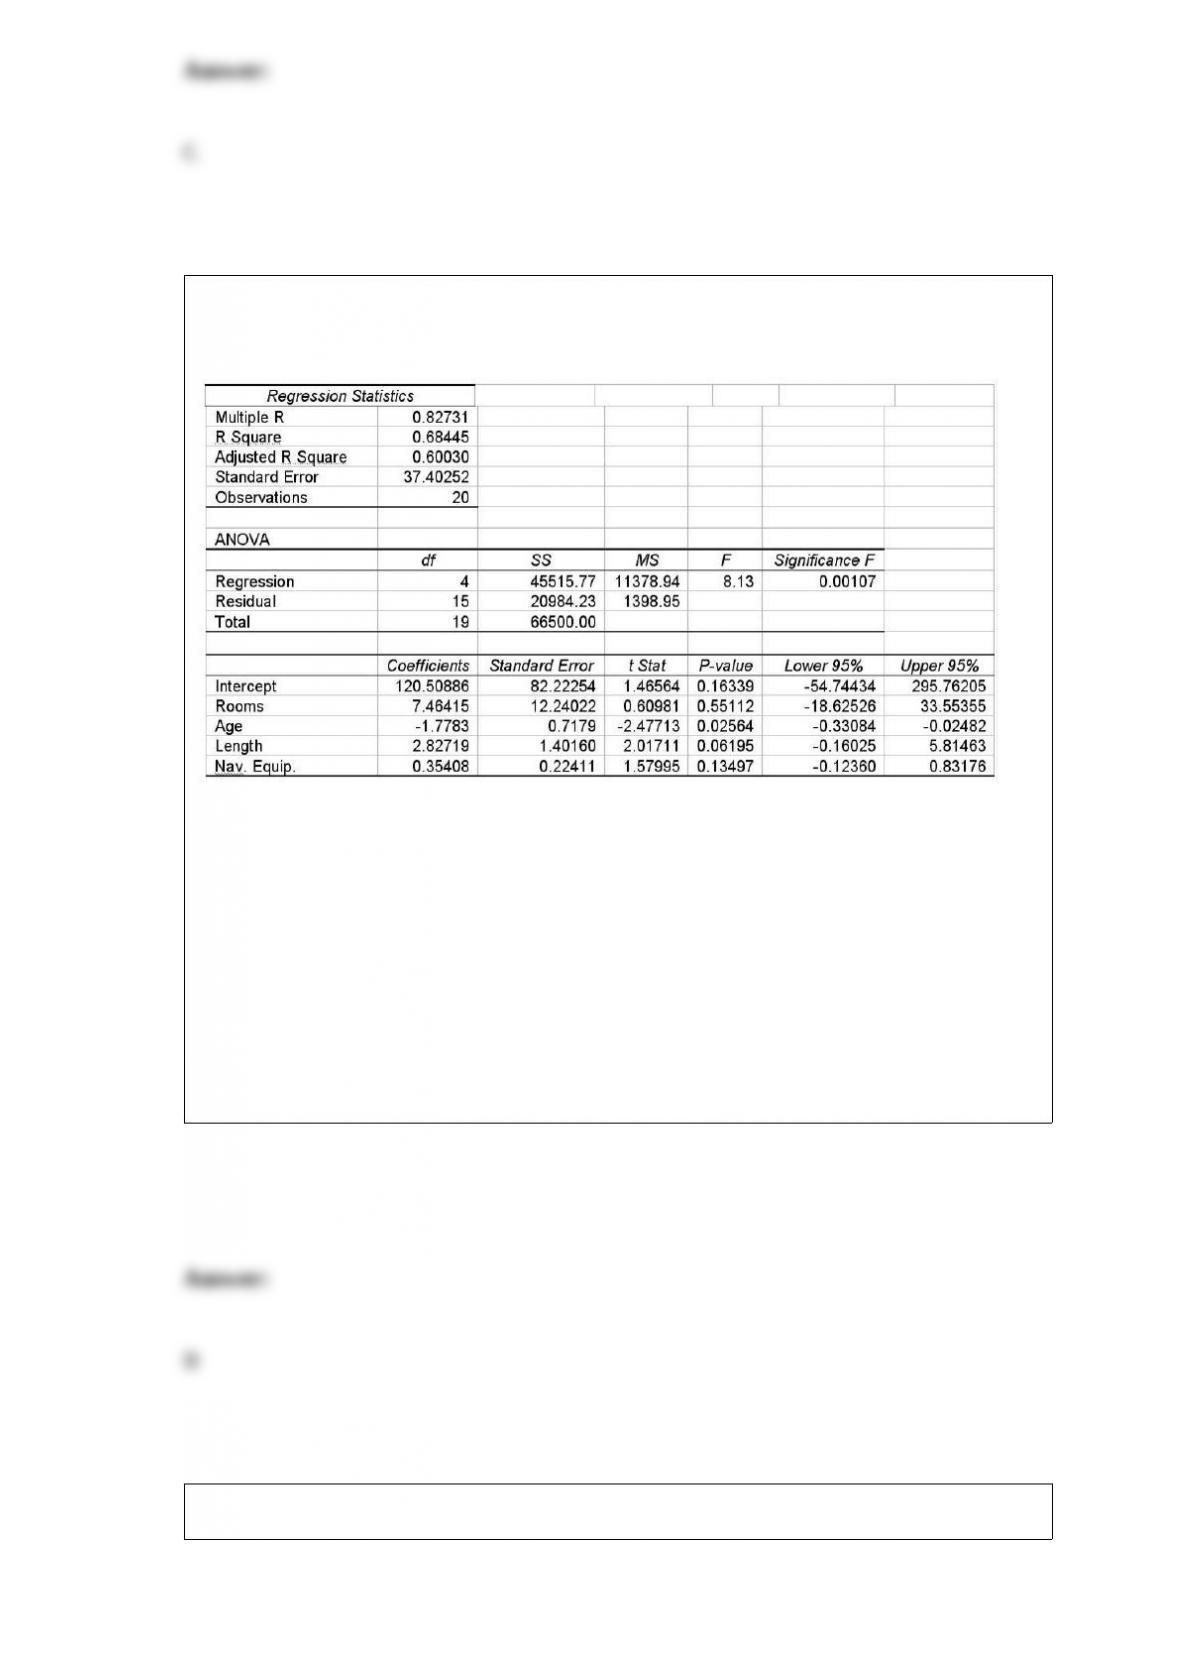
A multiple regression is shown for a data set of yachts where the dependent variable is
the price in thousands of dollars.
Based on this output, which of the independent variables appear to be significantly
helping to predict the price of a yacht, using a 0.10 level of significance?
A) Age
B) Age and length
C) Rooms and Nav. Equip.
D) Length and Nav. Equip.
You are given the following null and alternative hypotheses:

If the true population mean is 1.25, determine the value of beta. Assume the population
standard deviation is known to be 0.50 and the sample size is 60.
A) 0.40
B) 0.04
C) 0.51
D) 0.80
Three events occur with probabilities P(E1) = 0.35, P(E2) = 0.15, P(E3) = 0.40. If the
event B occurs, the probability becomes P(E1|B) = 0.25, P(B) = 0.30. Compute P(E1 or
B).
A) 0.575
B) 0.075
C) 0.021
D) 0.475

Under what circumstances does the variance inflation factor signal that
multicollinearity may be a problem?
A) When the value of VIF exceeds the size of the sample from which the regression
model was developed
B) When the VIF value is approximately 1.0
C) When the VIF is greater than or equal to 5
D) When the VIF is a negative value
Hubble Construction Company has submitted a bid on a state government project that is
to be funded by the federal government’s stimulus money in Arizona. The price of the
bid was predetermined in the bid specifications. The contract is to be awarded on the
basis of a blind drawing from those who have bid. Five other companies have also
submitted bids.
Suppose that there are two contracts to be awarded by a blind draw. What is the
probability of Hubble winning both contracts? Assume sampling with replacement.
A) 0.2778
B) 0.1667
C) 0.6944
D) 0.0278
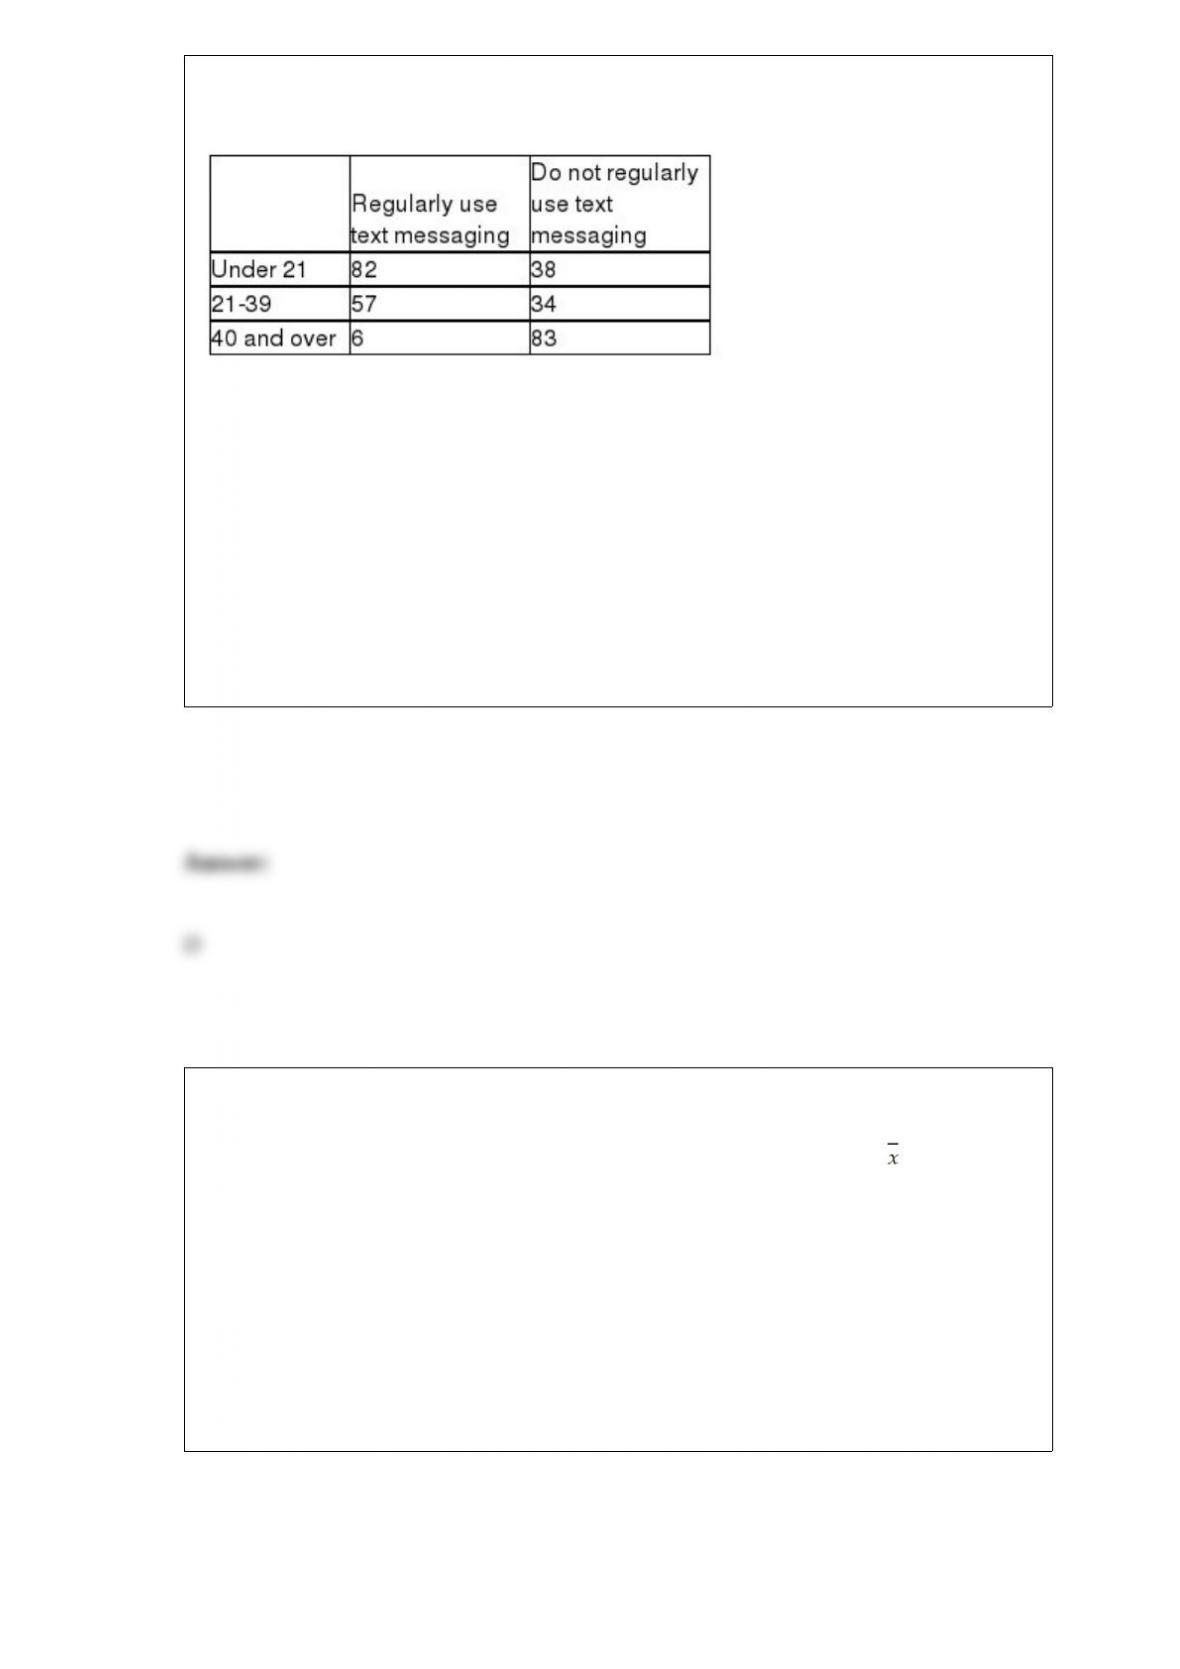
A cell phone company wants to determine if the use of text messaging is independent of
age. The following data has been collected from a random sample of customers.
Based on the data above what is the expected value for the “under 21 and regularly use
text messaging” cell?
A) 82
B) 50
C) 120
D) 58
The Olsen Agricultural Company has determined that the weight of hay bales is
normally distributed with a mean equal to 80 pounds and a standard deviation equal to 8
pounds. Based on this, what is the mean of the sampling distribution for if the sample
size is n = 64?
A) 80
B) 10
C) Between 72 and 88
D) 8

A study was recently done in which the brand preference for breakfast cereal was
analyzed against the gender of the shopper. The study consisted of 200 male shoppers
and 300 female shoppers. Three different cereal brands were considered: A, B, and C. A
total of 250 female shoppers preferred brand A, 25 female shoppers preferred brand C.
A total of 100 shoppers preferred brand B. The number of male shoppers that preferred
brand B was:
A) 25.
B) 100.
C) 75.
D) 50.
Assuming that potholes occur randomly along roads, the number of potholes per mile of
road could best be described by the:
A) binomial distribution.
B) Poisson distribution.
C) hypergeometric distribution.
D) continuous distribution

The number of days that homes stay on the market before they sell in Houston is
bell-shaped with a mean equal to 56 days. Further, 95 percent of all homes are on the
market between 40 and 72 days. Based on this information, what is the standard
deviation for the number of days that houses stay on the market in Houston?
A) 8
B)
C) 16
D) 4
The chamber of commerce in a beach resort town wants to estimate the proportion of
visitors who are repeat visitors. From previous experience they believe the portion is in
the vicinity of 0.5 and they want to estimate the proportion to within 0.03 percentage
points with 95 percent confidence. The sample size they should use is:
A) n = 1068
B) n = 545
C) n = 33
D) n = 95

A hypothesis test is to be conducted using an alpha = .05 level. This means:
A) there is a 5 percent chance that the null hypothesis is true.
B) there is a 5 percent chance that the alternative hypothesis is true.
C) there is a maximum 5 percent chance that a true null hypothesis will be rejected.
D) there is a 5 percent chance that a Type II error has been committed.
Applebee’s International, Inc., is a U.S. company that develops, franchises, and operates
the Applebee’s Neighborhood Grill and Bar restaurant chain. It is the largest chain of
casual dining restaurants in the country, with over 1,500 restaurants across the United
States. The headquarters is located in Overland Park, Kansas. The company is
interested in determining if mean weekly revenue differs among three restaurants in a
particular city. The file entitled Applebees contains revenue data for a sample of weeks
for each of the three locations.
Based on the data gathered by Applebee’s, can it be concluded that there is a difference
in the average revenue among the three restaurants?
A) The p-value = 0.004 < alpha = 0.05. This indicates that we should not reject the null
hypothesis and conclude that there is not a difference in the average revenue among the
three restaurants.
B) The p-value = 0.004 < alpha = 0.05. This indicates that we should reject the null
hypothesis and conclude that there exists a difference in the average revenue among the
three restaurants.
C) The p-value = 0.084 > alpha = 0.05. This indicates that we should not reject the null
hypothesis and conclude that there is not a difference in the average revenue among the
three restaurants.
D) The p-value = 0.084 > alpha = 0.05. This indicates that we should reject the null
hypothesis and conclude that there exists a difference in the average revenue among the
three restaurants.
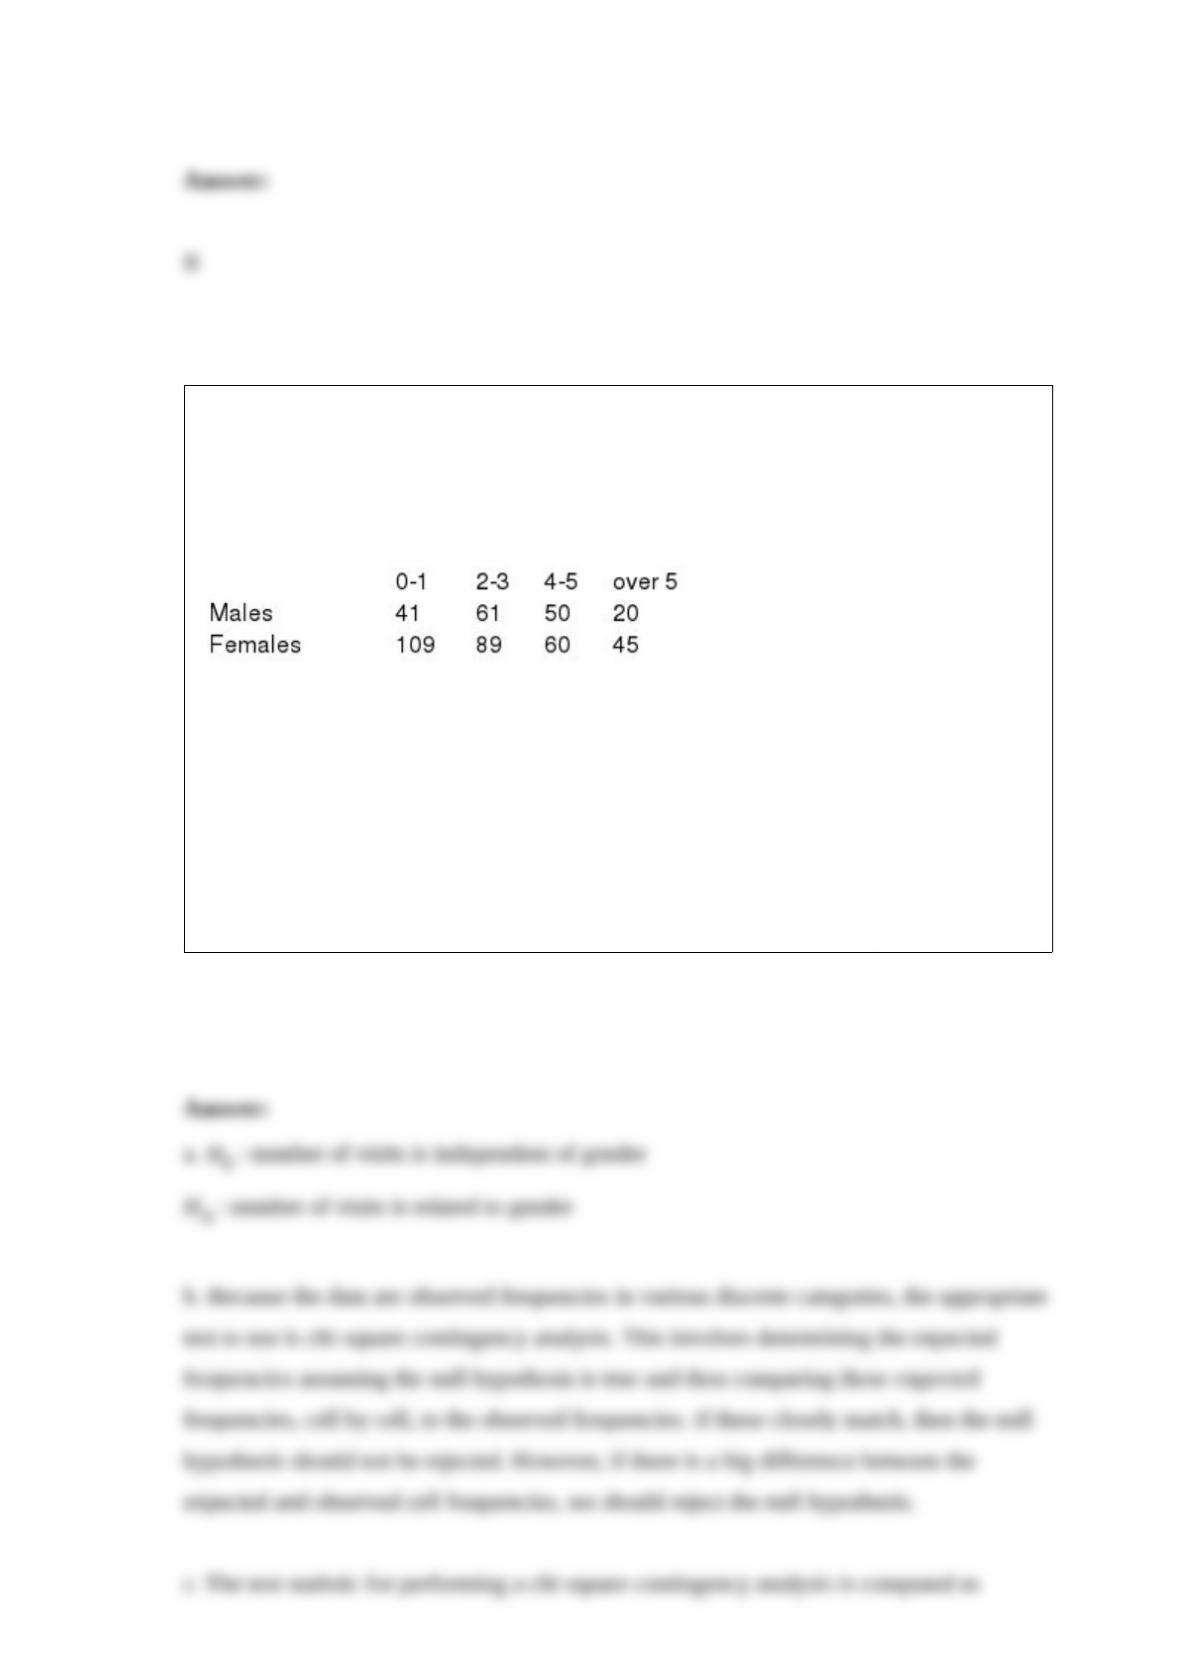
Recently a survey was conducted involving customers of a fitness center in Dallas,
Texas. Participants were asked to indicate how often they use the club by checking one
of the following categories: 0-1 time per week; 2-3 times per week; 4-5 times per week;
more than 5 times. The following data show how males and females responded to this
question.
One of the purposes of the survey was to determine whether there is a relationship
between the gender of the customer and the number of visits made each week.
a. State the appropriate null and alternative hypothesis.
b. What test procedure is appropriate to use to conduct this test?
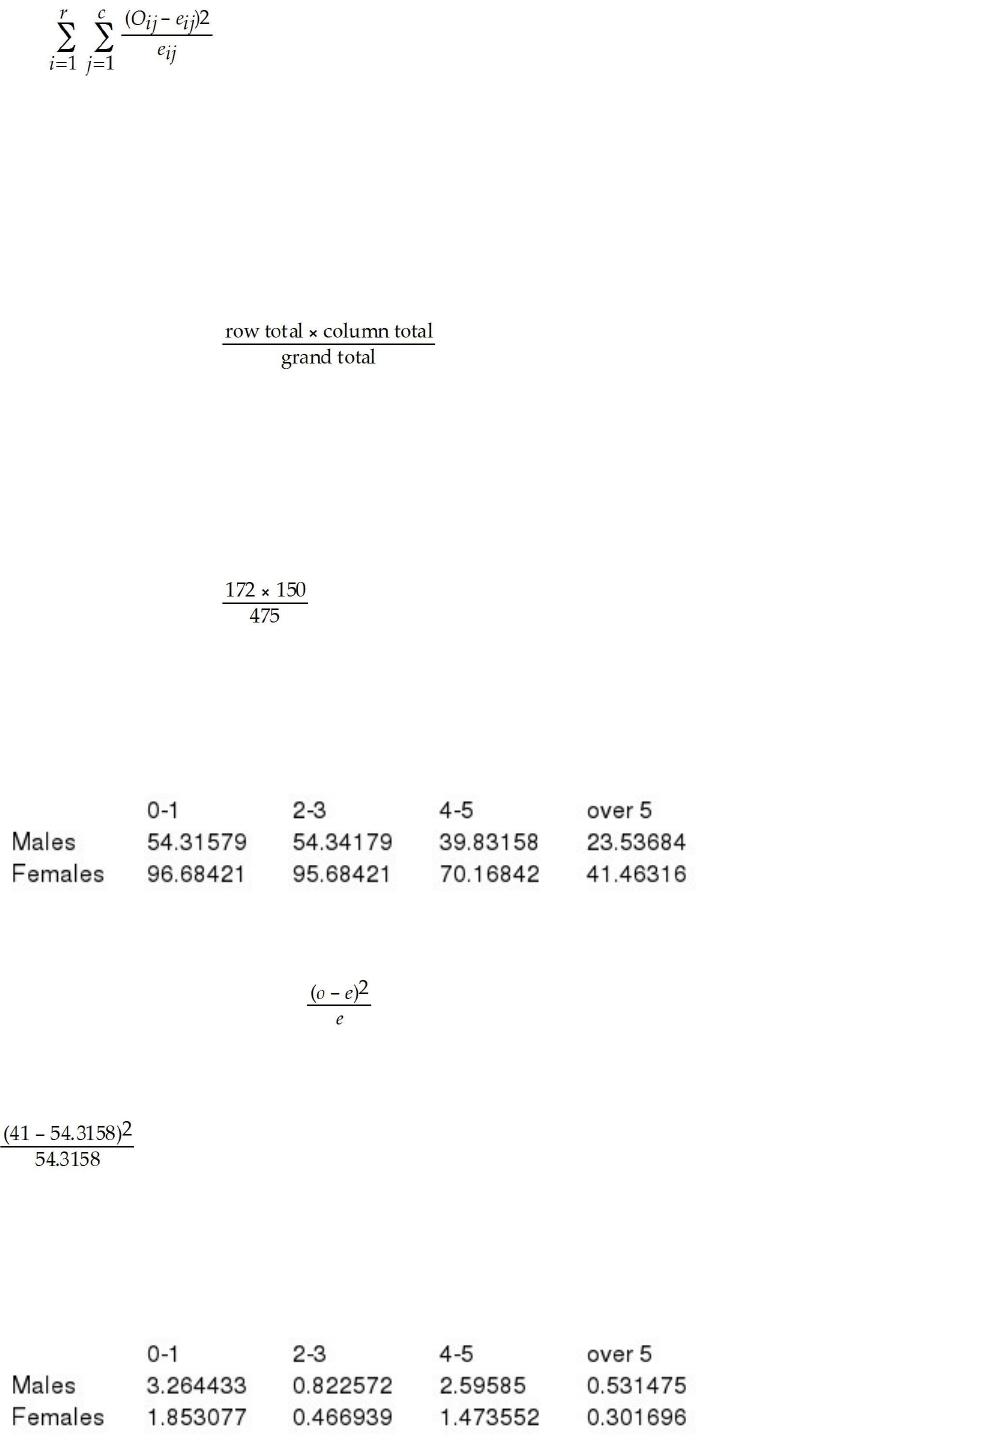
c. Conduct the hypothesis test using an alpha = .05 level.
A p-chart is useful for:
A) analyzing whether a process for a measurable variable is in or out of control.
B) analyzing processes which yield attribute data.
C) determining what the most likely cause of defects is.
D) All of the above
The human resources department at a major high tech company recently conducted an
employee satisfaction survey of 100 of its 3,000 employees. Data were collected on
such variables as age, gender, marital status, current salary, level of overall satisfaction

on a scale from 1 to 5, number of years with the company, and job title. Which of the
following best describes the overall data set that was generated from the study?
A) Cross-sectional data
B) Time-series data
C) Nominal data
D) Quantitative data
Under what circumstances should the standard normal distribution be used when
employing the Mann-Whitney U test?
A) When the sample sizes are equal from the two populations
B) When the sample sizes are greater than 20
C) When the populations are normally distributed
D) You would never use the standard normal distribution.
The State Department of Weights and Measures is responsible for making sure that
commercial weighing and measuring devices, such as scales, are accurate so customers
and businesses are not cheated. Periodically, employees of the department go to
businesses and test their scales. For example, a dairy bottles milk in 1-gallon containers.
Suppose that if the filling process is working correctly, the mean volume of all gallon

containers is 1.00 gallon with a standard deviation equal to 0.10 gallon. The
department’s test process requires that they select a random sample of n = 9 containers.
If the sample mean is less than 0.97 gallons, the department will fine the dairy. Based
on this information, what is the probability that the dairy will get fined even when its
filling process is working correctly?
A) 0.90
B) Approximately 0.3159
C) About 0.1841
D) Approximately 0.3821
The mean number of errors per page made by a member of the word processing pool
for a large company is thought to be 1.5 with the number of errors distributed according
to a Poisson distribution. If three pages are examined, what is the probability that more
than 3 errors will be observed?
A) 0.6577
B) 0.6969
C) 0.7324
D) 0.7860

The file Danish Coffee contains a random sample of 144 Danish coffee drinkers and
measures the annual coffee consumption in kilograms for each sampled coffee drinker.
A marketing research firm wants to use this information to develop an advertising
campaign to increase Danish coffee consumption.
Develop and interpret a 90% confidence interval estimate for the mean annual coffee
consumption of Danish coffee drinkers.
A) (6.4257, 6.6479)
B) (6.1768, 6.8968)
C) (6.3881, 6.6855)
D) (6.3366, 6.7370)
In an application to estimate the mean number of miles that downtown employees
commute to work roundtrip each day, the following information is given:
n = 20
= 4.33
s = 3.50
If the desired confidence level is 95 percent, the appropriate critical value is:
A) z = 1.96
B) t = 2.093
C) t = 2.086
D) .7826

It is assumed that the time failures for an electronic component are exponentially
distributed with a mean of 50 hours between consecutive failures. What is the
probability that a component will be functioning after 60 hours?
A) Approximately 0.30
B) About 0.70
C) About 0.21
D) About 0.49