
In most processes, the process control limits are set to correspond with the specification
limits on the product.
Six food critics each visited and rated four different restaurants. Each critic visited each
restaurant on three separate occasions and recorded a score for each visit. Assume that
results show that there is an interaction. This would mean that, for example, which
restaurant is rated the highest depends on which critic does the rating.
In simple linear regression, the t-test for the slope and the F-test are both conducting the
same hypothesis test.
The Hawkins Company randomly samples 10 items from every large batch before the
batch is packaged and shipped. According to the contract specifications, 5 percent of the
items shipped can be defective. If the inspectors find 1 or fewer defects in the sample of
10, they ship the batch without further inspection. If they find 2 or more, the entire

batch is inspected. Based on this sampling plan, the probability that a batch that meets
the contract requirements will end up being 100 percent inspected is approximately .
0746.
The primary difference between the binomial distribution and the Poisson distribution is
that the Poisson is used to describe a continuous random variable and the binomial is
used for discrete random variables.
The Nationwide Motel Company has determined that 70 percent of all calls for motel
reservations request nonsmoking rooms. Recently, the customer service manager for the
company randomly selected 25 calls. Assuming that the distribution of calls requesting
nonsmoking rooms is described by a binomial distribution, the probability that more
than 20 customers in the sample will request nonsmoking rooms is approximately 0.09.
One of the differences between a stem and leaf diagram and a histogram is that even for

variables involving a large number of different values, the stem and leaf diagram shows
the individual data values whereas the histogram requires you to group the data and lose
the individual values.
A car salesman states that the probability that the dealership sells a car on a Saturday
morning is .30. The method of probability assessment that he has used is most likely
classical assessment.
A perfect correlation between two variables will always produce a correlation
coefficient of +1.0
It is very unlikely that a nonstatistical sample will ever provide less sampling error than
a statistical sample of the same size.

If the correlation between the dependent variable and the independent variable is
negative, the standard error of the regression slope coefficient in a simple linear
regression model will also be negative.
The bottlers of a new fruit juice daily select a random sample of 12 bottles of the drink
to estimate the mean quantity of juice in the bottles filled that day. On one such day, the
following results were observed: = 12.03; s = 0.12. Based on this information, the
margin of error associated with a 90 percent confidence interval estimate for the
population mean is 1.7959 ounces.
In a two-factor ANOVA with replication in which all hypotheses are to be tested using
an alpha = .05 level, if the p-value for interaction is .03467, the decision maker should
conclude that no interaction is present.

The Crystal Window Company makes windows at three locations: Reno, Las Vegas,
and Boise. Some windows made by the company contain a visible defect and must be
replaced. Each defect costs the company $45.00. The Reno plant makes 40 percent of
all windows while the Las Vegas and Boise plants split the remaining production
evenly. A recent quality study shows that 8 percent of the Reno windows contain a
defect, 11 percent of the Las Vegas windows contain a defect, while 4 percent of the
windows made in Boise have a defect. Once the windows are made, they are shipped to
a central warehouse where they are commingled and the location where they were made
is lost.
Based on this information, if a defective window is discovered, it was most likely made
by the Las Vegas plant.
One of the most important aspects of quality improvement is the idea of reducing the
variability in a product or service. For instance, a major bank has worked to reduce the
variability in the service time at the drive-through. The managers believe that the
standard deviation in service time should not exceed 30 seconds. To test whether this
goal is being achieved, a random sample of n = 25 cars is selected each week and the
service time for each car is measured. Last week, the mean time was 345 seconds with a
standard deviation equal to 38 seconds. Given this information, if the significance level
is 0.10, the critical value from the chi-square table is about 34.3.

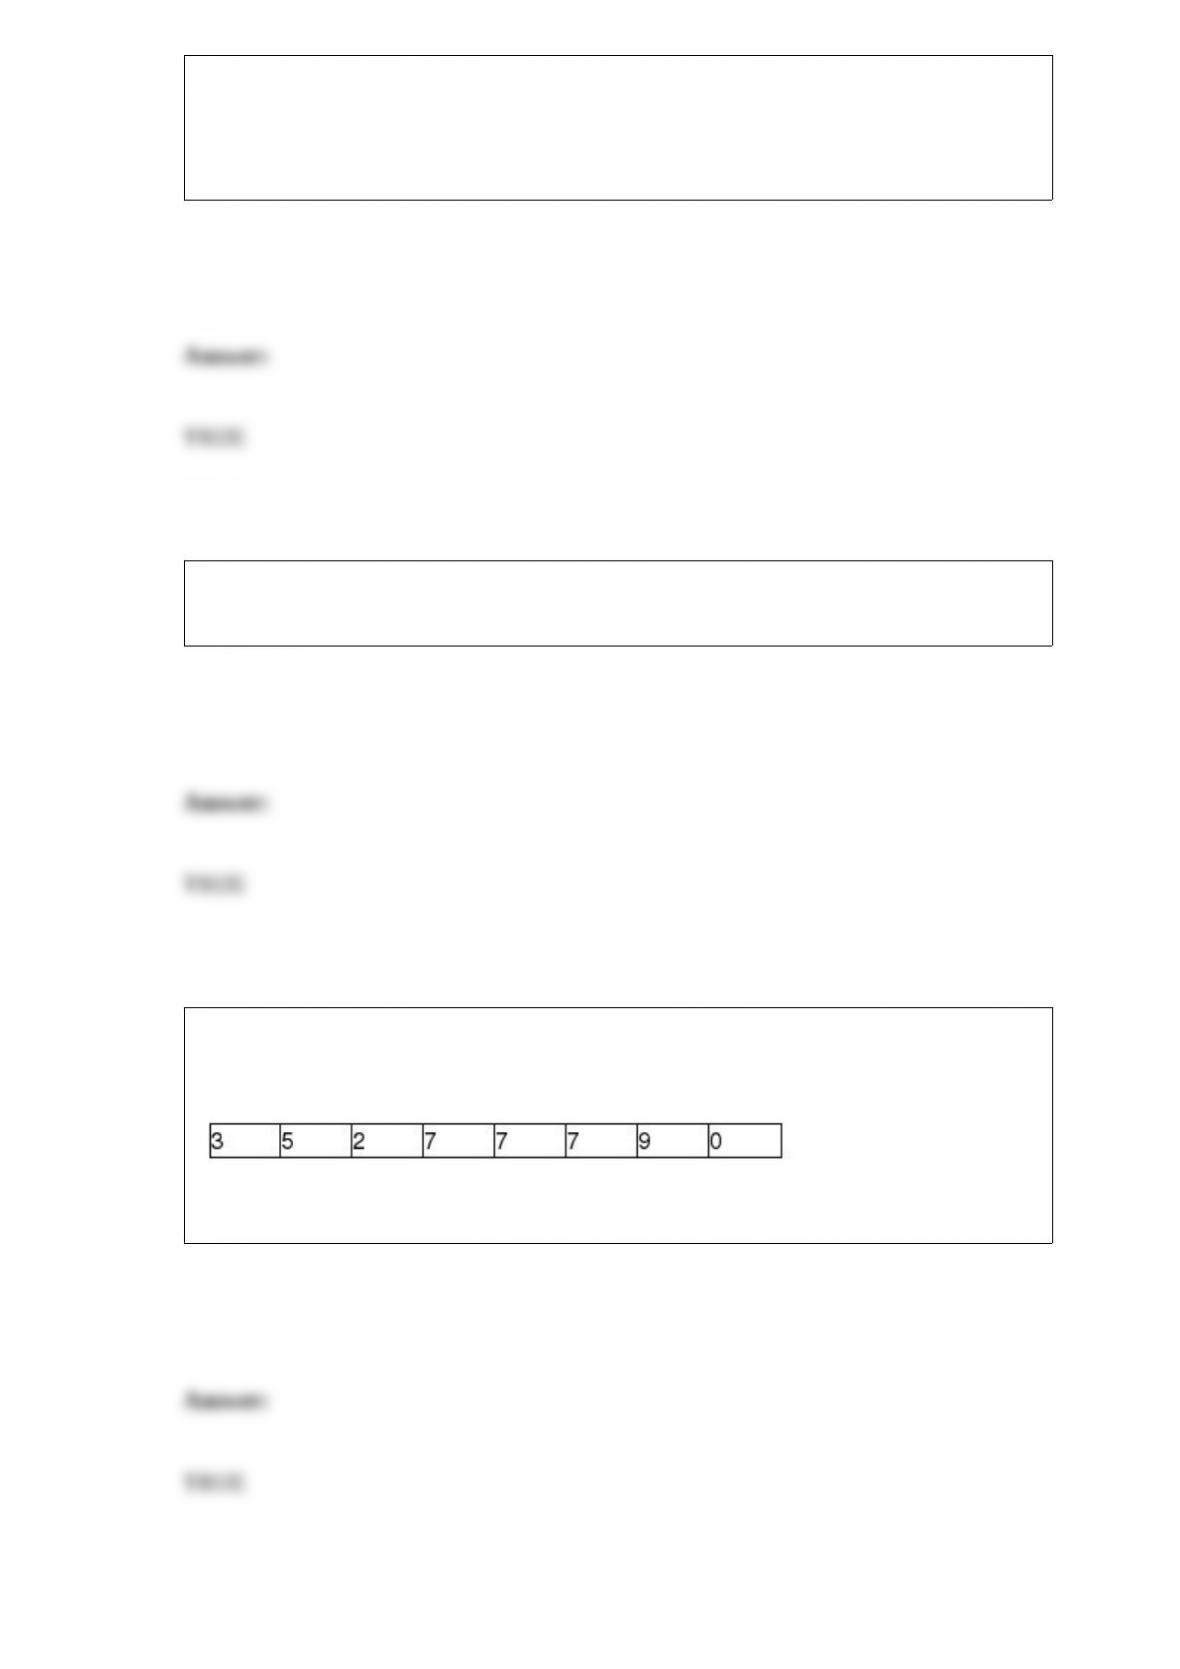
The owners of Hal’s Cookie Company have collected sales data for the past 8 months.
These data are shown as follows:
Using a starting forecast in period 1 of 100, the forecast bias over periods 2-8 is
negative when a single exponential smoothing model is used with a smoothing constant
of 0.20
The credit card balances for customers at State Bank and Trust has a mean equal to
$800 and a standard deviation equal to $60.00. Kevin Smith’s balance is $1,352. Based
on this, his standardized value is 9.20.
The sample mean is a parameter.

If a time series contains substantial irregular movement, the smoothing constant for a
single exponential smoothing model that is close to 1.0 will result in forecasts that are
not as smoothed out as those that would occur if a smaller smoothing constant was
used.
Managers use contingency analysis to determine whether two categorical variables are
independent of each other.
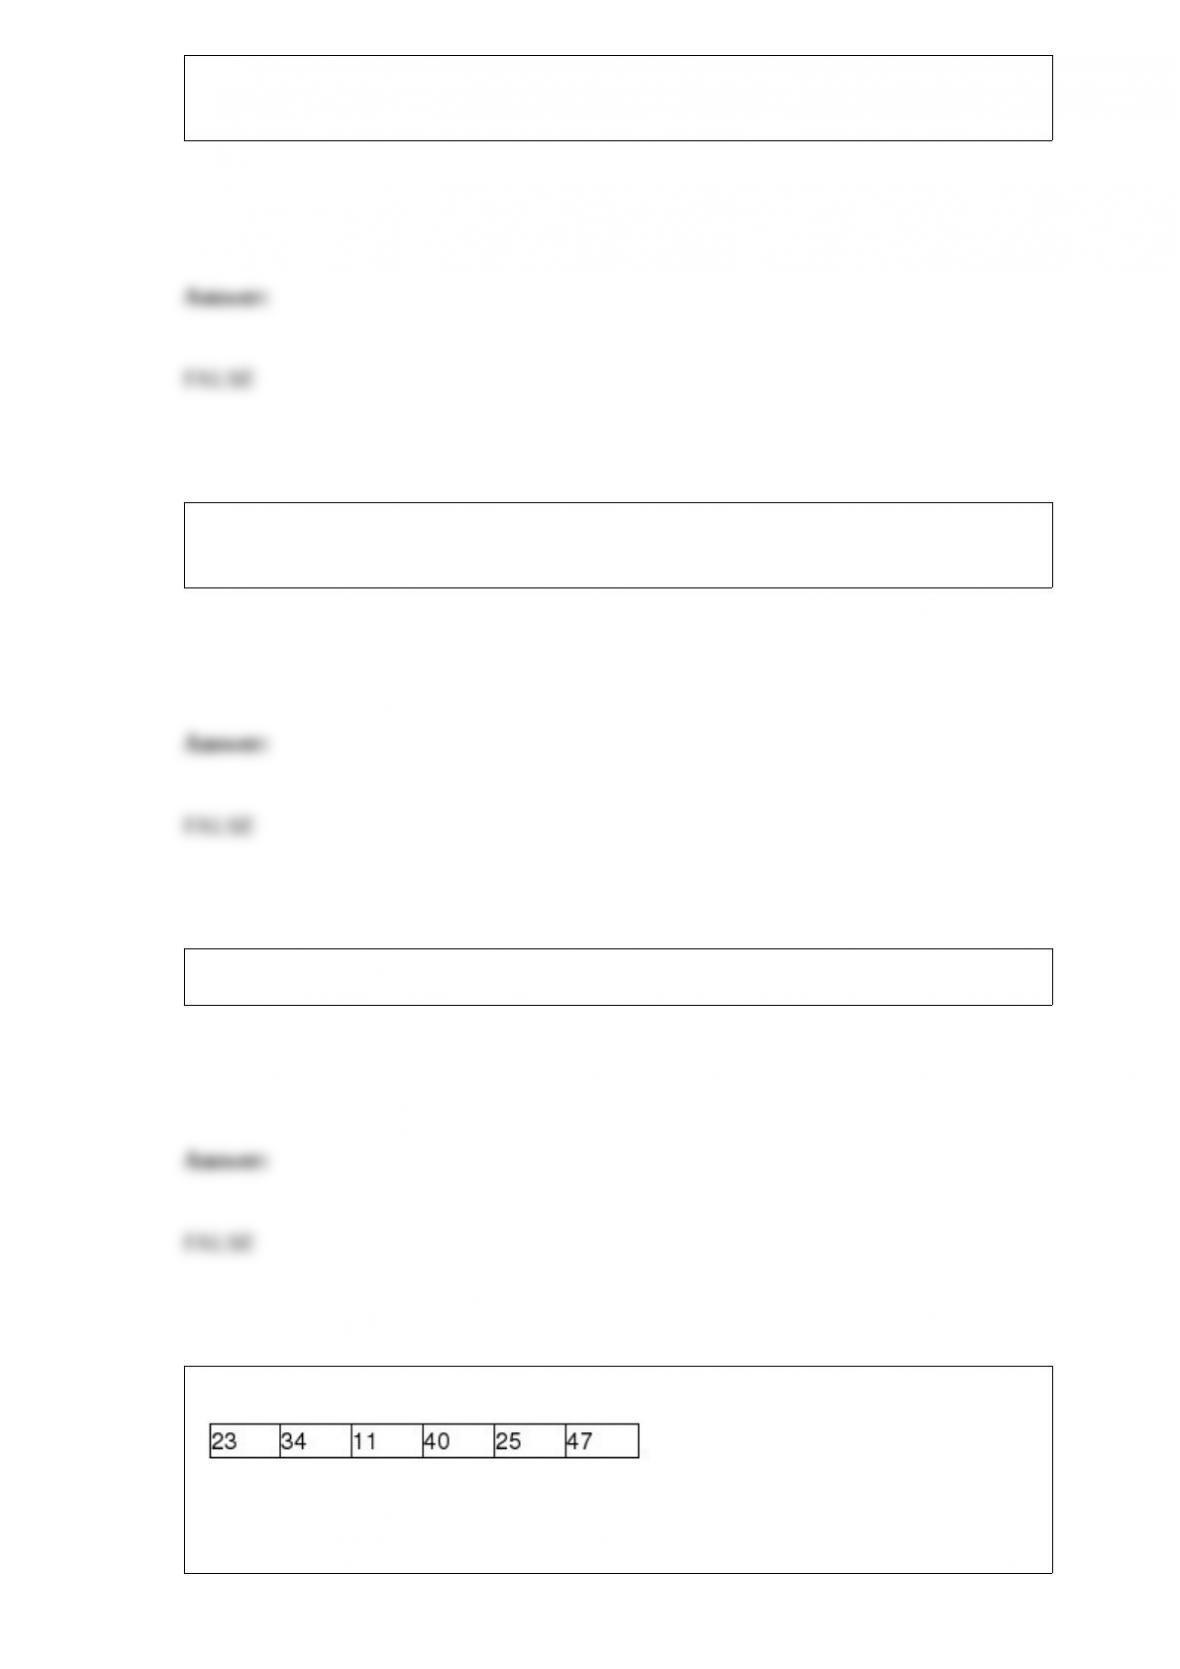
You are given the following data:
Assuming that these data reflect the population of interest, these data can be considered
symmetric.

A recent study involving a sample of 3,000 vehicles in California showed the following
statistics related to the number of miles driven per day: Q1 = 12, Q2 = 45, and Q3 = 56.
Based on these data, if a box and whisker plot is developed, a value of 110 is an outlier.
If one or more of the regression assumptions has been violated this means that the
current regression model is not the best one for this data set, and another model should
be sought.
A company that makes and markets a device that is aimed at helping people quit
smoking claims that at least 70 percent of the people who have used the product have
quit smoking. To test this, a random sample of n = 100 product users was selected. The
critical value for the hypothesis test using a significance level of 0.05 would be
approximately -1.645.

You should not include more than one categorical variable in a multiple regression
because the use of two or more will cause misleading results.
The within sample variation is the dispersion that exists because the sample means for
the various factor levels are not all equal.
A used car lot has 15 cars. Five of these cars were manufactured in the United States
and the others were made in other countries. If one car is purchased at random from this
car lot, the probability that it is a U.S. car is 0.33.
The population of incomes in a particular community is thought to be highly
right-skewed with a mean equal to $36,789 and a standard deviation equal to $2,490.
Based on this, if a sample of size n = 36 is selected, the highest sample mean that we
would expect to see would be approximately $38,034.
There is no hard-and-fast rule regarding the number of classes that must be used when
establishing a frequency distribution for a continuous variable.
The Good-Guys Car Dealership has tracked the number of used cars sold at its
downtown dealership. Consider the following data as representing the population of
cars sold in each of the 8 weeks that the dealership has been open.
The population standard deviation is approximately 2.87 cars.
In conducting one-way analysis of variance, the sample size for each group must be
equal.
A histogram can be used to display a joint frequency distribution between two
quantitative variables.
In an unstructured interview the questions are scripted.
You are given the following data:
Assuming that the data reflect a sample from a larger population, the sample mean is
30.00.

An ogive is a graph of a joint frequency distribution.
Suppose the time it takes for a customer to be served at a fast-food chain business is
thought to be uniformly distributed between 3 and 8 minutes, then the probability that it
will take exactly 5 minutes is 0.20.
A cell phone company believes that 90 percent of their customers are satisfied. They
survey a sample of n = 100 customers and find that 82 say they are satisfied. In
calculating the standard error of the sampling distribution (σp) the proportion to use is
0.82.
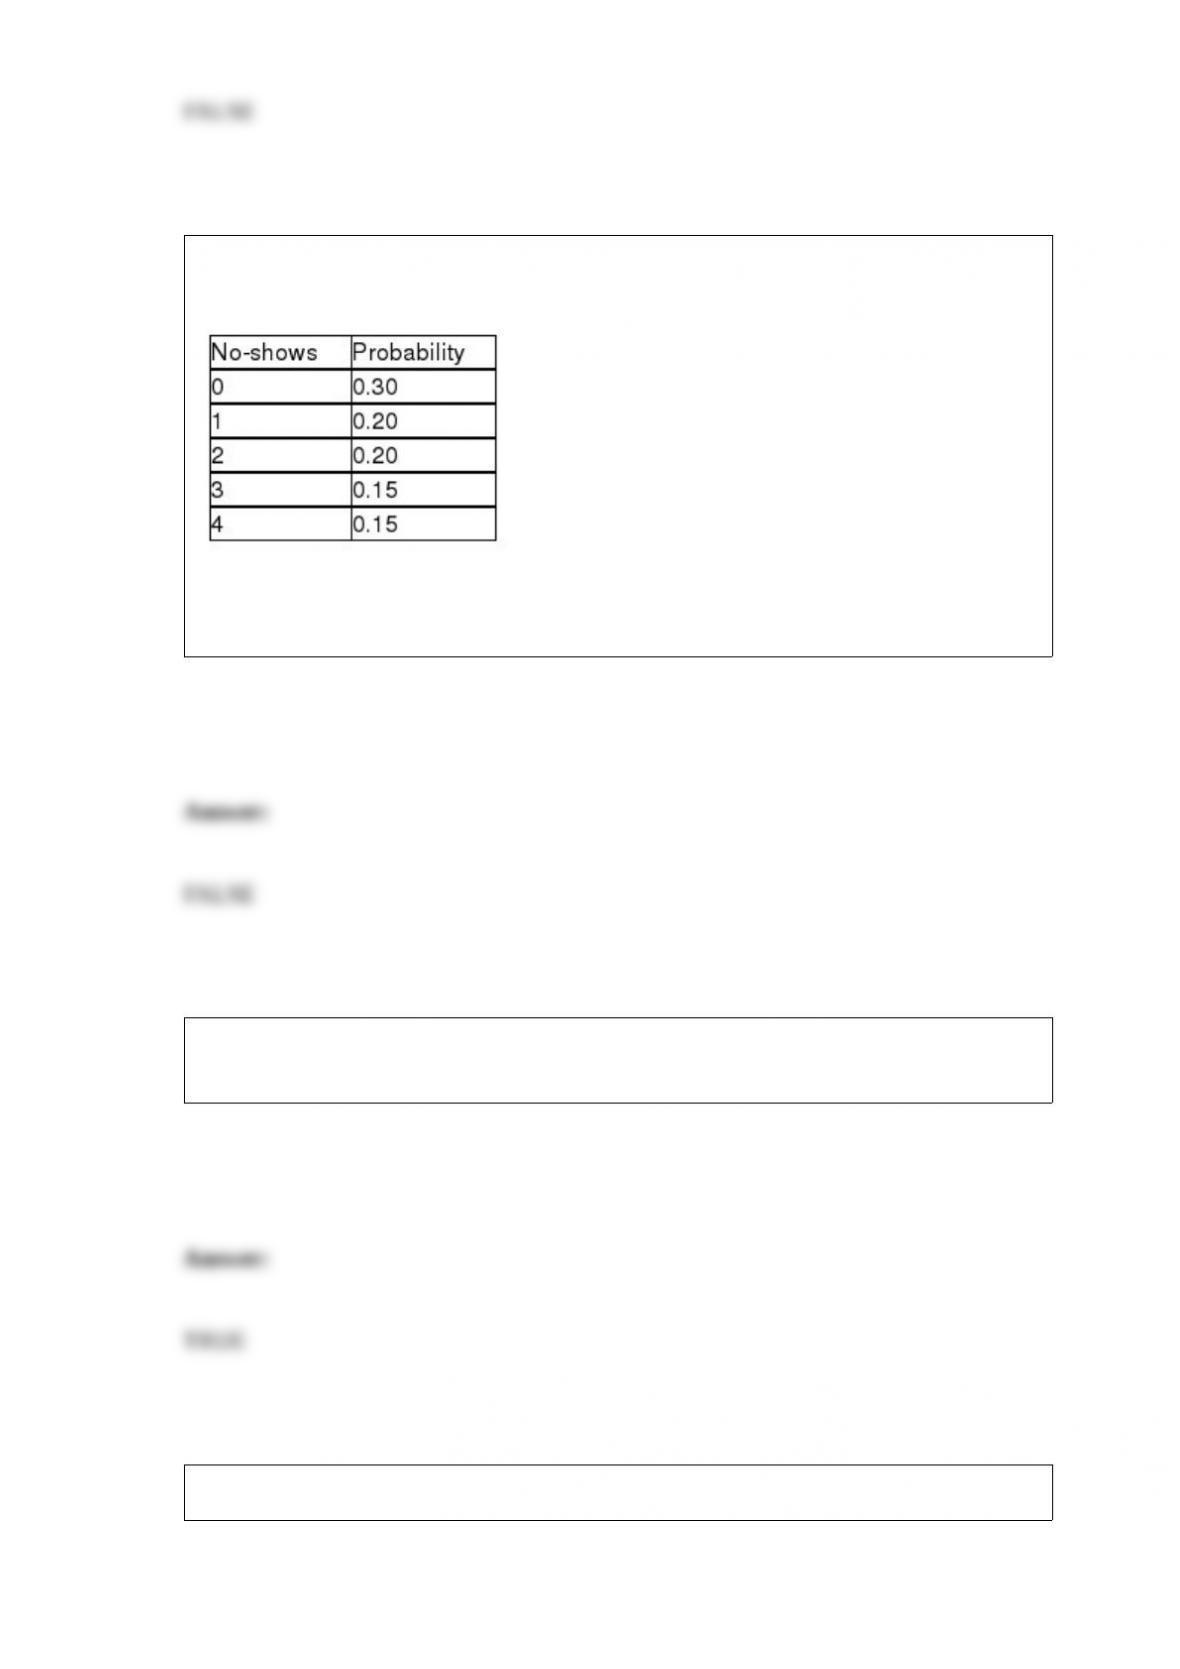
The number of no-shows each day for dinner reservations at the Cottonwood Grille is a
discrete random variable with the following probability distribution:
Based on this information, the standard deviation for the number of no-shows is about
0.36 customers.
When graphed, the probability distribution for a discrete random variable looks like a
histogram.
The null and alternate hypotheses must be opposites of each other.

A study has indicated that the sample size necessary to estimate the average electricity
use by residential customers of a large western utility company is 900 customers.
Assuming that the margin of error associated with the estimate will be 30 watts and the
confidence level is stated to be 90 percent, what was the value for the population
standard deviation?
A) 265 watts
B) Approximately 547.1 watts
C) About 490 watts
D) Can’t be determined without knowing the size of the population.
Which of the following in not an out of control signal for an x-bar chart?
A) One or more points outside the control limits
B) Seven or more consecutive points that all fall on the same side of the center line
C) Six or more consecutive points moving in the same direction (an upward or
downward trend)
D) Fourteen points in a row, alternating up and down

The Carter Department Store has data on the sales volume by department for the past
200 days. The data are in an Excel spreadsheet where column A represents the
department name and column B represents the sales for each day in that department. In
order to construct a bar chart that illustrates the difference in total sales by department
for the 200 days, a required step in Excel will be to:
A) determine the total sales by department.
B) use the frequency function to count the number of occurrences by department.
C) group the data into 5 to 20 classes.
D) determine the class widths.
When testing for independence in a contingency table with 3 rows and 4 columns, there
are ________ degrees of freedom.
A) 5
B) 6
C) 7
D) 12
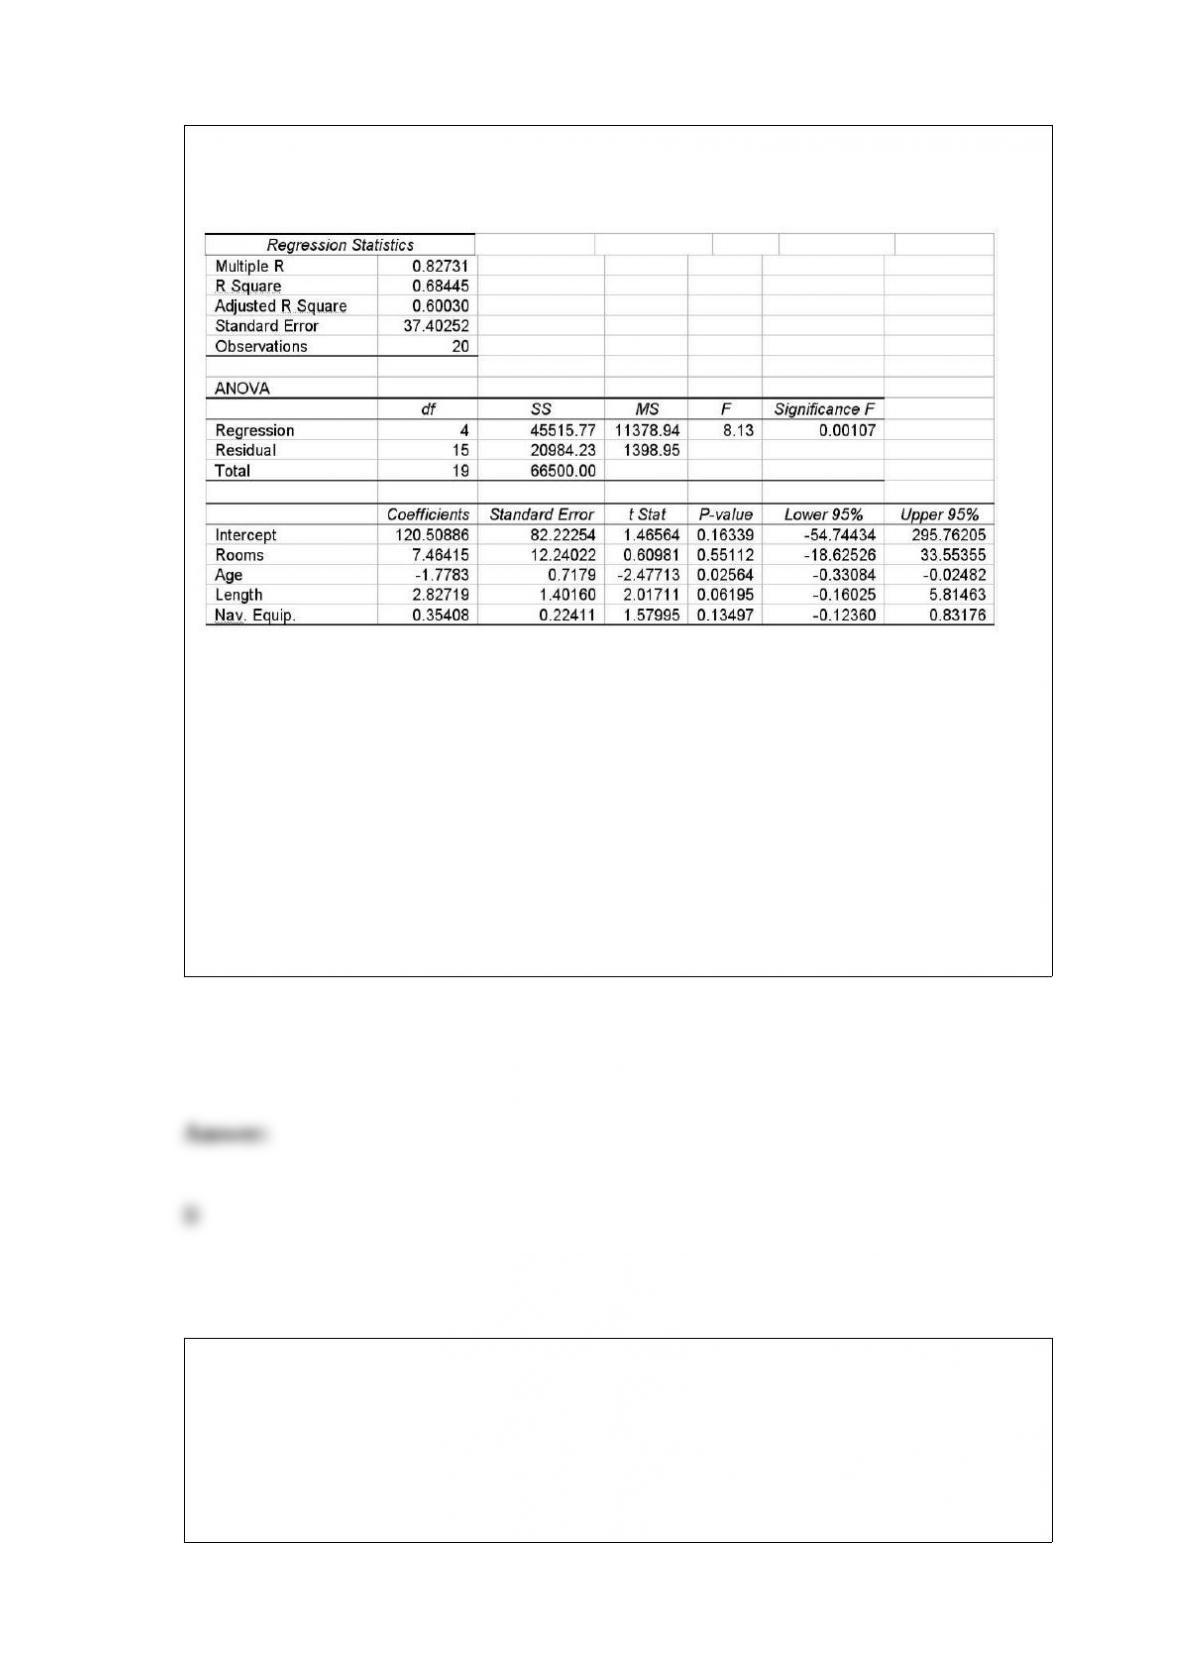
A multiple regression is shown for a data set of yachts where the dependent variable is
the price in thousands of dollars.
Given this information, what is the null hypothesis for testing the overall model?
A) H0 : β0 = β1 = β2 = β3 = β4 = 0
B) H0 : β1 = β2 = β3 = β4 = 0
C) H0 : β1 = 0
D) H0 : β0 = 0
A study was conducted to determine if differences in new textbook prices exist between
on-campus bookstores, off-campus bookstores, and Internet bookstores. To control for
differences in textbook prices that might exist across disciplines, the study randomly
selected 12 textbooks and recorded the price of each of the 12 books at each of the three
retailers. You may assume normality and equal-variance assumptions have been met.
The partially completed ANOVA table based on the study’s findings is shown here:

Based on the study’s findings, was it correct to block for differences in textbooks?
Conduct the appropriate test at the alpha = 0.10 level of significance.
A) Since F = 39.05 > Fα=0.10 = 1.88, reject the null hypothesis. This means that based
on these sample data we can conclude that blocking is effective.
B) Since F = 39.05 > Fα=0.10 = 1.88, do not reject the null hypothesis. This means that
based on these sample data we can conclude that blocking is not effective.
C) Since F = 40.05 > Fα=0.10 = 1.88, reject the null hypothesis. This means that based
on these sample data we can conclude that blocking is effective.
D) Since F = 40.05 > Fα=0.10 = 1.88, do not reject the null hypothesis. This means that
based on these sample data we can conclude that blocking is not effective
After completing sales training for a large company, it is expected that the salesperson
will generate a sale on at least 15 percent of the calls he or she makes. To make sure
that the sales training process is working, a random sample of n = 400 sales calls made
by sales representatives who have completed the training have been selected and the
null hypothesis is to be tested at 0.05 alpha level. Suppose that a sale is made on 36 of
the calls. Based on this information, what is the test statistic for this test?
A) Approximately 0.1417
B) About z = -3.35
C) z = -1.645

D) t = -4.567
The manager for State Bank and Trust has recently examined the credit card account
balances for the customers of her bank and found that 20% have an outstanding balance
at the credit card limit. Suppose the manager randomly selects 15 customers and finds 4
that have balances at the limit. Assume that the properties of the binomial distribution
apply.
What is the probability of finding 4 customers in a sample of 15 who have “maxed out”
their credit cards?
A) 0.1876
B) 0.8358
C) 0.6482
D) 0.3832
A major tire manufacturer wishes to estimate the mean tread life in miles for one of its
tires. It wishes to develop a confidence interval estimate that would have a maximum
sampling error of 500 miles with 90 percent confidence. A pilot sample of n = 50 tires
showed a sample standard deviation equal to 4,000 miles. Based on this information,
the required sample size is:
A) 124.

B) 246.
C) 174.
D) 196.
Three events occur with probabilities P(E1) = 0.35, P(E2) = 0.15, P(E3) = 0.40. If the
event B occurs, the probability becomes P(E1|B) = 0.25, P(B) = 0.30. Compute P(E1 or
B).
A) 0.575
B) 0.075
C) 0.021
D) 0.475
Given the following null and alternative
Test the hypothesis using α = 0.01 assuming that a sample of n = 200 yielded x = 105
items with the desired attribute.
A) Since -2.17 > -2.33, the null hypothesis is not rejected.

B) Since -1.86 > -1.02, the null hypothesis is not rejected.
C) Since -2.17 > -2.33, the null hypothesis is rejected.
D) Since -1.86 > -1.02, the null hypothesis is rejected.
In conjunction with the housing foreclosure crisis of 2009, many economists expressed
increasing concern about the level of credit card debt and efforts of banks to raise
interest rates on these cards. The banks claimed the increases were justified. A Senate
subcommittee decided to determine if the average credit card balance depends on the
type of credit card used. Under consideration are Visa, MasterCard, Discover, and
American Express. The sample sizes to be used for each level are 25, 25, 26, and 23,
respectively.
State the number of degrees of freedom available for determining the within-samples
variation.
A) 93
B) 95
C) 97
D) 98
A test is conducted to compare three different income tax software packages to
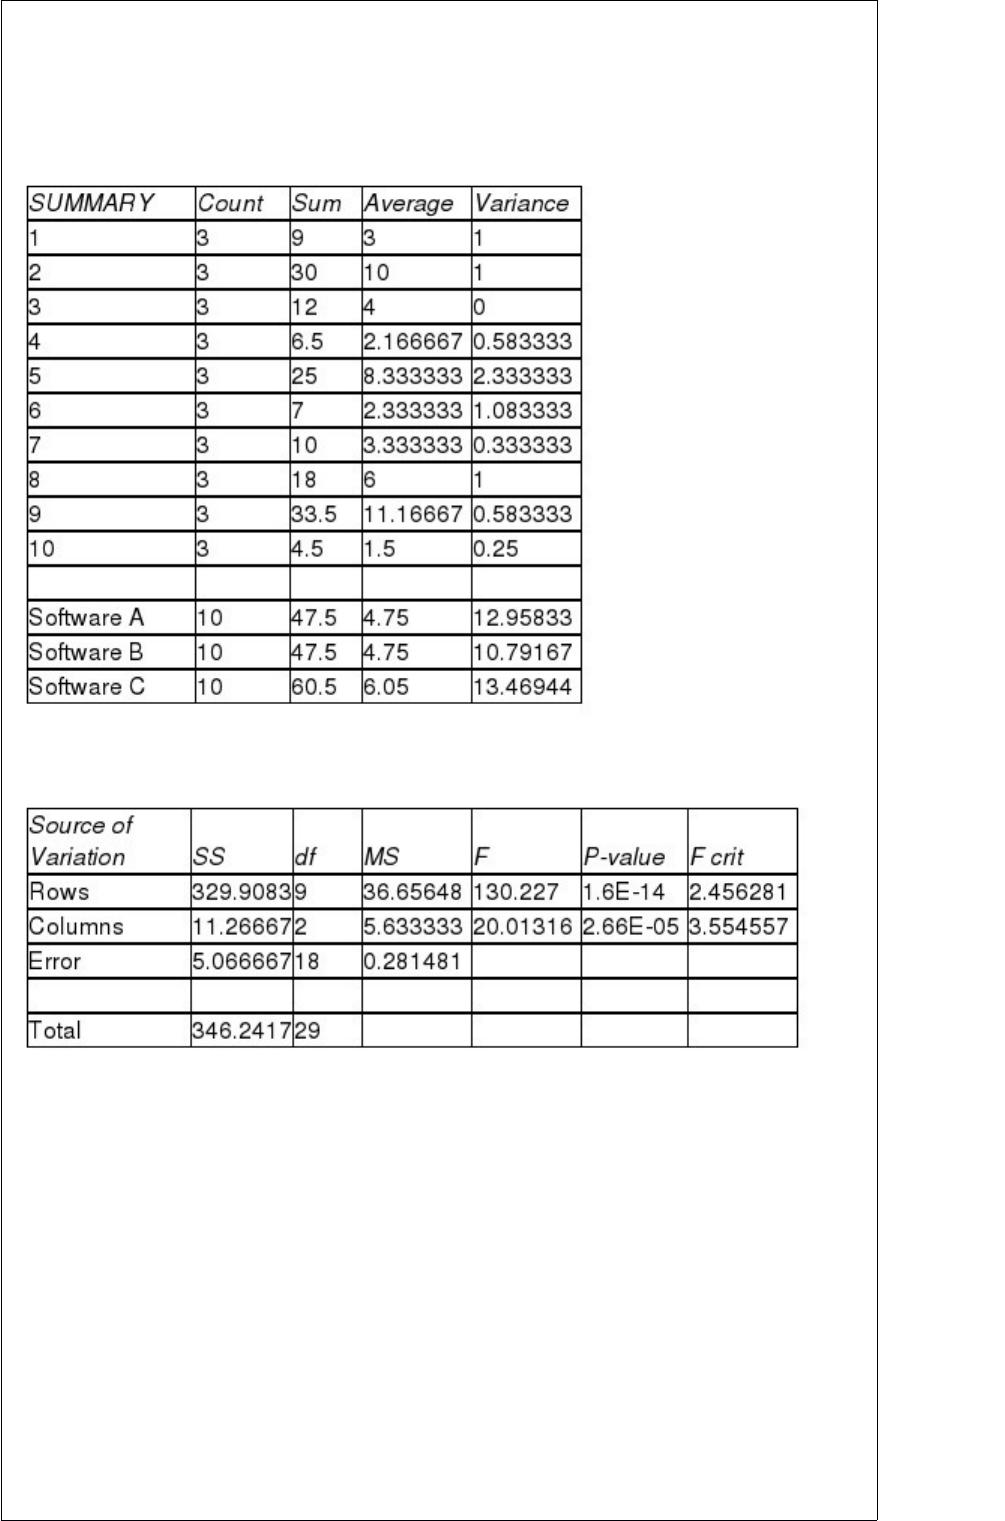
determine whether there is any difference in the average time it takes to prepare income
tax returns using the three different software packages. Ten different persons’ income
tax returns are done by each of the three software packages and the time is recorded for
each. The computer results are shown below.
ANOVA
Based on these results and using a 0.05 level of significance which is correct regarding
the primary hypothesis?
A) The three software packages are not all the same because p-value = 1.6E-14 is less
than 0.05.
B) The three software packages are all the same because p-value = 1.6 is greater than
0.05.
C) The three software packages are not all the same because p-value = 2.66E-5 is less
than 0.05.
D) The three software packages are all the same because p-value = 2.66 is greater than
0.05.

For the following hypothesis:
With n = 20, = 71.2, s = 6.9, and α = 0.1, state the conclusion.
A) Because the computed value of t = 0.78 is not greater than 2.1727, reject the null
hypothesis.
B) Because the computed value of t = 0.78 is not greater than 2.1727, do not reject the
null hypothesis.
C) Because the computed value of t = 0.78 is not greater than 1.3277, reject the null
hypothesis.
D) Because the computed value of t = 0.78 is not greater than 1.3277, do not reject the
null hypothesis.
The mean number of errors per page made by a member of the word processing pool
for a large company is thought to be 1.5 with the number of errors distributed according
to a Poisson distribution. If three pages are examined, what is the probability that more
than 3 errors will be observed?
A) 0.6577
B) 0.6969
C) 0.7324

D) 0.7860
A mail-order business prides itself in its ability to fill customers’ orders in six calendar
days or less on the average. Periodically, the operations manager selects a random
sample of customer orders and determines the number of days required to fill the
orders. Based on this sample information, he decides if the desired standard is not being
met. He will assume that the average number of days to fill customers’ orders is six or
less unless the data suggest strongly otherwise. On one occasion where a sample of 40
customers was selected, the average number of days was 6.65, with a sample standard
deviation of 1.5 days. Can the operations manager conclude that his mail-order business
is achieving its goal? Use a significance level of 0.025 to answer this question.
A) Since 2.2216 < 2.4511, reject H0 and conclude that the mail-order business is not
achieving its goal
B) Since 2.7406 > 2.023, reject H0 and conclude that the mail-order business is not
achieving its goal.
C) Since 2.4421 > 2.023, reject H0 and conclude that the mail-order business is not
achieving its goal.
D) Since 2.2346 < 2.5113, reject H0 and conclude that the mail-order business is not
achieving its goal.
Which of the following describes a treatment in a randomized complete block analysis

of variance?
A) A treatment is a combination of one level of each factor.
B) A treatment is a level associated with each factor of the experiment.
C) A treatment is another term for the data that are collected in the experiment.
D) A treatment is considered to be the analysis that is performed on the sample data.
A mail-order business prides itself in its ability to fill customers’ orders in six calendar
days or less on the average. Periodically, the operations manager selects a random
sample of customer orders and determines the number of days required to fill the
orders. Based on this sample information, he decides if the desired standard is not being
met. He will assume that the average number of days to fill customers’ orders is six or
less unless the data suggest strongly otherwise. On one occasion where a sample of 40
customers was selected, the average number of days was 6.65, with a sample standard
deviation of 1.5 days. Can the operations manager conclude that his mail-order business
is achieving its goal? Use a significance level of 0.025 to answer this question. Conduct
the test using this p-value.
A) Since 0.024 > 0.0041, reject the null hypothesis.
B) Since 0.046 > 0.0025, reject the null hypothesis.
C) Since 0.0046 < 0.025, reject the null hypothesis.
D) Since 0.0024 < 0.041, reject the null hypothesis.
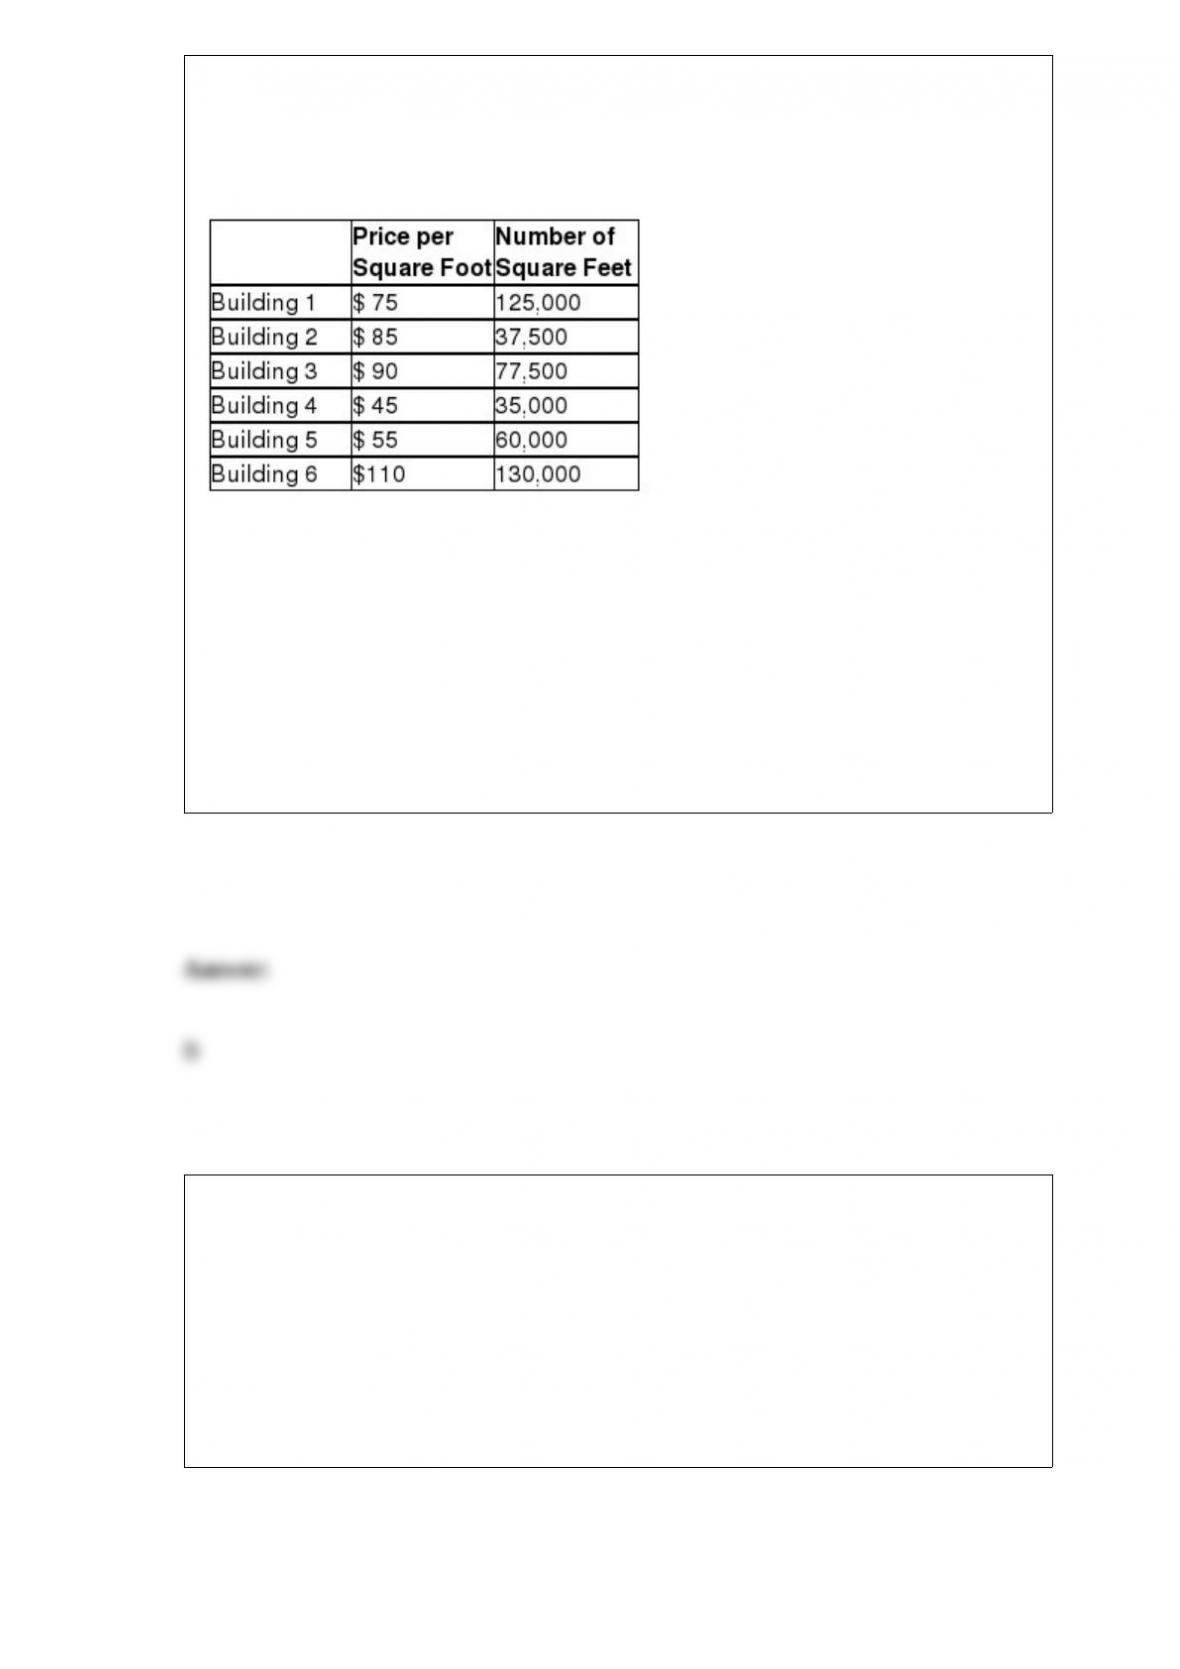
Todd Lindsey & Associates, a commercial real estate company located in Boston, owns
six office buildings in the Boston area that it leases to businesses. The lease price per
square foot differs by building due to location and building amenities. Currently, all six
buildings are fully leased at the prices shown here.
Compute the weighted average (mean) price per square foot for these buildings.
A) 86.25
B) 83.25
C) 80.15
D) 86.15
For a standardized normal distribution, calculate P(1.78 < z < 2.34).
A) 0.0124
B) 0.0341
C) 0.0412
D) 0.0279

A car company is interested in testing to see whether the mean miles that a car engine
will last without changing oil is the same or different depending on which brand of oil
is used. The engineers also wish to control for the type of transmission (manual or
automatic) that is used. To conduct this test, the car company obtains enough engines so
that all four oil brands can be tested in a design that involves no replication. Based on
this information, how many engines will be needed to conduct the test?
A) 4
B) 8
C) One for each oil type
D) One for each factor in the study
A recent study of 15 shoppers showed that the correlation between the time spent in the
store and the dollars spent was 0.235. Using a significance level equal to 0.05, which of
the following is true?
A) The null hypothesis that the population mean is equal to zero should be rejected and
we should conclude that the true correlation is not equal to zero.
B) Based on the sample data there is not enough evidence to conclude that the true
correlation is different from zero.
C) The sample correlation coefficient could be zero since the test statistic does not fall
in the rejection region.
D) The null hypothesis should be rejected because the test statistic exceeds the critical
value.

The asking price for homes on the real estate market in Baltimore has a mean value of
$286,455 and a standard deviation of $11,200. The mean and standard deviation in
asking price for homes in Denver are $188,468 and $8,230, respectively. Recently, one
home sold in each city where the asking price for each home was $193,000. Assuming
that both distributions are bell-shaped, which of the following statements is true?
A) The Baltimore home has the higher standard z-value.
B) The coefficient of variation for Denver is less than for Baltimore.
C) The Denver home has a higher standard z-value.
D) Both cities have the same coefficient of variation.
For the following hypothesis test:
With n = 80, σ = 9, and = 47.1, state the appropriate p-value.
A) 0.0183
B) 0.0314
C) 0.0512
D) 0.0218

The J.R. Simplot Company produces frozen French fries that are then sold to customers
such as McDonald’s. The “prime” line of fries has an average length of 6.00 inches with
a standard deviation of 0.50 inch. To make sure that Simplot continues to meet the
quality standard for “prime” fries, they plan to select a random sample of n = 100 fries
each day. Yesterday, the sample mean was 6.05 inches. What is the probability that the
mean would be 6.05 inches or more if they are meeting the quality standards?
A) 0.2350
B) 0.3413
C) 0.9413
D) 0.1587
If the p value is less than α in a two-tailed test,
A) the null hypothesis should not be rejected.
B) the null hypothesis should be rejected.
C) a one-tailed test should be used.
D) More information is needed to reach a conclusion about the null hypothesis.
The degrees of freedom for a contingency table with 11 rows and 10 columns is:
A) 11
B) 10
C) 110
D) 90
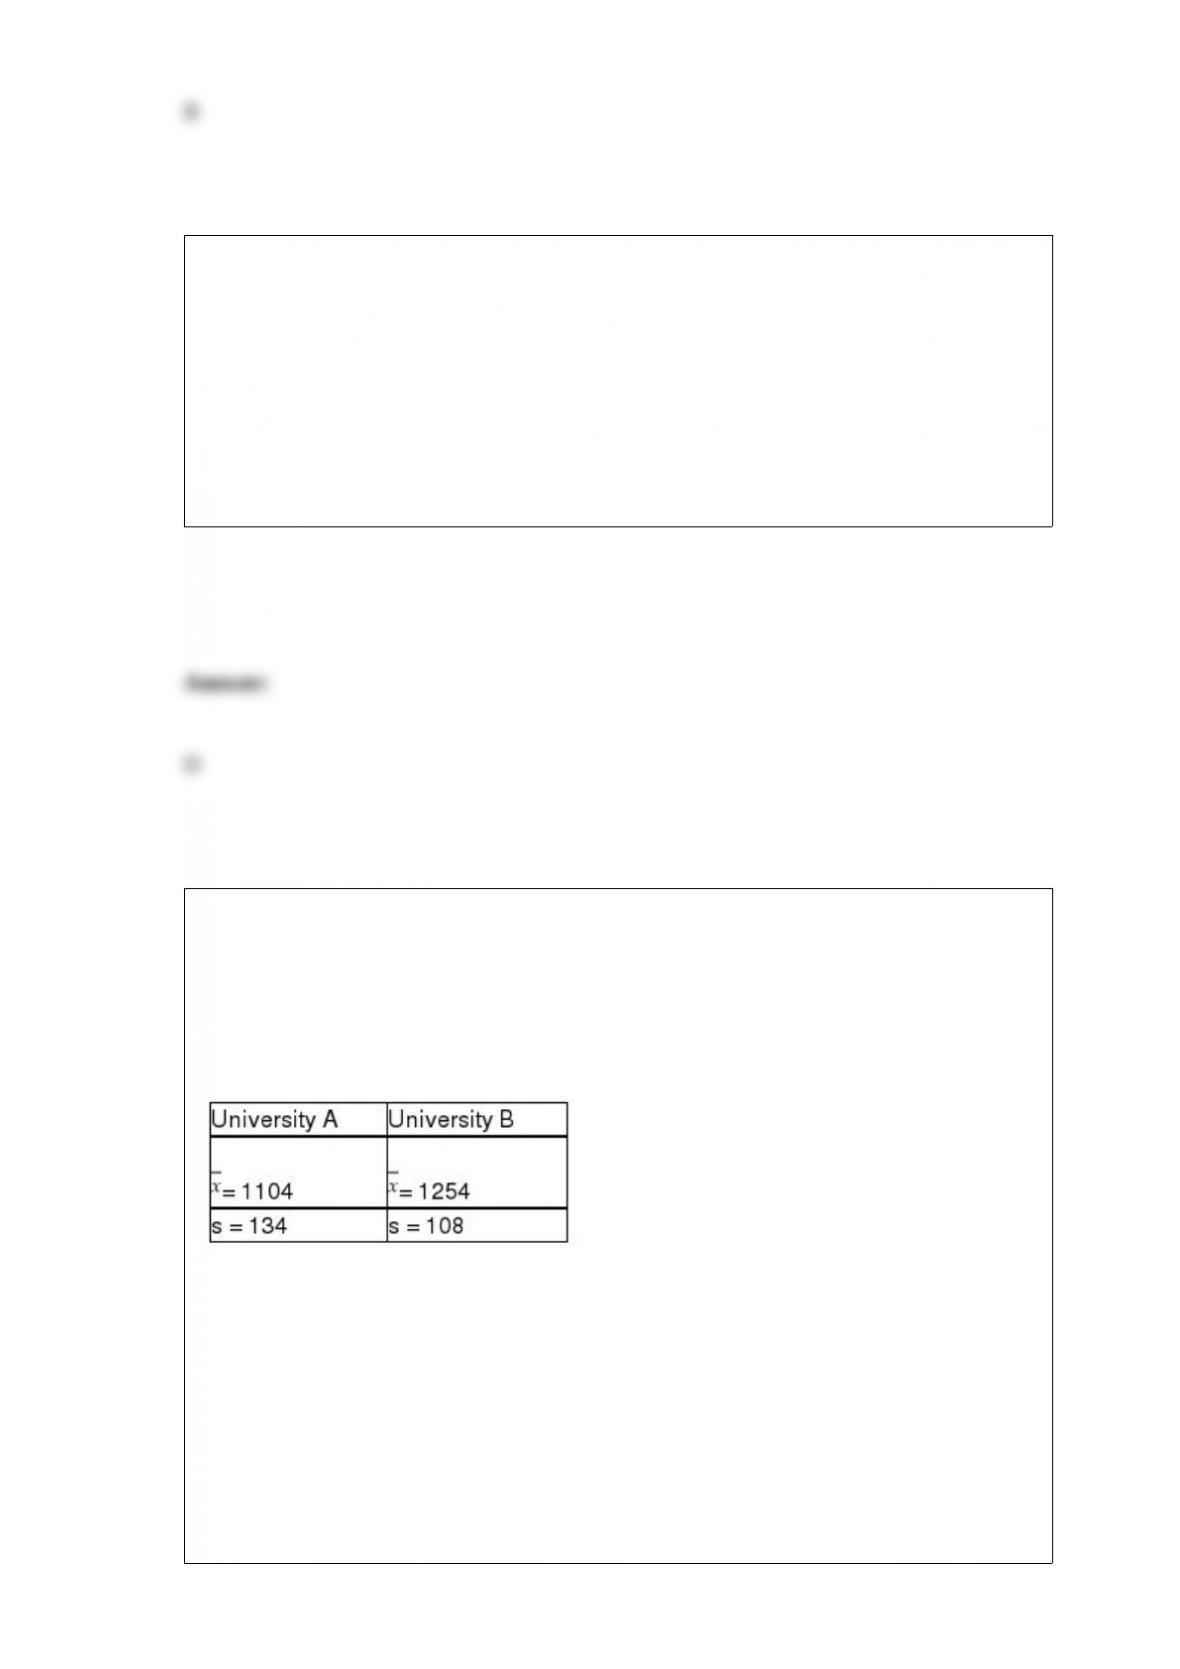
It is believed that the SAT scores for students entering two state universities may have
different standard deviations. Specifically, it is believed that the standard deviation at
University A is greater than the standard deviation at University B. To test this using an
alpha = 0.05 level, a sample of 14 student SAT scores from University A was selected
and a sample of 8 SAT scores from University B was selected. The following sample
results were observed:
Based on this information, what is the value of the test statistic?
A) 1.2407
B) 0.6496
C) 1.5394
D) None of the above.

Assuming you have data for a variable with 2,000 values, using the 2k ≥ n guideline,
what is the least number of groups that should be used in developing a grouped data
frequency distribution?
A) 9
B) 11
C) 13
D) 12
The billing department of a national cable service company is conducting a study of
how customers pay their monthly cable bills. The cable company accepts payment in
one of four ways: in person at a local office, by mail, by credit card, or by electronic
funds transfer from a bank account. The cable company randomly sampled 400
customers to determine if there is a relationship between the customer’s age and the
payment method used. The following sample results were obtained:
Based on the sample data, can the cable company conclude that there is a relationship
between the age of the customer and the payment method used? Conduct the
appropriate test at the alpha= 0.01 level of significance.

A) Because x2 = 42.2412 > 21.666, do not reject the null hypothesis. Based on the
sample data conclude that age and type of payment are independent.
B) Because x2 = 42.2412 > 21.666, reject the null hypothesis. Based on the sample data
conclude that age and type of payment are not independent
C) Because x2 = 50.3115 > 21.666, do not reject the null hypothesis. Based on the
sample data conclude that age and type of payment are independent.
D) Because x2 = 50.3115 > 21.666, reject the null hypothesis. Based on the sample data
conclude that age and type of payment are not independent.
A local FedEx/Kinkos has three black-and-white copy machines and two color copiers.
Based on historical data, the chances that each black-and-white copier will be down for
repairs is 0.10. The color copiers are more of a problem and are down 20% of the time
each.
If a customer wants both a color copy and a black-and-white copy, what is the
probability that the necessary machines will be available? (Assume that the color copier
can also be used to make a black-and-white copy if needed.)
A) 0.04
B) 0.96
C) 0.47
D) 0.42

A sample of 25 observations is taken to estimate a population proportion π. The
sampling distribution of sample proportion p is:
A) not normal since n < 30.
B) approximately normal because is always normally distributed.
C) approximately normal if np ≥ 5 and n(1 – p) ≥ 5.
D) approximately normal if p approaches 0.50.
A major shipping company has stated that 96 percent of all parcels are delivered on
time. To check this, a random sample of n = 200 parcels were sampled. Of these, 184
arrived on time. If the company’s claim is correct, what is the probability of 184 or
fewer parcels arriving on time?
A) About 0.0019
B) Nearly 0.24
C) Just over 0.98
D) About 0.4981
Suppose an economist has developed a model for forecasting annual consumption, yt, as
function of total labor income, x1t, and total property income, x2t based on 20 years on

annual data. The following regression model has been developed:
t= 7.81 + 0.91x1t + 0.57x2t with the standard error = 1.29 and the Durbin-Watson d
statistic = 2.09. Using an alpha = .05, which of the following is the correct critical value
for testing whether the residuals are autocorrelated?
A) 1.20 and 1.41
B) 1.10 and 1.54
C) 1.08 and 1.53
D) Can’t be determined without seeing the residuals.
The college basketball team at West Texas State University has 10 players; 5 are
seniors, 2 are juniors, and 3 are sophomores. Two players are randomly selected to
serve as captains for the next game. What is the probability that both players selected
are seniors?
A) 0.22
B) 0.33
C) 0.50
D) 0.66