
If a set of data has 540 values, the 3rd quartile corresponds to approximately the 135th
value when the data have been arranged in numerical order.
In estimating a population mean, a large sample size is generally preferable to a small
sample size because the margin of error is generally smaller.
To describe variable credit status that has three levels: Excellent, Good, and Poor, we
need to use two different dummy variables.
The second quartile for a set of data will have the same value as the 50th percentile only
when the data are symmetric.

The Cranston Company recently met with a group of its customers to ask questions
about the service and products provided by the company. The data collected in this
process would be an example of data collected through direct observation.
The Fallbrook Distributing Company has a soft drink bottling plant in Plano, Texas.
Based on historical records, if its filling machine is working properly, the mean fill
volume per can is 12.0 ounces with a standard deviation equal to 0.13 ounce. Further,
the distribution of fill amounts is known to be normally distributed. The State of Texas
has a department whose job it is to check on such consumer-related processes as soft
drink filling. The idea is to protect the consumer. The department arrives at the
Fallbrook plant once a month on an unscheduled day. When they arrive, they randomly
select n = 4 cans and carefully measure the volume in each can. If any of these cans
contains less than 11.85 ounces, the plant is shut down until a full inspection of the
filling process is performed. Based on this information, the probability that the plant
will get shut down if it is operating properly is approximately 0.1251.
When a single value is randomly chosen from a discrete distribution, the different
possible values are mutually exclusive.

Three brands of running shoes are each tested by 10 different runners. The amount of
wear on the sole of the shoes is then measured. The objective is to determine if there is
any difference among the three brands of shoes based on how long the soles last. The
degrees of freedom for testing whether the brands of shoes differ are D1 = 9 and D2 = 2.
The vehicle speeds on a city street have been determined to be normally distributed
with a mean of 33.2 mph and a variance of 16. Based on this information, the
probability that if three randomly selected vehicles are monitored and that two of the
three will exceed the 35 mph speed limit is slightly greater than 0.18.
If the test statistic for a chi-square goodness-of-fit test is larger than the critical value,
the null hypothesis should be rejected.
The graph of a discrete random variable looks like a histogram where the probability of
each possible outcome is represented by a bar.
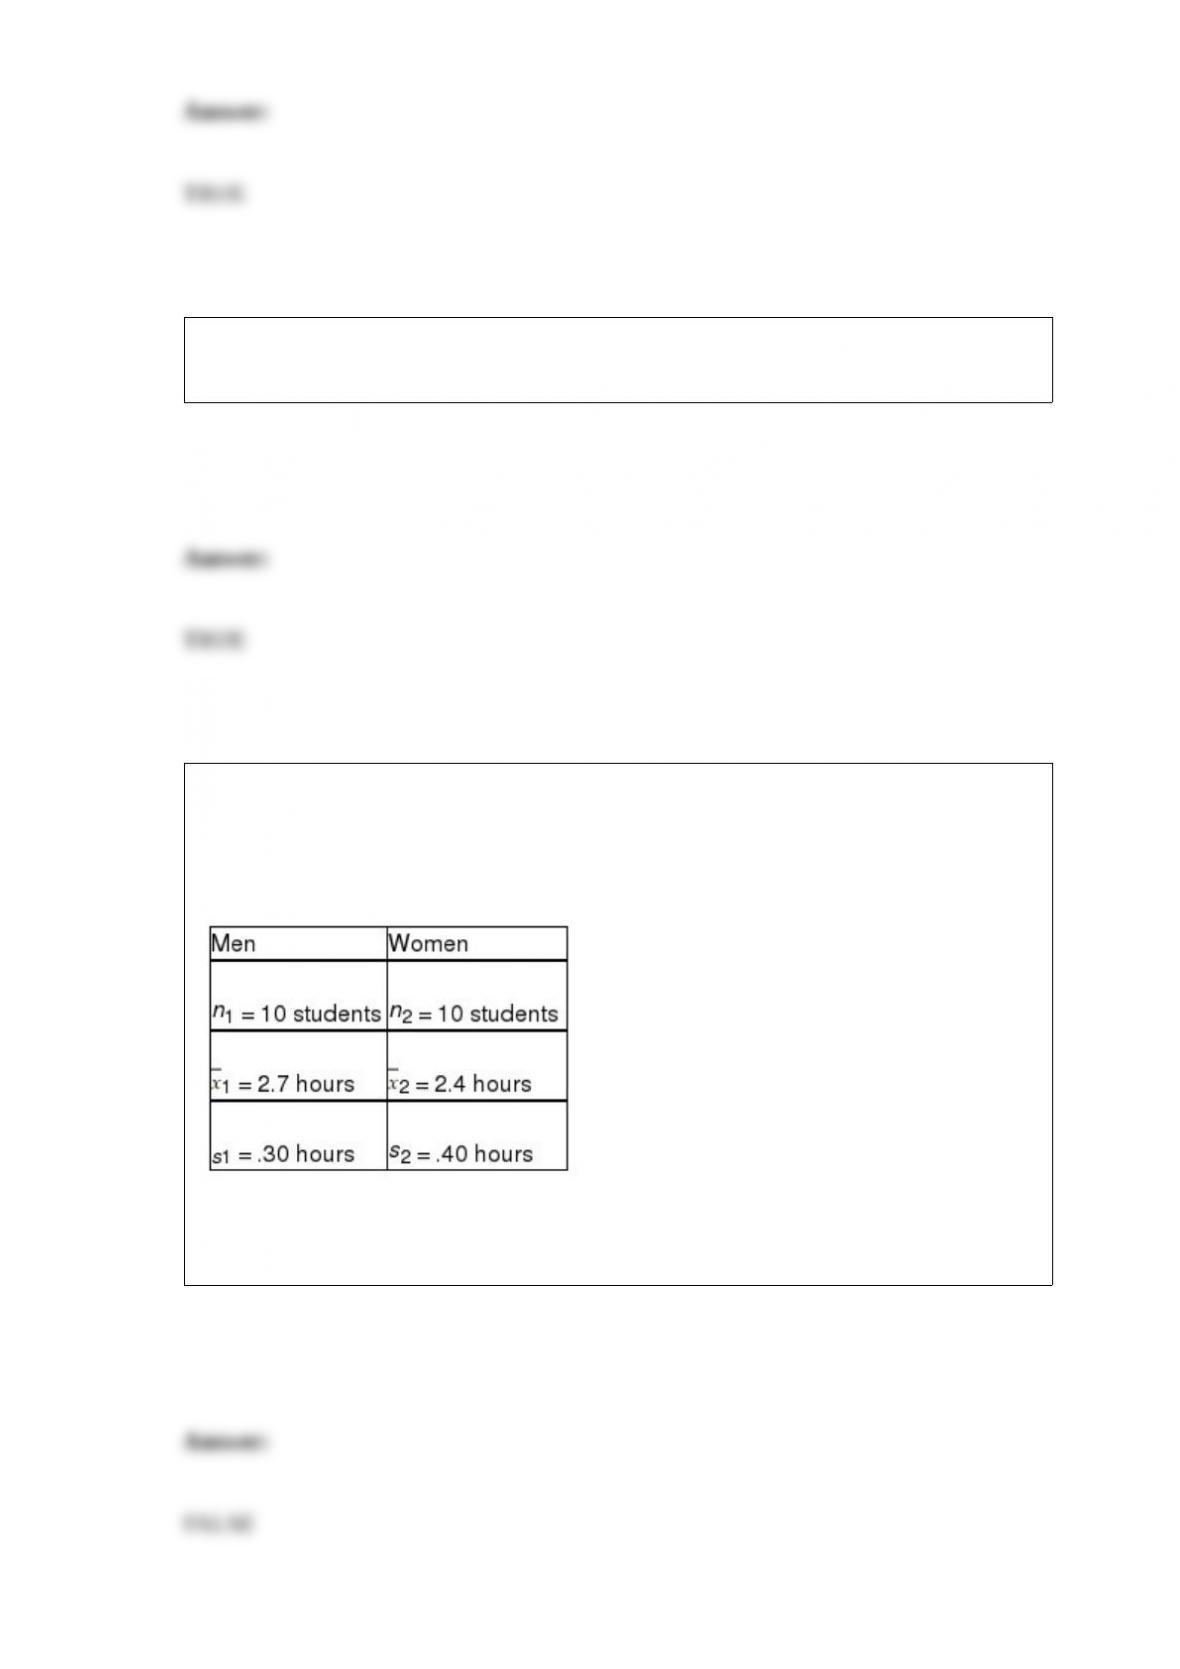
The NCAA is interested in estimating the difference in mean number of daily training
hours for men and women athletes on college campuses. It wants 95 percent confidence
and will select a sample of 10 men and 10 women for the study. The variances are
assumed equal and the populations normally distributed. The sample results are:
Based on these sample data, the estimate for the standard deviation of the sampling
distribution is found by taking the square root of the sum of the two sample variances.
A tire store manager has collected data showing the number of tires of each brand sold
during the past month. A bar chart might be effective in graphically illustrating which
brands tend to sell best at this store.
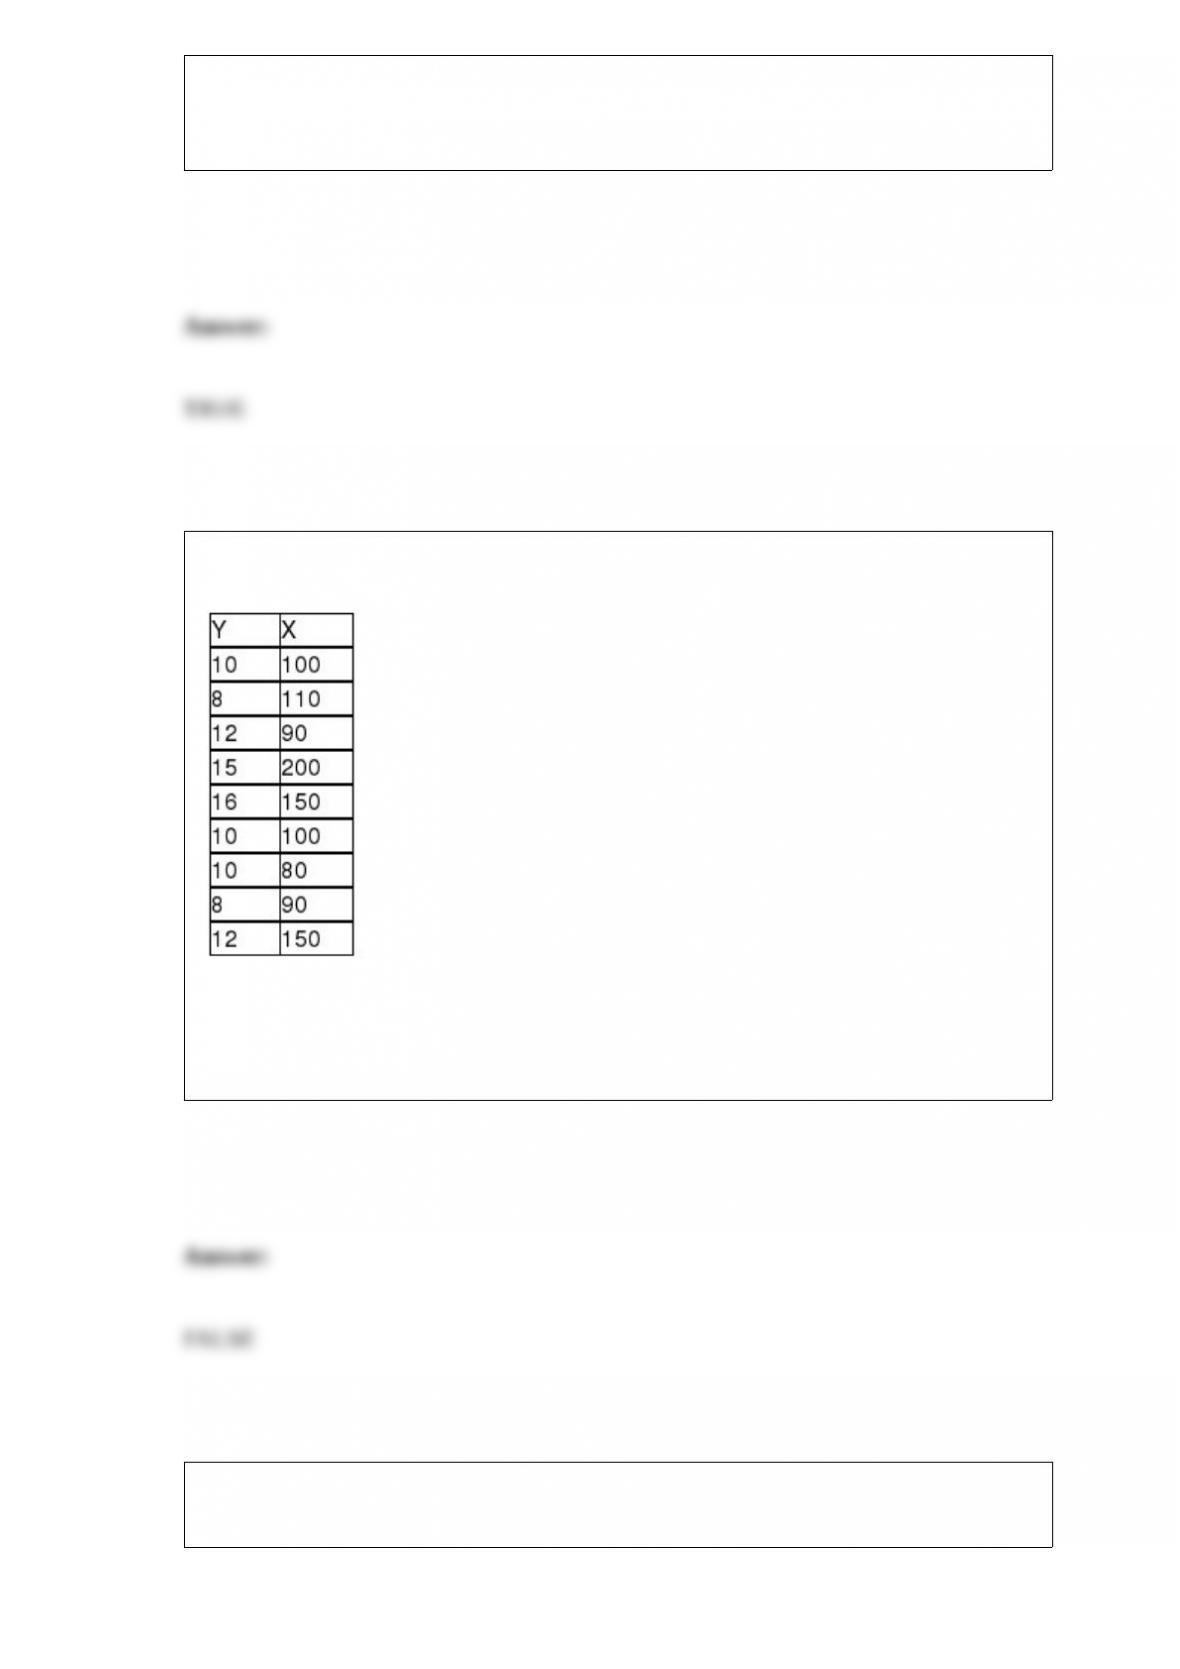
You are given the following sample data for two variables:
Based upon these sample data, and testing at the 0.05 level of significance, the critical
value for testing whether the population correlation coefficient is equal to zero is t =
2.2622.
For a given set of data, if the data are treated as a population, the calculated standard
deviation will be less than it would be had the data been treated as a sample.

The variance inflation factor is an indication of how much multicollinearity there is in
the regression model.
In process improvement efforts, the goal is to first remove the common cause variation
and then to reduce the special cause variation in a system.
A time-series graph shows that annual sales data have grown gradually over the past 10
years. Given this, if a linear trend model is used to forecast future years’ sales, the sign
on the regression slope coefficient will be positive.

The number of customers who arrive at a fast food business during a one-hour period is
known to be Poisson distributed with a mean equal to 8.60. The probability that more
than 4 customers will arrive in a 30-minute period is 0.1933.
When a correlation is found between a pair of variables, this always means that there is
a direct cause and effect relationship between the variables.
A potato chip manufacturer has two packaging lines and wants to determine if the
variances differ between the two lines. They take samples of n1 = 10 bags from line 1
and n2 = 8 bags from line 2. To perform the hypothesis test at the 0.05 level of
significance, the critical value is F = 3.68.

In estimating the difference between two population means, if a 95 percent confidence
interval includes zero, then we can conclude that there is a 95 percent chance that the
difference between the two population means is zero.
When a regression equation includes a term such as x1x2 where two independent
variables are multiplied, this is an interaction term.
A recent study involving a sample of 3,000 vehicles in California showed the following
statistics related to the number of miles driven per day: Q1 = 12, Q2 = 45, and Q3 = 56.
Based on these data, we know that the distribution is skewed.
Six food critics each visited and rated four different restaurants. Each critic visited each
restaurant on three separate occasions and recorded a score for each visit. The total
number of degrees of freedom is 71.

The number of cells in a two-factor analysis of variance design is equal to the number
of levels of factor A plus the number of levels of factor B.
One of the most common statistical sampling techniques is convenience sampling.
A multiple regression model of the form = B0 + B1x + B2x2 + B3x3 + ε is called an
expanded second-order polynomial since it contains all the terms up to x3 in the model
at one time.

The Hawkins Company randomly samples 10 items from every large batch before the
batch is packaged and shipped. According to the contract specifications, 5 percent of the
items shipped can be defective. If the inspectors find 1 or fewer defects in the sample of
10, they ship the batch without further inspection. If they find 2 or more, the entire
batch is inspected. Based on this sampling plan, the probability that a batch that
contains twice the amount of defects allowed by the contract requirements will be
shipped without further inspection is approximately .3874.
Variation exists naturally in the world around us so all processes and products can be
expected to vary.
When a company scans the bar codes on its products in an effort to count the number of
products that remain in inventory, the company is collecting data through
experimentation.
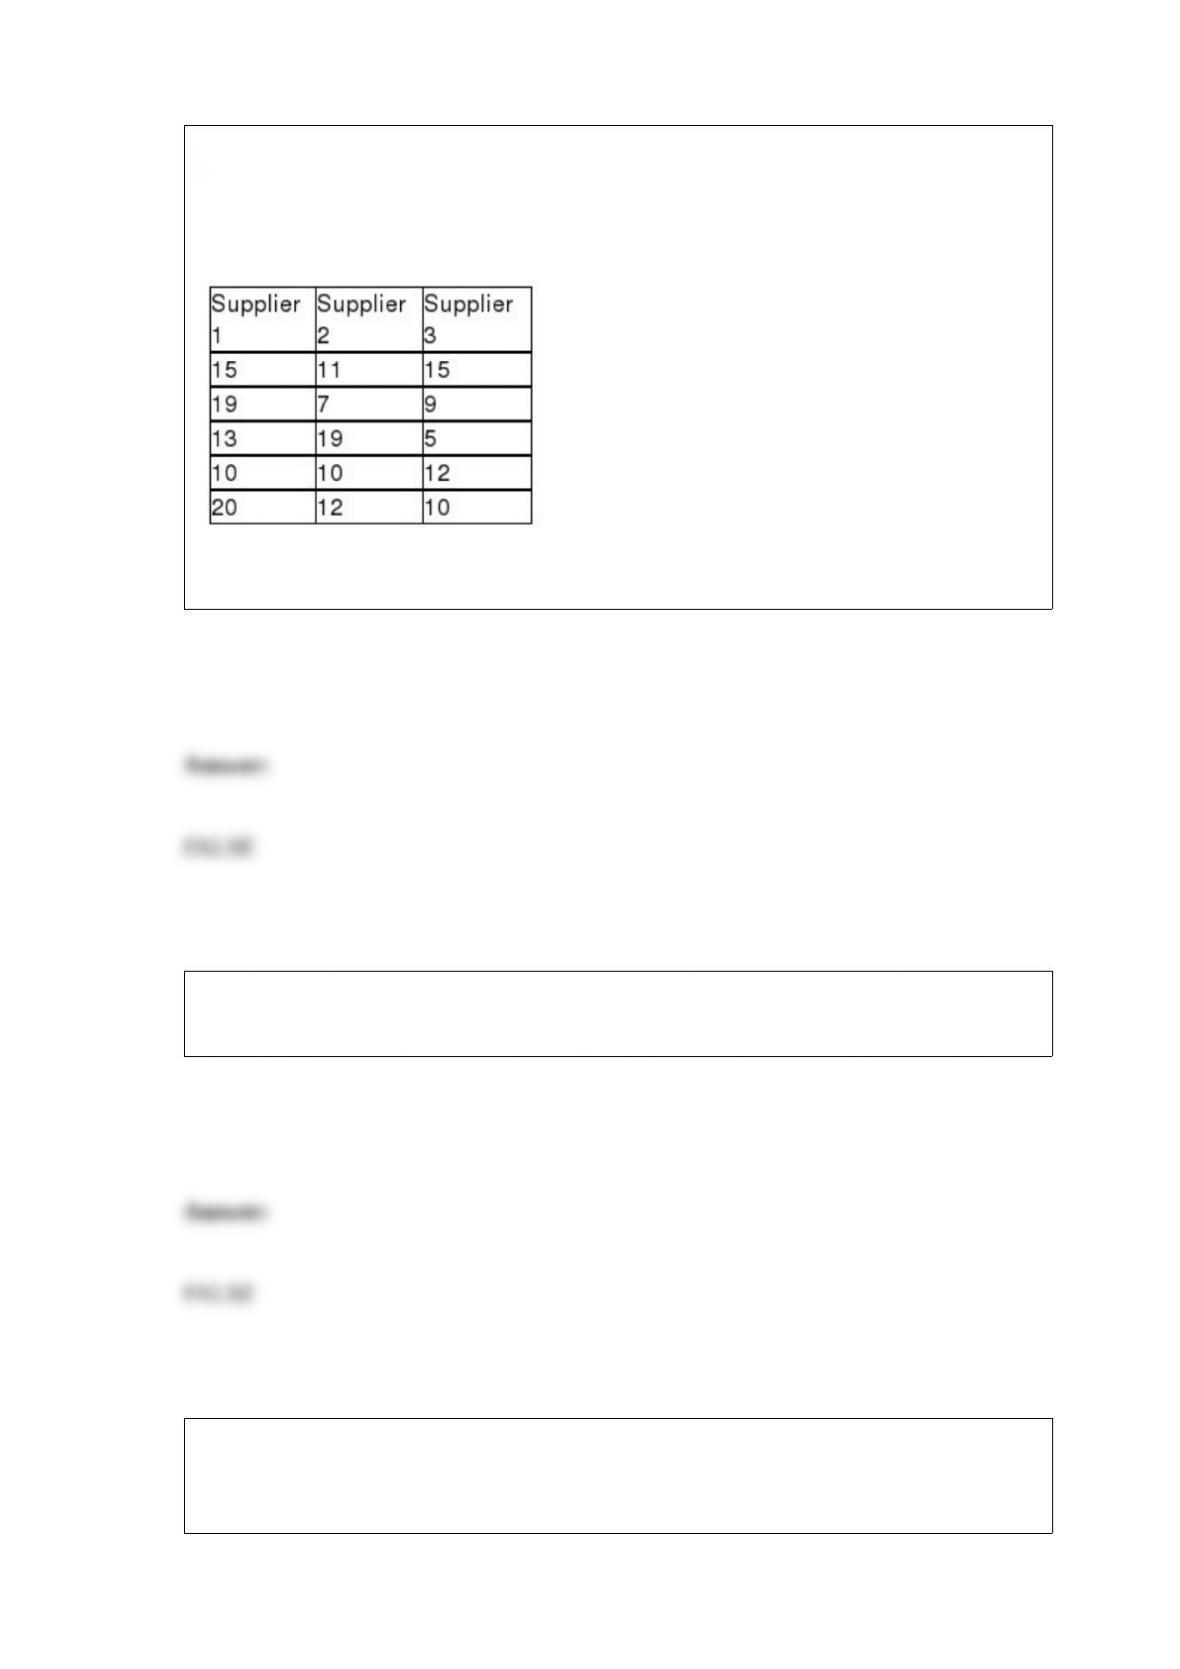
A recent study was conducted to determine if any of three suppliers of electronic
components has a different median delivery time on special orders. To test this, five
orders were given to each supplier and the delivery days were recorded. These data are
shown as follows:
If a Kruskal-Wallis test is to be performed, the sum of the rankings for Supplier 1 is 45.
We expect virtually all the data in a stable process to fall within 2 standard deviations of
the mean.
One of the difficulties in using the relative frequency of occurrence method for
assessing probabilities in business situations is getting a large enough set of examples
that match the one in question.

The multiple coefficient of determination measures the percentage of variation in the
dependent variable that is explained by the independent variables in the model.
If the mean value of a variable is 200 and the median is 150, the third quartile must be
at least 200.
In a recent report to the supply-chain manager in a major electronics company, the
report writer stated that with 90 percent confidence, the manufacturing lead time for a
critical part is between 3.34 hours and 4.14 hours. Based on this, the sample mean that
generated the confidence interval was 3.60.

When a small sample is used, a stratified random sample is more likely to provide the
desired information than a simple random sample.
A decision maker is considering including two additional variables into a regression
model that has as the dependent variable, Total Sales. The first additional variable is the
region of the country (North, South, East, or West) in which the company is located.
The second variable is the type of business (Manufacturing, Financial, Information
Services, or Other). Given this, how many additional variables will be incorporated into
the model?
A) 2
B) 6
C) 8
D) 9
For a chi-square test involving a contingency table, suppose H0 is rejected. We
conclude that the two variables are:
A) curvilinear.
B) linear.

C) related.
D) not related.
The human resources department at a major high tech company plans to conduct an
employee satisfaction study by sampling 100 employees from the 3,000 total
employees. They plan to use systematic random sampling since the employee file is in
alphabetic order. The first employee selected in the study should be:
A) the 30th employee.
B) employee 1 to 30 randomly selected.
C) employee 1 to 100 randomly selected.
D) the first employee.
In an effort to estimate the mean dollars spent per visit by customers of a food store, the
manager has selected a random sample of 100 cash register receipts. The mean of these
was $45.67 with a sample standard deviation equal to $12.30. Assuming that he wants
to develop a 90 percent confidence interval estimate, the upper limit of the confidence
interval estimate is:
A) about $2.02
B) approximately $65.90
C) about $47.69
D) None of the above
Both p-charts and c-charts are designed for use when the data we are working with are
referred to as attribute data.
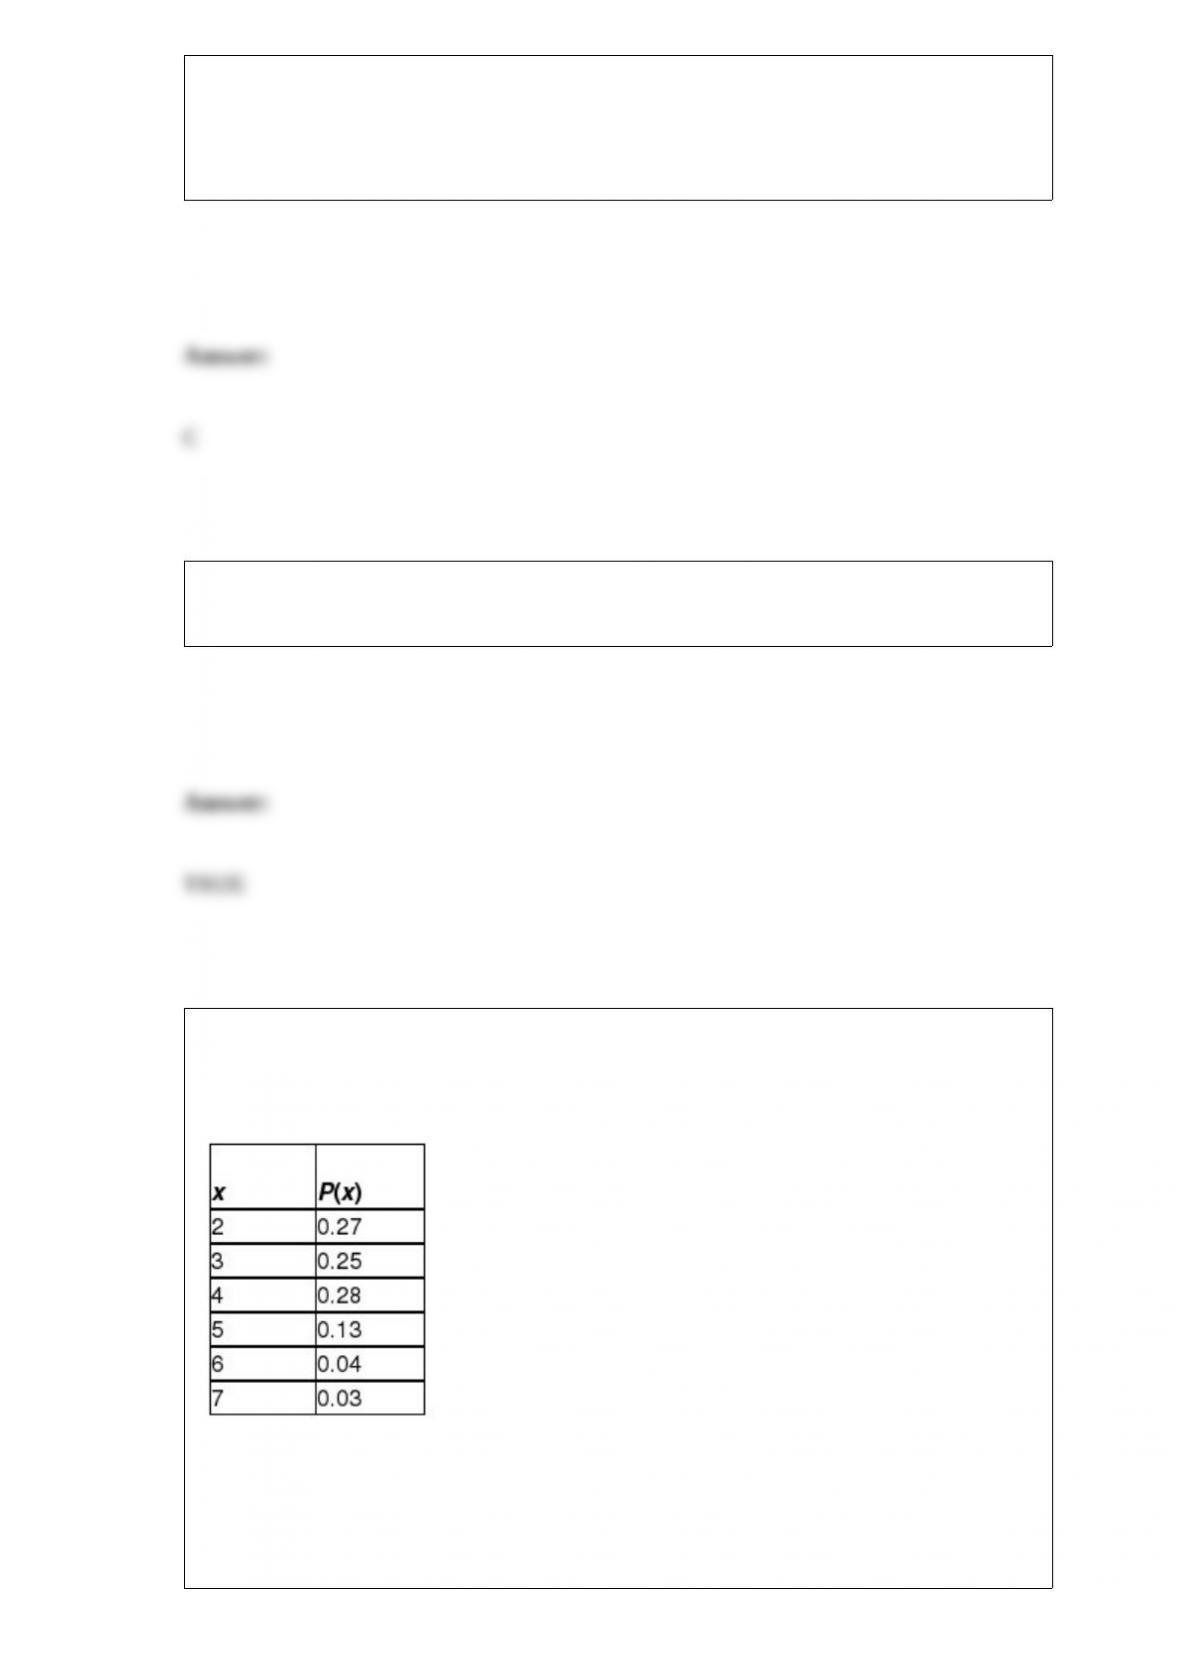
The U.S. Census Bureau (Annual Social & Economic Supplement) collects
demographics concerning the number of people in families per household. Assume the
distribution of the number of people per household is shown in the following table:
Calculate the expected number of people in families per household in the United States.
A) 2.71

B) 3.33
C) 3.51
D) 4.33
Recently, a major tire manufacturer stated in its advertising that its tires with a new tire
tread design will last more than 50,000 miles on average. A consumer agency collected
a subset of these tires and tested them in very controlled conditions. Based on this test,
the agency concluded that the manufacturer was justified in making this claim. The
process described is an example of:
A) descriptive statistics.
B) hypothesis testing.
C) statistical inference.
D) Both B and C are correct.
Respond to the following questions using this partially completed one-way ANOVA
table:

How many different populations are being considered in this analysis?
A) 5
B) 8
C) 7
D) 6
According to CNN business partner Careerbuilder.com, the average starting salary for
accounting graduates in 2008 was at least $47,413. Suppose that the American Society
for Certified Public Accountants planned to test this claim by randomly sampling 200
accountants who graduated in 2008.
State the appropriate null and alternative hypotheses.
A) H0: μ ≥ $47,413 HA : μ < $47,413
B) H0: μ < $47,413 HA : μ ≥ $47,413
C) H0: μ ≤ $47,413 HA : μ > $47,413
D) H0: μ > $47,413 HA : μ ≤ $47,413

A normally distributed population has a mean of 500 and a standard deviation of 60.
Determine the probability that a random sample of size 16 selected from this population
will have a sample mean less than 475.
A) 0.3251
B) 0.7124
C) 0.0475
D) 0.0712
For the normal distribution with parameters μ = 4, σ = 3; calculate P(x > 1).
A) 0.8413
B) 0.4562
C) 0.7812
D) 0.4152

For a standardized normal distribution, determine a value, say z0, so that P(z ≤ z0) =
0.01.
A) -2.33
B) -1.96
C) 2.33
D) 1.96
When the Mann-Whitney U test is performed, which of the following is true?
A) We assume that the populations are normally distributed.
B) We are interested in testing whether the medians from two populations are equal.
C) The data are nominal level.
D) The samples are independent.
Which of the following statements is correct?
A) A process can be in statistical control, yet it can be producing defects in abundance.
B) At least three points outside the upper or lower control limits on a control chart are
required before the process is deemed to be out of control.

C) If a process is out of control, then the variation that is present is limited to common
cause variation.
D) When special cause variation is present, the process can be expected to be in control.
The U.S. Post Office is interested in estimating the mean weight of packages shipped
using the overnight service. They plan to sample 300 packages. A pilot sample taken
last year showed that the standard deviation in weight was about 0.15 pound. If they are
interested in an estimate that has 95 percent confidence, what margin of error can they
expect?
A) Approximately 0.017 pound
B) About 0.0003 pound
C) About 1.96
D) Can’t be determined without knowing the population mean.
The branch manager for United Savings and Loan in Seaside, Virginia, has worked with
her employees in an effort to reduce the waiting time for customers at the bank.
Recently, she and the team concluded that average waiting time is now down to 3.5
minutes with a standard deviation equal to 1.0 minute. However, before making a
statement at a managers’ meeting, this branch manager wanted to double-check that the
process was working as thought. To make this check, she randomly sampled 25
customers and recorded the time they had to wait. She discovered that mean wait time

for this sample of customers was 4.2 minutes. Based on the team’s claims about waiting
time, what is the probability that a sample mean for n = 25 people would be as large or
larger than 4.2 minutes?
A) 0.0214
B) 0.0512
C) 0.0231
D) 0.0011
The time between calls to an emergency 911-call center is exponentially distributed
with a mean time between calls of 645 seconds. Based on this information, what is the
probability that the time between the next two calls is between 200 and 400 seconds?
A) Approximately 0.47
B) About 0.199
C) About 0.747
D) About 0.801
Examine the following two-factor analysis of variance table:

Determine if interaction exists between factor A and factor B. Use alpha = 0.05.
A) Fail to reject H0. Conclude that there is not sufficient evidence to indicate interaction
exists between Factor A and Factor B
B) Reject H0. Conclude that there is sufficient evidence to indicate interaction exists
between Factor A and Factor B
C) Fail to reject H0. Conclude that there is sufficient evidence to indicate interaction
exists between Factor A and Factor B
D) Reject H0. Conclude that there is not sufficient evidence to indicate interaction exists
between Factor A and Factor B
In testing a hypothesis that two categorical variables are independent using the x2 test,
the expected cell frequencies are based on assuming:
A) the null hypothesis.
B) the alternative hypothesis.
C) the normal distribution.
D) the variable are related.
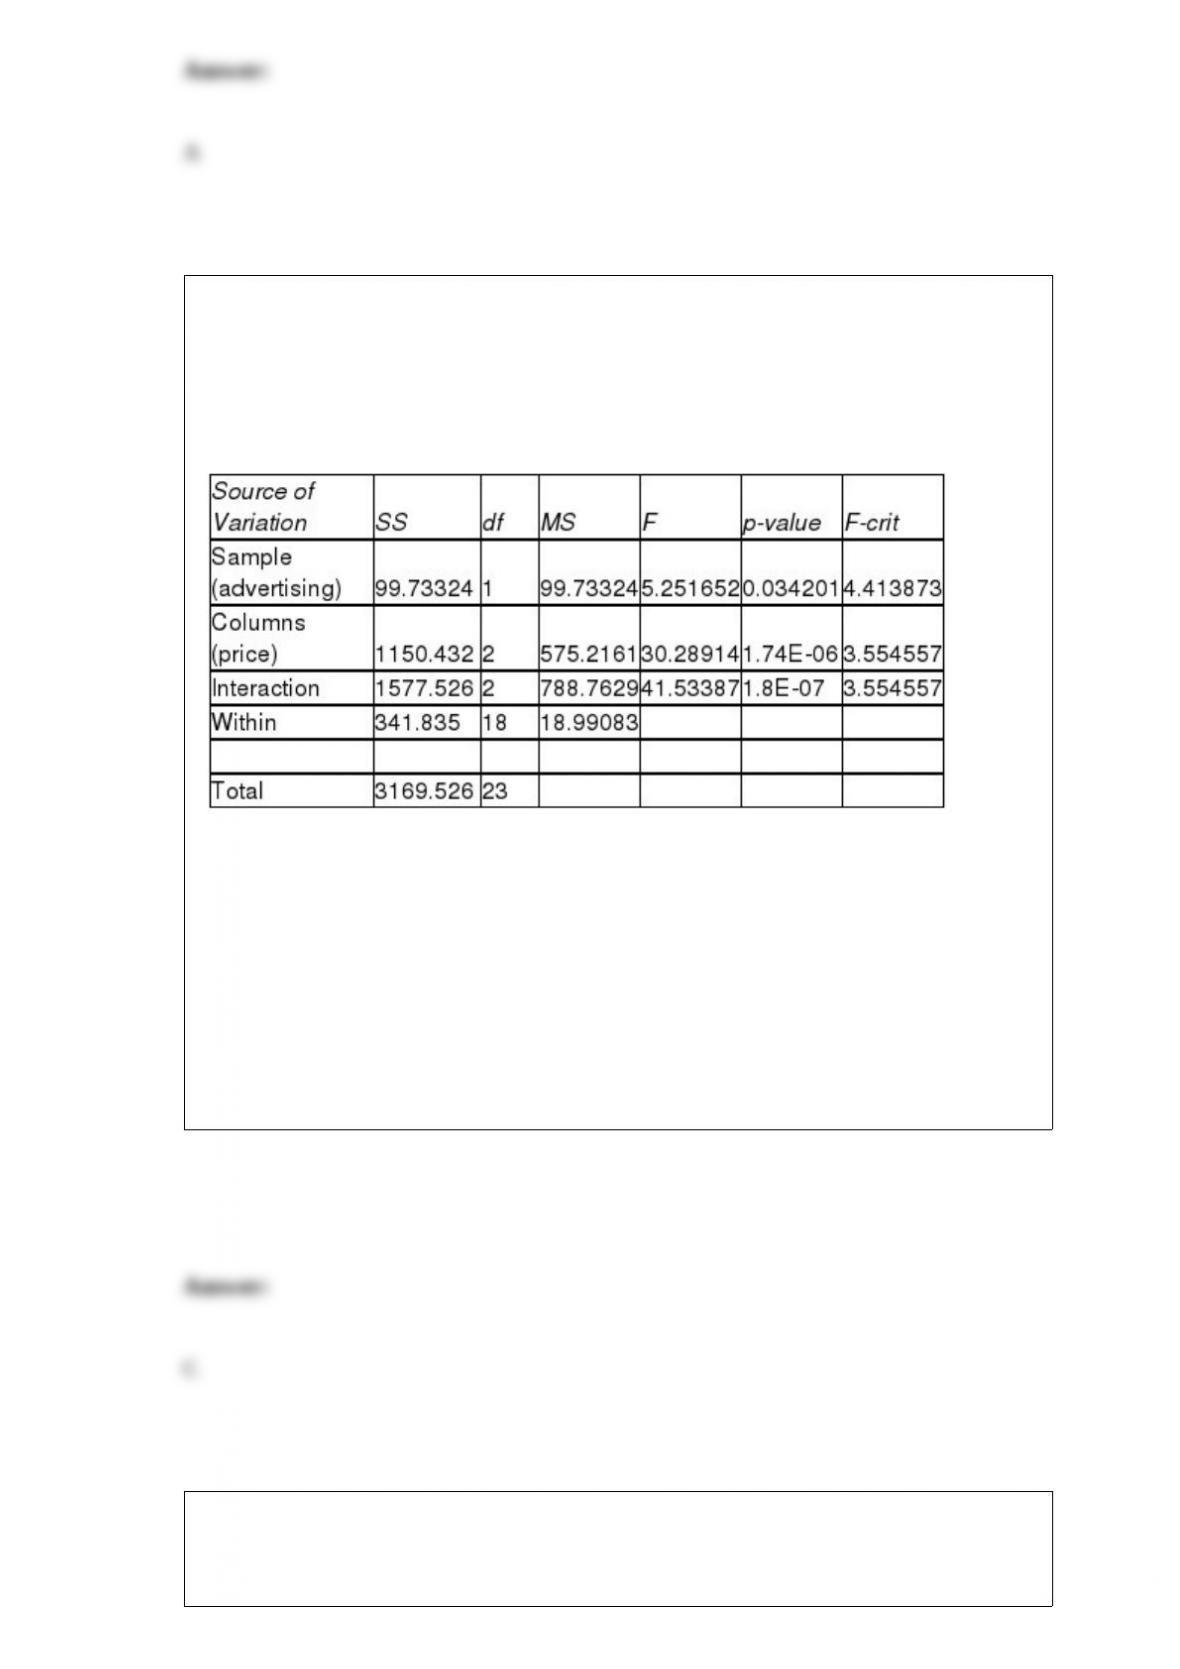
A two-factor analysis of variance is conducted to test the effect the price and advertising
have on sales of a particular brand of bottled water. Each week a combination of
particular levels of price and advertising are used and the sales level is recorded. The
computer results are shown below.
ANOVA
Based on the results above, which of the following is correct?
A) 1 level of advertising and 2 levels of price were used.
B) 3 levels of adverting and 2 levels of price were used.
C) 2 levels of advertising and 3 levels of price were used.
D) There were a total of 6 different treatments.
Which of the following statements is true?
A) If the confidence interval estimate for the regression slope coefficient, based on the

sample information, crosses over zero, the true population regression slope coefficient
could be zero.
B) R-square will tend to be smaller than the adjusted R-squared values when
insignificant independent variables are included in the model.
C) The y-intercept will usually be negative in a multiple regression model when the
regression slope coefficients are predominately positive.
D) None of the above
If a decision maker wishes to develop a regression model in which the University Class
Standing is a categorical variable with 5 possible levels of response, then he will need
to include how many dummy variables?
A) 5
B) 4
C) 1
D) 3
When a hypothesis test is to be conducted regarding a population variance, the test
statistic will be:
A) a t-value from the t-distribution.
B) an x2 value from the chi-square distribution.
C) a z-value from the standard normal distribution.
D) a binomial distribution p value.
It is possible to conduct a statistical test for autocorrelation using the Durbin-Watson
test and not be able to make a definitive conclusion about whether there is
autocorrelation or not based on the data.
Six food critics each visited and rated four different restaurants. Each critic visited each
restaurant on three separate occasions and recorded a score for each visit. The correct
method for analyzing this data is two-factor ANOVA.
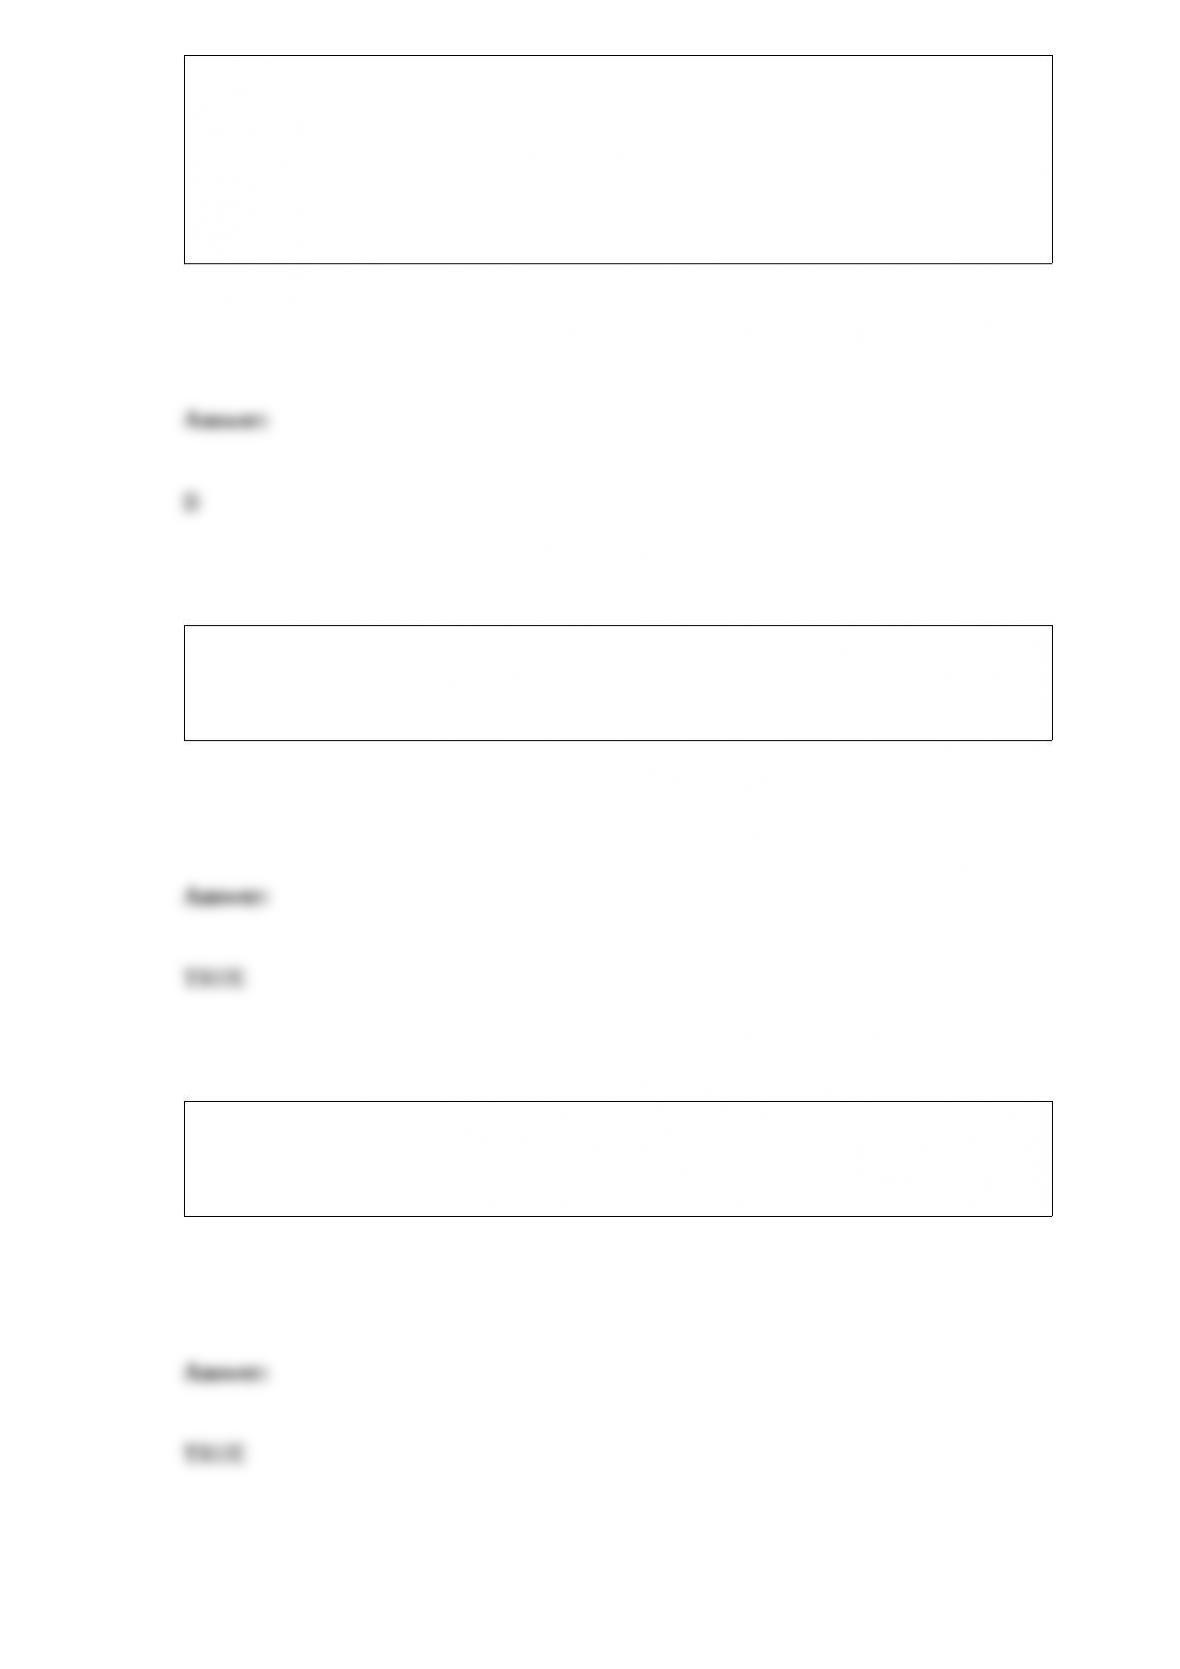
Based on weather data collected in Racine, Wisconsin, on Christmas Day, the weather
had the following distribution:
Based on the data, what is the probability that next Christmas will be rainy or cloudy
and dry?
A) 0.45
B) 0.50
C) 0.60
D) 0.70
In a chi-square contingency analysis, when expected cell frequencies drop below 5, the
calculated chi-square value tends to be inflated and may inflate the true probability of
________ beyond the stated significance level.
A) committing a Type I error
B) committing a Type II error
C) Both A and B
D) All of the above

When testing a two-tailed hypothesis using a significance level of 0.05, a sample size of
n = 16, and with the population standard deviation unknown, which of the following is
true?
A) The null hypothesis can be rejected if the sample mean gets too large or too small
compared with the hypothesized mean.
B) The alpha probability must be split in half and a rejection region must be formed on
both sides of the sampling distribution.
C) The test statistic will be a t-value.
D) All of the above are true.
A mail-order business prides itself in its ability to fill customers’ orders in six calendar
days or less on the average. Periodically, the operations manager selects a random
sample of customer orders and determines the number of days required to fill the
orders. Based on this sample information, he decides if the desired standard is not being
met. He will assume that the average number of days to fill customers’ orders is six or
less unless the data suggest strongly otherwise. Establish the appropriate null and
alternative hypotheses.
A) H0: μ ≥ 6 days Ha: μ < 6 days
B) H0: μ ≤ 6 days Ha : μ > 6 days
C) H0: μ > 6 days Ha: μ ≤ 6 days
D) H0 : μ < 6 days Ha: μ ≥ 6 days

Compute the 90% confidence interval estimate for the population proportion, p, based
on a sample size of 100 when the sample proportion, is equal to 0.40.
A) 0.3880, 0.0412)
B) (0.3930, 0.4070)
C) (0.3194, 0.4806)
D) (0.3886, 0.4114)
To determine the aptness of the model, which of the following would most likely be
performed?
A) Check to see whether the residuals have a constant variance
B) Determine whether the residuals are normally distributed
C) Check to determine whether the regression model meets the assumption of linearity
D) All of the above

A random variable is normally distributed with a mean of 25 and a standard deviation of
5. If an observation is randomly selected from the distribution, what value will 15% of
the observations be below?
A) 19.8
B) 16.2
C) 18.7
D) 17.2
Previous research shows that 60 percent of adults who drink non-diet cola prefer
Coca-Cola to Pepsi. Recently, an independent research firm questioned a random
sample of 25 adult non-diet cola drinkers. That chance that 20 or more of these people
will prefer Coca-Cola is:
A) essentially zero.
B) 0.0199.
C) 0.0294.
D) None of the above
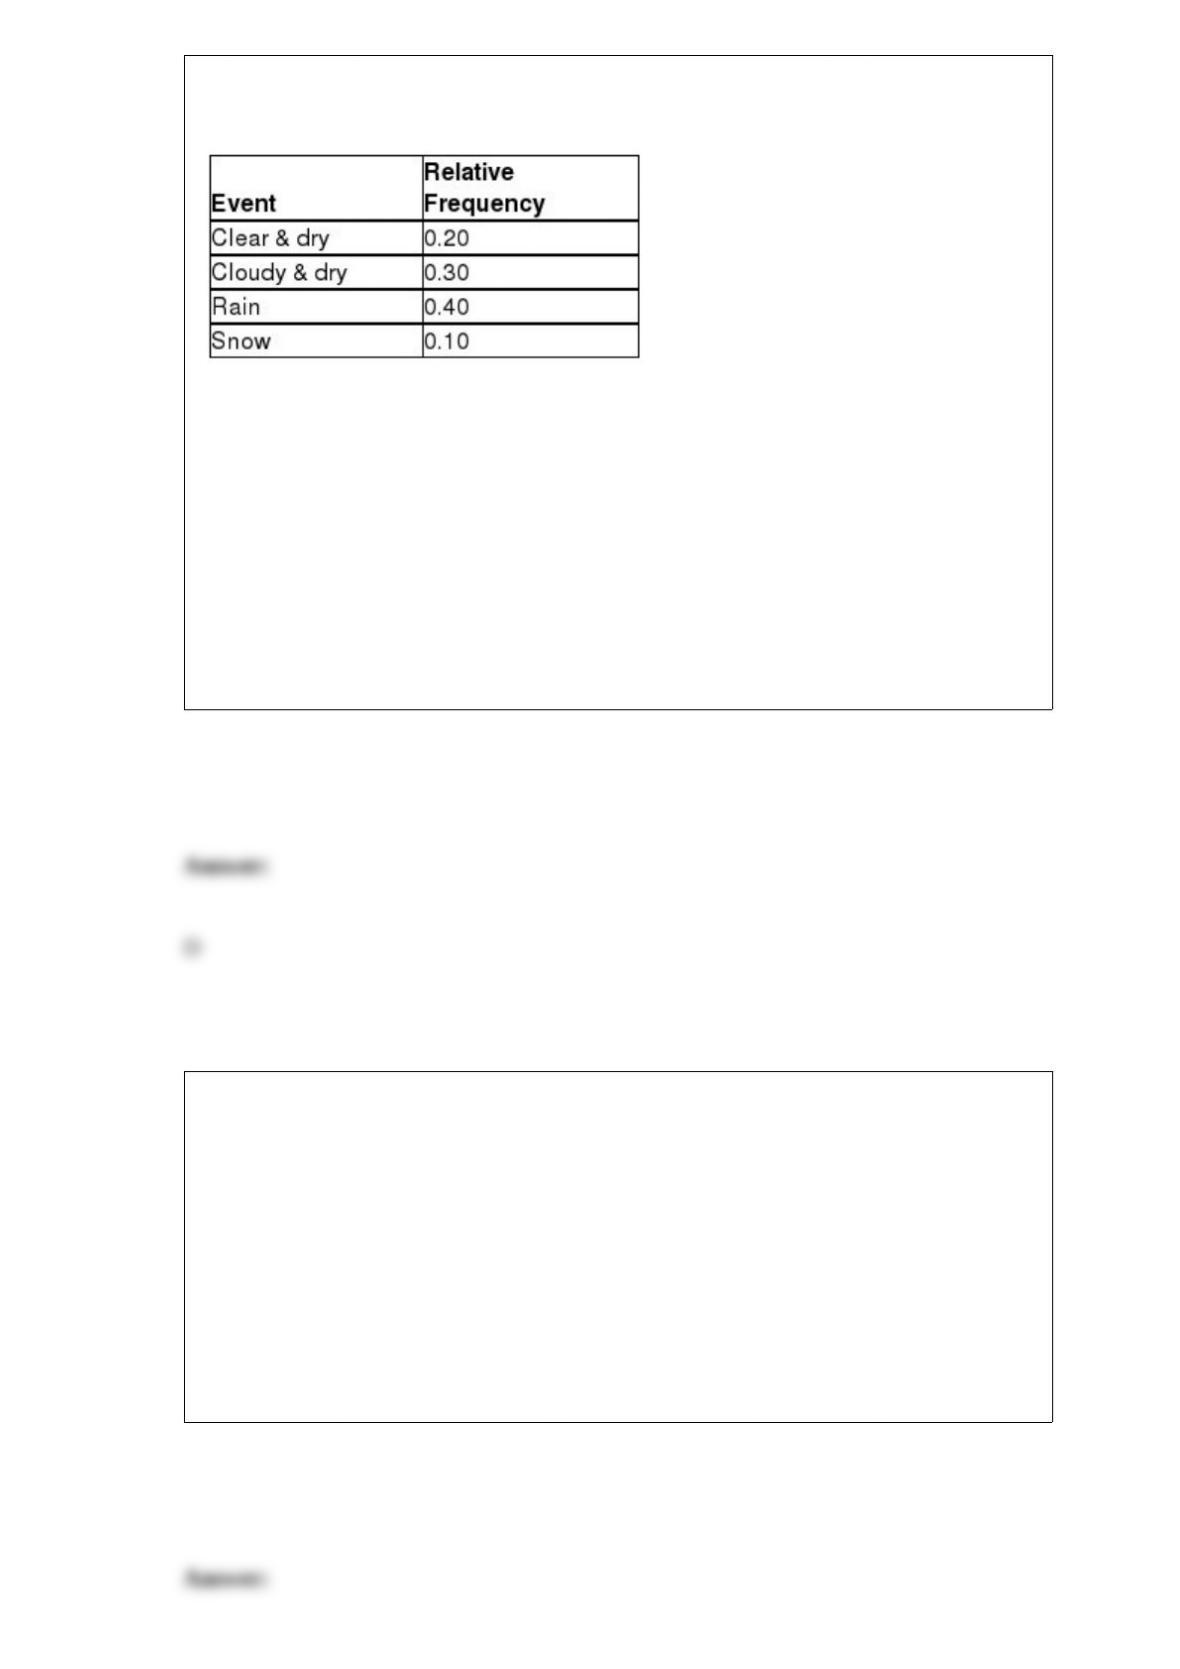
A sales rep for a national clothing company makes 4 calls per day. Based on historical
records, the following probability distribution describes the number of successful calls
each day:
Based on the information provided, what is the probability of having at least 2
successful calls in one day?
A) 0.60
B) 0.20
C) 0.30
D) 0.10
Assume you are conducting a one-way analysis of variance using a 0.05 level of
significance and have found that the p-value = 0.02. Which of the follow is correct
regarding what you can conclude?
A) Do not reject the null hypothesis; the means are all the same.
B) Reject the null hypothesis; the means are not all the same.
C) Do not reject the null hypothesis; the means are not all the same.
D) Reject the null hypothesis; the means are all the same.