
A personnel manager is concerned about absenteeism. She decides to sample employee
records to determine if absenteeism is distributed evenly throughout the six-day
workweek. The null hypothesis is: Absenteeism is distributed evenly throughout the
week. Use the 0.01 level of significance. The sample results are:
How many degrees of freedom are there?
A. 0
B. 3
C. 4
D. 5
If we reject the null hypothesis, what can we conclude subject to the probability, α?
A. Reject the null with a probability, α, of making a Type I error.
B. The alternative hypothesis is false.
C. The null hypothesis is true.
D. Both the null hypothesis and the alternative hypothesis are true.
It has been hypothesized that overall academic success for college freshmen as
measured by grade point average (GPA) is a function of IQ scores, X1, hours spent
studying each week, X2, and one’s high school average, X3. Suppose the regression
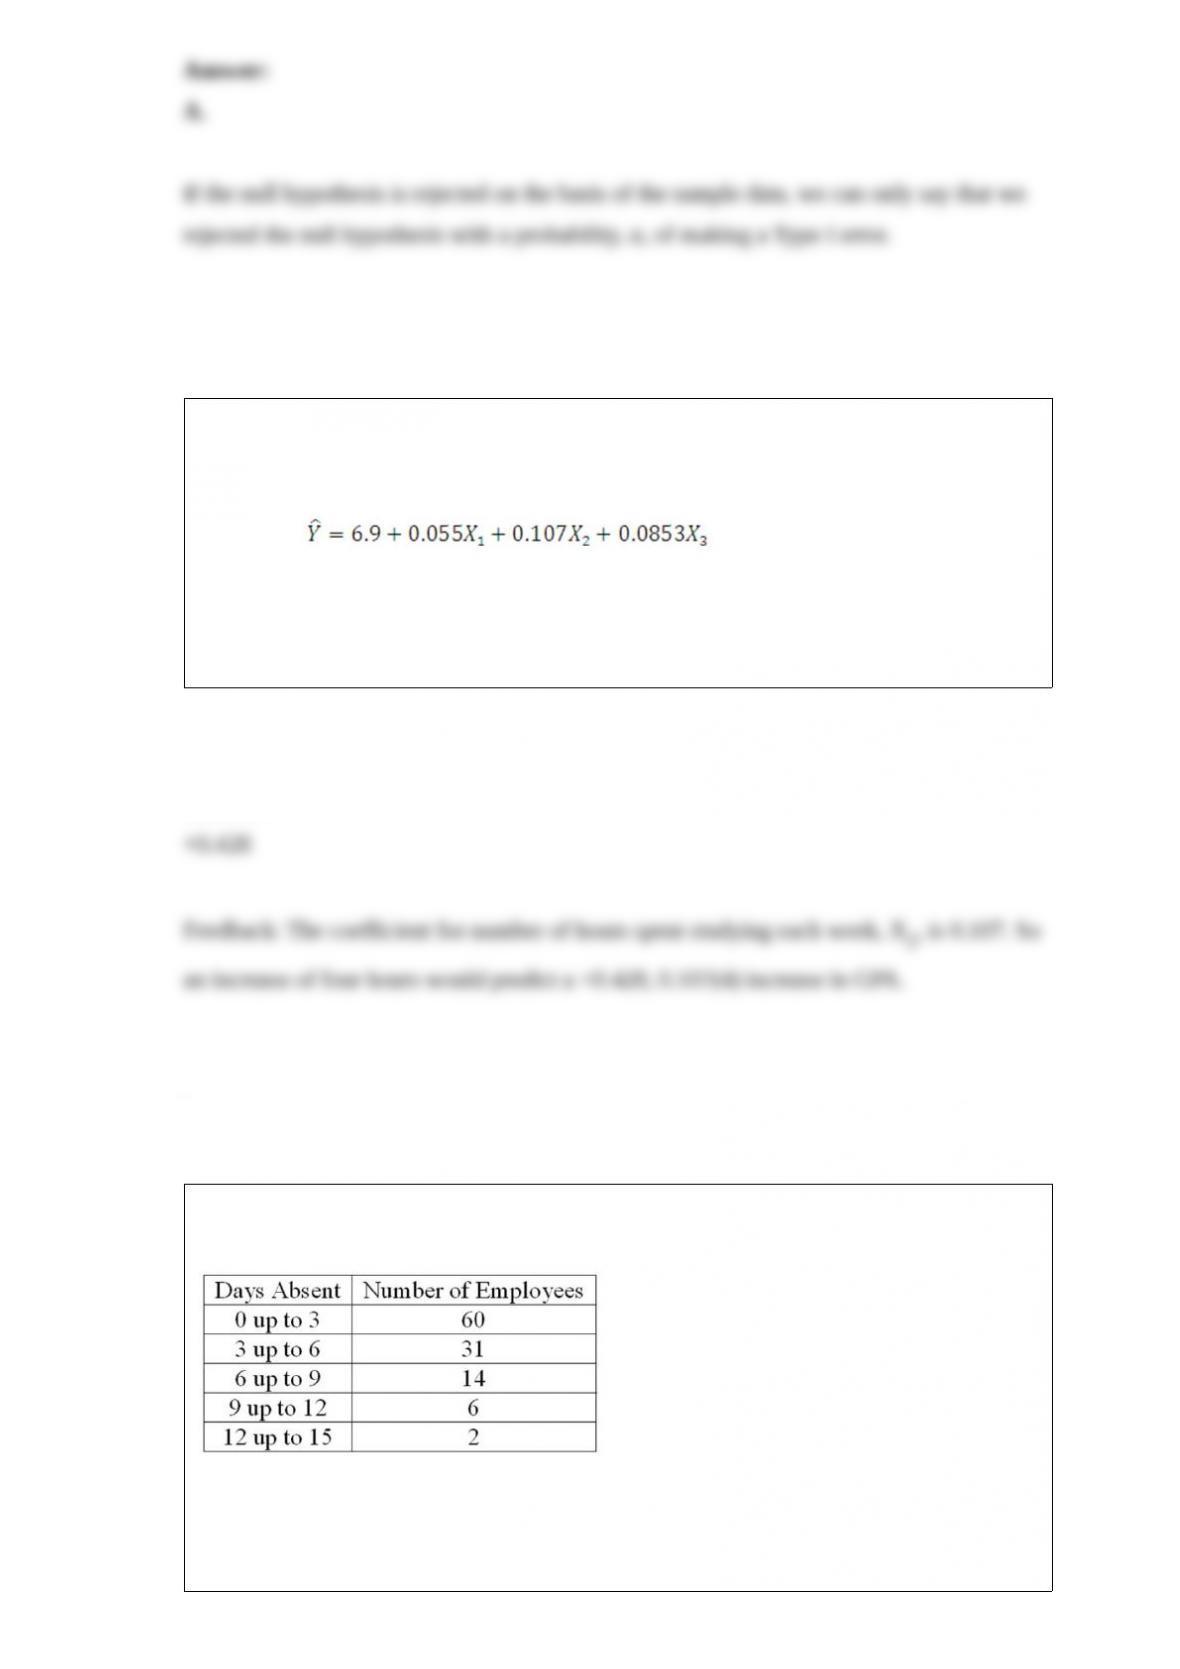
equation is . The multiple standard error is
6.313 and R2 = 0.826.
Assuming other independent variables are held constant, what is the effect on GPA if
the number of hours spent studying per week increases from 32 to 36?
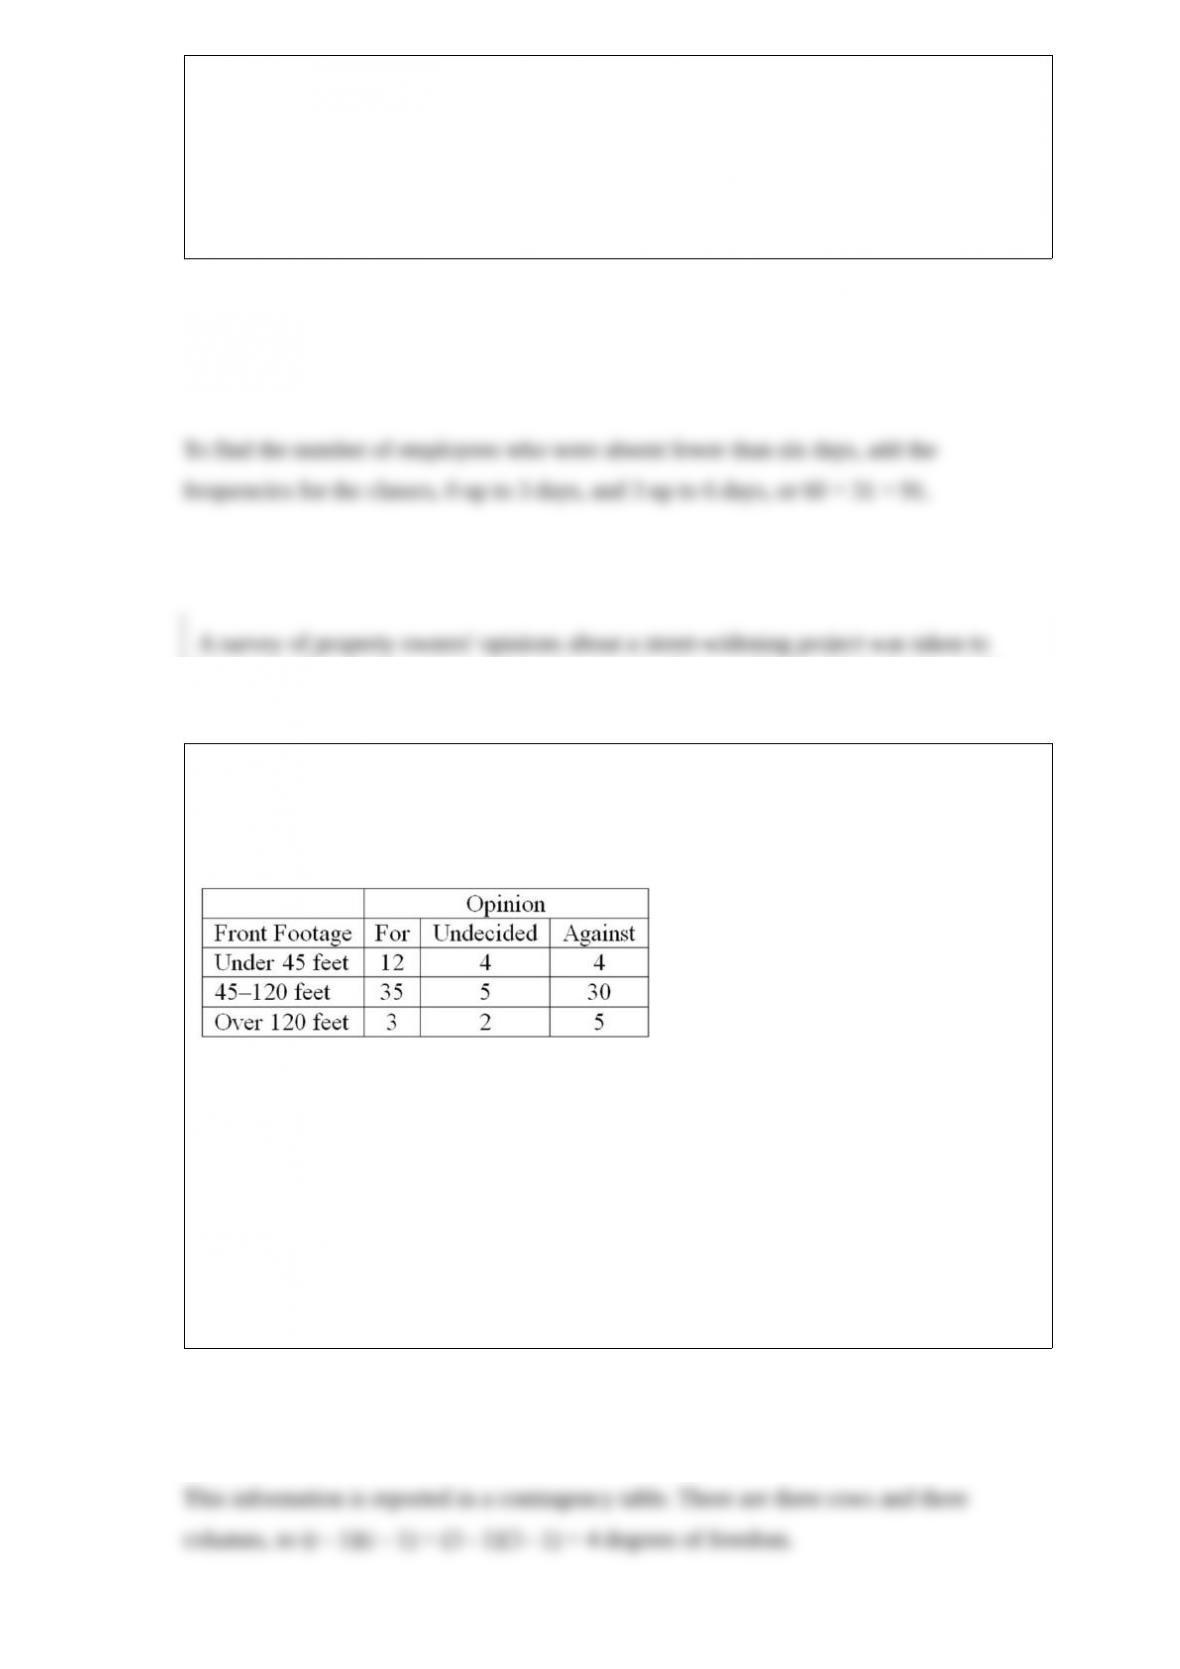
Refer to the following frequency distribution on days absent during a calendar year by
employees of a manufacturing company:
How many employees were absent fewer than six days?
A. 60
B. 31
C. 91
D. 46
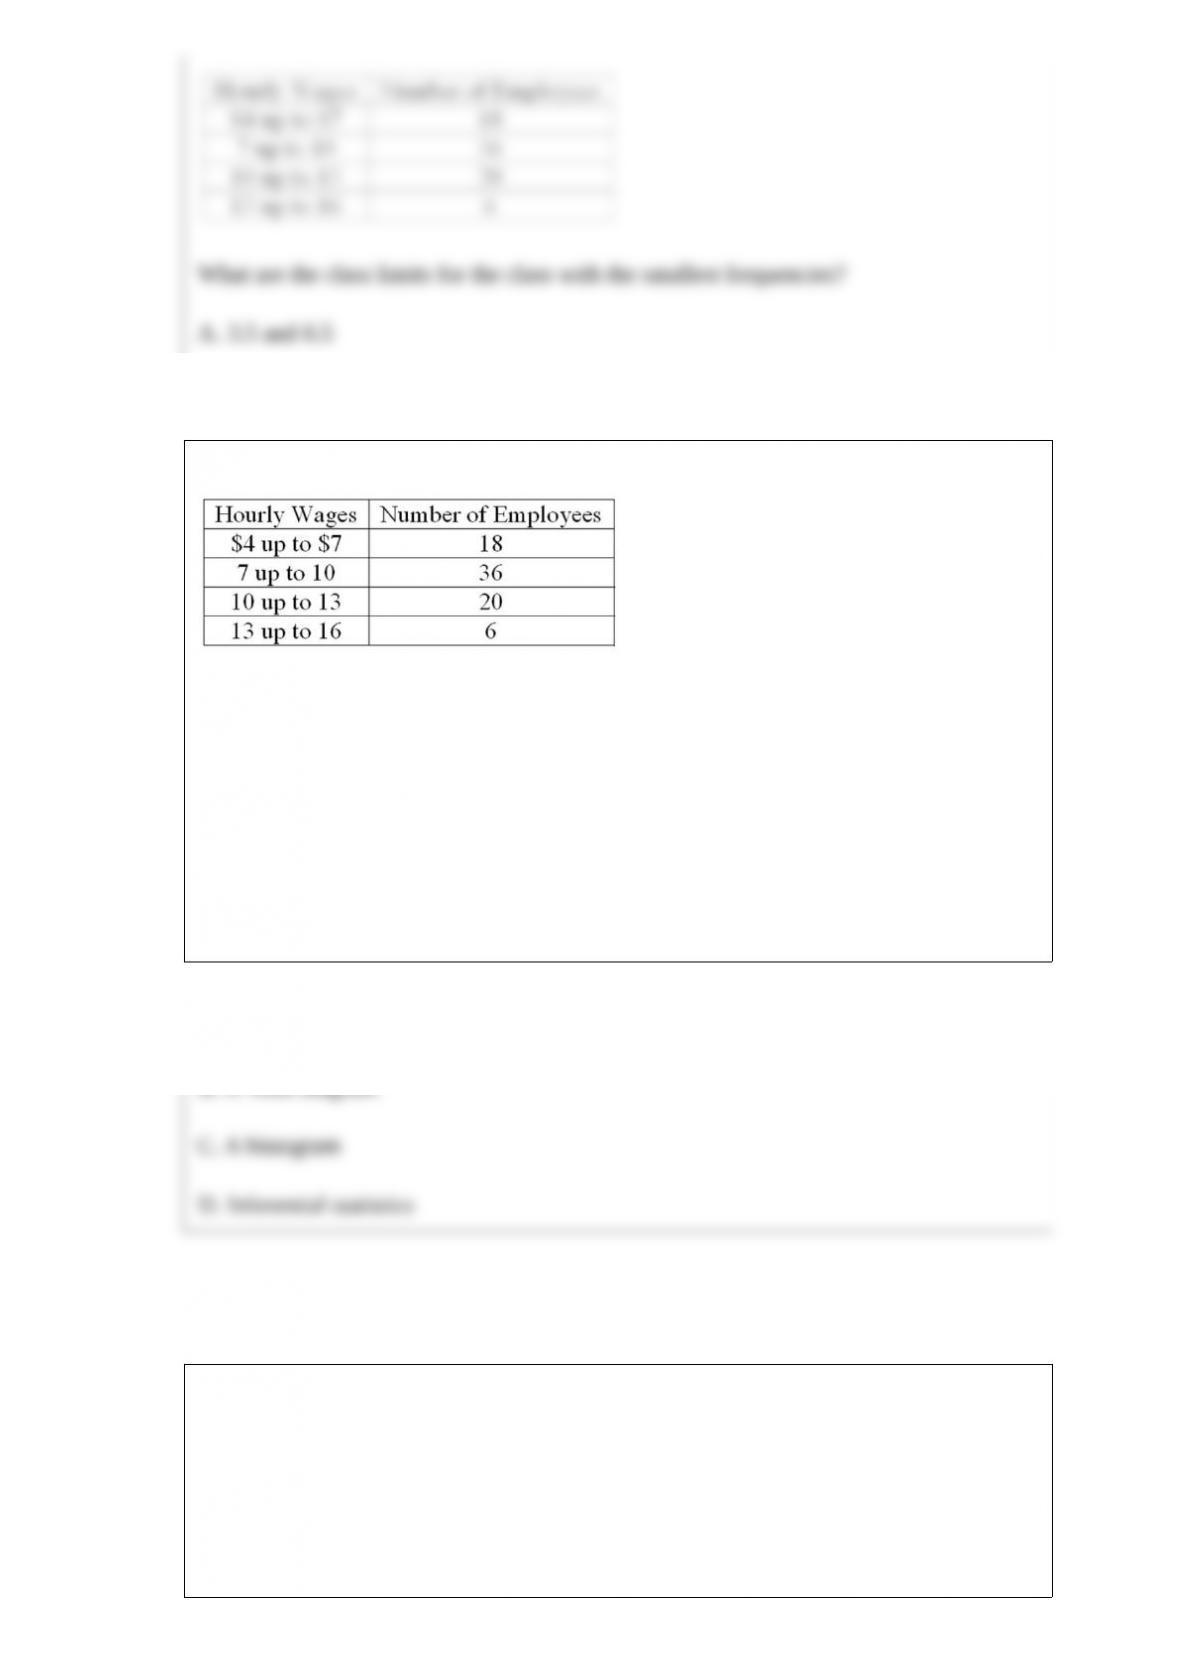
A survey of property owners’ opinions about a street-widening project was taken to
determine if owners’ opinions were related to the distance between their home and the
street. A randomly selected sample of 100 property owners was contacted and the
results are shown next.
How many degrees of freedom are there?
A. 2
B. 3
C. 4
D. 5

The mean of a normal probability distribution is 500 and the standard deviation is 10.
About 95% of the observations lie between what two values?
A. 475 and 525
B. 480 and 520
C. 400 and 600
D. 350 and 650
A large manufacturing firm tests job applicants. Test scores are normally distributed
with a mean of 500 and a standard deviation of 50. Management is considering placing
a new hire in an upper-level management position if the person scores in the upper sixth
percent of the distribution. What is the lowest score a new hire must earn to qualify for
a responsible position?
A. 50
B. 625
C. 460
D. 578

If there are four independent variables in a multiple regression equation, there are also
four ______.
A. Y-intercepts
B. Regression coefficients
C. Dependent variables
D. Constant terms
A company is studying the number of monthly absences among its 125 employees. The
following probability distribution shows the likelihood that people were absent 0, 1, 2,
3, 4, or 5 days last month.

Given the probability distribution, which of the following predictions is correct?
A. 60% of the employees will have more than one day absent per month.
B. There is a 0.04 probability that an employee will be absent one day per month.
C. There is a 0.12 probability that an employee will be absent two days per month.
D. There is a 0.50 probability that an employee will be absent 0.72 days per month.
Which of the following is a characteristic of the normal probability distribution?
A. It’s positively skewed.
B. It’s bell-shaped.
C. It’s asymmetrical.
D. It’s rectangular.

For the following distribution:
What is the variance of the distribution?
A. 2.1
B. 0.63
C. 3.9
D. 2.754
A university surveyed recent graduates of the English Department for their starting
salaries. Four hundred graduates returned the survey. The average salary was $25,000.
The population standard deviation was $2,500. What is the 95% confidence interval for
the mean salary of all graduates from the English Department?
A. [$22,500, $27,500]
B. [$24,755, $25,245]
C. [$24,988, $25,012]

D. [$24,600, $25,600]
A dot plot is best applied for a data set with __________.
A. 1,000 observations
B. 50 observations
C. More than one variable
D. One mode
A study of interior designers’ opinions with respect to the most desirable primary color
for executive offices showed that:

What is the probability that a designer does not prefer yellow?
A. 0.000
B. 0.765
C. 0.885
D. 1.000
Ball-Bearings, Inc. produces ball bearings automatically on a Kronar BBX machine.
For one of the ball bearings, the mean diameter is set at 20.00 mm (millimeters). The
standard deviation of the production over a long period of time was computed to be
0.150 mm. What percent of the ball bearings will have diameters of 20.27 mm or more?
A. 41.00%
B. 12.62%
C. 3.59%
D. 85.00%
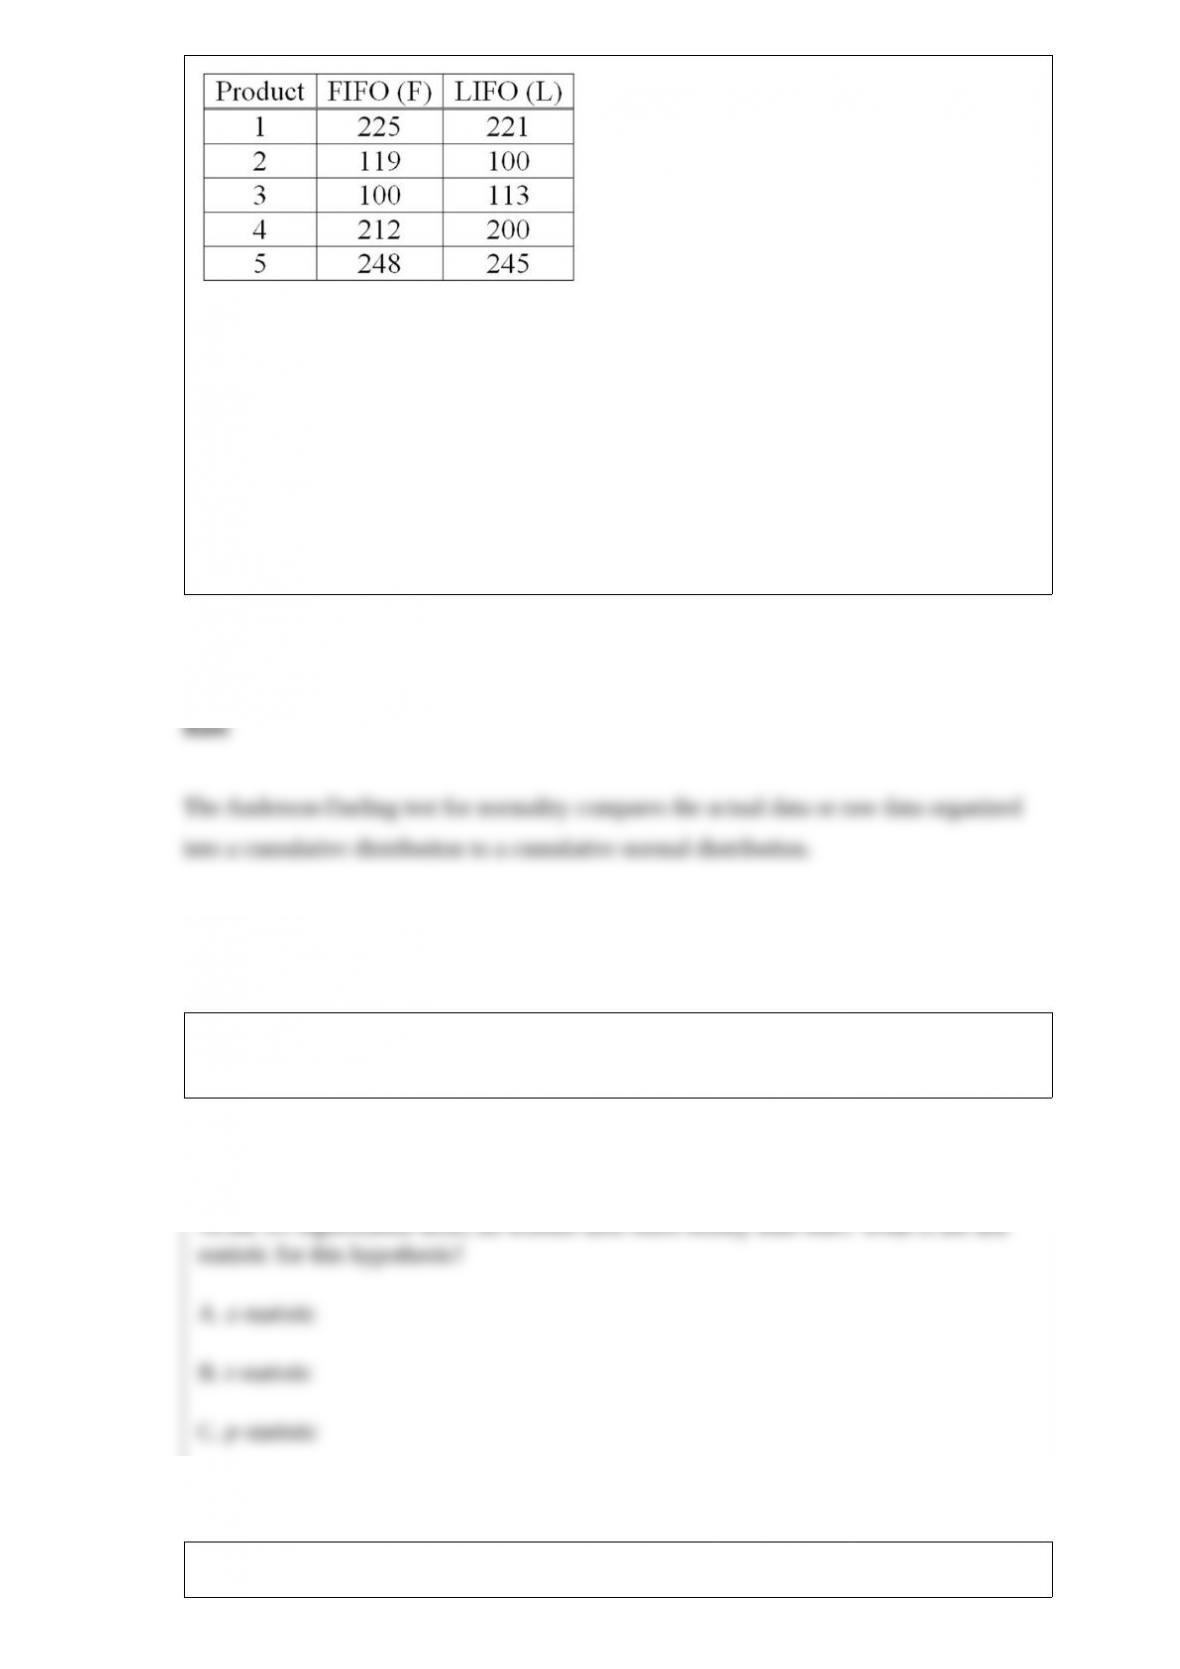
Refer to the following wage breakdown for a garment factory.
What are the class limits for the class with the smallest frequencies?
A. 3.5 and 6.5
B. 4 and up to 7
C. 13 and up to 16
D. 12.5 and 15.5
A graphical method used to calculate joint and conditional probabilities is __________.
A. A tree diagram
B. A Venn diagram
C. A histogram

D. Inferential statistics
In a scatter diagram, we describe the relationship between __________.
A. Two variables measured at the ordinal level
B. Two variables, one measured as an ordinal variable and the other as a ratio variable
C. Two variables measured at the interval or ratio level
D. A variable measure on the interval or ratio level and time
Accounting procedures allow a business to evaluate their inventory costs based on two
methods: LIFO (Last In First Out) or FIFO (First In First Out). A manufacturer
evaluated its finished goods inventory (in $000s) for five products with the LIFO and
FIFO methods. To analyze the difference, they computed (FIFO – LIFO) for each
product. Based on the following results, does the LIFO method result in a lower cost of
inventory than the FIFO method?
What are the degrees of freedom?
A. 4
B. 5
C. 15
D. 10
The Anderson-Darling test for normality compares a cumulative normal distribution to
a cumulative distribution of the ___________ data.
A recent study focused on the amount of money single men and women save monthly.
The information is summarized next. Assume that the population standard deviations
are equal.
At the .01 significance level, do women save more money than men? What is the test
statistic for this hypothesis?
A. z-statistic
B. t-statistic
C. p-statistic
D. df-statistic
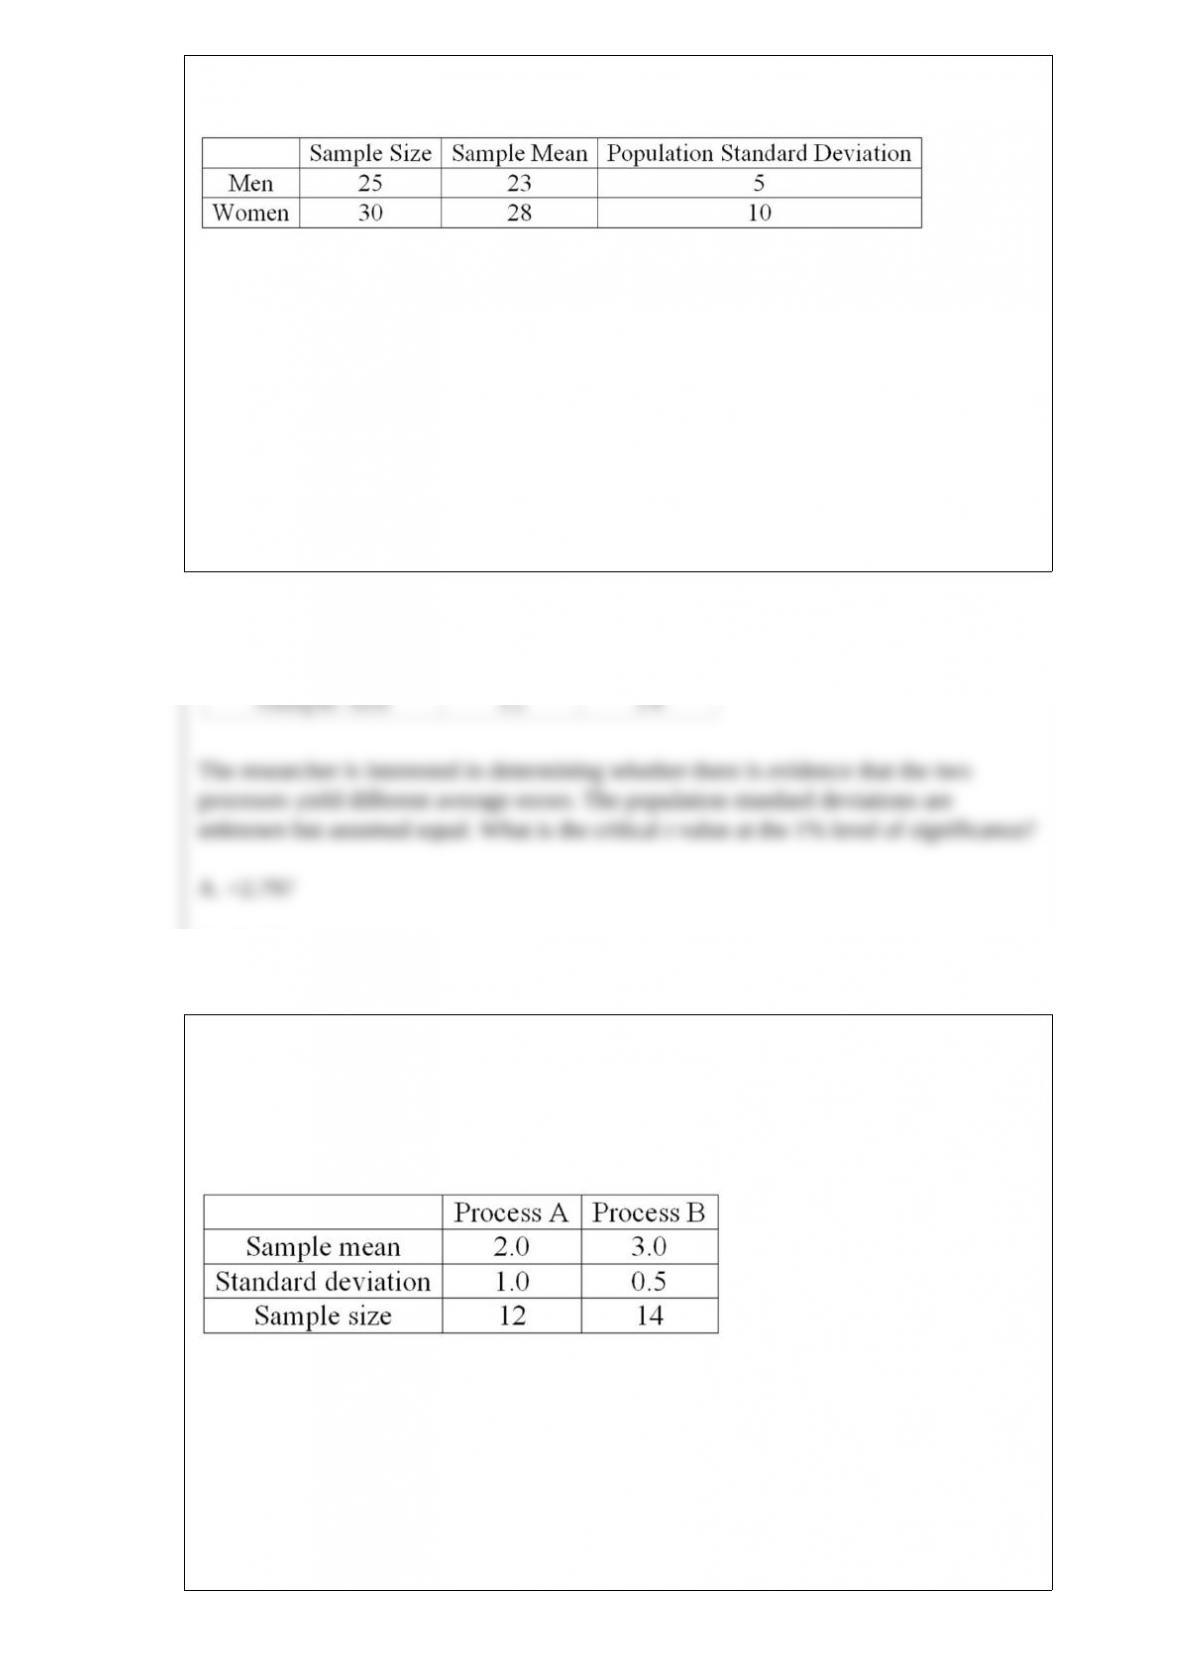
A national manufacturer of ball bearings is experimenting with two different processes
for producing precision ball bearings. It is important that the diameters be as close as
possible to an industry standard. The output from each process is sampled and the
average error from the industry standard is measured in millimeters. The results are
presented next.
The researcher is interested in determining whether there is evidence that the two
processes yield different average errors. The population standard deviations are
unknown but assumed equal. What is the critical t value at the 1% level of significance?
A. +2.797
B. -2.492

C. 1.711
D. 2.797
When testing the hypothesized equality of two population means, the implied null
hypothesis is ____________.
A. H0: 1 = 0
B. H0: 1 – 2 = 0
C. H0: 2 = 0
D. H0: 1 – 2 ≠ 0

A sample of single persons receiving Social Security payments revealed these monthly
benefits: $826, $699, $1,087, $880, $839, and $965. How many observations are below
the median?
A. 1
B. 2
C. 3
D. 3.5
A group of 100 students were surveyed about their interest in a new Economics major.
Interest was measured in terms of high, medium, or low. In the study, 30 students
responded high interest, 50 students responded medium interest, and 20 students
responded low interest. What is the best way to illustrate the relative frequency of
student interest?
A. Use a cumulative frequency polygon
B. Use a box plot
C. Use a pie chart
D. Use a frequency table
The interquartile range is graphically presented in a ___________.
A. Dot plot
B. Stem-and-leaf display
C. Box plot
D. Contingency table
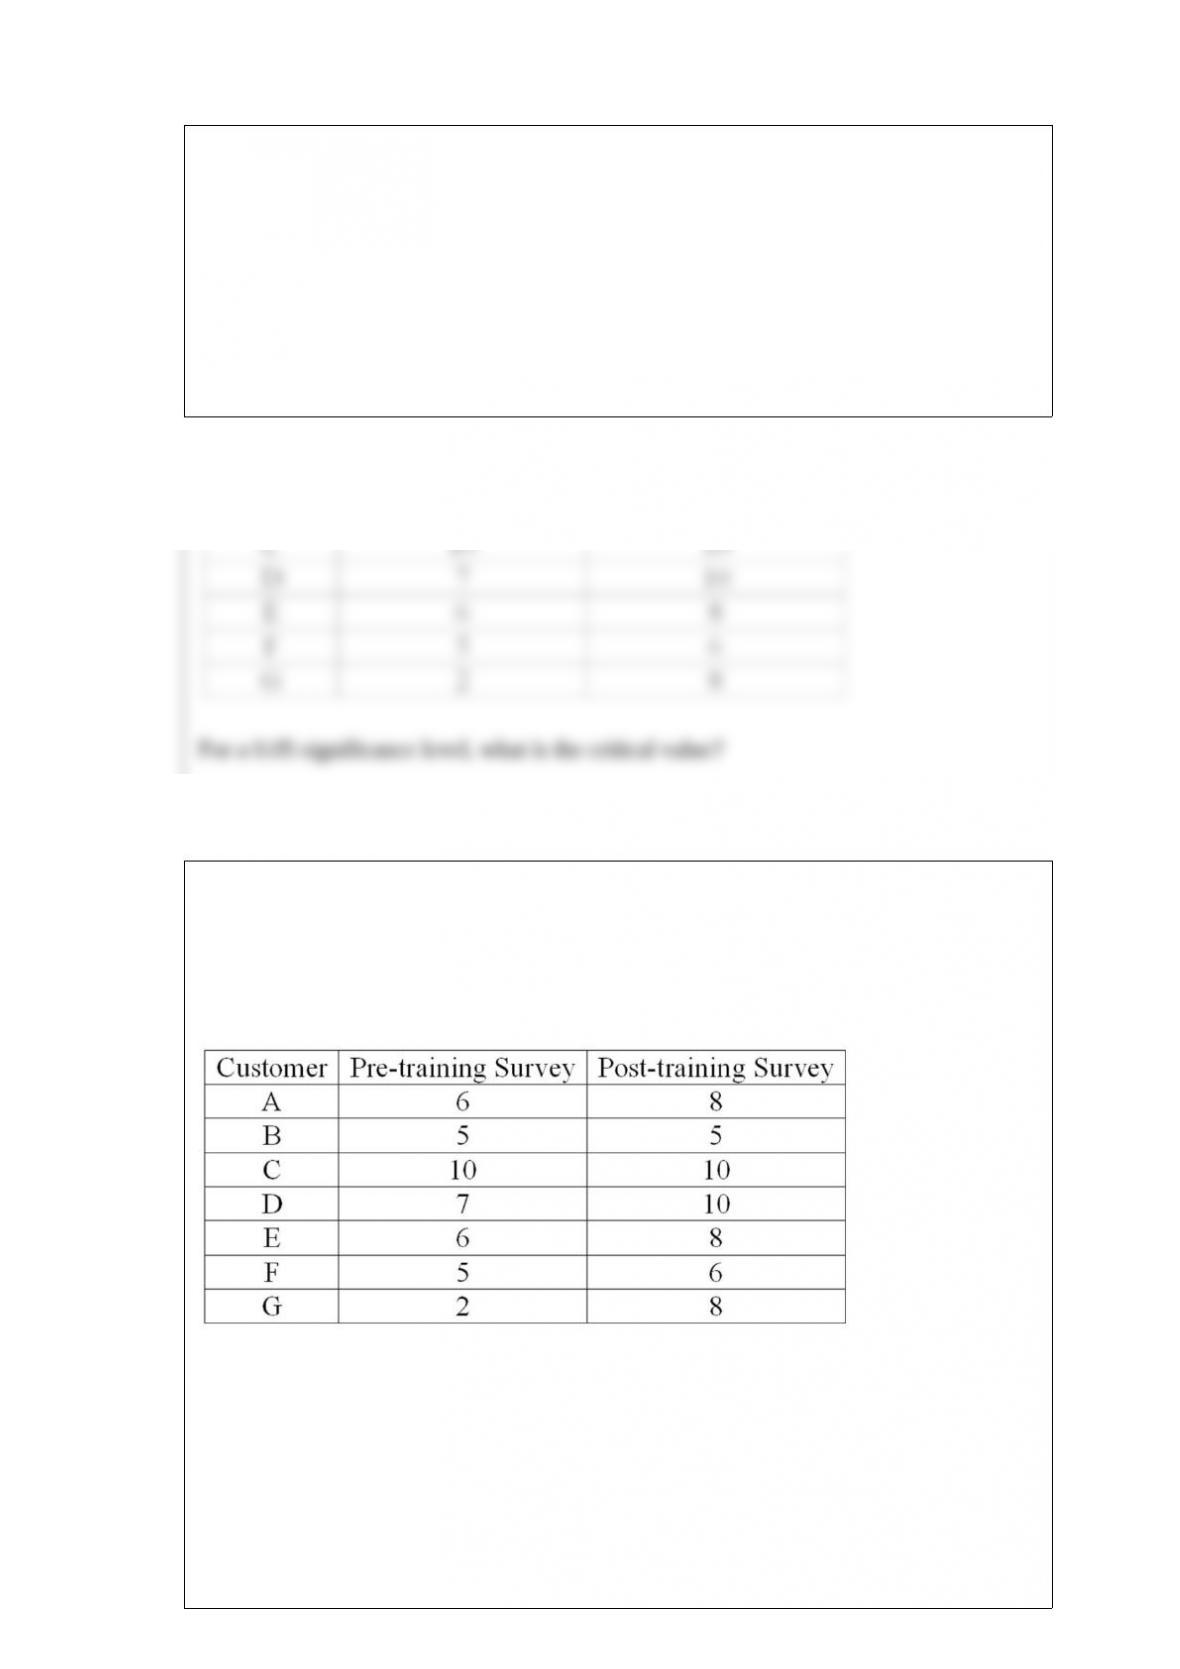
An investigation of the effectiveness of a training program to improve customer
relationships included a pre-training and post-training customer survey. To compare the
differences they computed (post-training survey score – pre-training survey score).
Seven customers were randomly selected and completed both surveys. The results
follow.
For a 0.05 significance level, what is the critical value?
A. 1.943
B. 1.895
C. 1.645

D. 2.447
A hypothesis regarding the weight of newborn infants at a community hospital is that
the mean is 6.6 pounds. A sample of seven infants is randomly selected and their
weights at birth are recorded as 9.0, 7.3, 6.0, 8.8, 6.8, 8.4, and 6.6 pounds. What are the
degrees of freedom?
A. 7
B. 8
C. 6
D. 6.6

A study by the National Park Service revealed that 50% of the vacationers going to the
Rocky Mountain region visit Yellowstone Park, 40% visit the Grand Tetons, and 35%
visit both. What is the probability that a vacationer will visit at least one of these
magnificent attractions?
A. 0.95
B. 0.35
C. 0.55
D. 0.05
A hypothesis test is conducted at the .05 level of significance to test whether or not the
population correlation is zero. If the sample consists of 25 observations and the
correlation coefficient is 0.60, what is the computed value of the test statistic? Round to
two decimal places.
A. 1.96
B. 2.07
C. 2.94
D. 3.60

A valid multiple regression analysis assumes or requires that _________________.
A. The dependent variable is measured using an ordinal, interval, or ratio scale
B. The residuals follow an F distribution
C. The independent variables and the dependent variable have a linear relationship
D. The observations are autocorrelated
As the degrees of freedom increase, the shape of a chi-square distribution approaches a
______________ distribution.
If a set of quantitative observations contains an extreme value, the most representative
measure of central location would be the __________.

The general form of the regression equation is ____________.
A data set has 200 observations. In the data, a qualitative variable’s highest value is
“extremely satisfied” and its lowest value is “extremely dissatisfied.” What is the
minimum class interval that you would recommend?

We want to estimate the population mean of waiting time in a doctor’s office within 20
minutes, with a 99% level of confidence. The population standard deviation is estimated
to be 15. How large a sample is required?
For a frequency distribution of quantitative data, if every individual, object, or
measurement can be assigned to a class, the frequency distribution is __________.
When the variance of the differences between the actual and the predicted values of the
dependent variable are approximately the same for all values of the independent
variable, the differences are said to exhibit ______________.

For the following data, are any of the observations an outlier?
In a Poisson distribution, each trial is ___________________.
If the null hypothesis states that there is no difference between the two population

means, then the test is ______________.
When the population standard deviation is known, a __________ statistic is used to
compute a confidence interval.
The principal difference between the interval and ratio scale of measurement is that the
ratio scale has a __________________.

A telemarketing firm is monitoring the performance of its employees based on the
number of sales per hour. One employee had the following sales for the last 19 hours.
What is the first quartile for the distribution of number of sales per hour?
The weight of a bag of corn chips is normally distributed with a mean of 22 ounces and
a standard deviation of 0.5 ounces. The probability that a bag of corn chips weighs
more than 23 ounces is ____.
A __________ clearly shows outliers.

When the population standard deviations are unknown, the purpose of pooling the
sample variances when testing the difference between two populations is to
___________.