
In multiple regression analysis, a dummy variable is ____________.
A. An additional quantitative variable
B. A nominal variable with three or more values
C. A nominal variable with only two values
D. A new regression coefficient
The mean annual income of certified welders is normally distributed with a mean of
$50,000 and a population standard deviation of $2,000. The ship building association
wishes to find out whether their welders earn more or less than $50,000 annually. The
alternate hypothesis is that the mean is not $50,000. If the level of significance is 0.10,
what is the decision rule?
A. Do not reject the null hypothesis if computed z lies between -1.645 and +1.645;
otherwise, reject it.
B. Do not reject the null hypothesis if computed z is greater than 1.645; otherwise,
reject it.
C. Do not reject the null hypothesis if computed z lies between -1.960 and +1.960;
otherwise, reject it.
D. Reject the null hypothesis if computed z is below -1.960; otherwise, reject it.
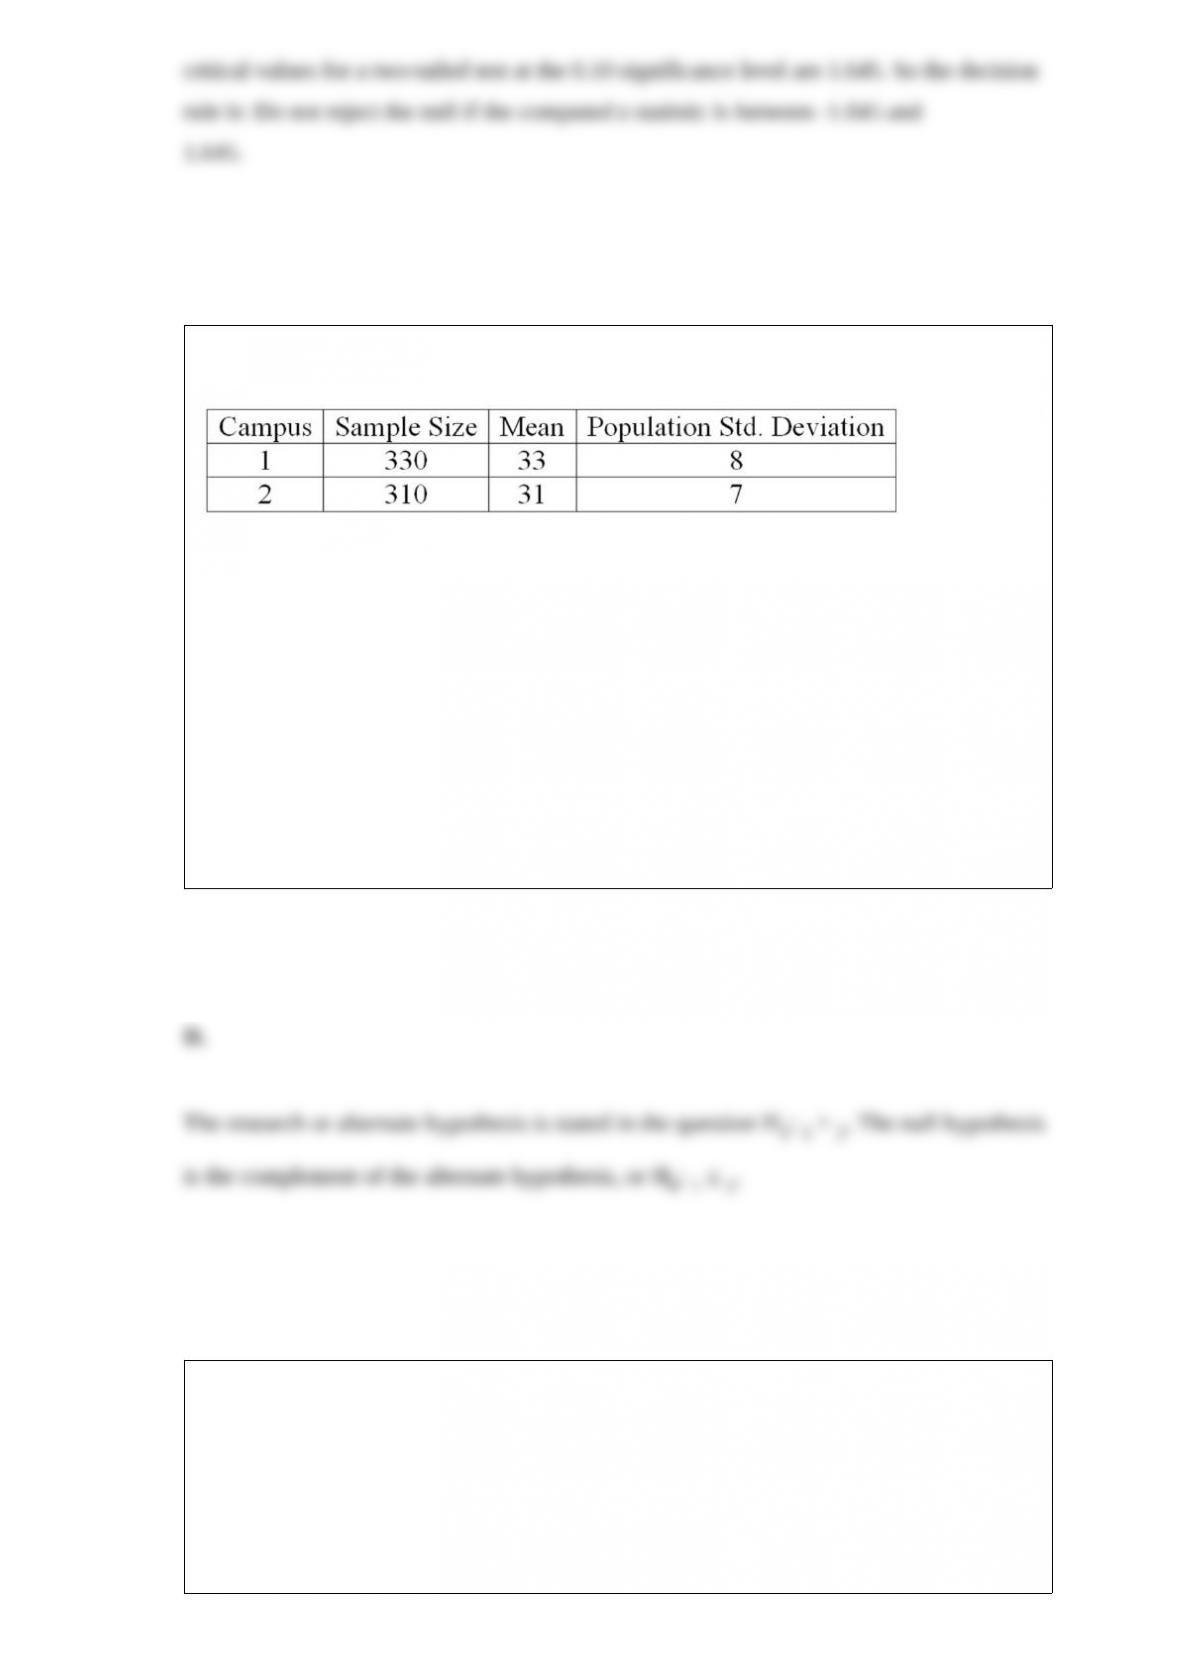
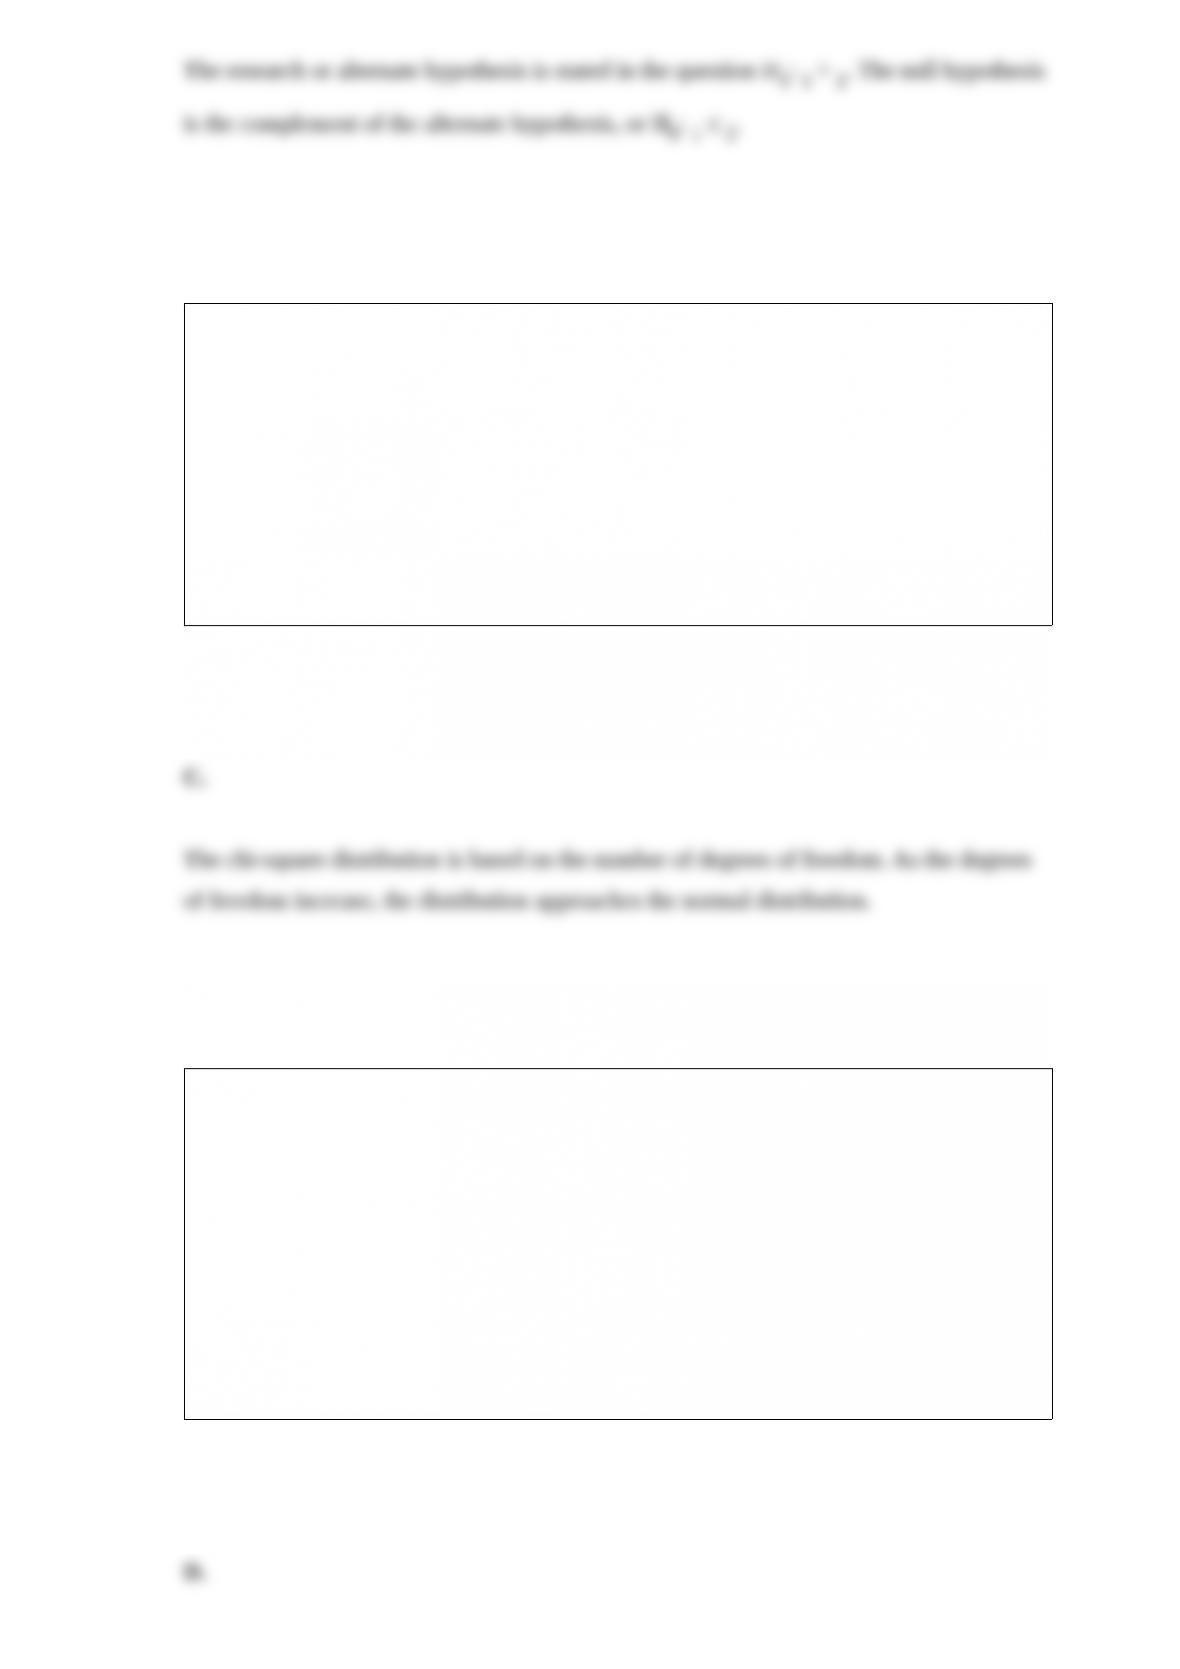
The results of a mathematics placement exam at two different campuses of Mercy
College follow:
What is the null hypothesis if we want to test the hypothesis that the mean score on
Campus 1 is higher than on Campus 2?
A. H0: 1 = 0
B. H0: 2 = 0
C. H0: 1 = 2
D. H0: 1 ≤ 2
The upper and lower limits of a uniform probability distribution are __________.
A. Positive and negative infinity
B. Plus and minus three standard deviations
C. 0 and 1
D. The maximum and minimum values of the random variable
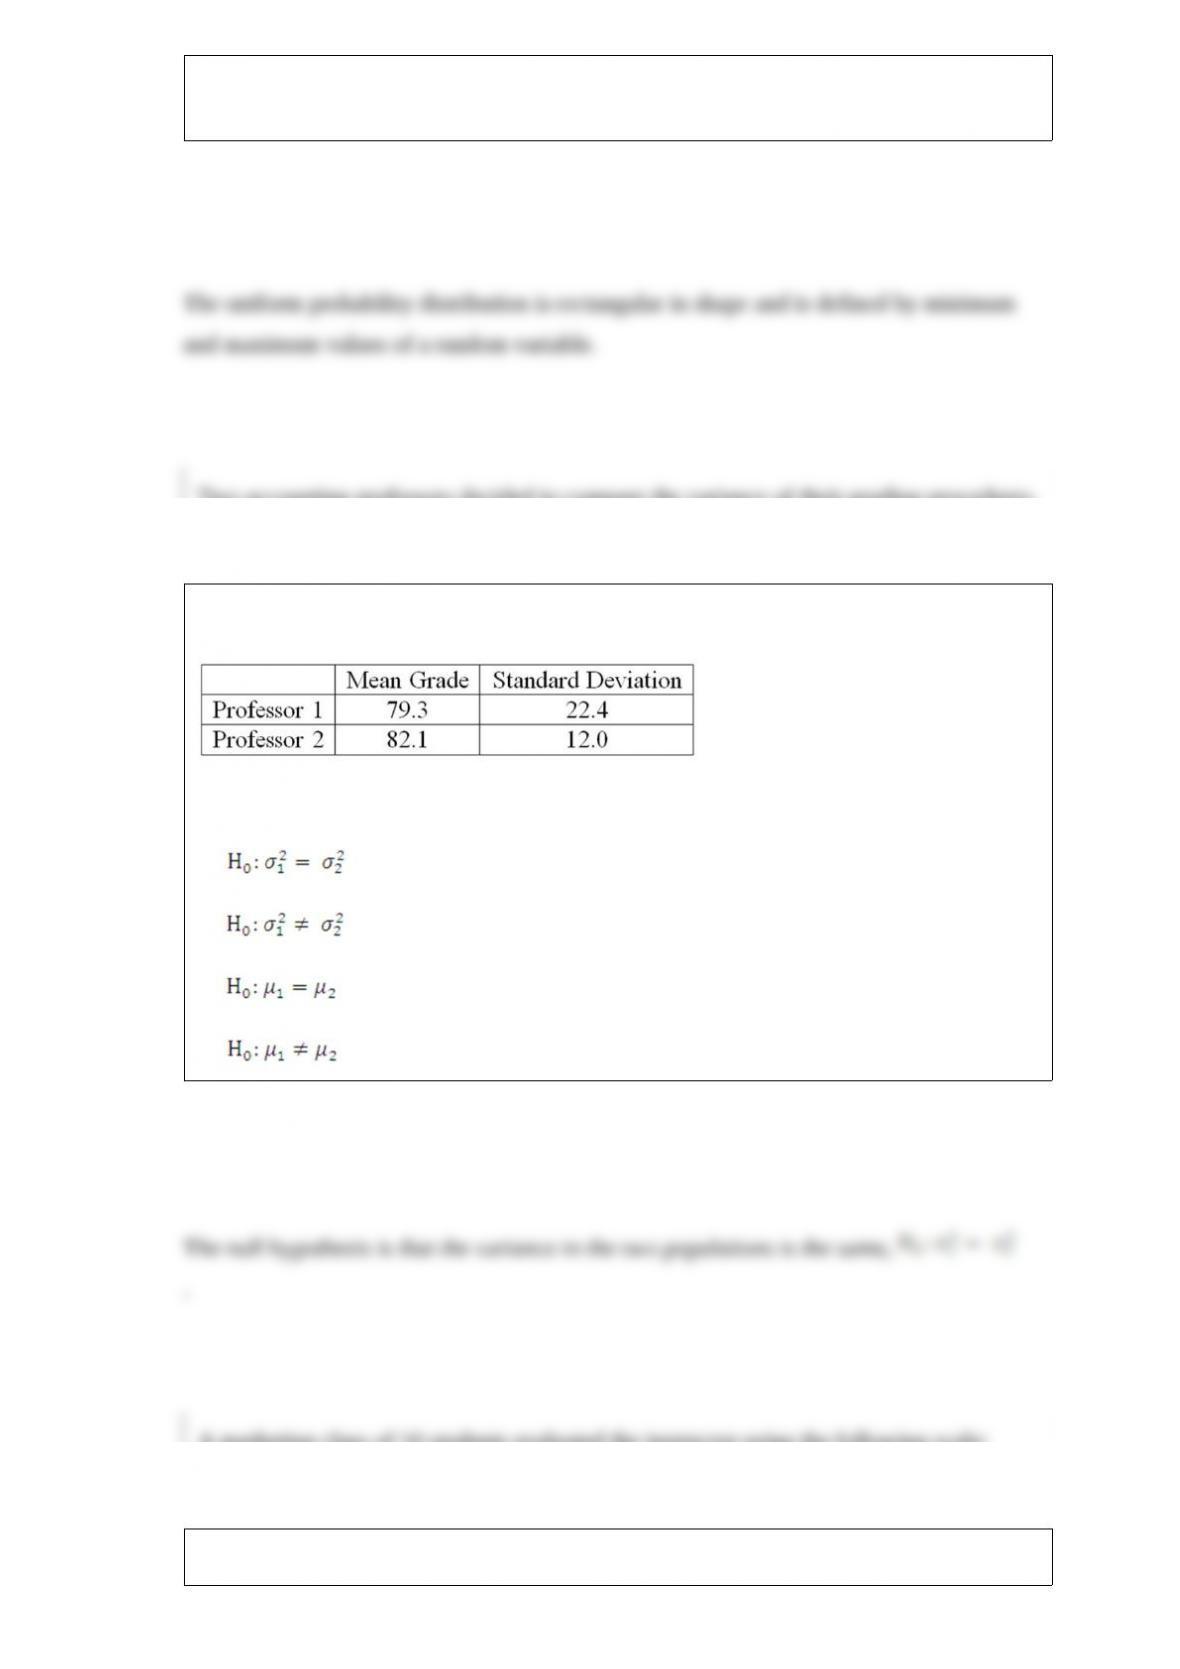
Two accounting professors decided to compare the variance of their grading procedures.
To accomplish this, they each graded the same 10 exams, with the following results:
What is the null hypothesis?
A.
B.
C.
D.
A marketing class of 50 students evaluated the instructor using the following scale:
superior, good, average, poor, and inferior. The descriptive summary showed the
following survey results: 2% superior, 8% good, 45% average, 45% poor, and 0%
inferior.
A. The instructor’s performance was great!
B. The instructor’s performance was inferior.
C. Most students rated the instructor as poor or average.
D. No conclusions can be made.
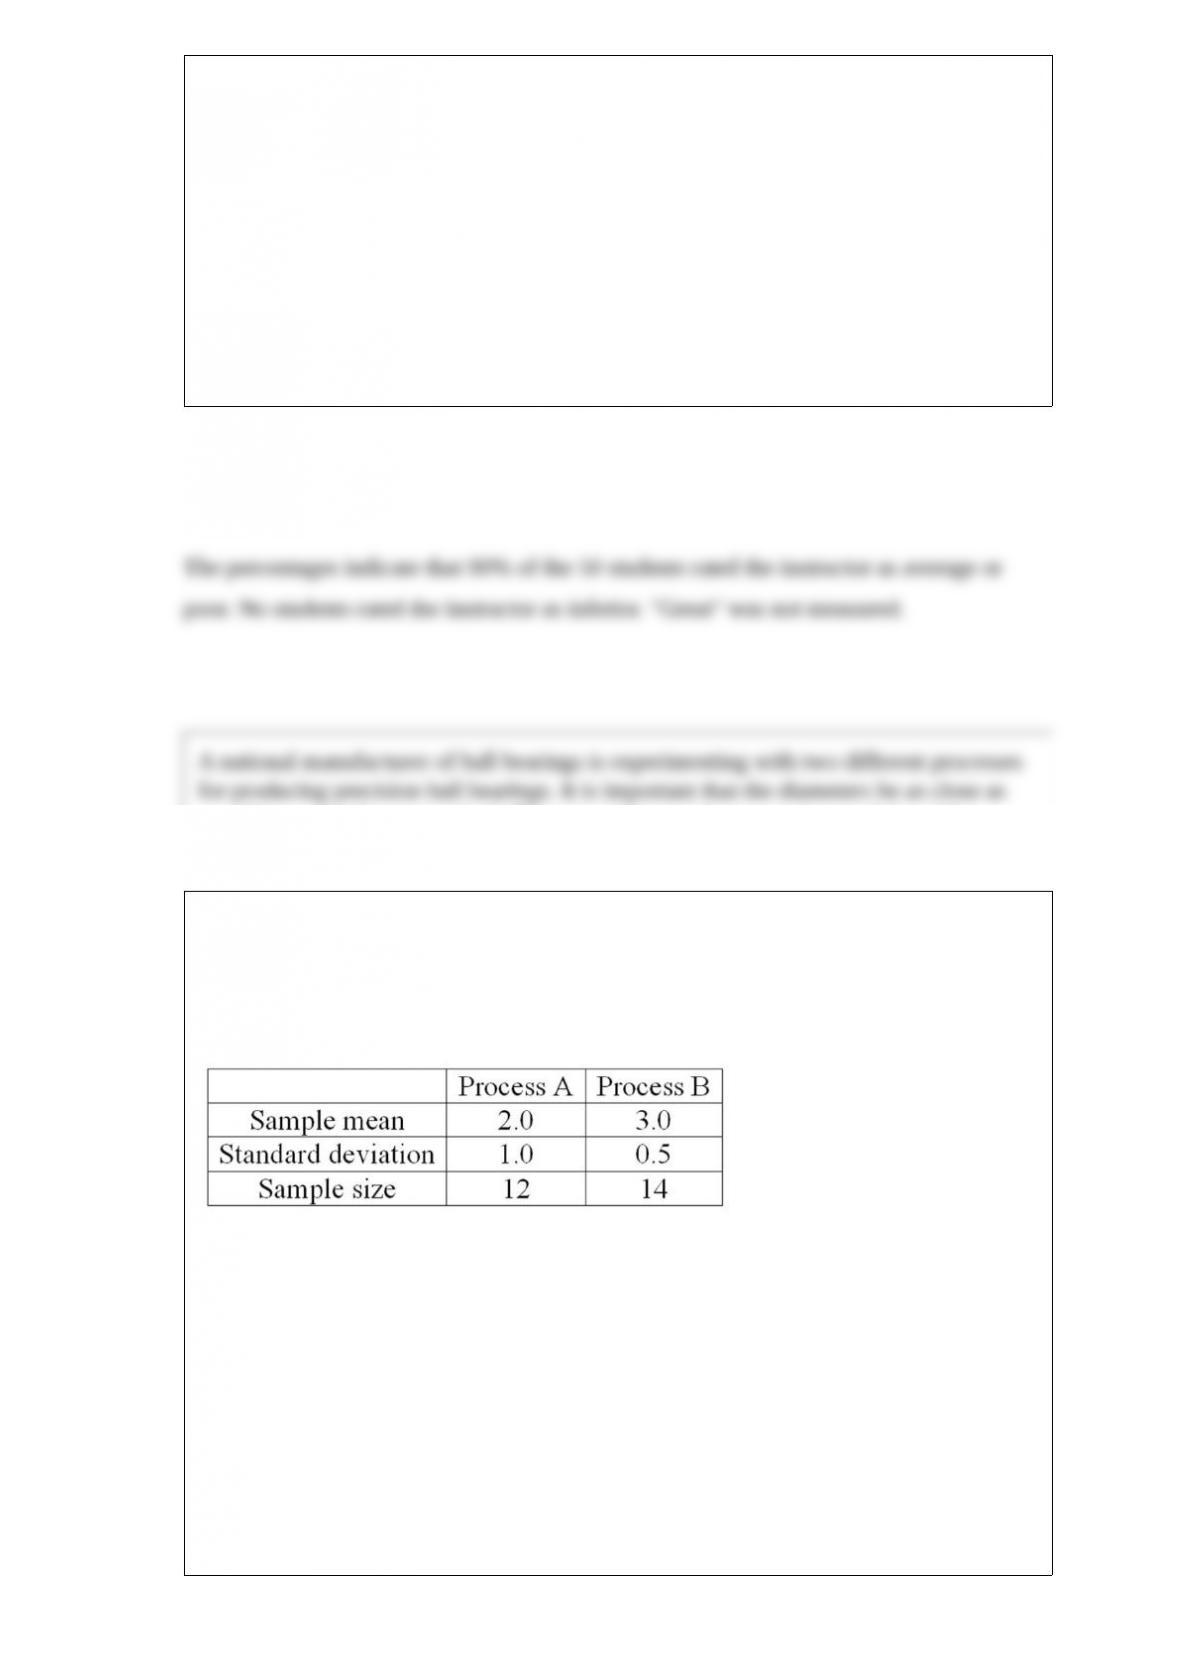
A national manufacturer of ball bearings is experimenting with two different processes
for producing precision ball bearings. It is important that the diameters be as close as
possible to an industry standard. The output from each process is sampled and the
average error from the industry standard is measured in millimeters. The results are
presented next.
The researcher is interested in determining whether there is evidence that the two
processes yield different average errors. The population standard deviations are
unknown but are assumed equal. What is the null hypothesis?
A. H0: A = B
B. H0: A ≠ B
C. H0: A ≤ B
D. H0: A > B
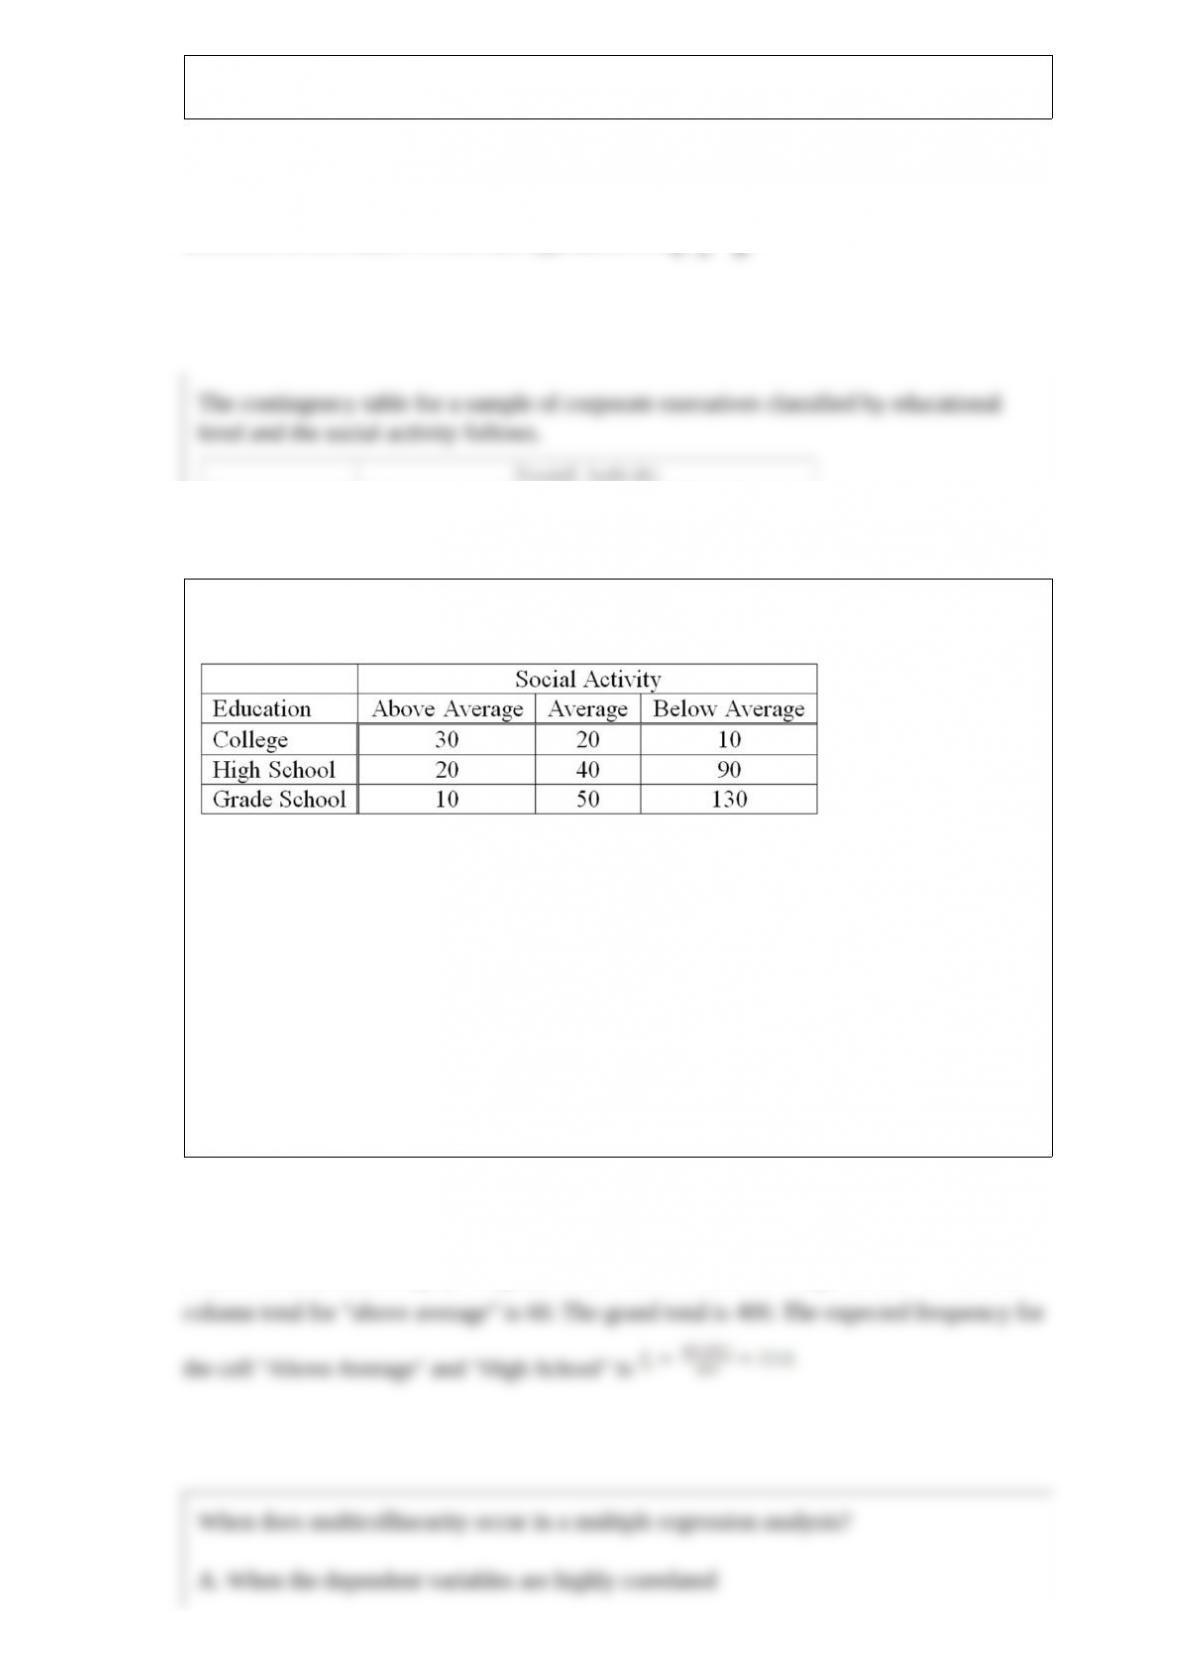
The contingency table for a sample of corporate executives classified by educational
level and the social activity follows.
What does the expected frequency for the “above average” social activity and “high
school” education equal?
A. 9.50
B. 60.00
C. 22.50
D. 28.50

When does multicollinearity occur in a multiple regression analysis?
A. When the dependent variables are highly correlated
B. When the regression coefficients are correlated
C. When the independent variables are highly correlated
D. When the independent variables have no correlation
What level of measurement is the Centigrade temperature scale?
A. Nominal
B. Ordinal
C. Interval
D. Ratio
The wildlife department has been feeding a special food to rainbow trout fingerlings in
a pond. Based on a large number of observations, the distribution of trout weights is
normally distributed with a mean of 402.7 grams and a standard deviation 8.8 grams.
What is the probability that the mean weight for a sample of 40 trout exceeds 405.5
grams?
A. 0.3782
B. 0.0222
C. 1.0
D. 0.5
The computed chi-square value is positive because the difference between the observed
and expected frequencies is _____________.
A. Squared
B. Linear
C. Uniform
D. Always positive
A sales manager for an advertising agency believes that there is a relationship between
the number of contacts that a salesperson makes and the amount of sales dollars earned.
What is the independent variable?
A. Salesperson
B. Number of contacts
C. Amount of sales
D. Sales manager
The monthly amounts spent for food by families of four receiving food stamps
approximates a symmetrical, normal distribution. The sample mean is $150 and the
standard deviation is $20. Using the Empirical Rule, about 95% of the monthly food
expenditures are between what two amounts?
A. $100 and $200
B. $85 and $105
C. $205 and $220
D. $110 and $190

The researcher must decide on the level of significance before formulating a decision
rule and collecting sample data.
To test if an observed frequency distribution with five classes is normally distributed,
we need to ___________.
A. Compute an F-statistic
B. Calculate a t-statistic
C. Convert the class marks to standard normal z-statistics
D. Convert the class limits to standard normal z-statistics

A sample of 250 adults tried the new multigrain cereal “Wow!” A total of 187 rated it as
excellent. In a sample of 100 children, 66 rated it as excellent. Using the 0.1
significance level, the researcher wishes to show that adults like the cereal better than
children. What is the pooled proportion?
A. 0.723
B. 1.408
C. 0.494
D. 0.807
What is the test statistic to test the significance of the slope in a regression equation?
A. z-statistic
B. F-statistic
C. t-statistic
D. π-statistic

A student was studying the political party preferences of a university’s student
population. The survey instrument asked students to identify their political preference,
for example, Democrat, Republican, Libertarian, or another party. The best way to
illustrate the frequencies for each political preference is a __________.
A. Bar chart
B. Box plot
C. Histogram
D. Frequency polygon
The relative frequency for a class represents the ________________.
A. Class width
B. Class midpoint
C. Class interval
D. Percent of observations in the class
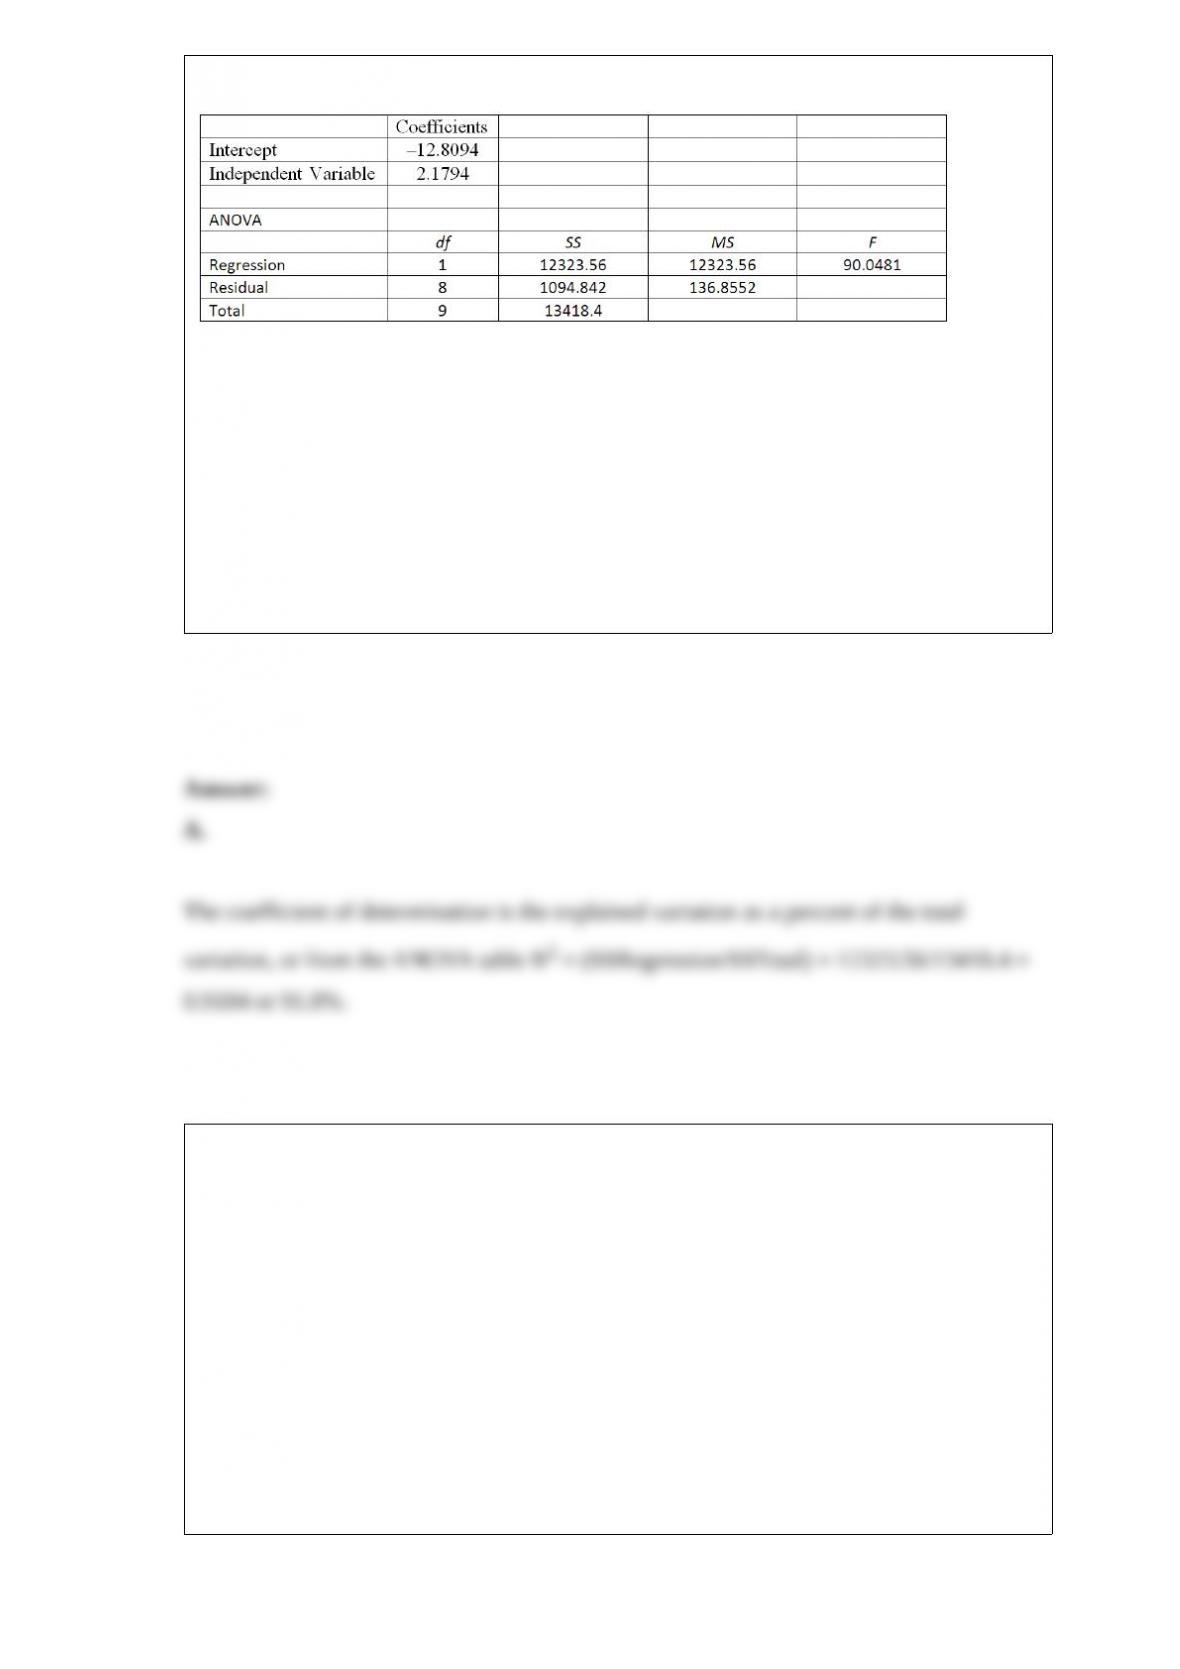
Using the following information:
What is the coefficient of determination? Round the percentage to one decimal point.
A. 91.8%
B. 8.2%
C. 90.0%
D. 136.9%
Suppose a tire manufacturer wants to set a mileage guarantee on its new XB 70 tire.
Tests revealed that the tire’s mileage is normally distributed with a mean of 47,900
miles and a standard deviation of 2,050 miles. The manufacturer wants to set the
guaranteed mileage so that no more than 5% of the tires will have to be replaced. What
guaranteed mileage should the manufacturer announce?
A. 44,518
B. 32,960
C. 49,621
D. 40,922

Variation describes the degree of dispersion in the data.
The chi-square statistic has __________.
A. One distribution
B. Two distributions
C. A family of distributions
D. A uniform distribution
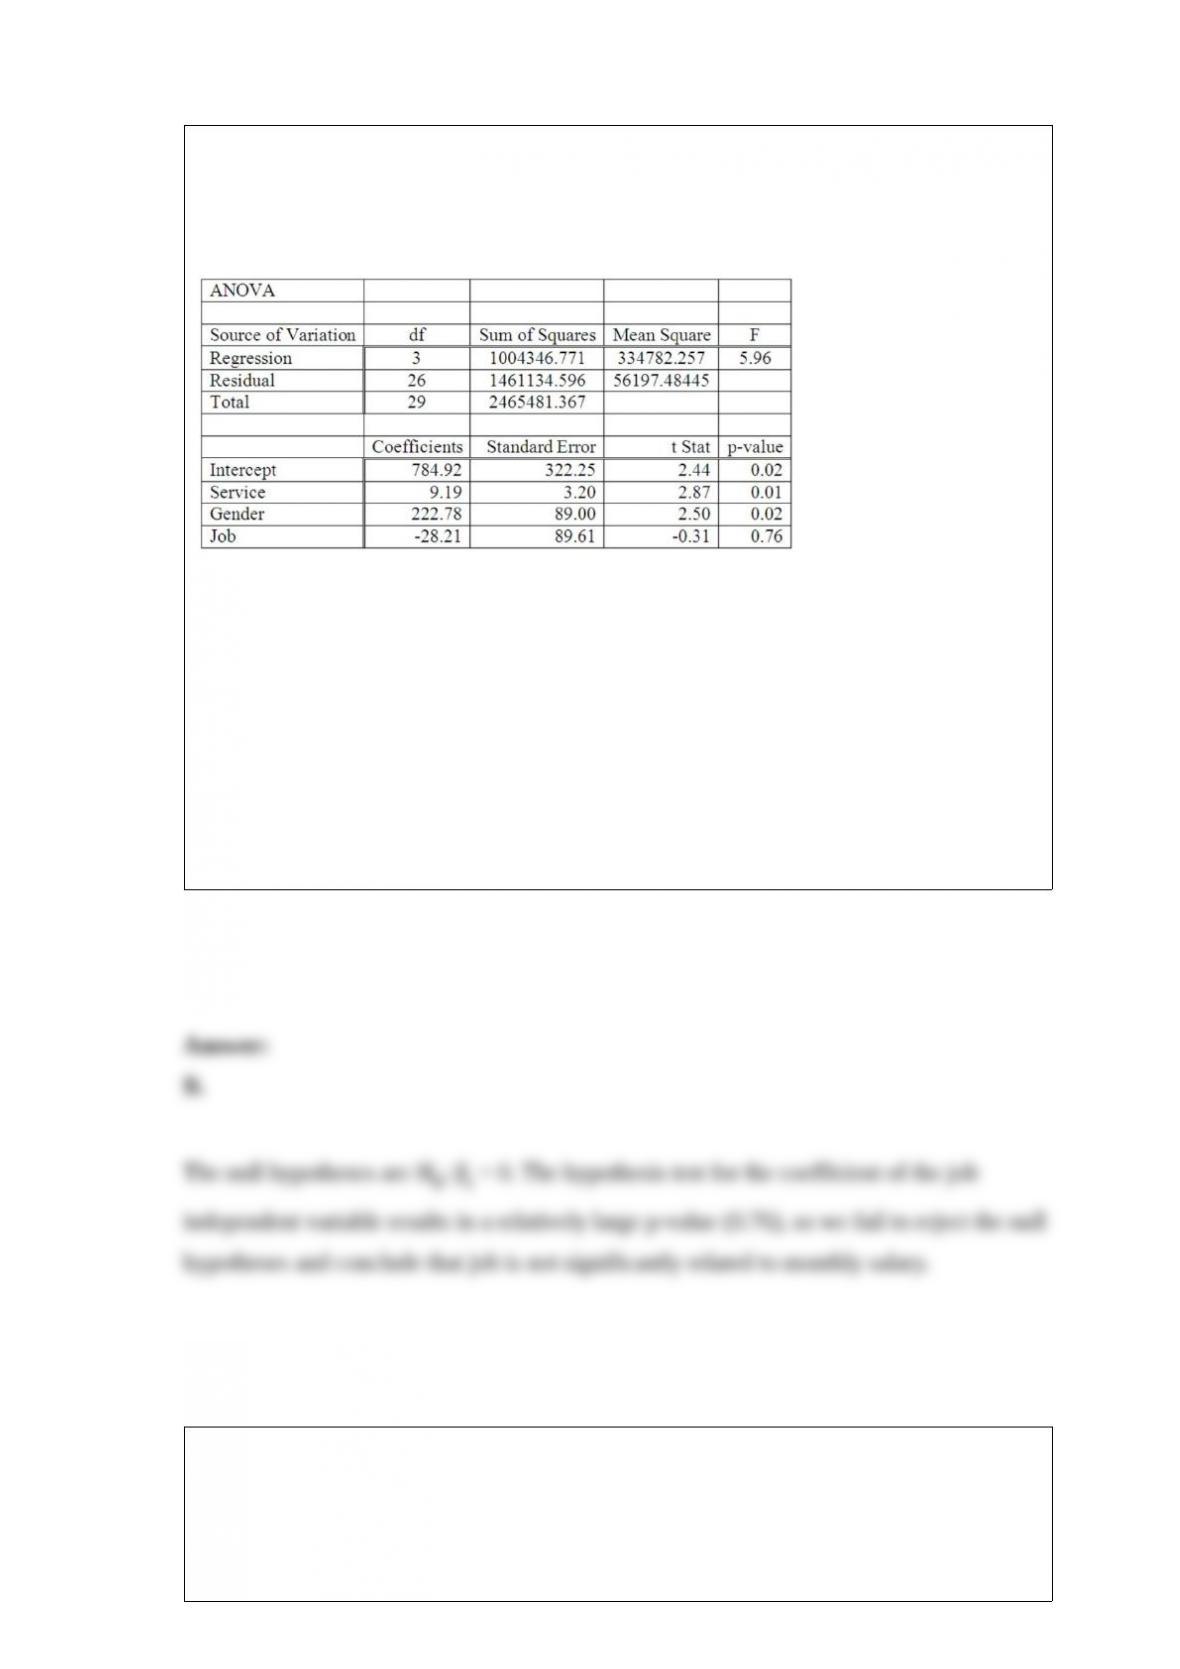
A manager at a local bank analyzed the relationship between monthly salary and three
independent variables: length of service (measured in months), gender (0 = female, 1 =
male) and job type (0 = clerical, 1 = technical). The following ANOVA summarizes the
regression results:
Based on the hypothesis tests for the individual regression coefficients,
_____________.
A. All the regression coefficients are not equal to zero
B. “Job” is the only non-significant variable in the model
C. The intercept is the only significant variable in the model
D. “Service” is the only significant variable in the model
Giorgio offers the person who purchases an 8-ounce bottle of Allure two free gifts,
either an umbrella, a 1-ounce bottle of Midnight, a feminine shaving kit, a raincoat, or a
pair of rain boots. If you purchased Allure, what is the probability you randomly
selected an umbrella and a shaving kit in that order?
A. 0.00
B. 1.00
C. 0.05
D. 0.20
The results of a mathematics placement exam at two different campuses of Mercy
College follow:
What is the alternative hypothesis if we want to test the hypothesis that the mean score
on Campus 1 is higher than on Campus 2?
A. H1: 1 = 0
B. H1: 2 = 0
C. H1: 1 > 2
D. H1: 1 ≤ 2
Which of the following statements is correct regarding the chi-square distribution?
A. The distribution is negatively skewed.
B. Chi-square is based on two sets of degrees of freedom, one for the numerator and
one for the denominator.
C. The shape of the distribution is based on the degrees of freedom.
D. The variance of the distribution is equal to one.
If the correlation between the two independent variables of a regression analysis is 0.11
and each independent variable is highly correlated to the dependent variable, what does
this indicate?
A. Only one of the independent variables should be used in the regression equation.
B. The independent variables are strongly related.
C. Two separate regression equations are required.
D. Both independent variables should be used to predict the dependent variable.
For the normal distribution, the mean plus and minus two standard deviations will
include about what percent of the observations?
A. 50%
B. 99.7%
C. 95%
D. 68%
The seasonal output of a new experimental strain of pepper plants was carefully
weighed. The mean weight per plant is 15.0 pounds, and the standard deviation of the
normally distributed weights is 1.75 pounds. Of the 200 plants in the experiment, how
many produced peppers weighing between 13 and 16 pounds?
A. 100
B. 118
C. 197
D. 53

When can a paired t-test be used to test a hypothesis of no difference between
population means?
To verify that a frequency distribution for sample data is normally distributed, the
expected frequencies are computed using probabilities from a _____________
distribution.
A financial planner wants to compare the yield of income and growth mutual funds.
Fifty thousand dollars is invested in each of a sample of 35 income and 40 growth
funds. The mean increase for a two-year period for the income funds is $900. For the
growth funds, the mean increase is $875. Income funds have a sample standard
deviation of $35; growth funds have a sample standard deviation of $45. Assume that
the population standard deviations are equal. At the 0.05 significance level, is there a
difference in the mean yields of the two funds?
What is the p-value for the computed test statistic?
If the size of a sample equals the size of the population, the sampling error is ________.
In a uniform distribution, with a minimum, a, and maximum, b, the probability that the
random variable, x, is between a and b is ___________.
In a study of protein breakfast bars, five bars from each of three brands were tested to
see if the mean amount of protein per bar differs among the brands. The F critical value
for α = 0.05 is _____.

Refer to the following breakdown of responses to a survey of room cleanliness in a
hotel.
Draw a bar graph that illustrates the preceding frequency table.
The F distribution is a ______________ distribution.
To test a hypothesis to verify that an observed frequency distribution data is normally
distributed, the expected frequencies are _______________ distributed.
A machine cuts steel to length for nails. The mean length of a nail is 43 millimeters.
There is concern that the settings of the machine producing the nails have changed. To
test the claim, 12 nails (n = 12) were sampled. The mean of the sample is 41.5 and the
standard deviation 1.784. To decide if the sample data support the claim that the mean
length is 43 millimeters, state your decision in terms of the null hypothesis. Use a 0.02
level of significance.
Assuming a normal population with a known population standard deviation, the z
statistic for a 90% confidence interval would be ____.

The “highest” level of measurement is ______________.
To construct a histogram, the class frequencies are plotted on the ________.