
A carload of steel rods has arrived at Cybermatic Construction Company. The car
contains 50,000 rods. Claude Ong, manager of Quality Assurance, directs his crew
measure the lengths of 100 randomly selected rods. If the population of rods have a
mean length of 120 inches and a standard deviation of 0.05 inch, the probability that
Claude’s sample has a mean less than 119.985 inches is _____________.
a) 0.9974
b) 0.0026
c) 0.4987
d) 0.0013
e) 0.0030
If x is a binomial random variable withn=10 andp=0.8, what is the probability that x is
equal to 4?
a) .0055
b) .0063
c) .124
d) .232
e) .994

When a person collects information from the entire population, this is called a _______.
a) parameter
b) sample
c) population
d) census
e) statistic
A market researcher is interested in determining the average income for families in
Duval County, Florida. To accomplish this, she takes a random sample of 400 families
from the county and uses the data gathered from them to estimate the average income
for families of the entire county. This process is an example of _______.
a) nonparametric statistics
b) nominal data
c) descriptive statistics
d) inferential statistics
e) census

BigShots, Inc. is a specialty e-tailer that operates 87 catalog Web sites on the Internet.
Kevin Conn, Sales Director, feels that the style (color scheme, graphics, fonts, etc.) of a
Web site may affect its sales. He chooses three levels of design style (neon, old world
and sophisticated) and randomly assigns six catalog Web sites to each design style.
Analysis of Kevin’s data yielded the following ANOVA table.
Using
= 0.05, the appropriate decision is _____________.
a) do not reject the null hypothesis
1
2
3
b) do not reject the null hypothesis
1
2
3
c) reject the null hypothesis
1
2
3
d) reject the null hypothesis
1
2
3
e) do nothing
A p Chart is to be developed for use in quality control. The value of p is calculated to be
0.05. The sample size is 50. What would the upper control limit be?
a) 0.142
b) -0.042
c) 0.408
d) 0.092
e) 0.642
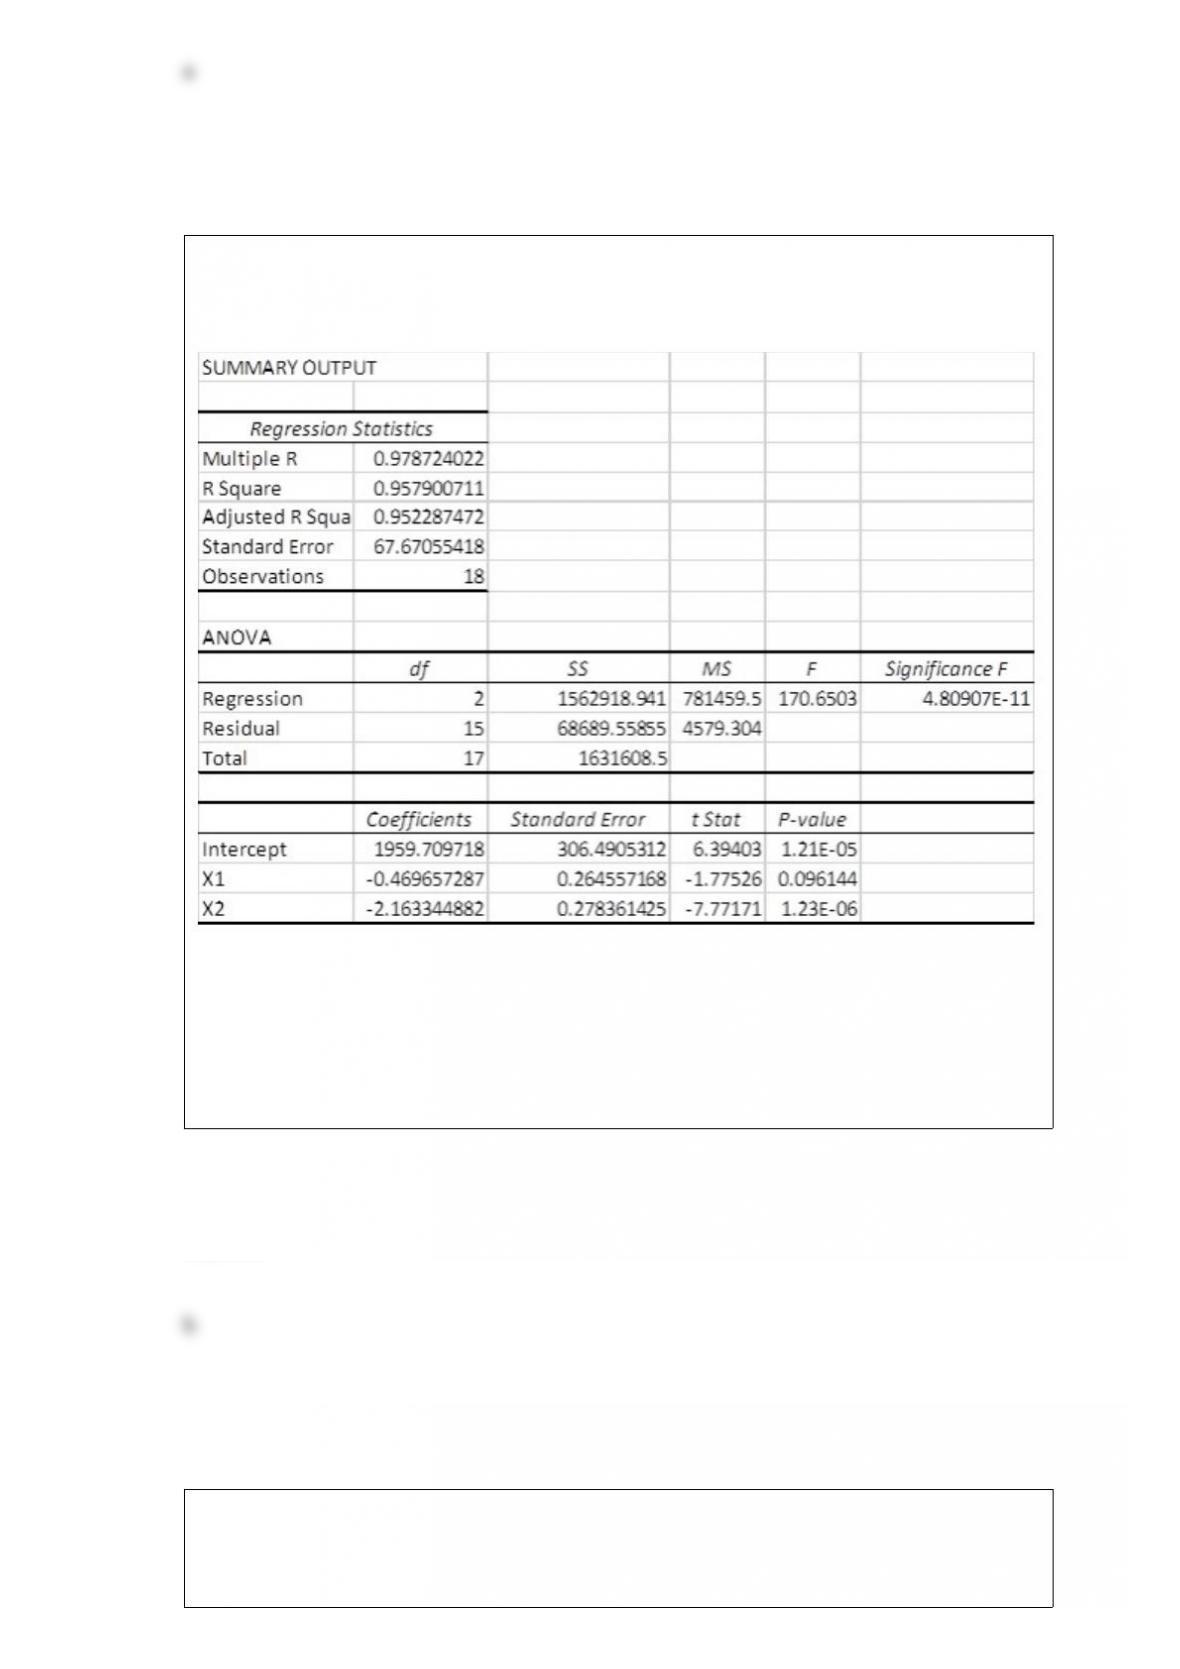
A multiple regression analysis produced the following output from Excel.
The overall proportion of variation of y accounted by x1and x2is _______
a) 0.9787
b) 0.9579
c) 0.9523
d) 67.671
e) 0.0489
BigShots, Inc. is a specialty e-tailer that operates 87 catalog Web sites on the Internet.
Kevin Conn, Sales Director, feels that the style (color scheme, graphics, fonts, etc.) of a

Web site may affect its sales. He chooses three levels of design style (neon, old world
and sophisticated) and randomly assigns six catalog Web sites to each design style.
Kevin’s null hypothesis is _____________.
a)
1
2
3
b)
1
2
3
c)
1
2
3
d)
1
2
3
e)
1
2≥
3
In a regression analysis if SST = 200 and SSR = 200, r 2= _________.
a) 0.25
b) 0.75
c) 0.00
d) 1.00
e) -1.00
Tamara Hill, fund manager of the Hill Value Fund, manages a portfolio of 250 common
stocks. Tamara is searching for a ‘low risk’ issue to add to the portfolio, i.e., one with a
price variance less than that of the S&P 500 index. Moreover, she assumes an issue is
not ‘low risk’ until demonstrated otherwise. Her staff reported that during the last nine
quarters the price variance for the S&P 500 index (population 1) was 25, and for the last
seven quarters the price variance for XYC common (population 2) was 8. Assume that
stock prices are normally distributed in the population. Using
= 0.05, Tamara’s

alternate hypothesis is _______.
a)
b)
c)
d)
e) s s
Collinsville Construction Company purchases steel rods for its projects. Based on
previous tests, Claude Carter, Quality Assurance Manager, has recommended
purchasing rods from Redding Rods, Inc. (population 1), rather than Stockton Steel
(population 2), since Redding’s rods had less variability in length. Recently, Stockton
revised it rod shearing operation, and Claude has sampled the outputs from Redding’s
and Stockton’s rod manufacturing processes. The results for Redding were s1
2= 0.10
with n1= 8, and, for Stockton, the results were s2
2= 0.05 with n2= 10. Assume that rod
lengths are normally distributed in the population If
= 0.05, the appropriate decision is
________.
a) reject the null hypothesis
b) reject the null hypothesis
c) do not reject the null hypothesis
d) do not reject the null hypothesis
e) do nothing
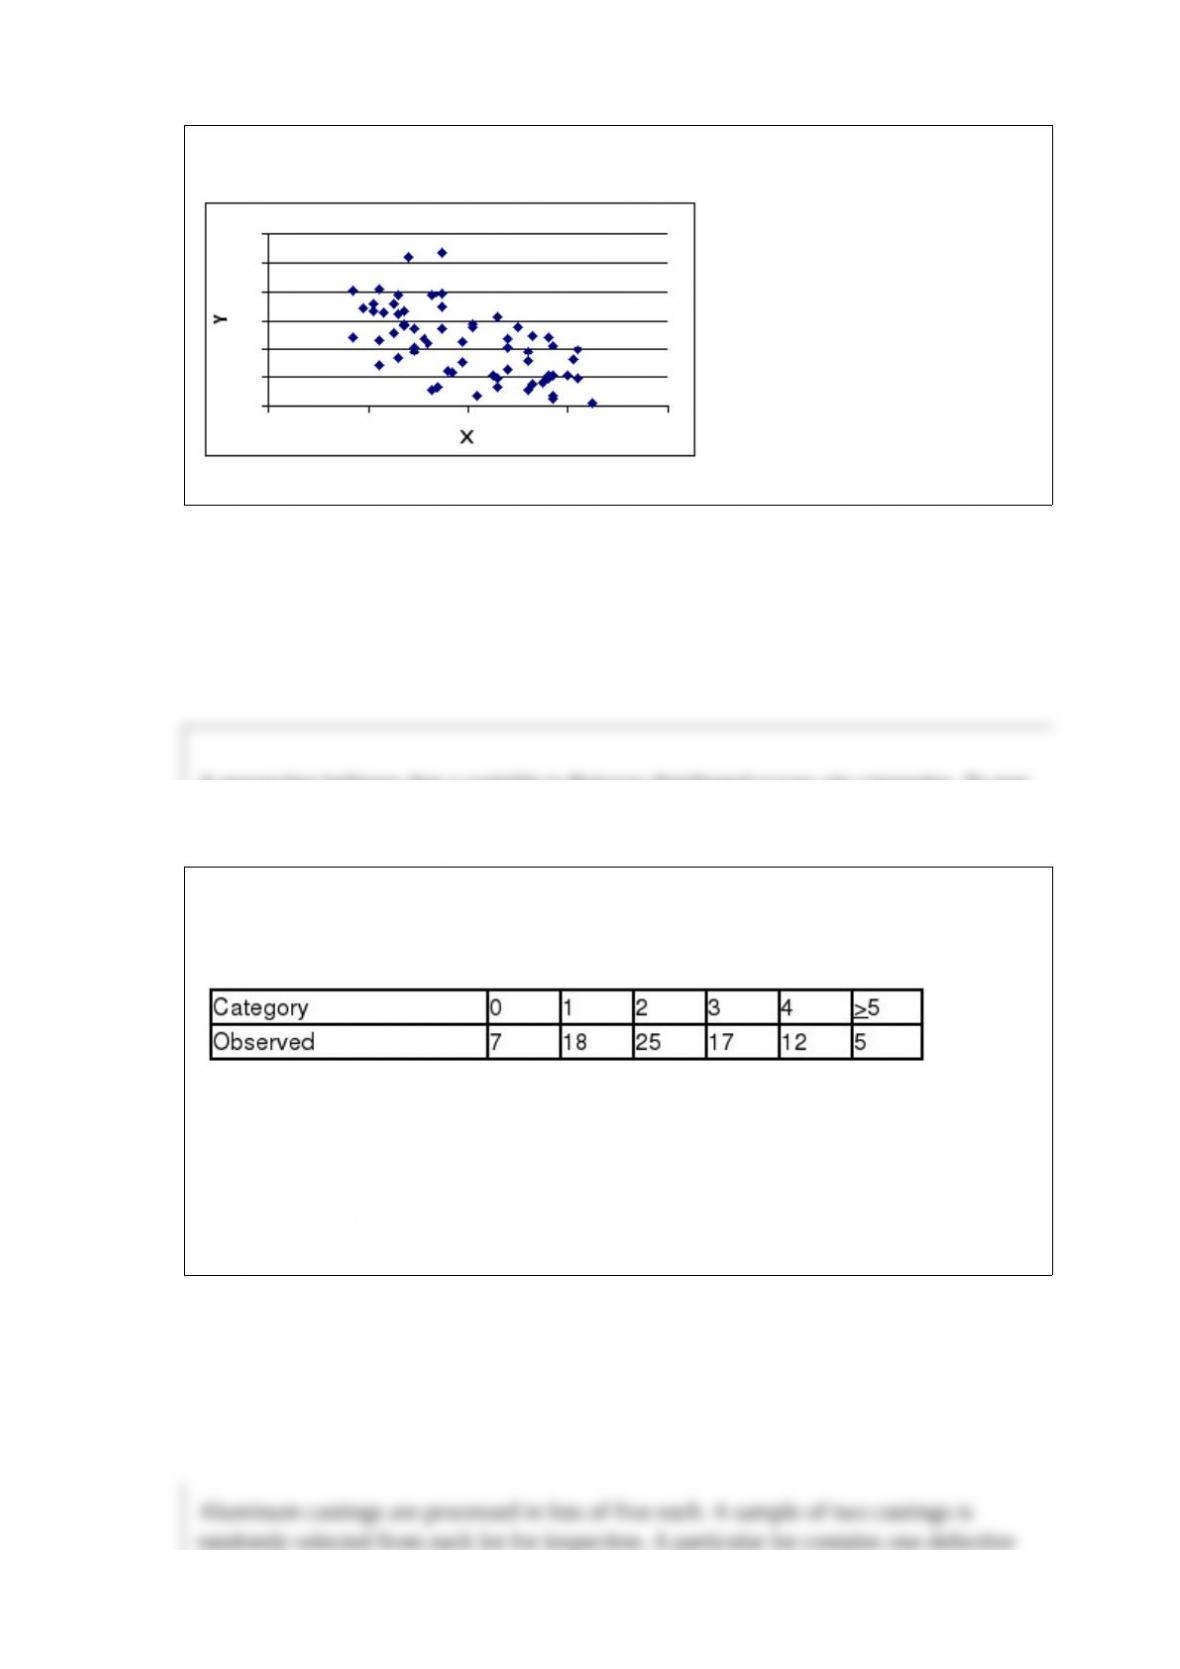
From the following scatter plot, we can say that between y and x there is _______.
a) perfect positive
correlation
b) virtually no correlation
c) positive correlation
d) negative correlation
e) perfect negative correlation
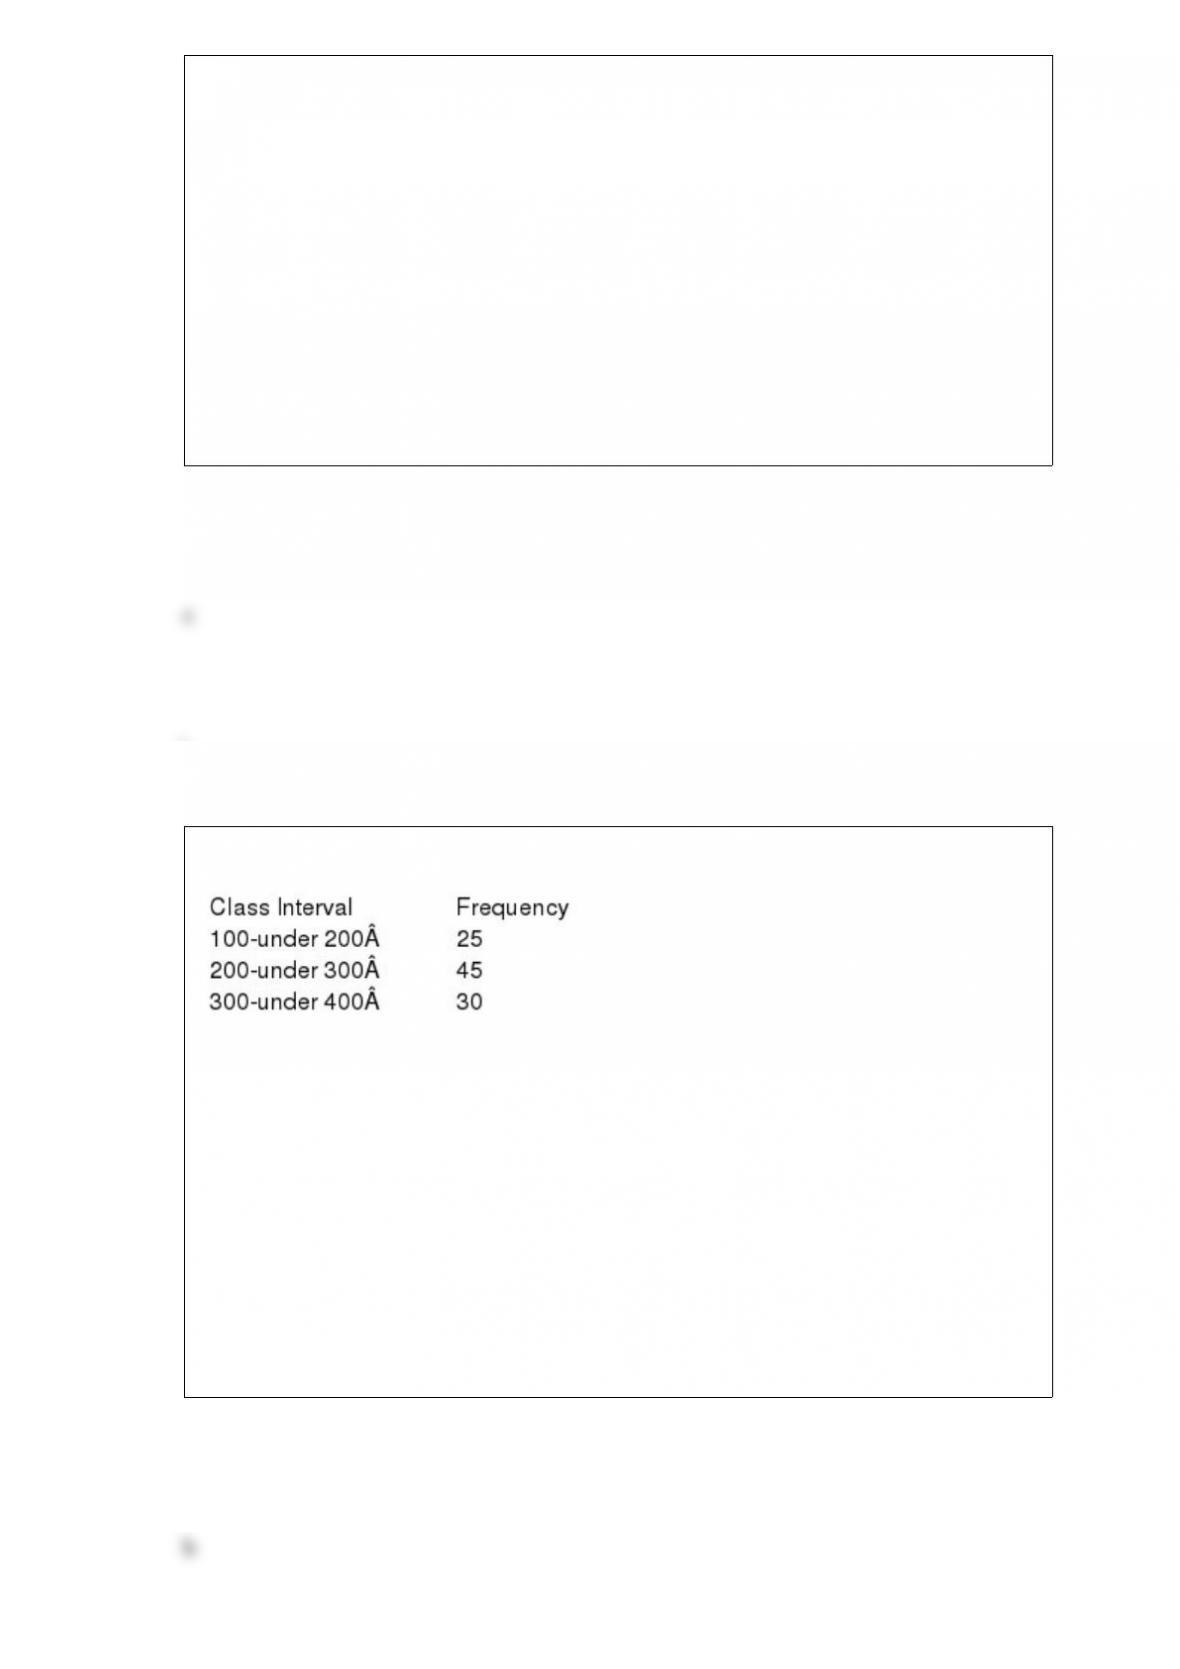
A researcher believes that a variable is Poisson distributed across six categories. To test
this, the following random sample of observations is collected:
Using
= 0.10, the value of the observed chi-square for the data is _______.
a) 19.37
b) 2.29
c) 1.74
d) 3.28
e) 4.48
Aluminum castings are processed in lots of five each. A sample of two castings is
randomly selected from each lot for inspection. A particular lot contains one defective
casting; and x is the number of defective castings in the sample. P(x=0) is _______.
a) 0.2
b) 0.4
c) 0.6
d) 0.8
e) 1.0
Consider the following frequency distribution:
What is the midpoint of the first class?
a) 100
b) 150
c) 25
d) 250
e) 200

Suppose a research uses the Mann-Whitney test to determine if there is a difference in
the volume of text messages sent by a high school student living in a rural area versus
an urban area during the month of December. Eight rural high school students and 9
urban high school students were included in the study. If, among all 17, the sum of the
ranks W1produced from the rural high school students is 72, the U statistic is
__________
a) 29
b) 45
c) 90
d) 36
e) 43
A multiple regression analysis produced the following tables.

Using a = 0.01 to test the null hypothesis H0: b 1 = b 2 = 0, the critical F value is ____.
a) 8.68
b) 6.36
c) 8.40
d) 6.11
e) 3.36
For the following ANOVA table, the MS Treatment value is ___________.
a) 150
b) 50
c) 450
d) 3.49
e) 40
Meagan Dubean manages a portfolio of 200 common stocks. Her staff classified the
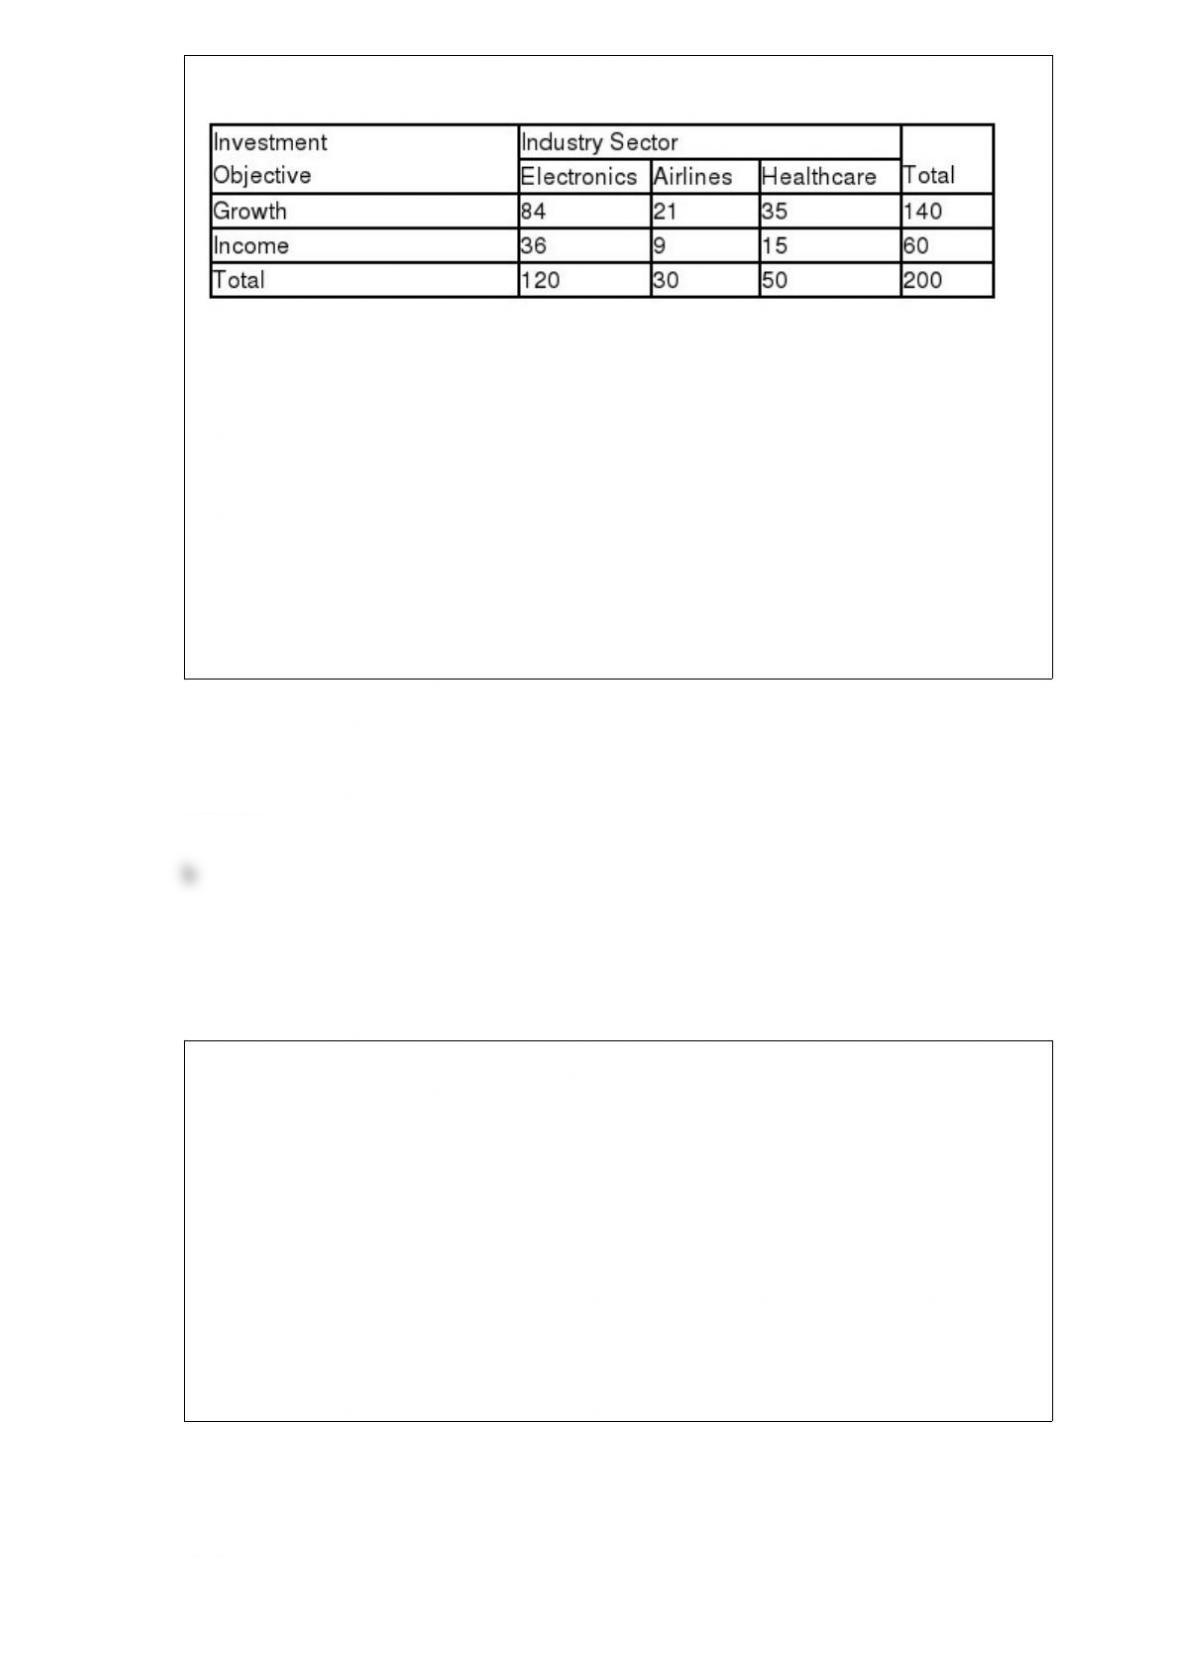
portfolio stocks by ‘industry sector’ and ‘investment objective.’
Which of the following statements is true?
a) Growth and Healthcare are complementary events.
b) Electronics and Growth are independent.
c) Electronics and Growth are mutually exclusive.
d) Airlines and Healthcare are collectively exhaustive.
e) Electronics and Healthcare are collectively exhaustive.
If it were not for the existence of an “absolute zero,” ratio data would be considered the
same as _______.
a) interval level data
b) ordinal level data
c) nominal level data
d) ratio level data
e) relative level data
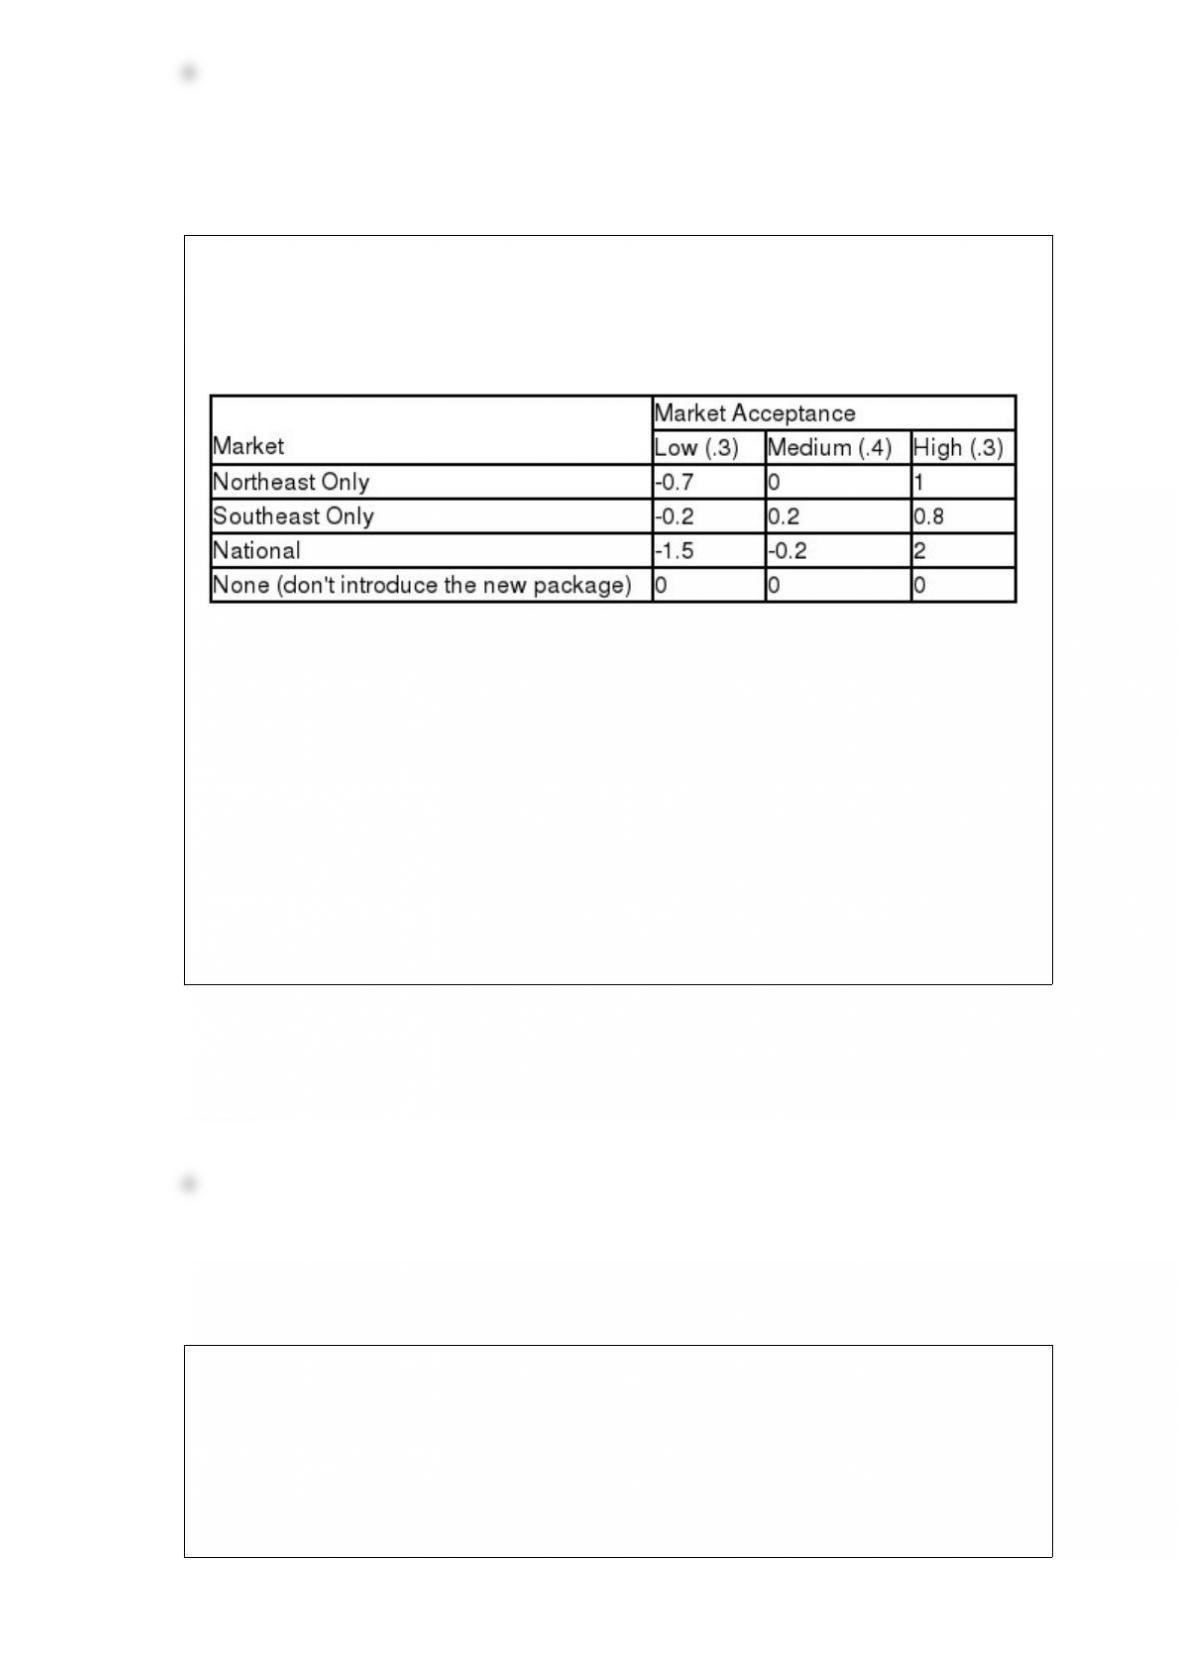
Melissa Rossi, Product Manager at National Consumers, Inc. (NCI), is evaluating
alternatives for introducing a new package for toothpaste. She has identified four
alternative markets, and has constructed the following table which shows NCI’s rewards
(in $1,000,000’s) for various levels of acceptance by the markets and their probabilities.
The expected value of perfect information is ________.
a) $420,000
b) $570,000
c) $660,000
d) $720,000
e) $890,000
A local parent group was concerned with the increasing school cost for families with
school aged children. The parent group was interested in understanding the relationship
between the academic grade level for the child and the total costs spent per child per
academic year. They performed a multiple regression analysis using total cost as the
dependent variable and academic year (x1) as the independent variables. The multiple
regression analysis produced the following tables.
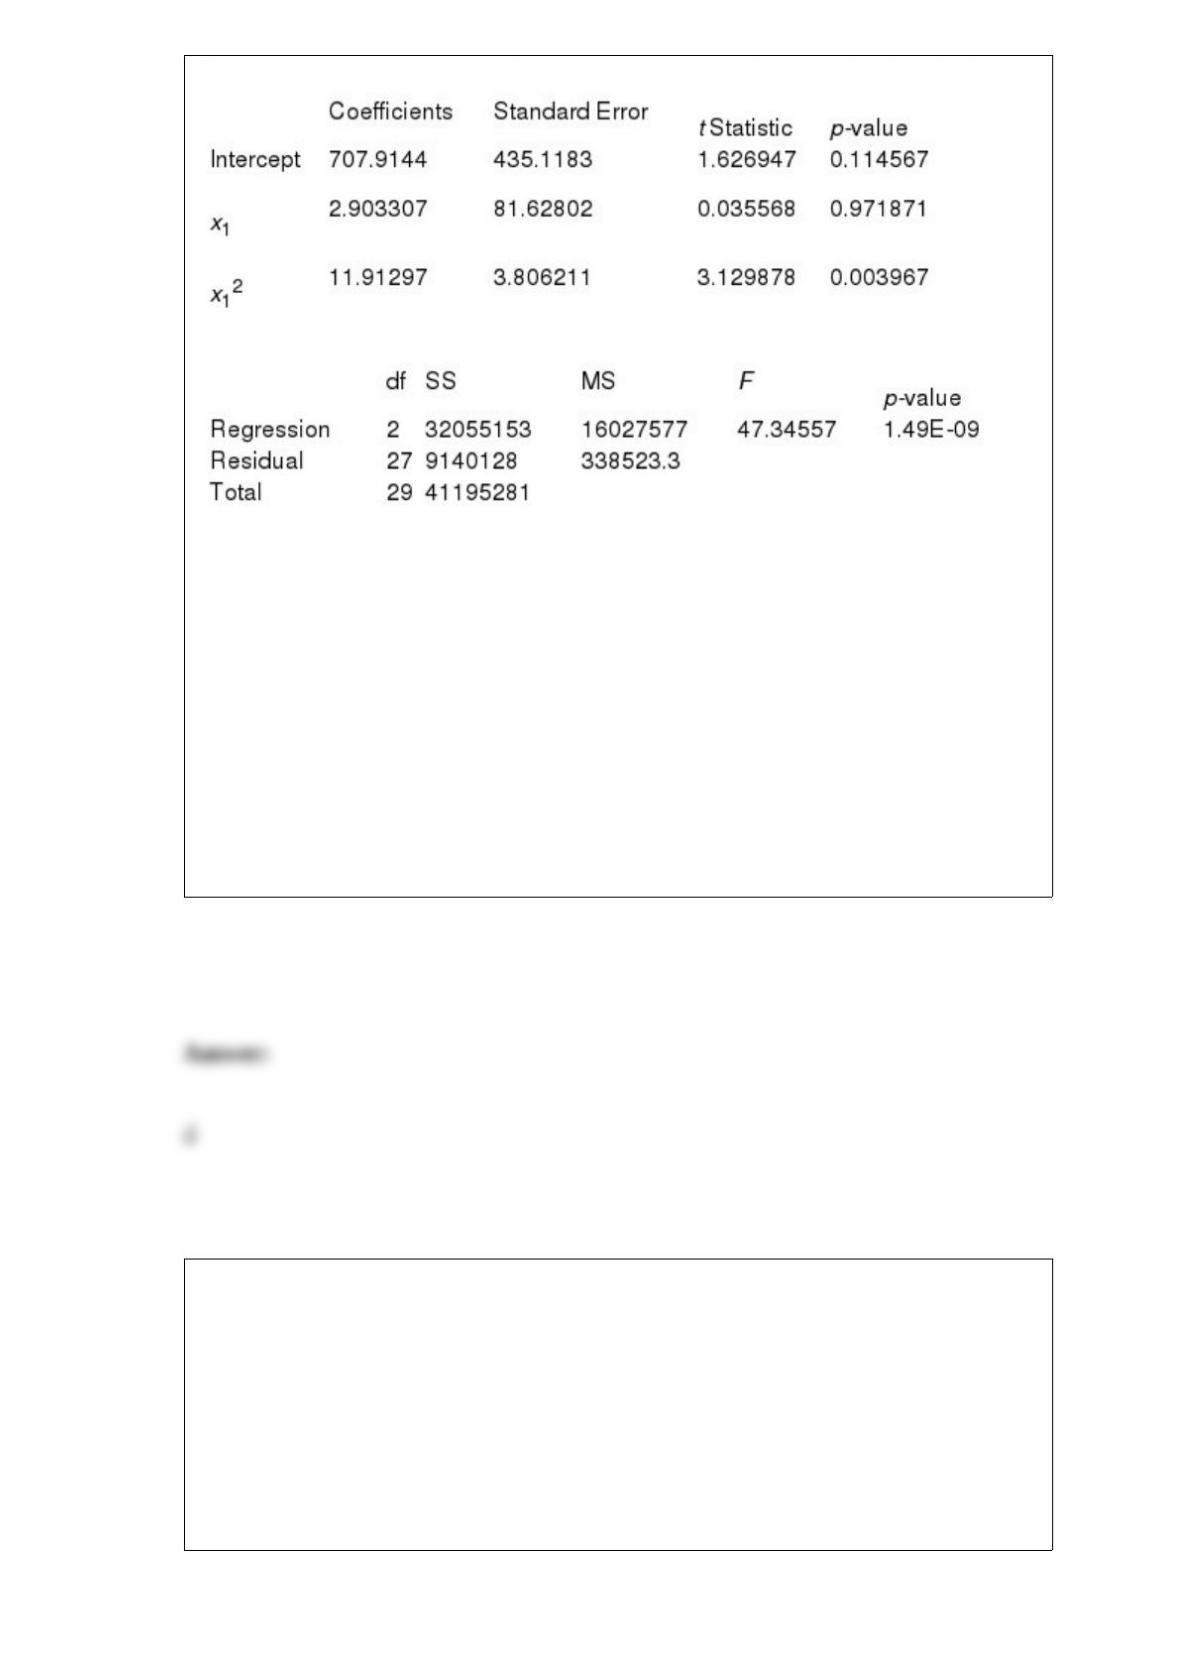
Using a = 0.05 to test the null hypothesis H0: b2 = 0, the critical t value is ____.
a) 1.311
b) 1.699
c) 1.703
d) 2.052
e) 2.502
The average time between phone calls arriving at a call center is 30 seconds. Assuming
that the time between calls is exponentially distributed, find the probability that more
than a minute elapses between calls.
a) 0.135
b) 0.368
c) 0.865
d) 0.607
e) 0.709

A sample of 117 records of the selling price in dollars of homes from Feb 15 to Apr 30,
2013
was taken from the files maintained by the Albuquerque Board of Realtors. The
following are
summary statistics for the selling prices.
From this we can conclude that,
a) There are no outliers
b) More homes were sold for greater than $121750 than for less than $77650
c) 68% of the selling price of homes is from $77650 to $121750
d) 25% of the selling price of homes is at least $121750
e) The distribution of selling price of homes is negatively skewed.
Prediction intervals get narrower as we extrapolate outside the range of the data.
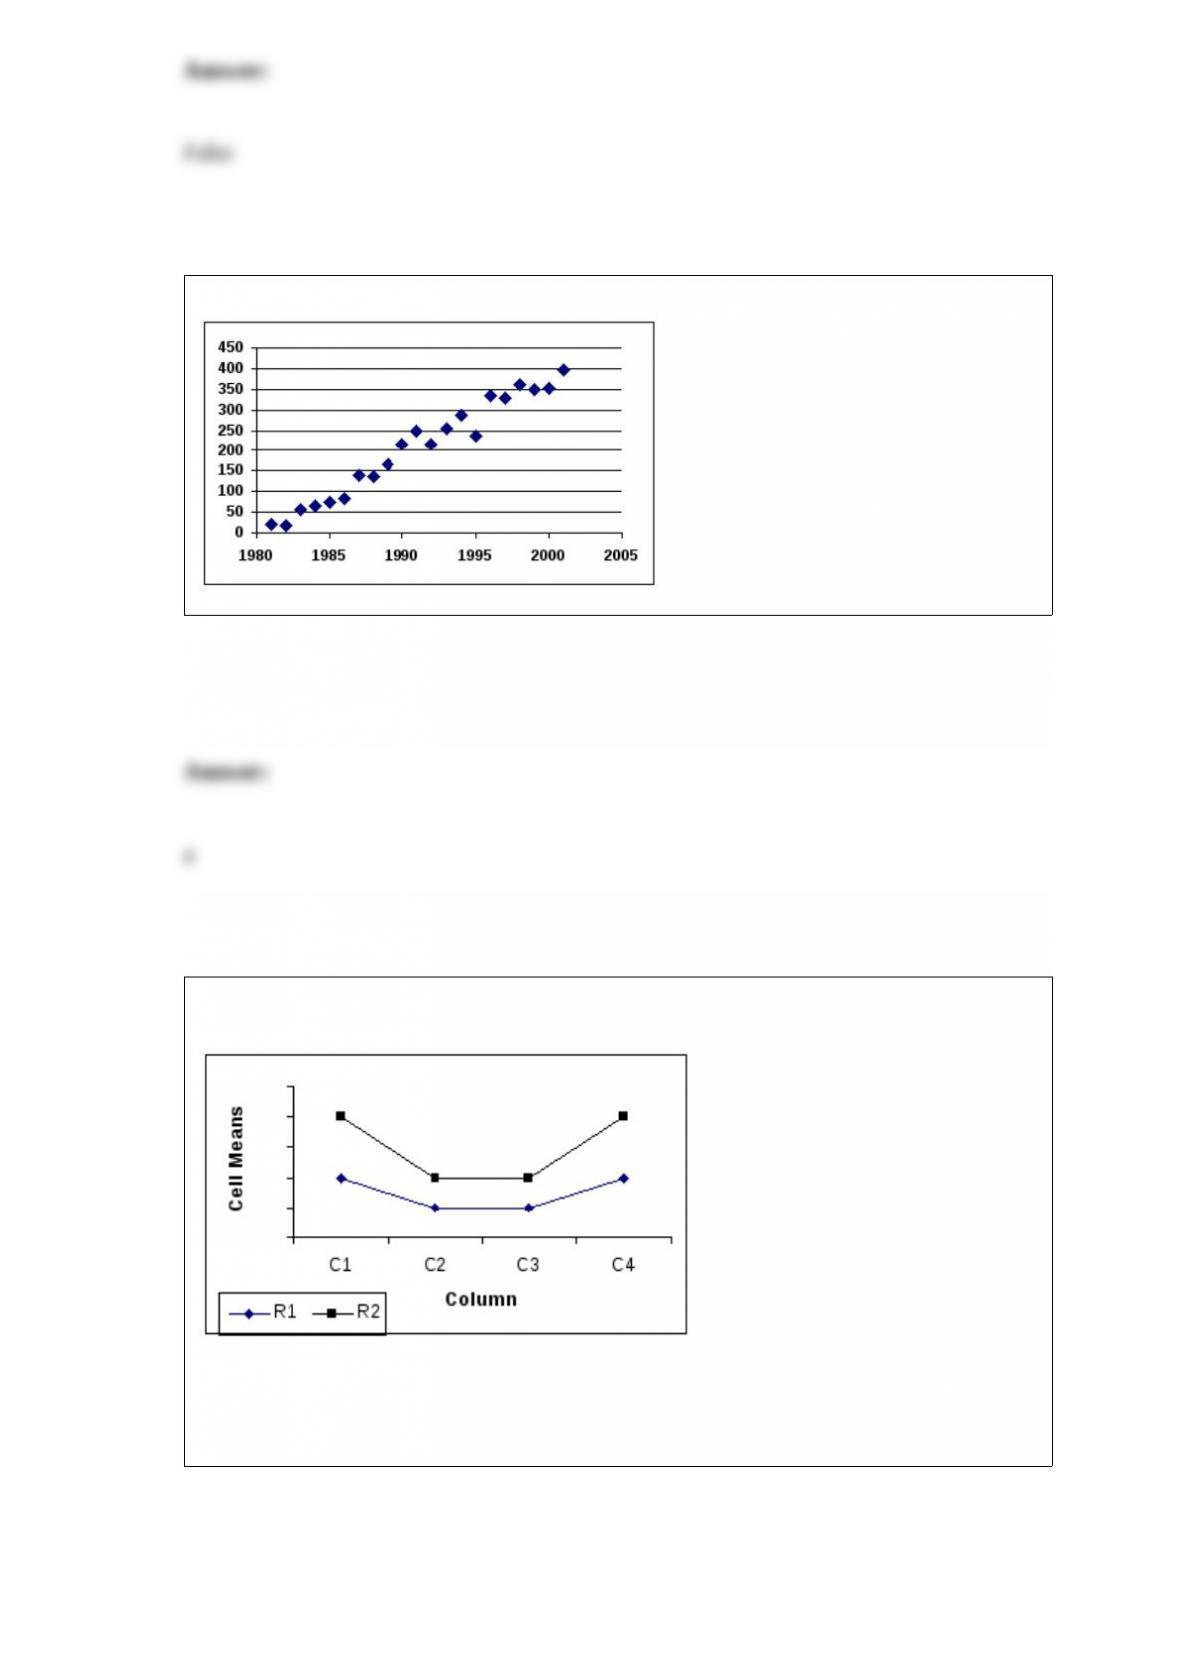
The following graph of a time-series data suggests a _______________ trend.
a) linear
b) quadratic
c) cosine
d) tangential
e) flat
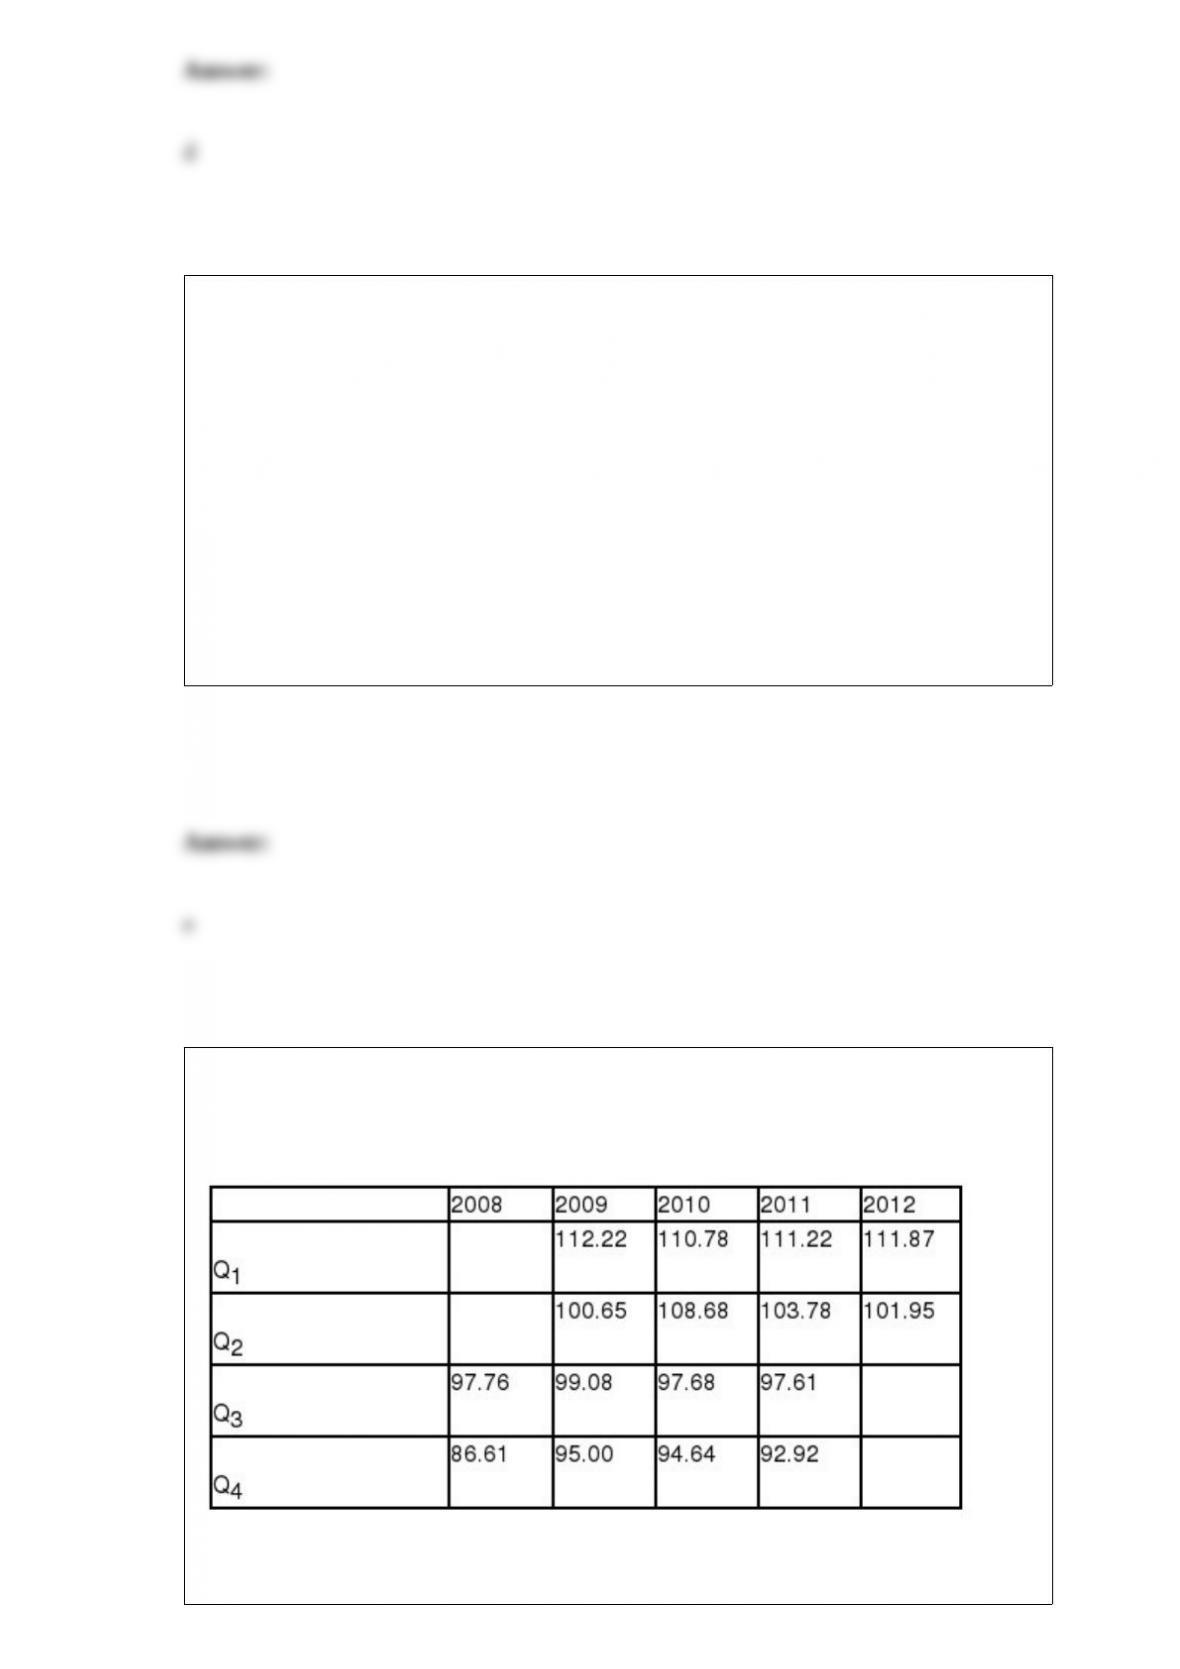
The following graph indicates a _______________.
a) 2 4 factorial design with
interaction
b) 4 2 factorial design
with no interaction
c) 4 2 factorial design with
interaction
d) 2 4 factorial design
with no interaction
e) randomized block design
An R Chart is to be developed for use in quality control. The average of the ranges is
calculated to be 0.60. This was based on several samples of size 7 each. What would the
upper control limit be?
a) 1.514
b) 1.924
c) 4.200
d) 0.600
e) 1.154
The ratios of “actuals to moving averages” (seasonal indexes) for a time series are
presented in the following table as percentages.
The final (completely adjusted) estimate of the seasonal index for Q1is __________.
a) 109.733

b) 109.921
c) 113.853
d) 113.492
e) 111.545
An R Chart is to be developed for use in quality control. The average of the ranges is
calculated to be 0.60. This was based on several samples of size 7 each. What would the
lower control limit be?
a) 0.046
b) 0.000
c) 1.154
d) 4.200
e) 0.004
The nonparametric counterpart of the ttest to compare the means of two independent
populations is the _______.
a) chi-square goodness of fit test
b) chi-square test of independence
c) Mann-Whitney Utest
d) Wilcoxon test
e) Friedman test