
A statistic is a value that describes a population characteristic while a parameter is
computed from a sample.
The t-distribution is used to obtain the critical value in developing a confidence interval
when the population distribution is not known or the sample size is small.
The control limits in the x-bar chart are set so that 95 percent of the values will fall
inside the control limits when there is only common cause variation.
The Cranston Company recently met with a group of its customers to ask questions
about the service and products provided by the company. The data collected in this
process would be an example of data collected through direct observation.

The Wilcoxon signed rank test is used to test hypotheses about the population median.
In conducting a hypothesis test where the conclusion is to reject the null hypothesis,
then either a correct decision has been made or else a Type I error.
When constructing a scatter plot, the dependent variable is placed on the vertical axis
and the independent variable is placed on the horizontal axis.
An accountant who recently examined 200 accounts from a company’s total of 4,000
accounts in an effort to estimate the percentage of all accounts that have incorrect
journal entries is using descriptive statistical analysis to reach the conclusion.
If one independent variable affects the relationship between a second independent
variable and the dependent variable, it is said that there is interaction between the two
independent variables.
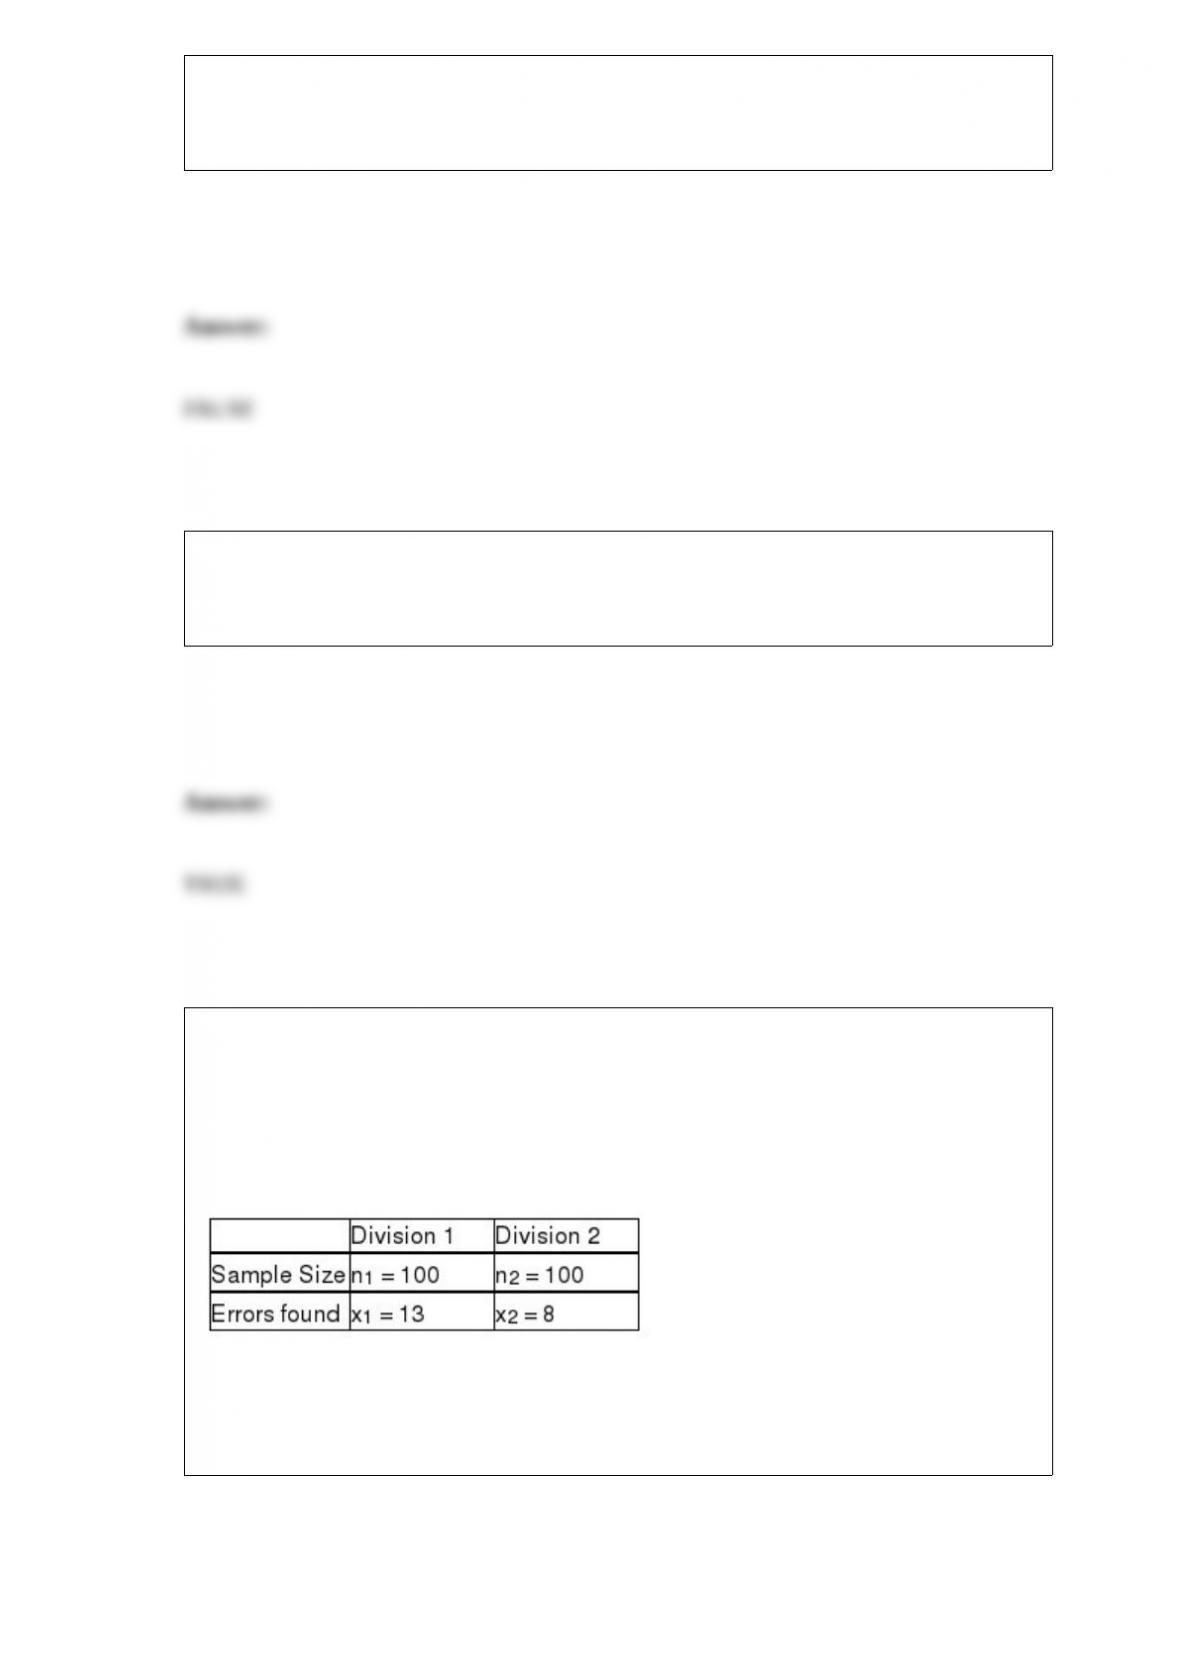
An accounting firm has been hired by a large computer company to determine whether
the proportion of accounts receivables with errors in one division (Division 1) exceeds
that of the second division (Division 2). The managers believe that such a difference
may exist because of the lax standards employed by the first division. To conduct the
test, the accounting firm has selected random samples of accounts from each division
with the following results.
Based on this information and using a significance level equal to 0.05, the test statistic
for the hypothesis test is approximately 1.153 and, therefore, the null hypothesis is not
rejected.

A stable process is one that has had all its variation removed through quality
improvement efforts on the part of the organization.
In a one-way analysis of variance design, the total variation in the data across the
various factor levels can be partitioned into two parts, the within sample variation and
the between sample variation.
The Colbert Real Estate Agency has determined the number of home showings given by
its agents is the same each day of the week. Then the variable, number of showings, is a
continuous distribution.
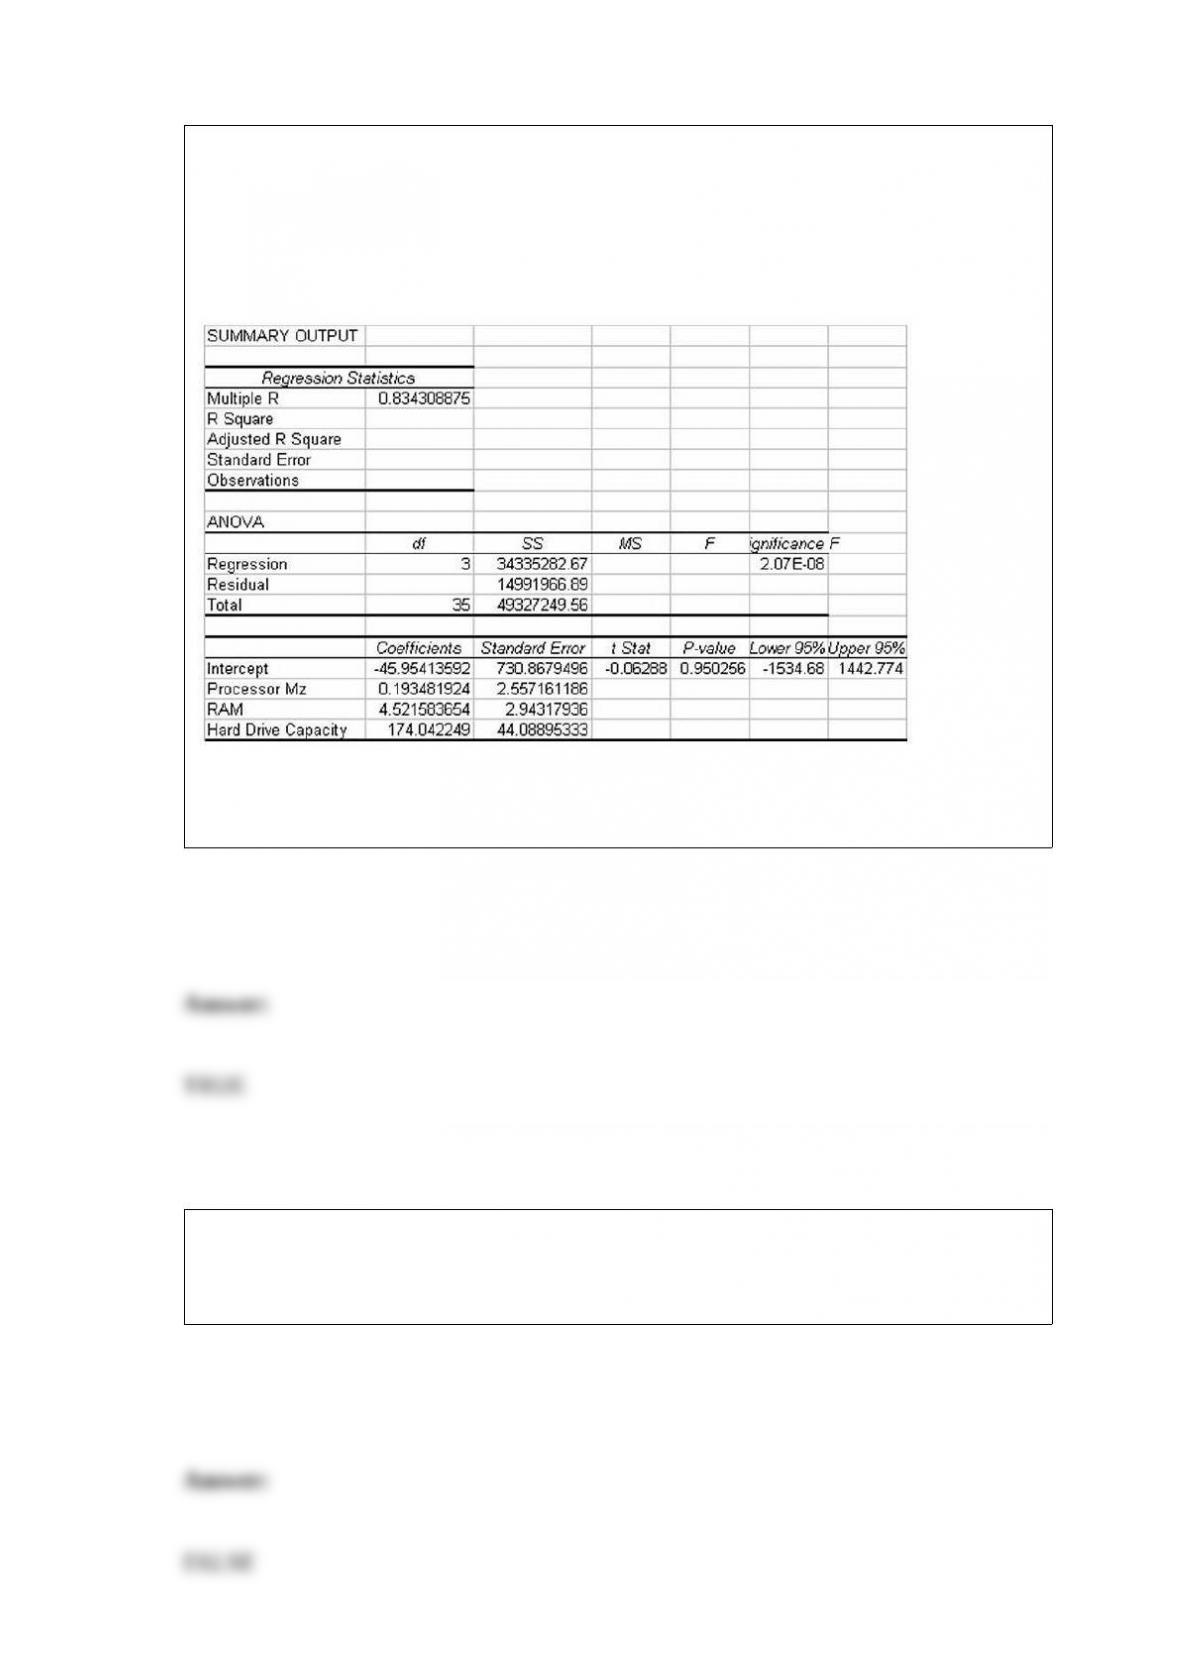
A study has recently been conducted by a major computer magazine publisher in which
the objective was to develop a multiple regression model to explain the variation in
price of personal computers. Three independent variables were used. The following
computer printout shows the final output. However, several values are omitted from the
printout.
Given this information, using an alpha = .05 level, you can conclude that the overall
regression model is statistically significant.
To find a confidence interval for the difference between the means of independent
samples, when the variances are unknown but assumed equal, the sample sizes of the
two groups must be the same.
Suppose 10 students are enrolled in a class and the probability of at least 8 showing up
on a given day is 90 percent. Then the probability of 7 or fewer showing that day is 10
percent.
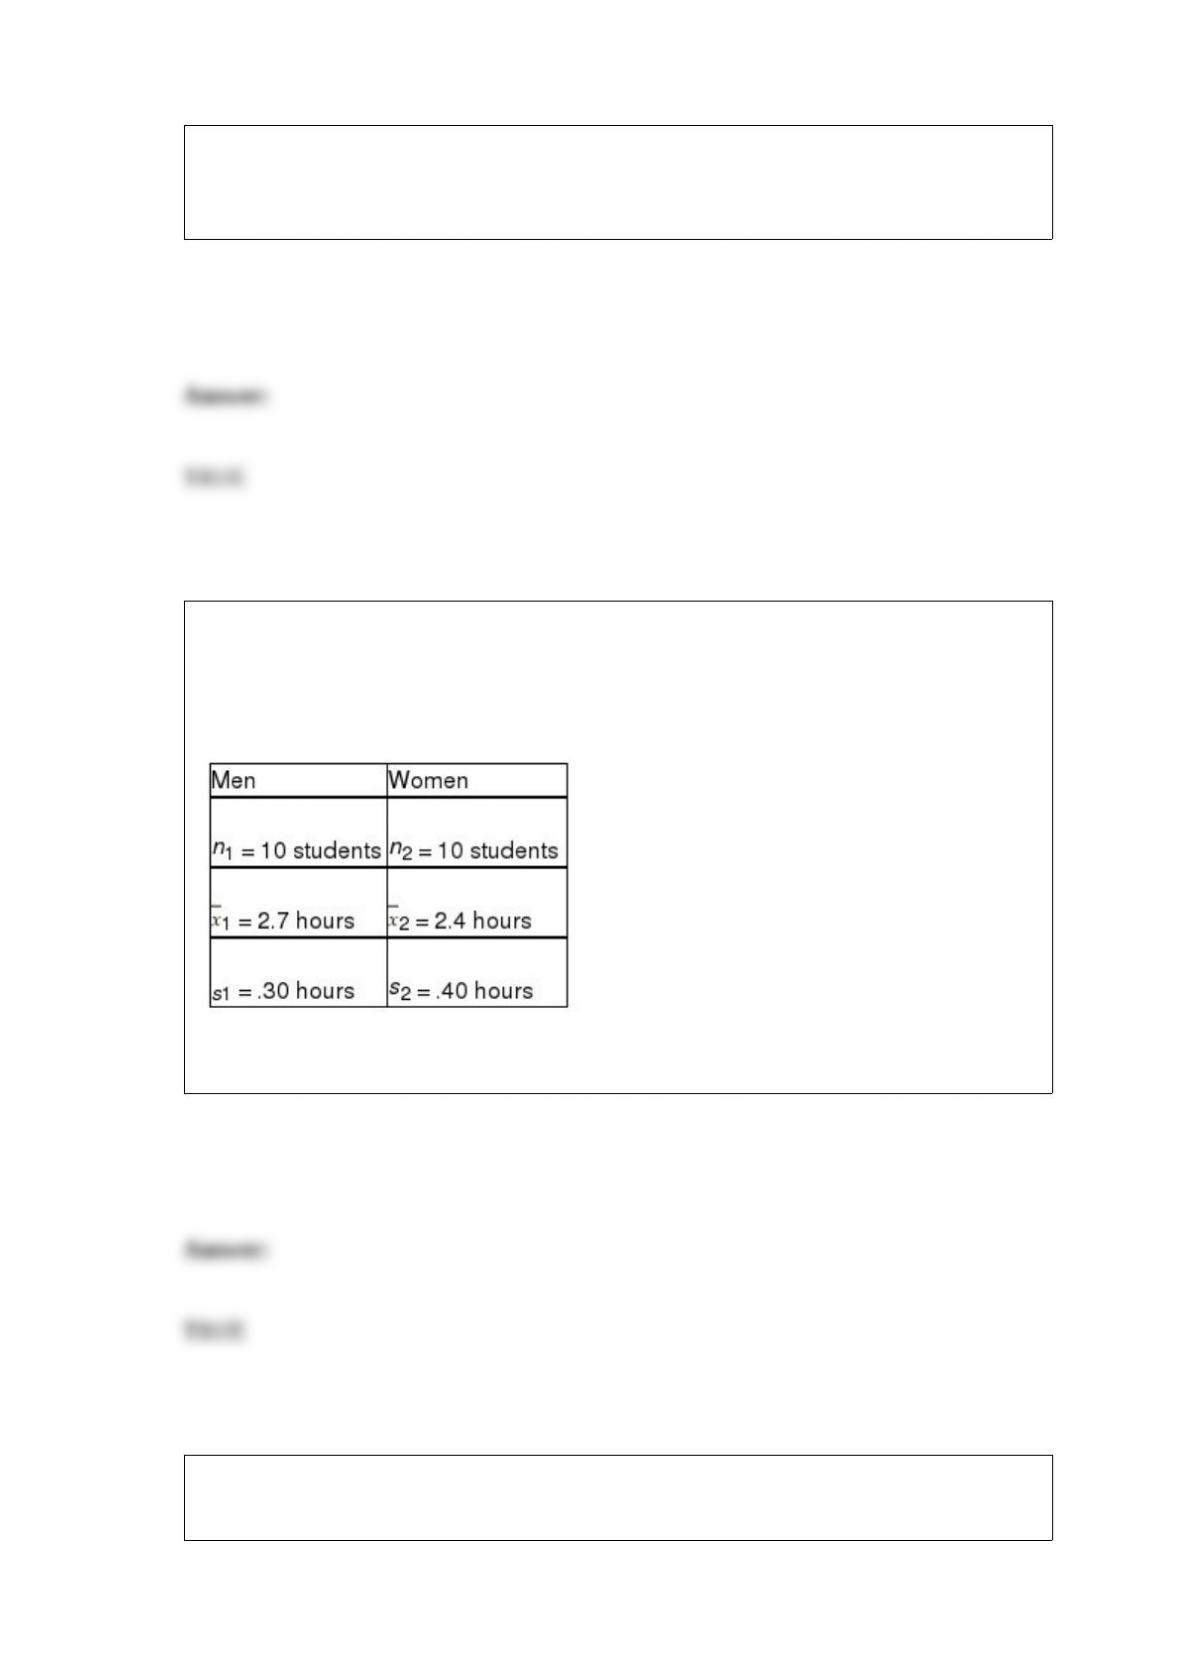
The NCAA is interested in estimating the difference in mean number of daily training
hours for men and women athletes on college campuses. They want 95 percent
confidence and will select a sample of 10 men and 10 women for the study. The sample
results are:
Based on these data, the point estimate is .30 hours.
Whenever possible, in establishing the null and alternative hypotheses, the research
hypothesis should be made the alternative hypothesis.

If a stepwise regression approach is used to enter, one at a time, four variables into a
regression model, the resulting regression equation may differ from the regression
equation that occurs when all four of the variables are entered at one step.
The statistical process control (SPC) chart is one of the most important tools for
identifying important issues to improve quality.
Suppose the standard deviation for a given sample is known to be 20. If the data in the
sample are doubled, the standard deviation will be 40.
Typically, a continuous random variable is one whose value is determined by
measurement instead of counting.
The time required to assemble two components into a finished part is recorded for each
employee at the plant. The resulting random variable is an example of a continuous
random variable.
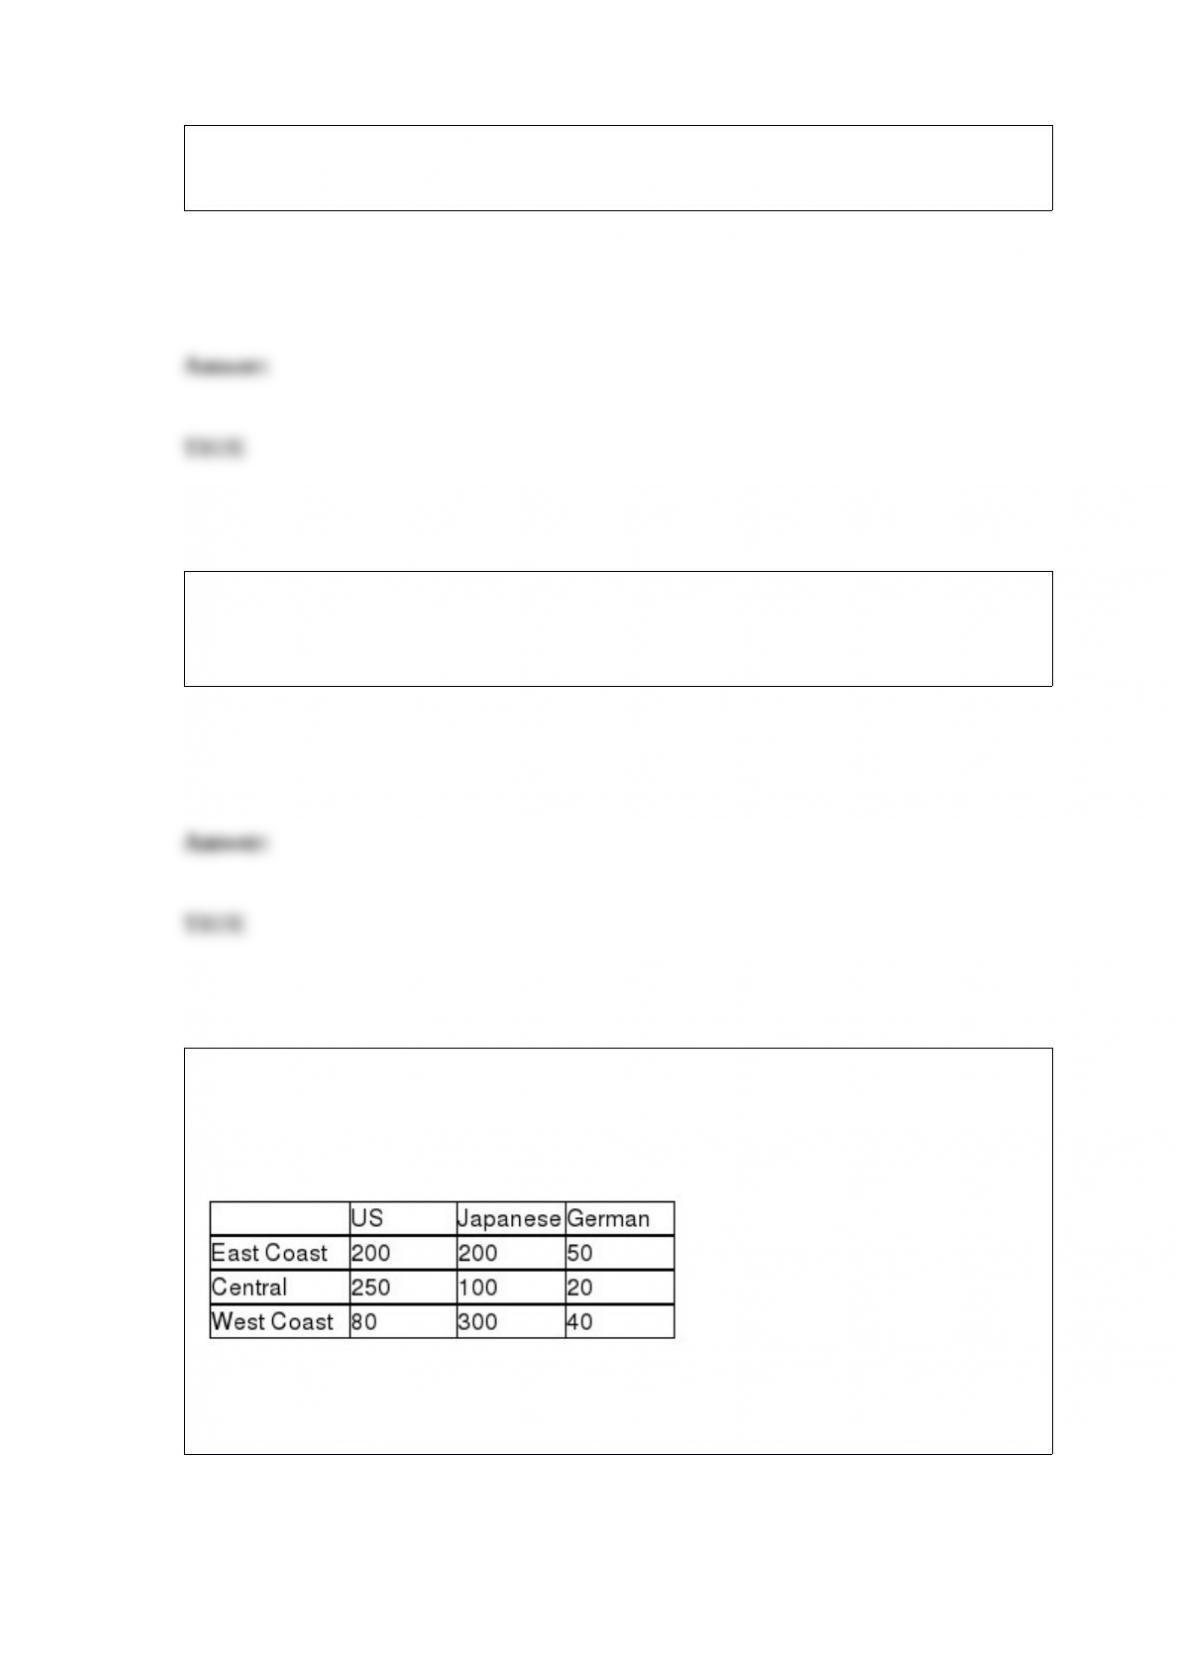
A study was recently done in the United States in which car owners were asked to
indicate whether their most recent car purchase was a U.S. car, a German car, or a
Japanese car. The people in the survey were divided by geographic region in the United
States. The following data were recorded.
Given this situation, the null hypothesis to be tested is that the car origin is dependent
on the geographical location of the buyer.

Kruskal-Wallis One-Way Analysis of Variance is the nonparametric counterpart to the
one-way ANOVA procedure in which the assumptions of normally distributed
populations with equal variances are satisfied.
The Brockingham Carpet Company prides itself on high quality carpets. At the end of
each day, the company quality managers select 3 square yards for inspection. The
quality standard requires an average of no more than 2.3 defects per square yard. The
expected number of defects that the inspector will find during the inspection is 6.9.
Regardless of the value of the population proportion, p, (with the obvious exceptions of
p = 0 and p = 1) the sampling distribution for the sample proportion, will be
approximately normally distributed providing that the sample size is large enough.

A warehouse contains 5 parts made by the Stafford Company and 8 parts made by the
Wilson Company. If an employee selects 3 of the parts from the warehouse at random,
the probability that none of the 3 parts is from the Wilson Company is approximately .
03496.
If the correlation between two variables is known to be statistically significant at the
0.05 level, then the regression slope coefficient will also be significant at the 0.05 level.
A study was recently done in the United States in which car owners were asked to
indicate whether their most recent car purchase was a U.S. car, a German car, or a
Japanese car. The people in the survey were divided by geographic region in the United
States. The following data were recorded.
Given this situation, to test whether the car origin is independent of the geographical
location of the buyer, the expected number of people in the sample who bought a

German made car and who lived on the East Coast is just under 40 people.
It is very unlikely that a nonstatistical sample will ever provide less sampling error than
a statistical sample of the same size.
Assume you are conducting a two-tailed Mann-Whitney U test for a small sample and
have found that U1 = 58 and U2 = 86. What is the value of the test statistic?
A) 58
B) 86
C) 72
D) 144

A study recently conducted by a marketing firm analyzed three different advertising
designs (factor A) and four different income levels (factor B) of potential customers. At
each combination of factor A and factor B, 5 customers are observed and the number of
products produced is recorded. Interaction between the two factors would exist if low
income customers have higher mean buying when design 1 is used, but higher income
customers have higher mean buying when designs 2 and 3 are used.
The Kruskal-Wallis test is usually limited to comparing sample values from ________
or more populations.
A) 2
B) 3
C) 4
D) 5
A stem and leaf diagram is an alternative to using:
A) a pie chart.
B) a bar chart.
C) a histogram.
D) an ogive.
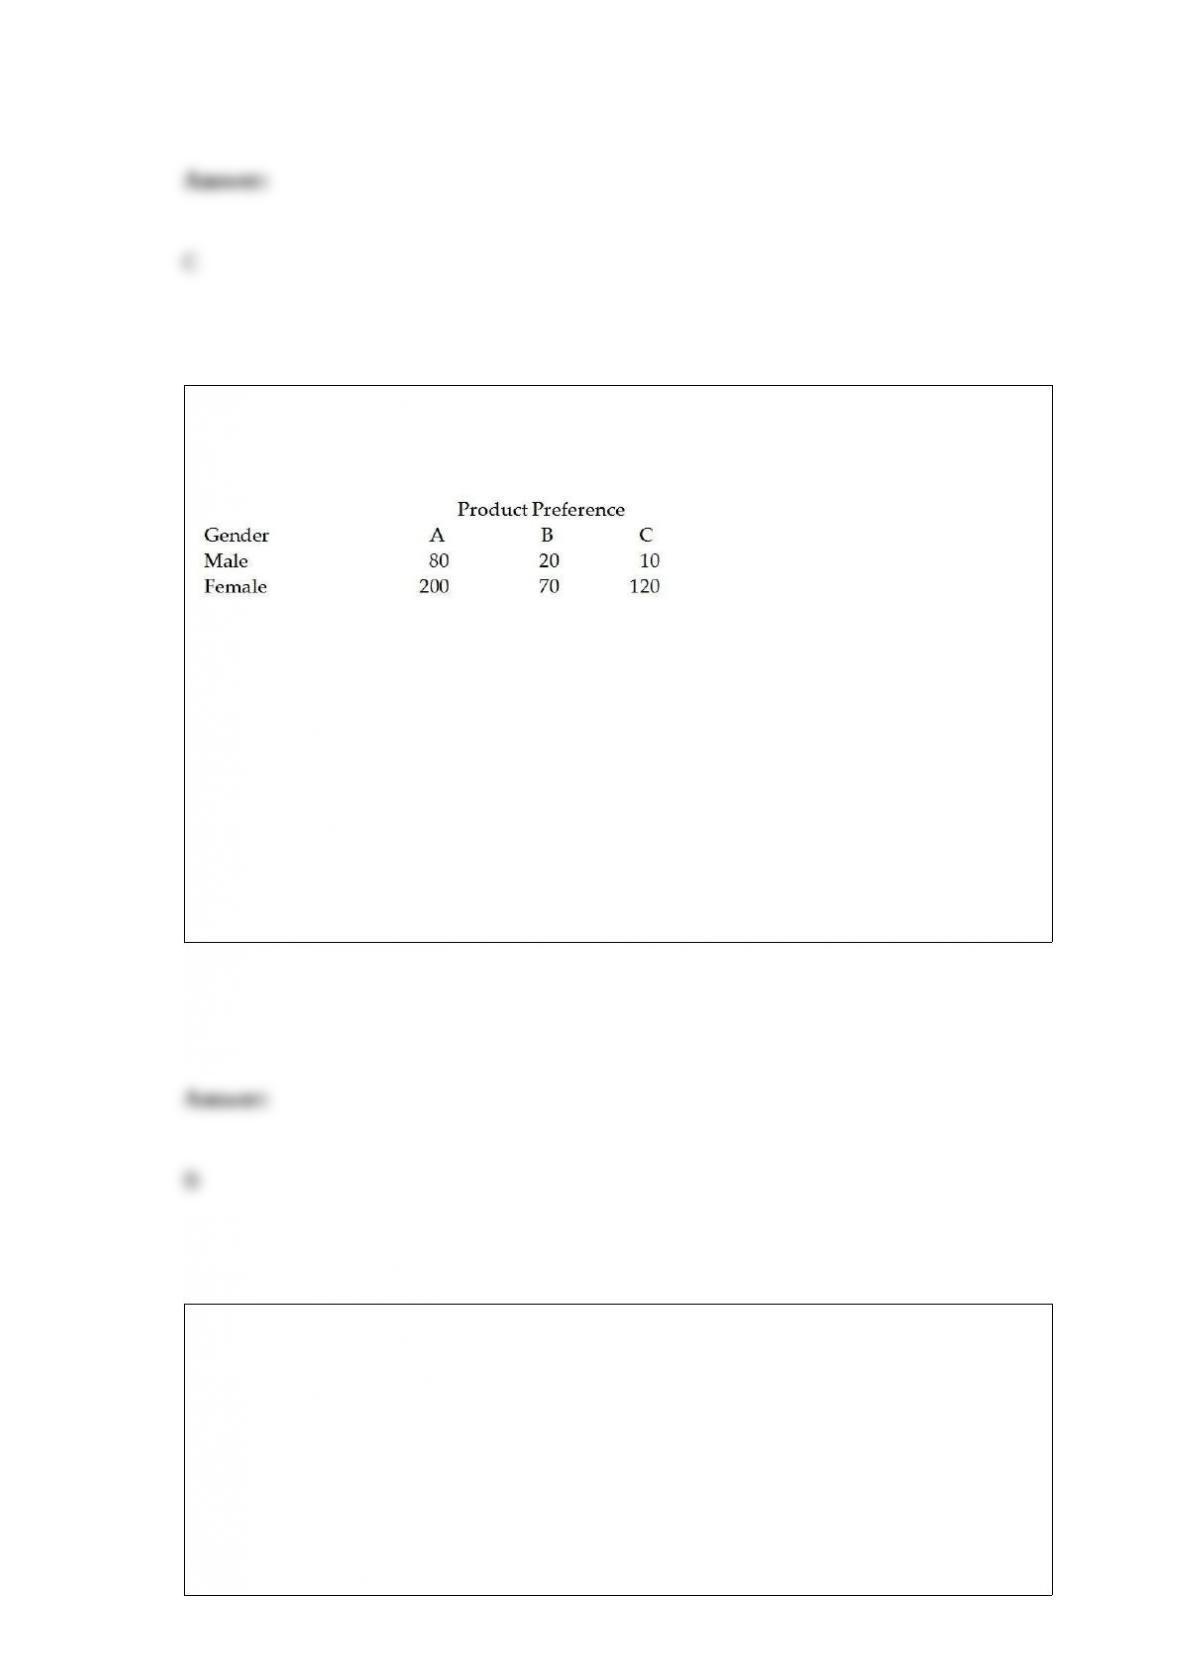
A study was recently done in which 500 people were asked to indicate their preferences
for one of three products. The following table shows the breakdown of the responses by
gender of the respondents.
Based on these data, the probability that a person in the population will prefer product A
can be assessed as:
A) 0.18
B) 0.56
C) 0.286
D) 0.16
An Internet service provider wants to determine its level of customer satisfaction. The
best data collection method to obtain the results most quickly is:
A) experiment.
B) telephone survey.
C) mailed survey.

D) personal interview.
A college data base includes the number of people who are enrolled in each class the
college offers. This is an example of:
A) nominal data.
B) ordinal data.
C) interval data.
D) ratio data.
The proportion of items in a population that possess a specific attribute is known to be
0.70. If a simple random sample of size n = 100 is selected and the proportion of items
in the sample that contain the attribute of interest is 0.65, what is the sampling error?
A) -0.03
B) -0.05
C) 0.08
D) 0.01

Three events occur with probabilities P(E1) = 0.35, P(E2) = 0.15, P(E3) = 0.40. If the
event B occurs, the probability becomes P(E1|B) = 0.25, P(B) = 0.30.
Assume that E1, E2, and E3 are independent events. Calculate P(E1 and E2 and E3).
A) 0.575
B) 0.075
C) 0.021
D) 0.475
A histogram is most commonly used to analyze which of the following?
A) Nominal level data
B) Quantitative data
C) Time-series data
D) Ordinal data

Which of the following is a false statement?
A) A bar chart is usually constructed so that gaps exist between the bars.
B) The bars on a bar chart can be different colors.
C) A histogram is usually constructed without gaps between the bars.
D) A bar chart and histogram can typically be used interchangeably.
In an article entitled “Fuel Economy Calculations to Be Altered,” James R. Healey
indicated that the government planned to change how it calculates fuel economy for
new cars and trucks. This is the first modification since 1985. It is expected to lower
average mileage for city driving in conventional cars from 10% to 20%. AAA has
forecast that the 2008 Ford F-150 would achieve 15.7 mile per gallon (mpg). The 2008
Ford F-150 was tested by AAA members driving the vehicle themselves and was found
to have an average of 14.3 mpg. Assume that the mean obtained by AAA members is
the true mean for the population of 2008 Ford F-150 trucks and that the population
standard deviation is 5 mpg. Suppose 100 AAA members were to test the 2008 F-150.
Determine the probability that the average mpg would be at least 15.7.
A) 0.0026
B) 0.0121
C) 0.0451
D) 0.0001

Students who have completed a speed reading course have reading speeds that are
normally distributed with a mean of 950 words per minute and a standard deviation
equal to 220 words per minute. If two students were selected at random, what is the
probability that they would both read at less than 400 words per minute?
A) 0.4938
B) 0.0062
C) 0.00004
D) 0.2438
Recently, a major tire manufacturer stated in its advertising that its tires with a new tire
tread design will last more than 50,000 miles on average. A consumer agency collected
a subset of these tires and tested them in very controlled conditions. Based on this test,
the agency concluded that the manufacturer was justified in making this claim. The
process described is an example of:
A) descriptive statistics.
B) hypothesis testing.
C) statistical inference.
D) Both B and C are correct.

A house cleaning service claims that it can clean a four bedroom house in less than 2
hours. A sample of n = 16 houses is taken and the sample mean is found to be 1.97
hours and the sample standard deviation is found to be 0.1 hours. Using a 0.05 level of
significance the correct conclusion is:
A) reject the null because the test statistic (-1.2) is < the critical value (1.7531).
B) do not reject the null because the test statistic (1.2) is > the critical value (-1.7531).
C) reject the null because the test statistic (-1.7531) is < the critical value (-1.2).
D) do not reject the null because the test statistic (-1.2) is > the critical value (-1.7531).
Assuming that the change in daily closing prices for stocks on the New York Stock
Exchange is a random variable that is normally distributed with a mean of $0.35 and a
standard deviation of $0.33. Based on this information, what is the probability that a
randomly selected stock will be lower by $0.40 or more?
A) 2.27
B) 0.4884
C) 0.0116
D) 0.9884

A public policy research group is conducting a study of health care plans and would like
to estimate the average dollars contributed annually to health savings accounts by
participating employees. A pilot study conducted a few months earlier indicated that the
standard deviation of annual contributions to such plans was $1,225. The research
group wants the study’s findings to be within $100 of the true mean with a confidence
level of 90%. What sample size is required?
A) 407
B) 361
C) 512
D) 546
Which of the following statements is true?
A) The interval estimate for predicting a particular value of y given a specific x will be
narrower than the interval estimate for the average value of y given a particular x.
B) The higher the r-square value, the wider will be the prediction interval based on a
simple linear regression model.
C) The prediction interval generated from a simple linear regression model will be
narrowest when the value of x used to generate the predicted y value is close to the
mean value of x.
D) The prediction interval generated from a simple linear regression model will be
widest when the value of x used to generate the predicted y value is close to the mean
value of x.

Which of the following is NOT an assumption for the simple linear regression model?
A) The individual error terms are statistically independent.
B) The distribution of the error terms will be skewed left or right depending on the
shape of the dependent variable.
C) The error terms have equal variances for all values of the independent variable.
D) The mean of the dependent variable value for all levels of x can be connected by a
straight line.
Sampling error occurs when:
A) a nonstatistical sample is used.
B) the statistic computed from the sample is not equal to the parameter for the
population.
C) a random sample is used rather than a convenience sample.
D) a confidence interval is used to estimate a population value rather than a point
estimate.

The produce manager for a large retail food chain is interested in estimating the
percentage of potatoes that arrive on a shipment with bruises. A random sample of 150
potatoes showed 14 with bruises. Based on this information, what is the margin of error
for a 95 percent confidence interval estimate?
A) 0.0933
B) 0.0466
C) 0.0006
D) Can’t be determined without knowing σ.
When using regression analysis for descriptive purposes, which of the following is of
importance?
A) The size of the regression slope coefficient
B) The sign of the regression slope coefficient
C) The standard error of the regression slope coefficient
D) All of the above
The State Department of Weights and Measures is responsible for making sure that
commercial weighing and measuring devices, such as scales, are accurate so customers
and businesses are not cheated. Periodically, employees of the department go to
businesses and test their scales. For example, a dairy bottles milk in 1-gallon containers.
Suppose that if the filling process is working correctly, the mean volume of all gallon
containers is 1.00 gallon with a standard deviation equal to 0.10 gallon. Based on this
information, if the department employee selects a random sample of n = 9 containers,
what is the probability that the mean volume for the sample will be greater than 1.01
gallons?
A) 0.3821
B) 0.1179
C) 0.6179
D) 0.2358
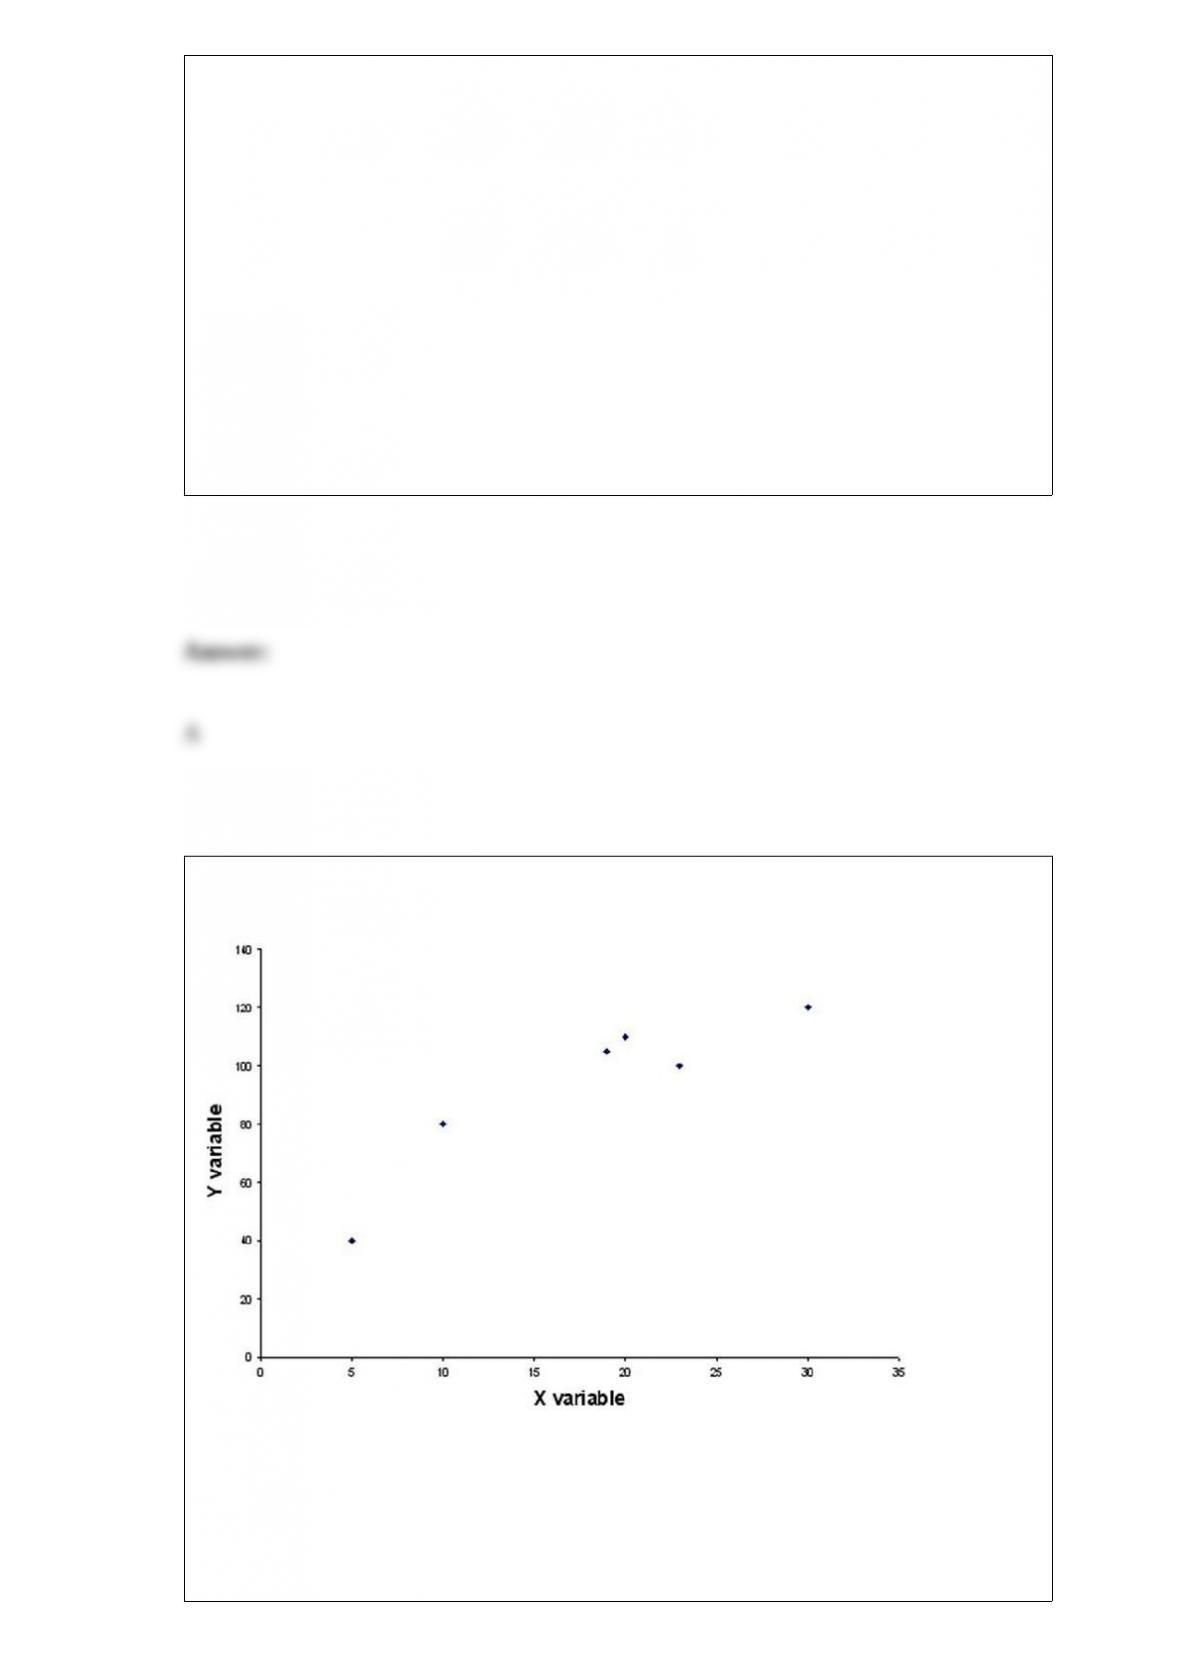
Consider the following chart. Which of the following statements is most correct?
A) The values for the dependent variable are determined by the values for the
independent variable.
B) The values in a scatter plot should be connected by a straight line.

C) The variable on the horizontal axis should be the independent variable.
D) A scatter plot like this one shows the trend in the data over time.
Ponderosa Paint and Glass carries three brands of paint. A customer wants to buy
another gallon of paint to match paint she purchased at the store previously. She can’t
recall the brand name and does not wish to return home to find the old can of paint. So
she selects two of the three brands of paint at random and buys them.
Her husband also goes to the paint store and fails to remember what brand to buy. So he
also purchases two of the three brands of paint at random. Determine the probability
that both the woman and her husband fail to get the correct brand of paint. (Hint: Are
the husband’s selections independent of his wife’s selections?)
A) 3/2
B) 2/3
C) 1/9
D) 3/4
Nonparametric statistical tests are used when:
A) the sample sizes are small.
B) we are unwilling to make the assumptions of parametric tests.

C) the standard normal distribution cannot be computed.
D) the population parameters are unknown.
According to the most recent Labor Department data, 10.5% of engineers (electrical,
mechanical, civil, and industrial) were women. Suppose a random sample of 50
engineers is selected. How likely is it that the random sample of 50 engineers will
contain 8 or more women in these positions?
A) 0.1612
B) 0.0821
C) 0.1020
D) 0.0314
A pilot sample of 75 items was taken, and the number of items with the attribute of
interest was found to be 15. How many more items must be sampled to construct a 99%
confidence interval estimate for p with a 0.025 margin of error?
A) 1512
B) 1612
C) 1698

D) 1623
Contingency analysis is used only for numerical data.
A corporation has 11 manufacturing plants. Of these, 7 are domestic and 4 are located
outside the United States. Each year a performance evaluation is conducted for 4
randomly selected plants.
What is the probability that a performance evaluation will contain 3 plants from the
United States?
A) 0.4242
B) 0.3776
C) 0.3523
D) 0.4696

Consider a random variable, z, that has a standardized normal distribution. Determine
P(z > 1.645).
A) 0.05
B) 0.01
C) 0.03
D) 0.45
The term that is given when two variables are correlated but there is no apparent
connection between them is:
A) spontaneous correlation.
B) random correlation.
C) spurious correlation.
D) linear correlation.