
In determining the sample size to estimate a population proportion, as p approaches .5,
the calculated value of the sample size ______________.
A. stays the same
B. decreases
C. increases
The EPA has stipulated that the Pollution Standard Index (PSI) for clean air standards is
to average no more than 100. A random sample of 9 days for the city of Acorn showed
PSI readings of 144, 85, 90, 120, 150, 105, 93, 130, and 115. Assume the population of
PSI readings is highly nonnormal. The EPA wants to determine if there is significant
evidence to conclude that Acorn’s air is dirtier than the stipulated clean air standards.
Which one of the following tests is appropriate for this problem?
A. Wilcoxon signed ranks test
B. Wilcoxon rank sum test
C. sign test
D. Kruskal-Wallis test
E. Spearman’s rank correlation test

The general form of the quadratic multiple regression models is
A. y = β1x1 + β2x2 + ε
B. y = β0 + β1x1 + β2x2 + ε
C. y = β0 + β1x + β2x2 + ε
D. y = β0 + β1x2 + ε
E. y = β0 + β1x1 +β2x2
2+ ε
The graph of the prediction equation obtained from the model y = β0 + β1X1 + β2X1
2 +
εis a(n) ____________.
A. line
B. plane
C. parabola
D. exponential curve
A data set provides information about some group of individual _____________.
A. variables

B. elements
C. statistics
D. measurements
An insurance company will insure a $75,000 particular automobile make and model for
its full value against theft at a premium of $1500 per year. Suppose that the probability
that this particular make and model will be stolen is 0.0075. Find the premium that the
insurance company should charge if it wants its expected net profit to be $2000.
A. $1437.50
B. $2551.25
C. $2562.50
D. $2062.50
A manufacturer of windows produces one type that has a plastic coating. The

specification limits for the plastic coating are 30 and 70. From time to time the plastic
coating can become uneven. Therefore, in order to keep the coating as even as possible,
thickness measurements are periodically taken at four different locations on the
window. 15 subgroups were observed, each consisting of four thickness measurements,
with the following results: mean of the means = = 50.05, and average range of 8.85.
Calculate the control limits for the R chart.
A. [3.07, 14.63]
B. [6.57, 11.13]
C. [0, 35.40]
D. [0, 20.20]
Observing the output of a process at fixed time intervals is referred to as ___________
sampling.
A. consecutive
B. random
C. fixed
D. periodic
Among other quality measures, the quality of an electronic component used in
manufacturing stereo speakers is monitored with a p chart. In the last 25 days, daily
samples of 60 units resulted in the following number of defective units per sample: 8, 4,
3, 7, 6, 2, 5, 3, 1, 0, 7, 4, 2, 0, 1, 6, 2, 4, 3, 1, 2, 8, 5, 6, 0. Determine the center line for

this process.
A. .06
B. .03
C. .001
D. .056
Dummy variables take on the values of _________ and are used to model the effects of
different levels of qualitative variables.
A. 1 or −1
B. 1 or 2
C. 0 or 2
D. 0 or 1
We have just performed a one-way ANOVA on a given set of data and did not reject the
null hypothesis for the ANOVA F test. Assume that we are able to perform a
randomized block design ANOVA on the same data. For the randomized block design
ANOVA, the null hypothesis for equal treatments will ___________ be rejected.
A. always
B. sometimes

C. never
It has been reported that the average time to download the home page from a
government website was 0.9 seconds. Suppose that the download times were normally
distributed with a standard deviation of 0.3 seconds. If random samples of 23 download
times are selected, describe the shape of the sampling distribution and how it was
determined.
A. normal; size of sample meets the Central Limit Theorem requirement
B. normal; the original population is normal
C. skewed; the original population is not a normal distribution
D. cannot be determined with the information that is given
A fair die is rolled 10 times. What is the average number of even number outcomes?
A. 3
B. 4
C. 5
D. 6
E. 7
___________ causes of variation may be remedied by local supervision.
A. Common
B. Assignable
C. Usual
D. Expected
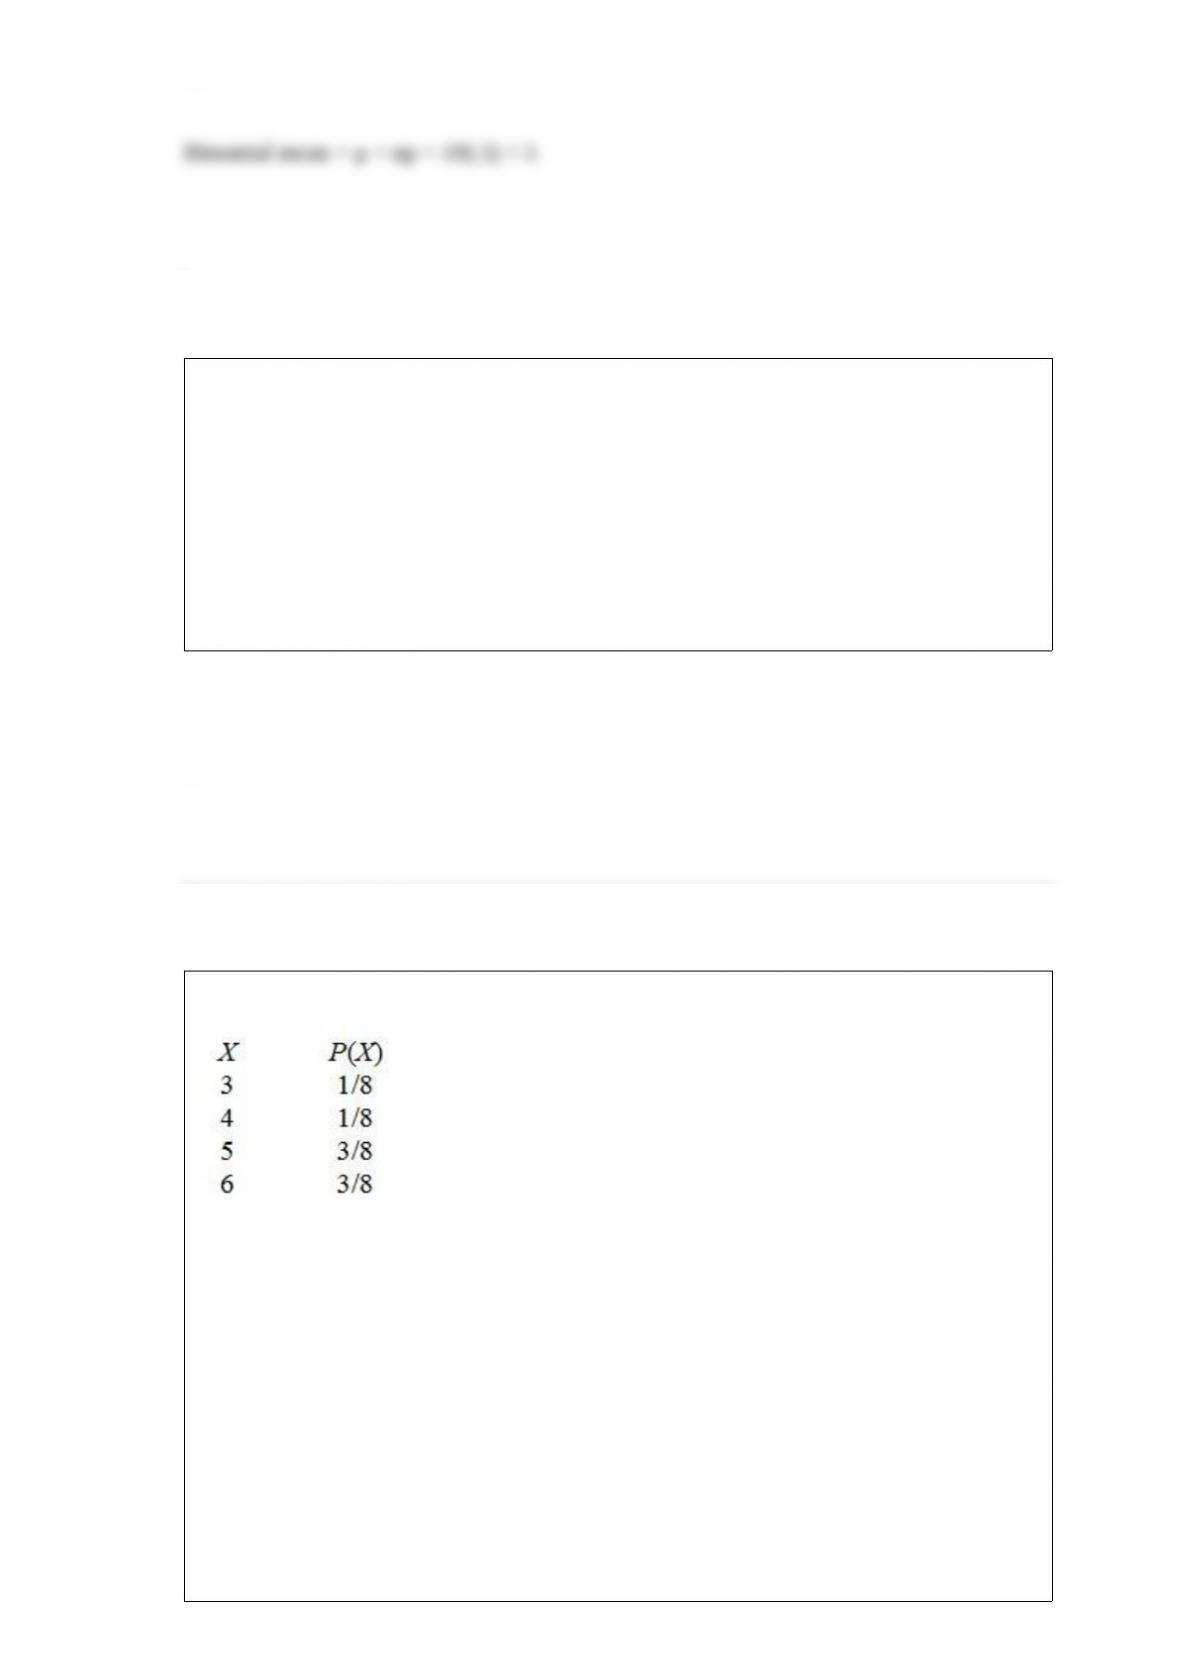
The probability distribution of X is
What is the variance of X?
A. 2.25
B. 1.0
C. 2.24
D. 5.0
E. 2.25

F. 2.24
A(n) _____________ is a graphical presentation of the current status and historical
trends of a business’s key performance indicators.
A. frequence distribution
B. histogram
C. Pareto chart
D. dashboard
When testing the difference for the population of paired differences in which two
different observations are taken on the same units, the correct test statistic to use is
____.
A. z
B. t
C. F
D. t2

In the upcoming election for governor, the most recent poll, based on 900 respondents,
predicts that the incumbent will be reelected with 55 percent of the votes. From the 900
respondents, how many indicated that they would not vote for the current governor or
indicated that they were undecided?
A. 495
B. 450
C. 405
D. 400
Events that have no sample space outcomes in common, and therefore cannot occur
simultaneously, are ____________.
A. independent
B. mutually exclusive
C. intersections
D. unions
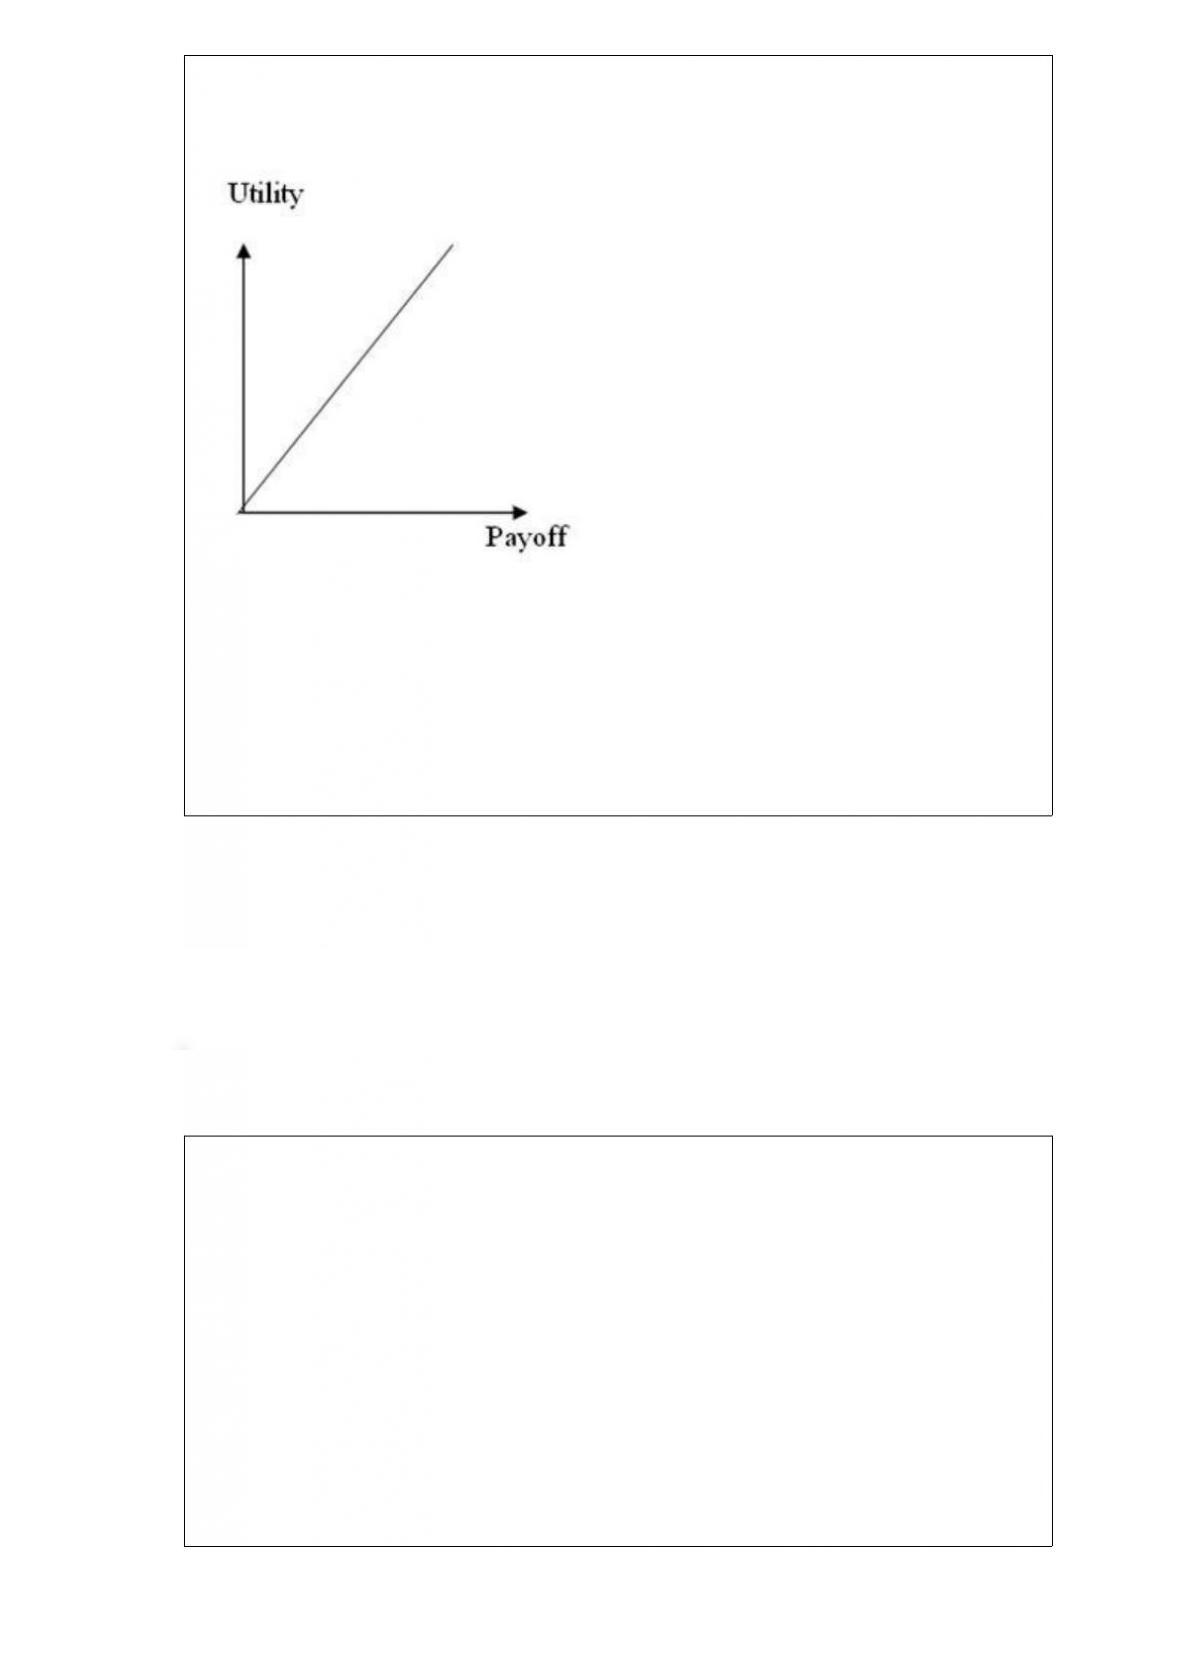
The utility curve given below represents the preferences of a _________________
decision maker.
A. risk-averse
B. risk-neutral
C. risk-seeking
D. None of the other choices is correct.
Which of the following is not an assumption for one-way analysis of variance?
A. The p populations of values of the response variable associated with the treatments
have equal variances.
B. The samples of experimental units associated with the treatments are randomly
selected.
C. The experimental units associated with the treatments are independent samples.
D. The number of sampled observations must be equal for all p treatments.
E. The distribution of the response variable is normal for all treatments.

A large disaster cleaning company estimates that 30 percent of the jobs it bids on are
finished within the bid time. Looking at a random sample of 8 jobs that it has
contracted, calculate the mean number of jobs completed within the bid time.
A. 4.0
B. 2.4
C. 2.0
D. 5.6
A real estate company is analyzing the selling prices of residential homes in a given
community. 140 homes that have been sold in the past month are randomly selected and
their selling prices are recorded. The statistician working on the project has stated that
in order to perform various statistical tests, the data must be distributed according to a
normal distribution. In order to determine whether the selling prices of homes included
in the random sample are normally distributed, the statistician divides the data into 6
classes of equal size and records the number of observations in each class. She then
performs a chi-square goodness-of-fit test for normal distribution. The results are
summarized in the following table.
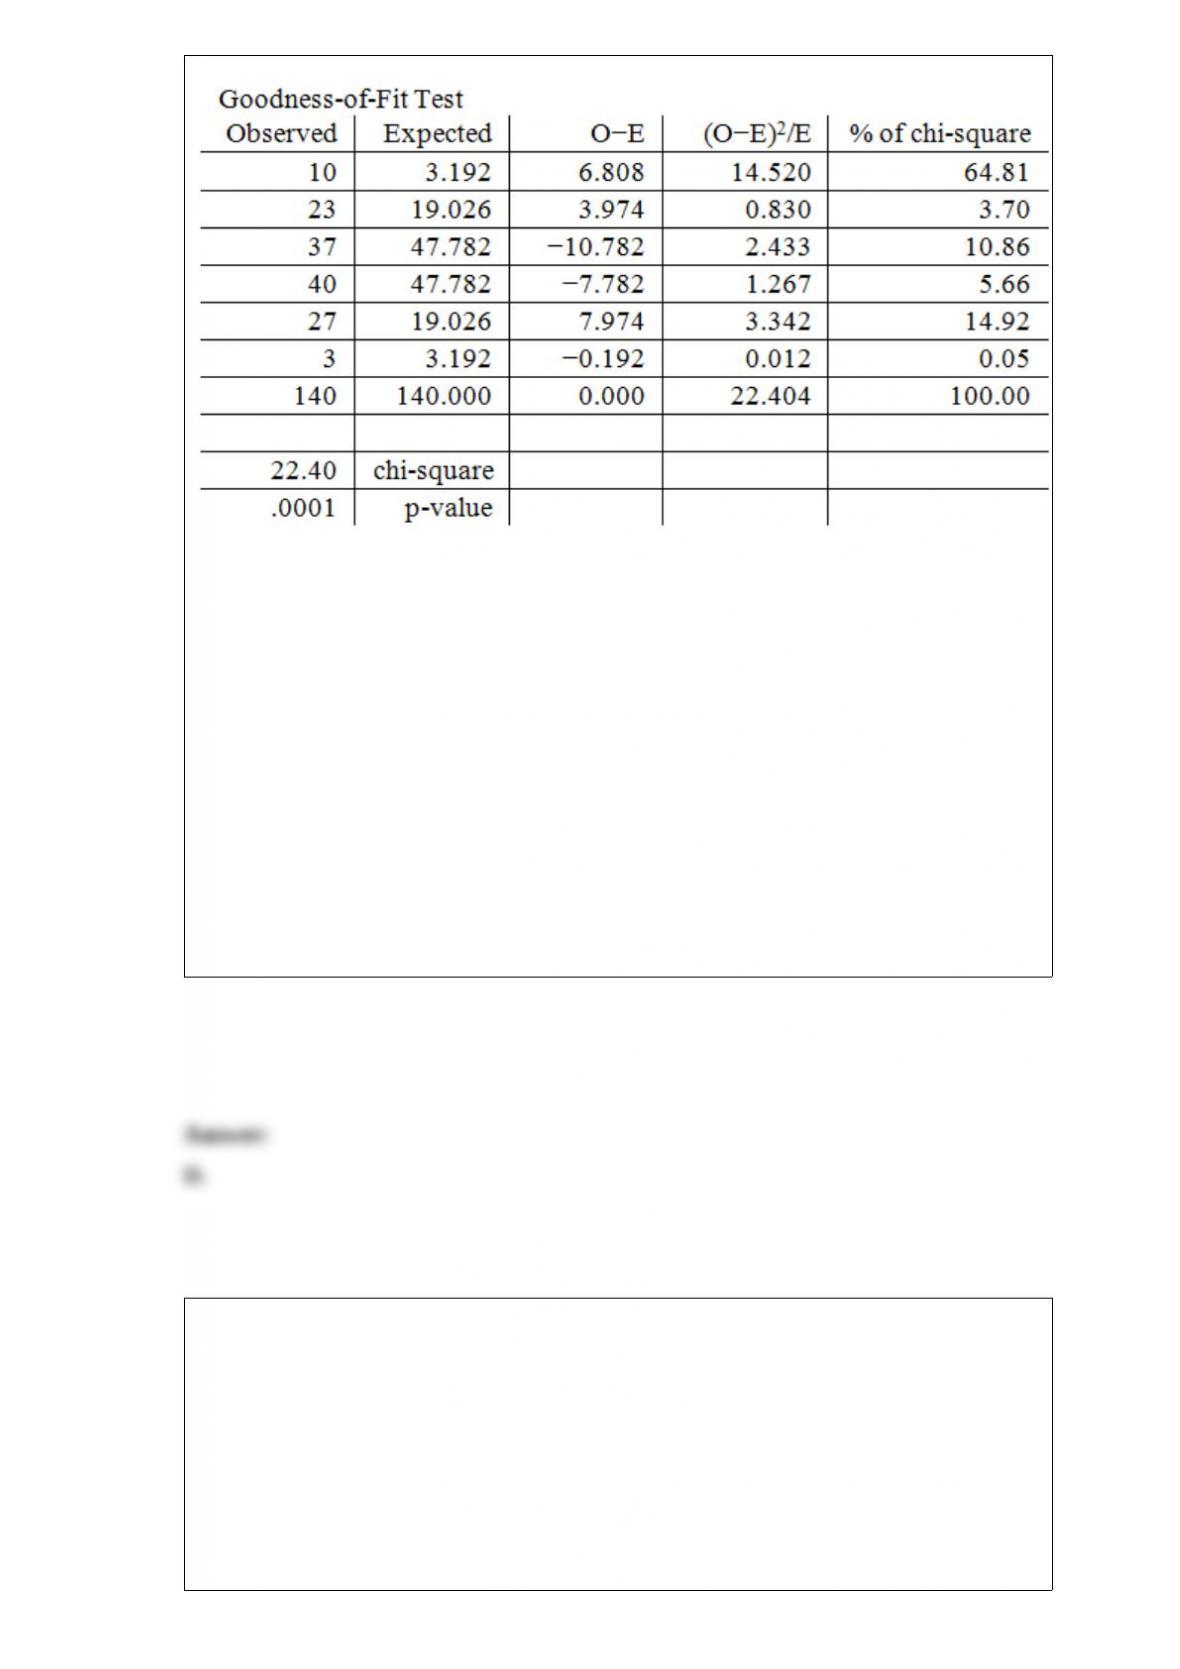
At a significance level of .05, what is the appropriate rejection point condition?
A. Reject H0 if χ2 > 12.5916
B. Reject H0 if χ2 > 11.0705
C. Reject H0 if χ2 > 9.3484
D. Reject H0 if χ2 > 7.81473
E. Reject H0 if χ2 > 9.48773
The ___________ component of a time series refers to the erratic time series
movements that follow no recognizable or regular pattern.
A. trend
B. seasonal
C. cyclical

D. irregular
If we are testing the significance of the independent variable X1 and we reject the null
hypothesis H0: β1 = 0, we conclude that
A. X1 is significantly related to y.
B. X1 is not significantly related to y.
C. X1 is an unimportant independent variable.
D. β1 is significantly related to the dependent variable y.
The area under the normal curve between z = 0 and z = 1 is ________________ the area
under the normal curve between z = 1 and z = 2.
A. less than
B. greater than
C. equal to
D. less than, greater than, or equal to, depending on the value of the mean,
E. less than, greater than, or equal to, depending on the value of the standard deviation,

If there are 120 values in a data set, how many classes should be created for a frequency
histogram?
A. 4
B. 5
C. 6
D. 7
E. 8
A plant manager knows that the number of boxes of supplies received weekly is
normally distributed with a mean of 200 and a standard deviation of 20. What
percentage of the time will the number of boxes of supplies that arrive be greater than
210 or less than 180?
A. 69.15%
B. 46.72%
C. 19.15%
D. 15.87%

The company financial officer was interested in the average cost of PCs that had been
purchased in the past six months. She took a random sample of the price of 10
computers, with the following results.
$3,250, $1,127, $2,995, $3,250, $3,445, $3,449, $1,482, $6,120, $3,009, $4,000
What are the lower and upper limits?
A. 2541, 3903
B. 2768, 3676
C. 2087, 4357
D. 2314, 4130
E. 1633, 2087
According to data from the state blood program, 40 percent of all individuals have
group A blood. If six individuals give blood, find the probability that at least 3 of the
individuals have group A blood.
A. .8208
B. .5443
C. .4557
D. .1792

The Durbin-Watson statistic is used to detect _____________.
A. first-order autocorrelation
B. exponential smoothing
C. multiplicative decomposing
D. irregular variation
While conducting experiments, a marine biologist selects water depths from a
uniformly distributed collection that vary between 2.00 m and 7.00 m. What is the
probability that a randomly selected depth is between 2.25 m and 5.00 m?
A. .79
B. .45
C. .55
D. .50

An identification of police officers by rank would represent a(n) ____________ level of
measurement.
A. nominative
B. ordinal
C. interval
D. ratio
When computing confidence intervals using the Tukey procedure, for all possible
pairwise comparisons of means, the experimentwise error rate will be
A. equal to α.
B. less than α.
C. greater than α.
The least squares regression line minimizes the sum of the
A. differences between actual and predicted Y values.
B. absolute deviations between actual and predicted Y values.
C. absolute deviations between actual and predicted X values.
D. squared differences between actual and predicted Y values.
E. squared differences between actual and predicted X values.
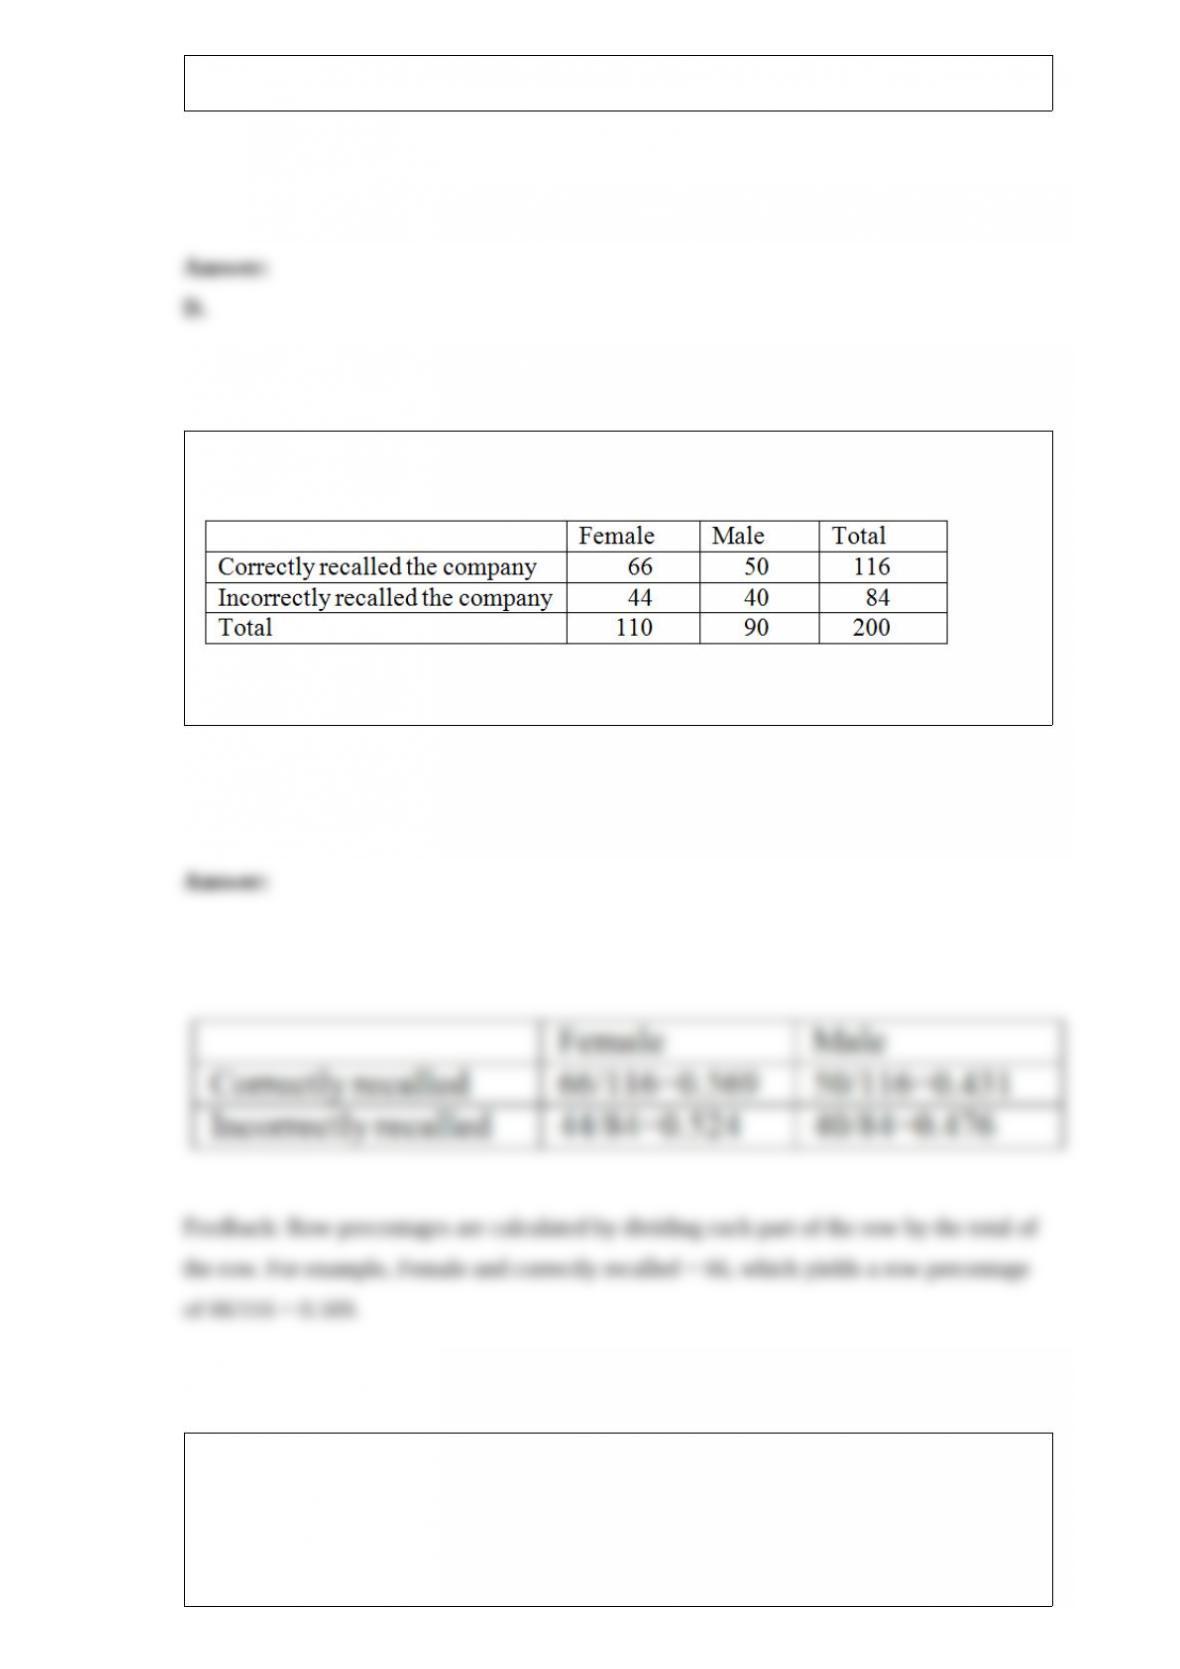
Recently an advertising company called 200 people and asked them to identify the
company that was in an ad running nationwide. They obtained the following results.
Construct a table of row percentages.
Consider a two-way analysis of variance experiment with treatment factors A and B.
The results are summarized below.
Source of Variation df SS
Factor A 4 86
Factor B 5 75
Interaction 20 75
Error 90 300
Total 119 536
What are the levels of Factor A and Factor B?
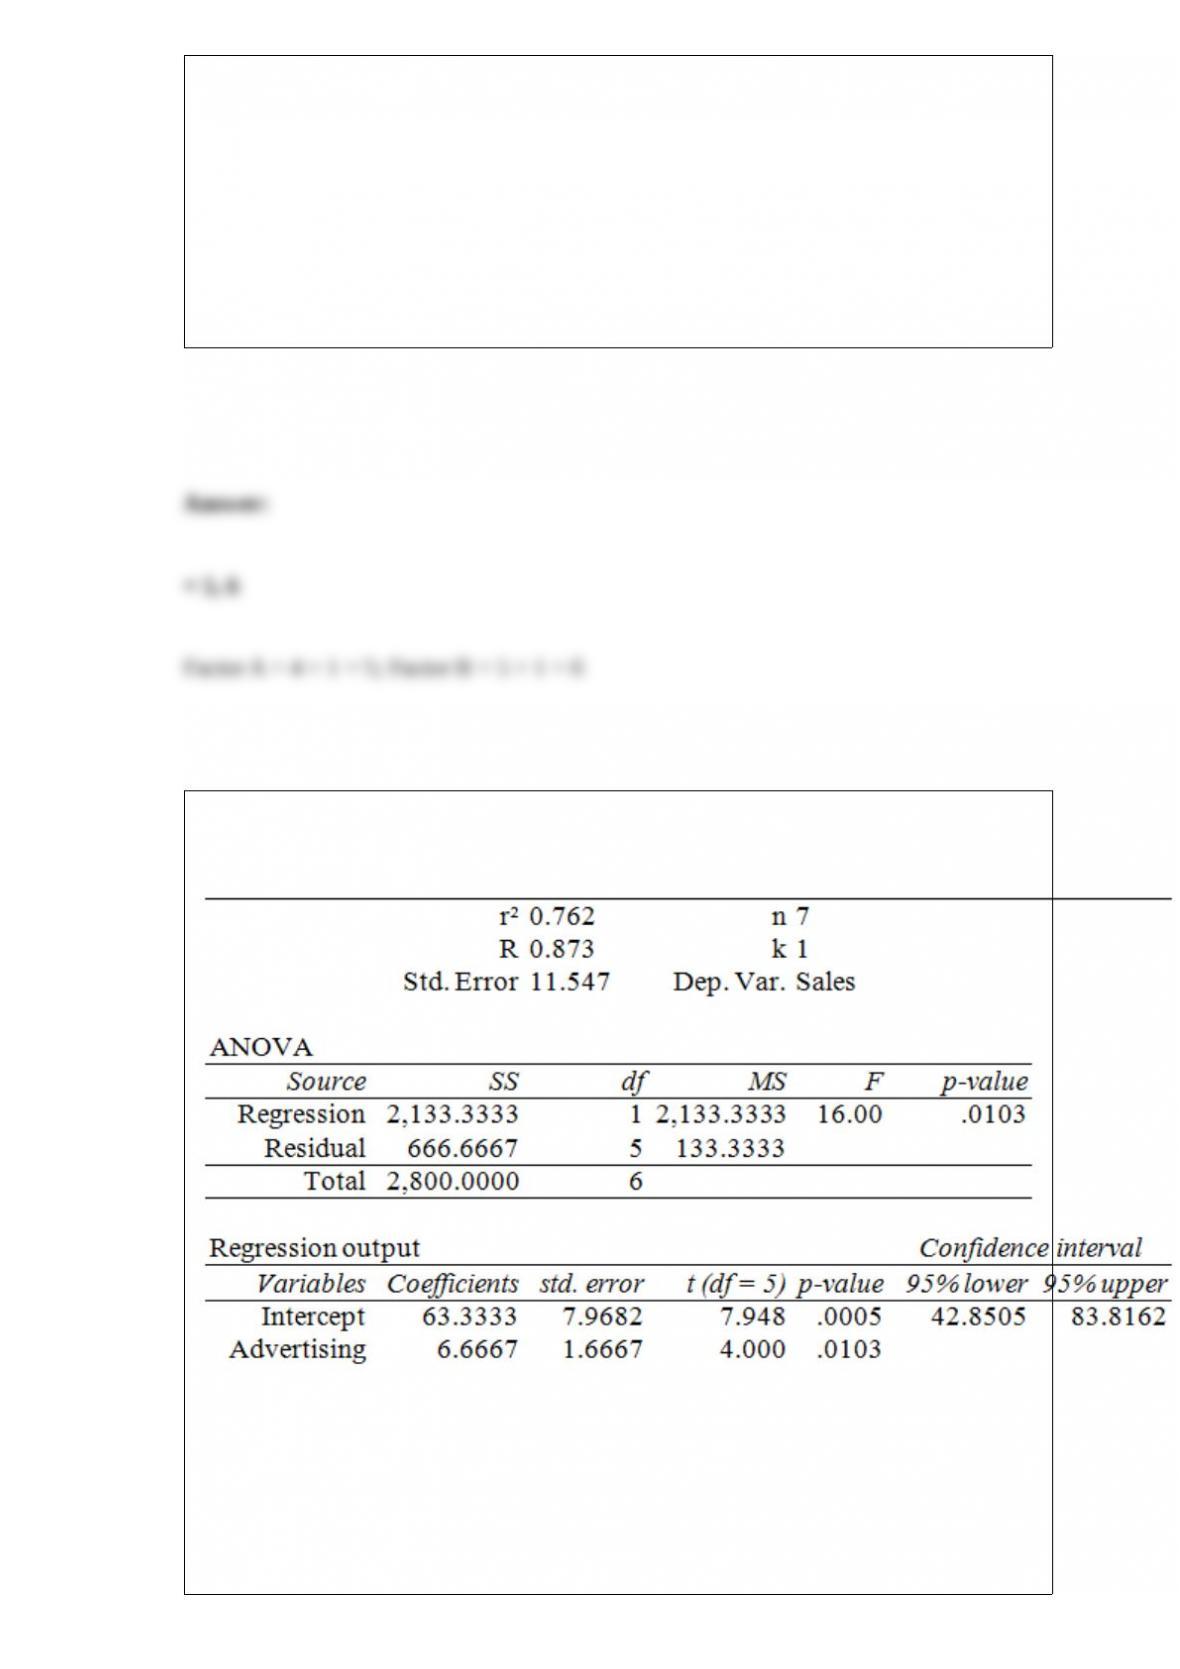
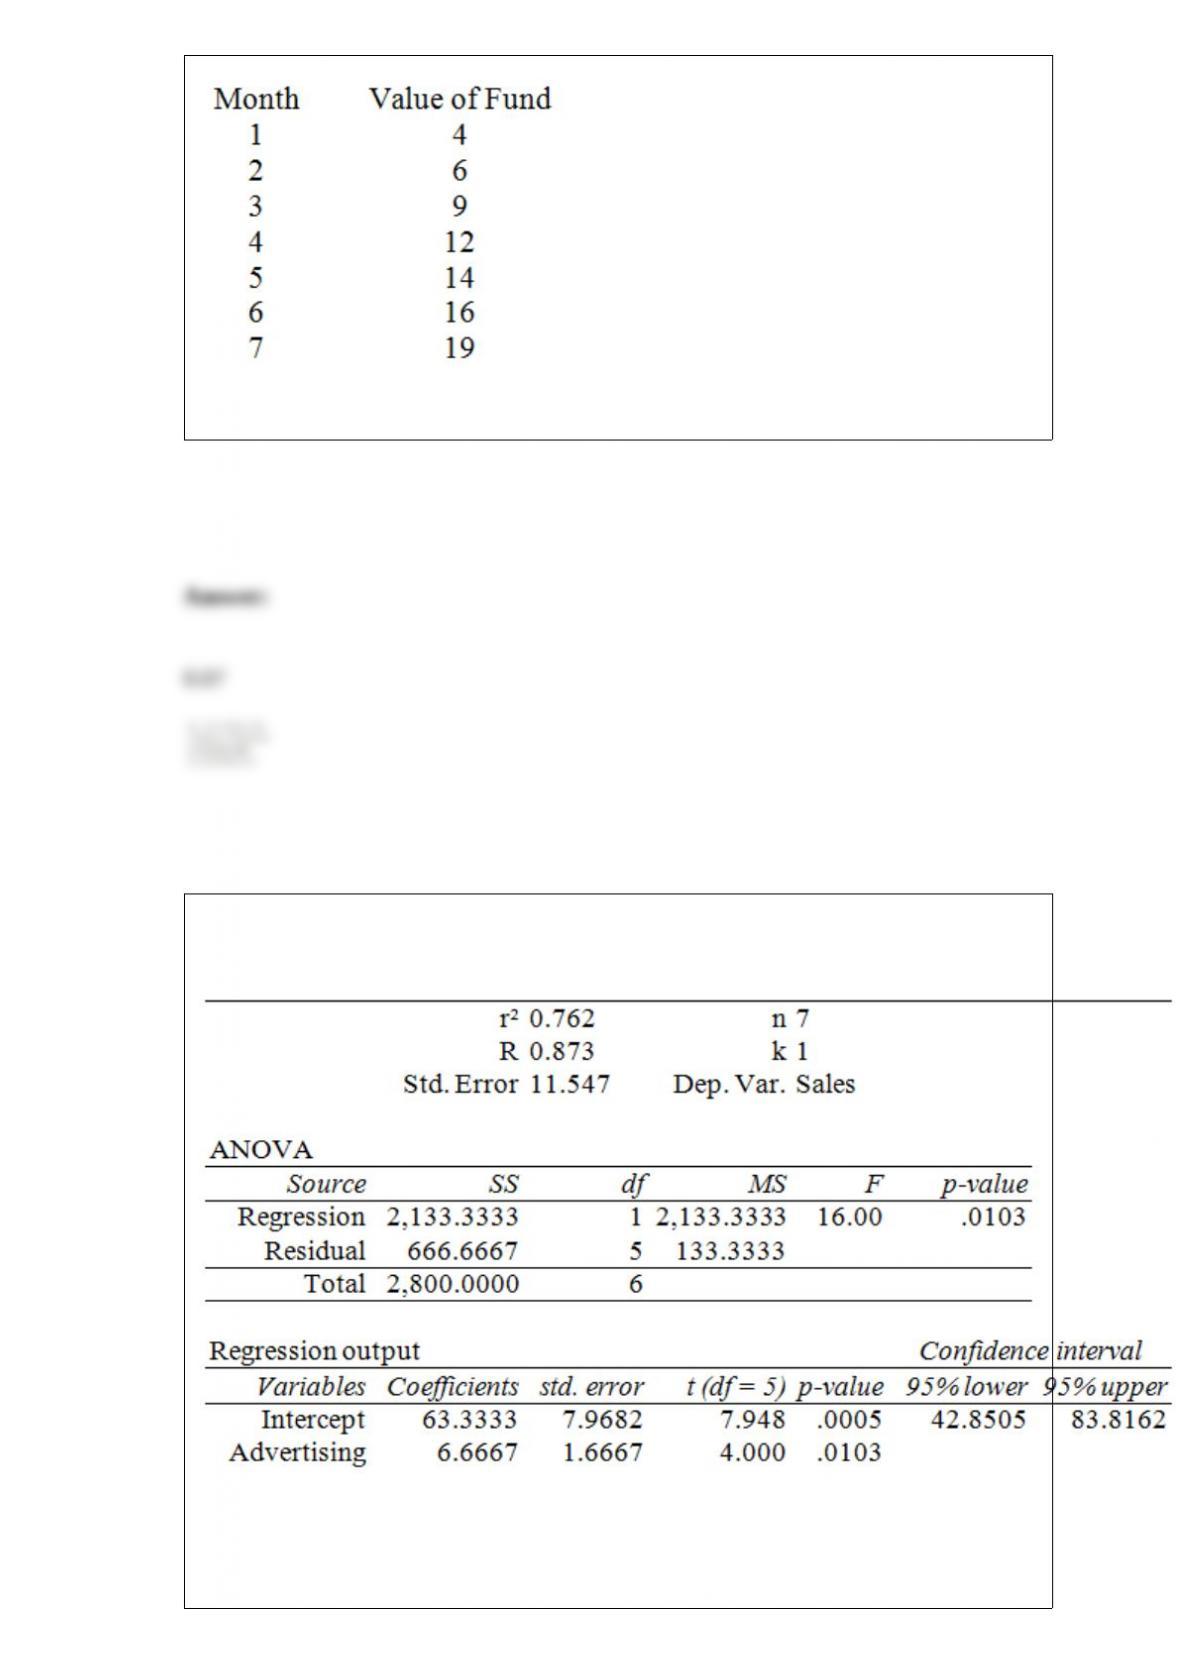
Regression Analysis
A local grocery store wants to predict its daily sales in dollars. The manager believes
that the amount of newspaper advertising significantly affects sales. He randomly
selects 7 days of data consisting of daily grocery store sales (in thousands of dollars)
and advertising expenditures (in thousands of dollars). The Excel/MegaStat output
given above summarizes the results of the regression model.
What is the value of the simple coefficient of determination?
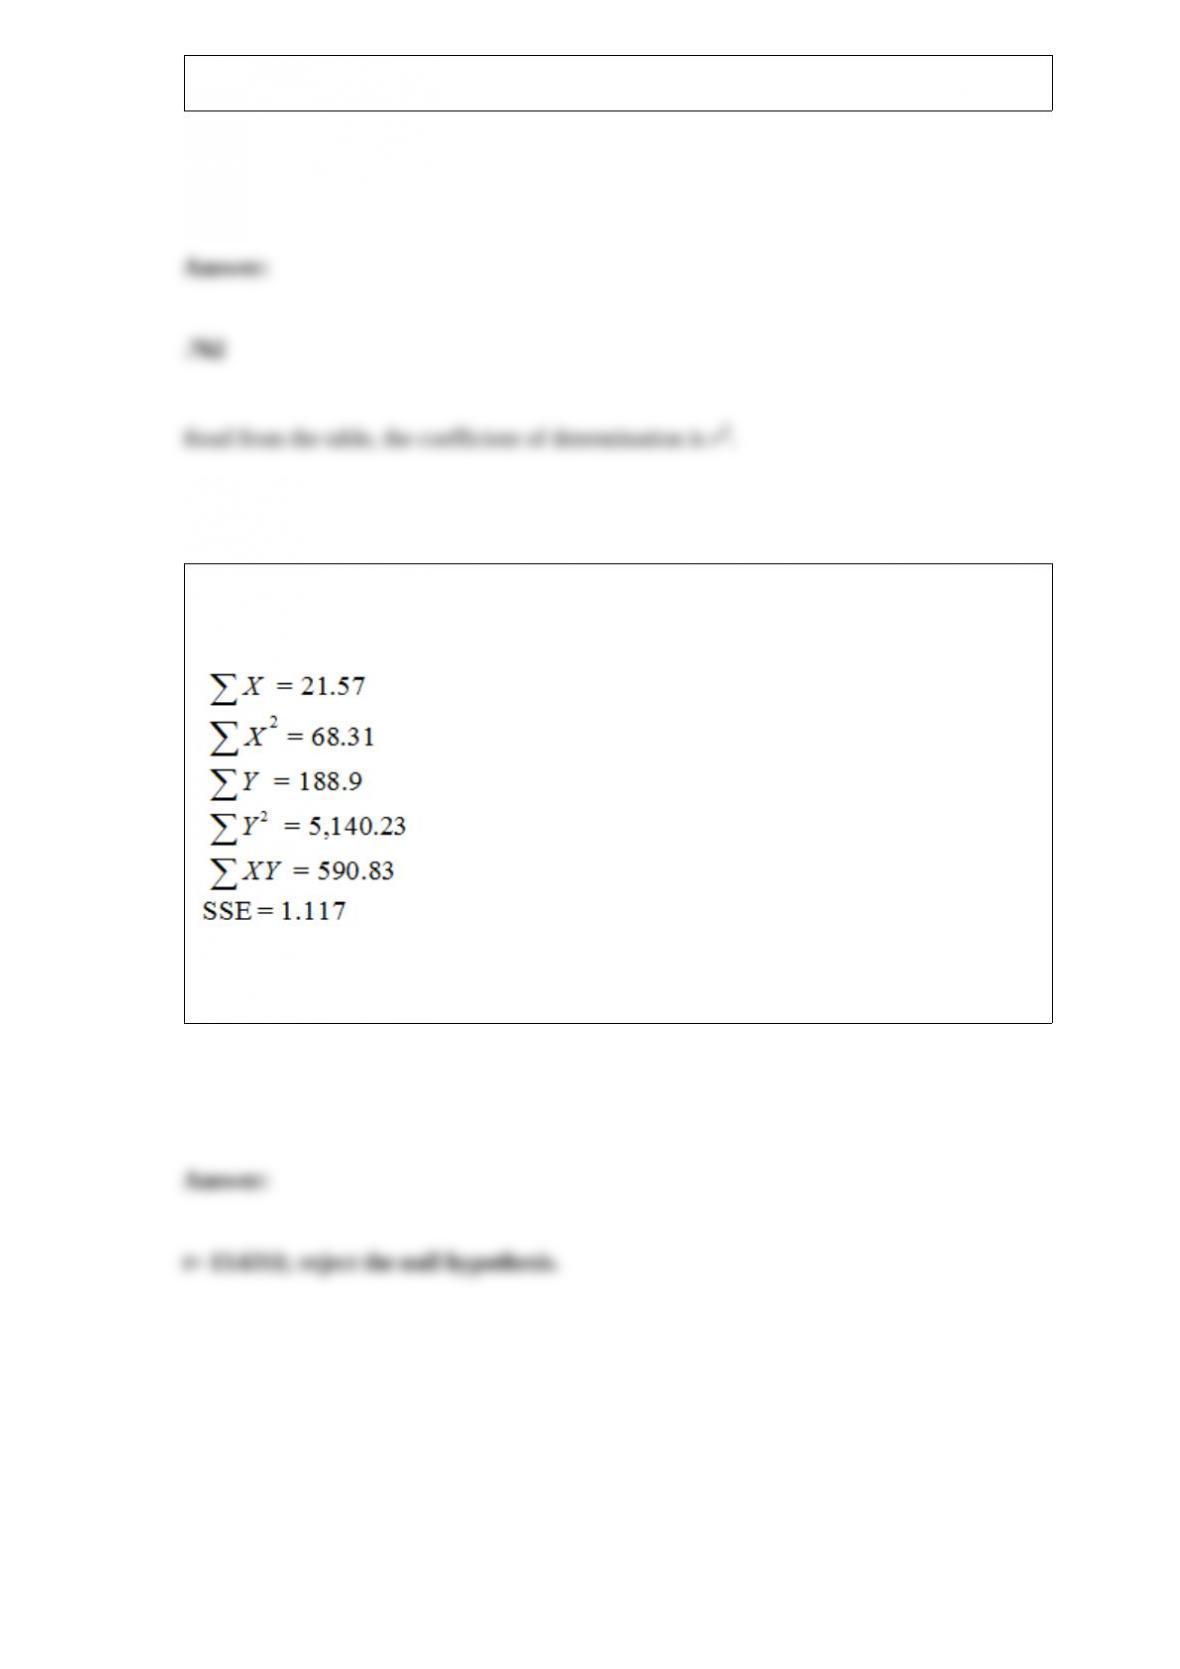
A data set with 7 observations yielded the following. Use the simple linear regression
model.
Find the rejection point for the t statistic (α = .05). Test H0: β1 ≤ 0 vs. Ha: β1 > 0.
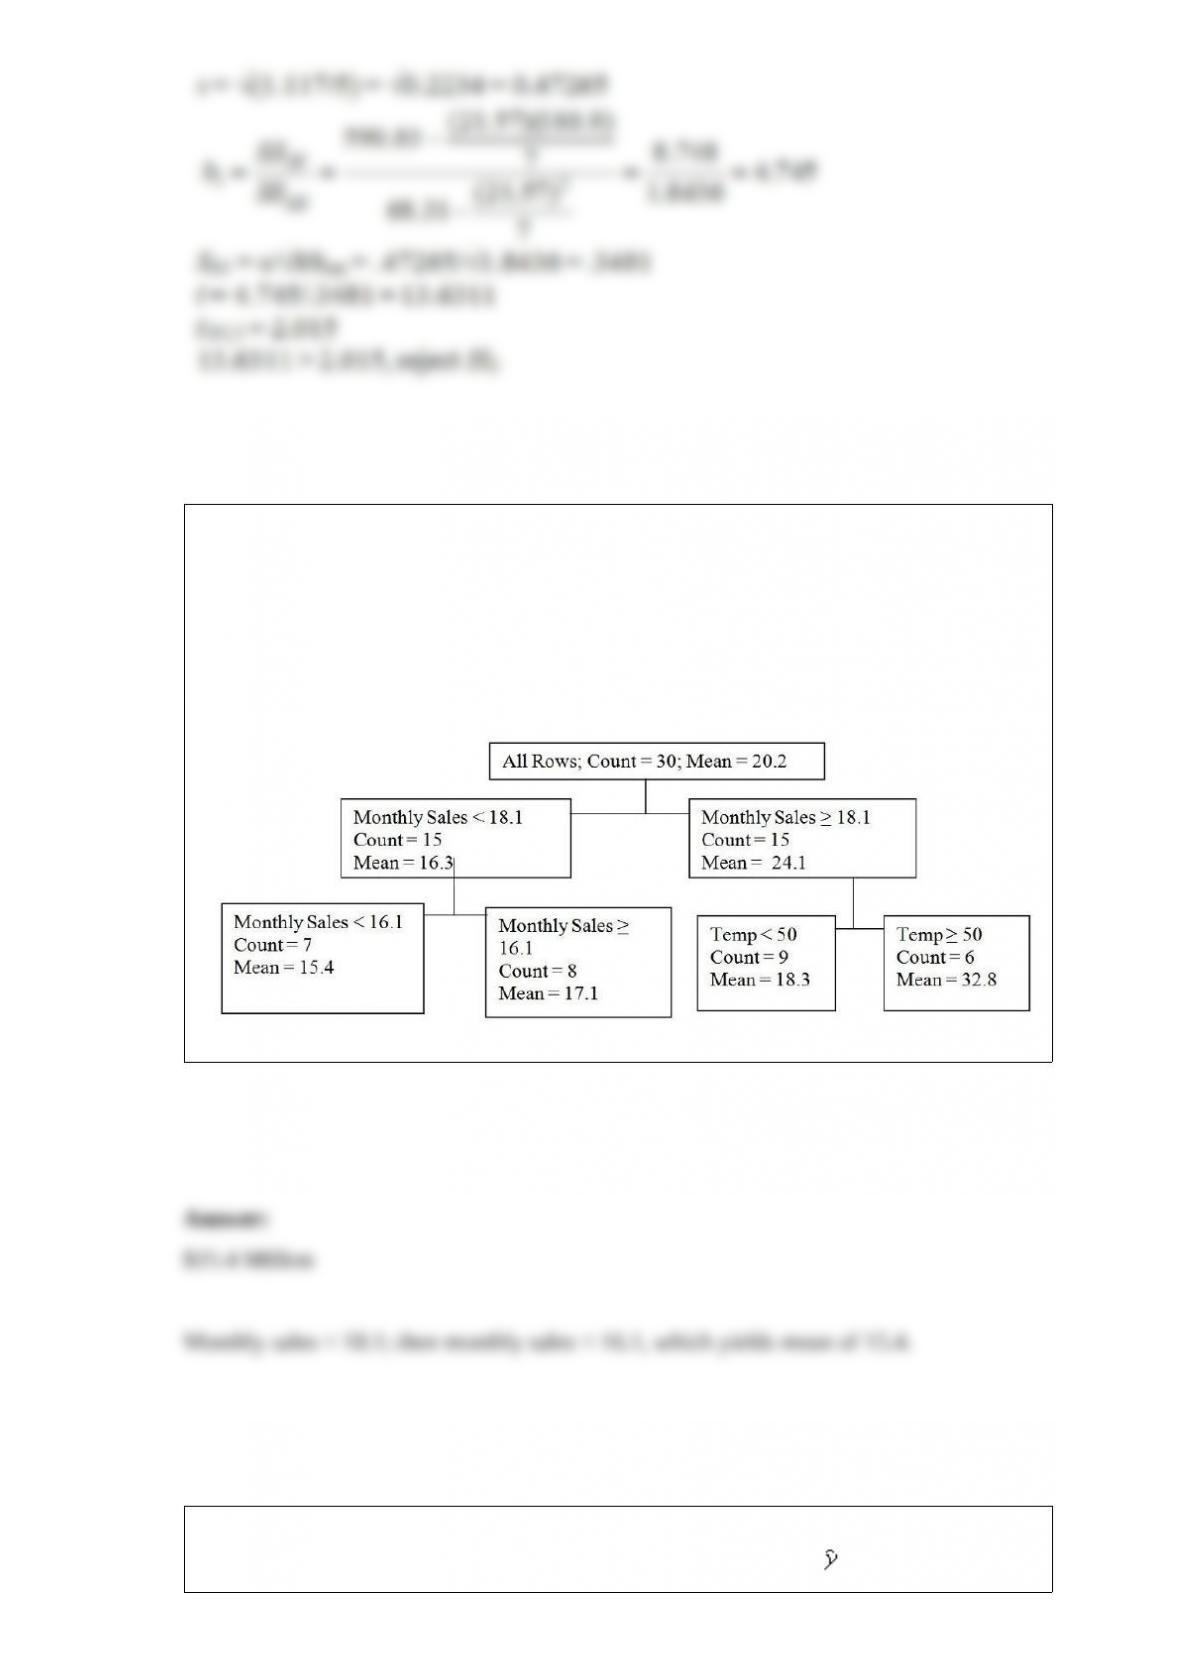
A manufacturer of Product X has developed a model for predicting monthly sales of
their product based on the sales from the same month of the previous year and the
forecasted average daily temperature for the month. Using the regression tree below
based on a random sample of 30 observations, predict sales for a future where the
previous year’s monthly sales were $15 million dollars and the forecasted average daily
temperature for the month will be 45 degrees.
An experiment was performed on a certain metal to determine if the strength is a
function of heating time. The simple linear regression equation is = 1 + 1X, and the
sample coefficient of determination (r2) = .7777. The time is in minutes and the strength
is measured in pounds per square inch. Test to determine if there is a significant
correlation between the heating time and strength of the metal. Using H0: ρ = 0 vs. HA:
ρ ≠ 0 at α = .05, determine the test statistic and decision.
A coffee shop franchise owner is looking at two possible locations for a new shop. To
help him decide, he looks at the number of pedestrians that go by each of the two
locations in one-hour segments. At location A, counts are taken for 35 one-hour units,
with a mean number of pedestrians of 421 and a sample standard deviation of 122. At
the second location (B), counts are taken for 50 one-hour units, with a mean number of
pedestrians of 347 and a sample standard deviation of 85. Assume the two populations
variances are not known but are equal. Testing the claim that both sites have the same
mean number of pedestrians at α = .01, what do you conclude?
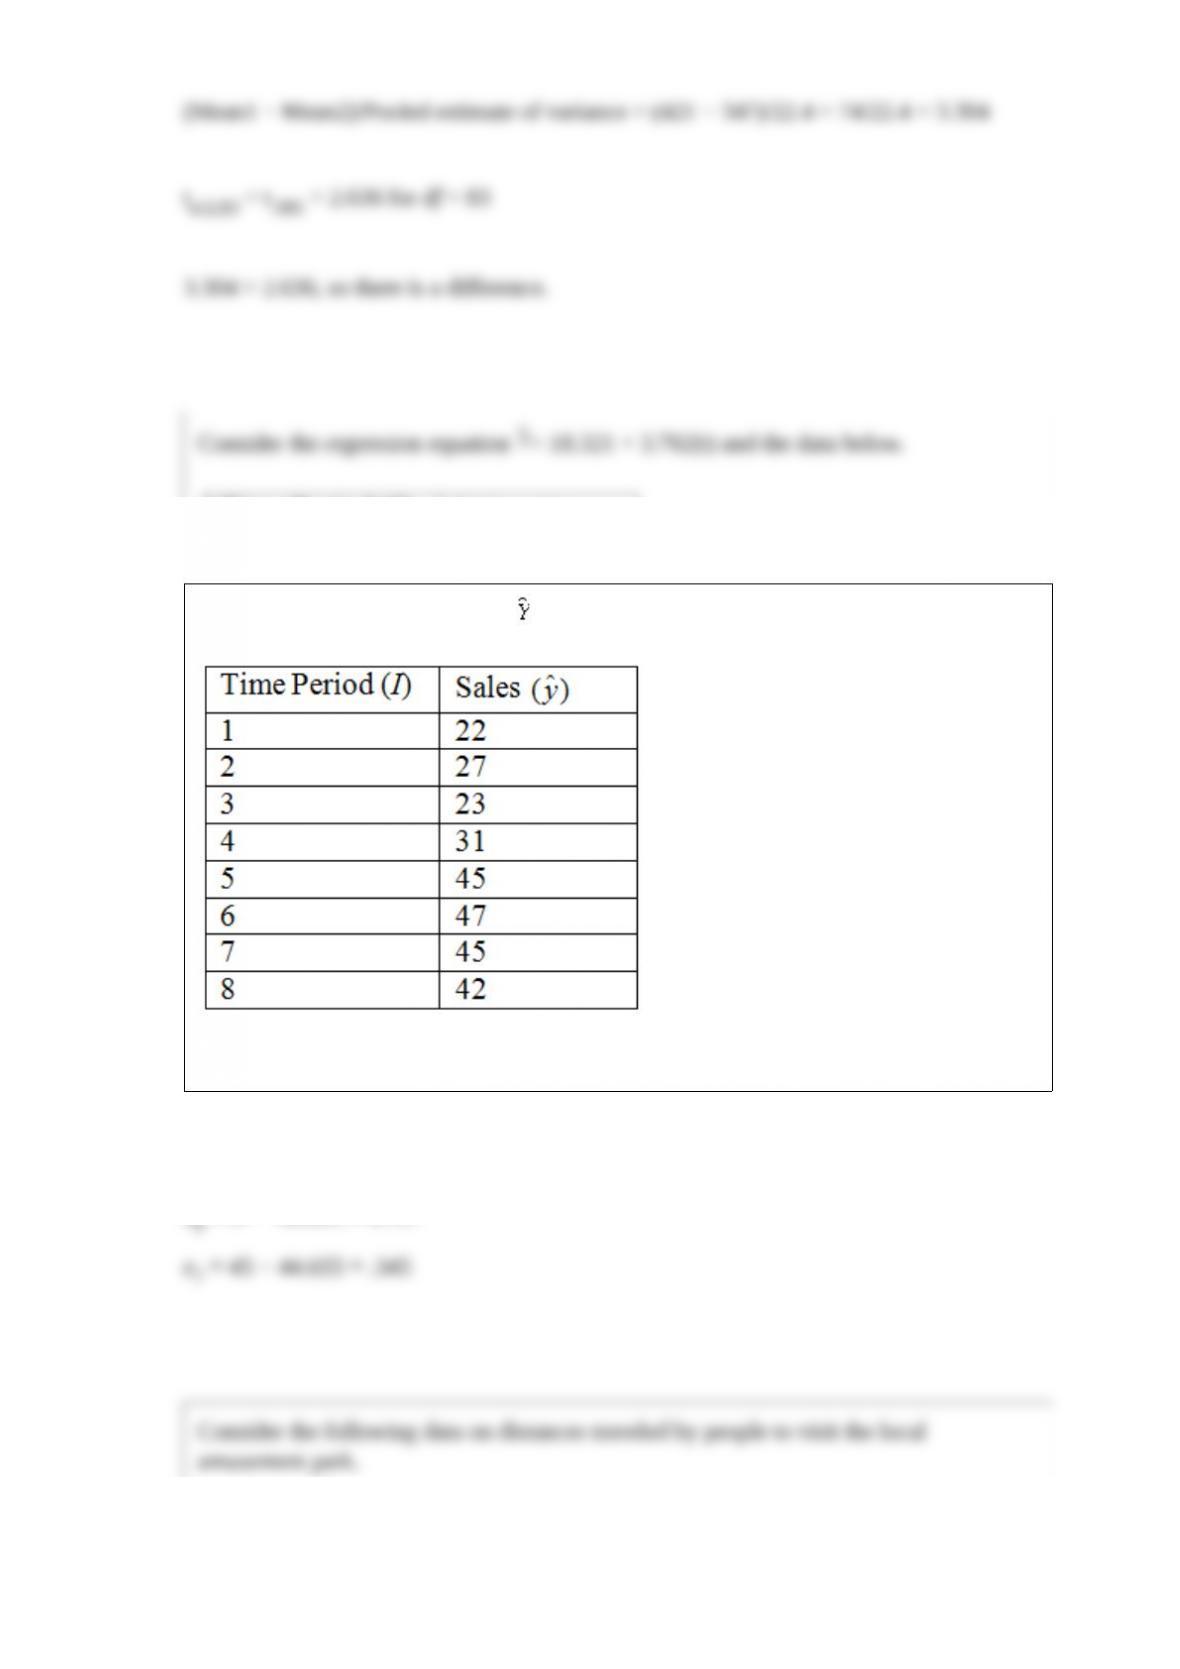
Consider the regression equation = 18.321 + 3.762(t) and the data below.
Compute the residuals (error terms) for periods 6 and 7.
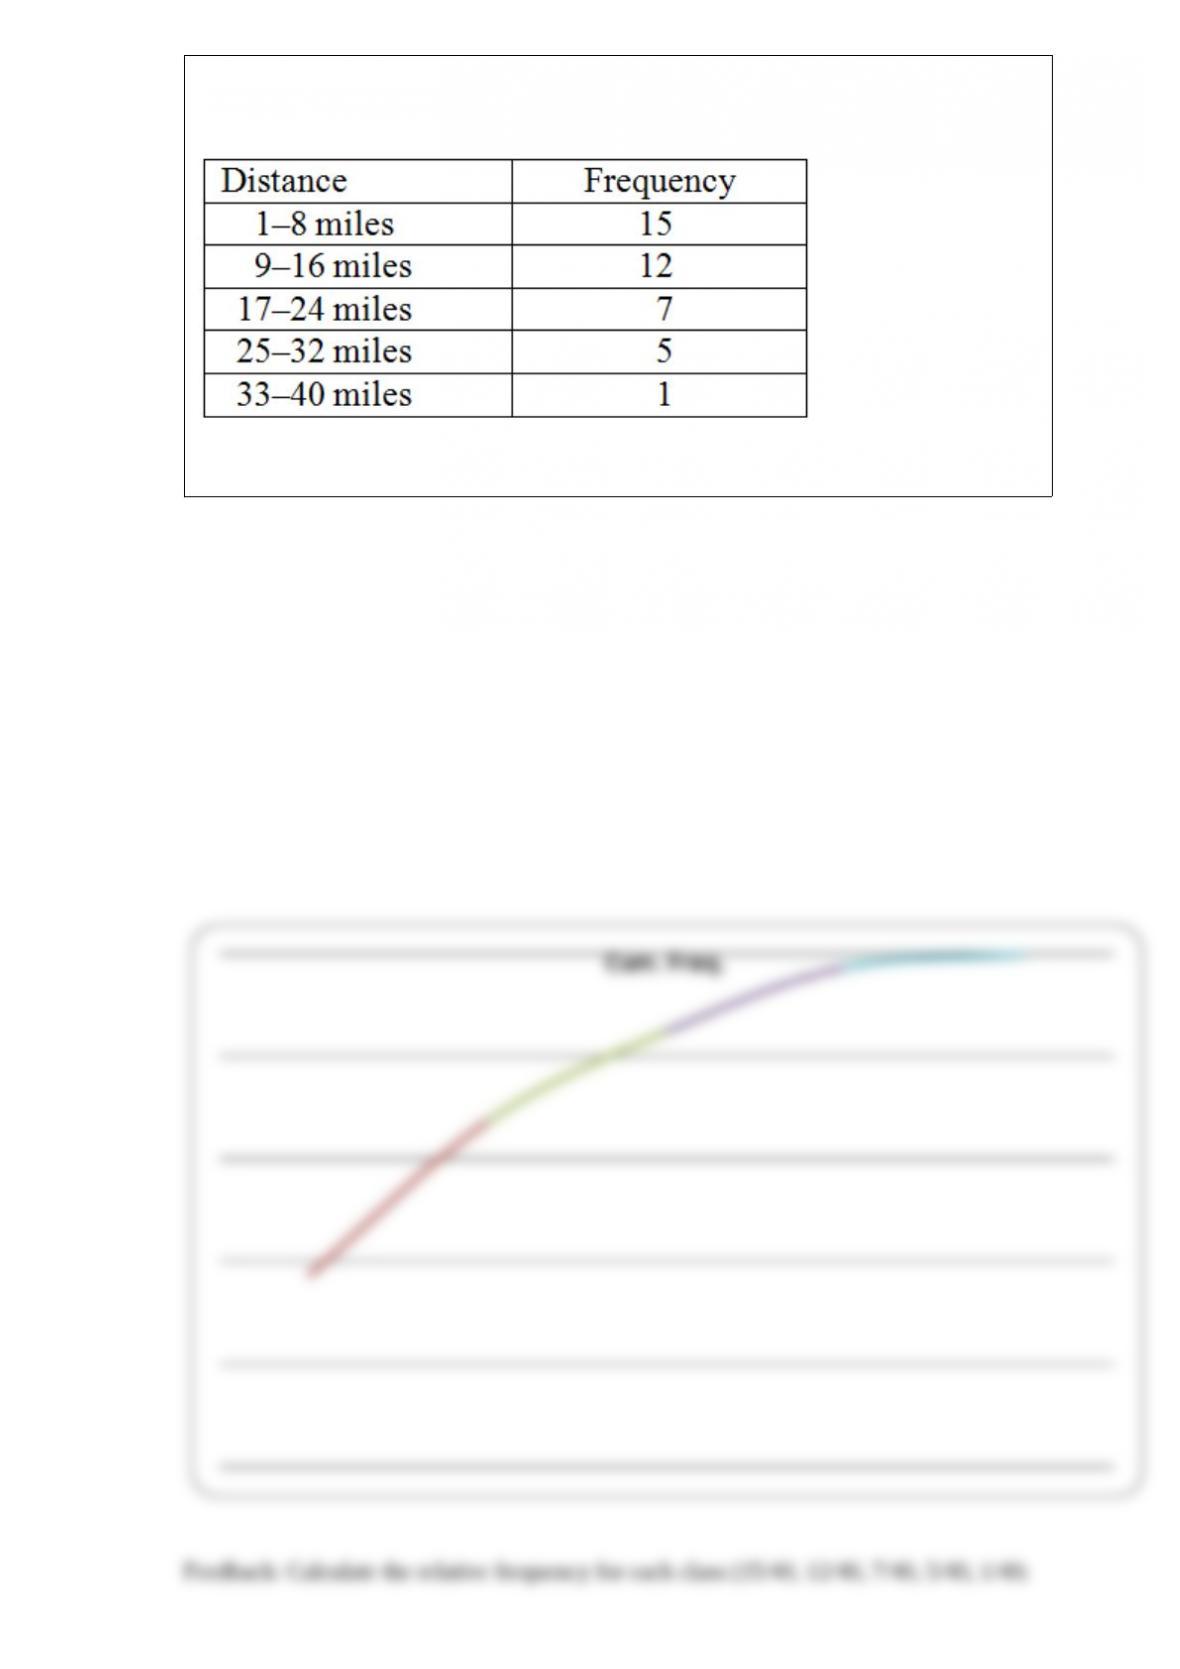
Consider the following data on distances traveled by people to visit the local
amusement park.
Construct an ogive plot that corresponds to the frequency table.
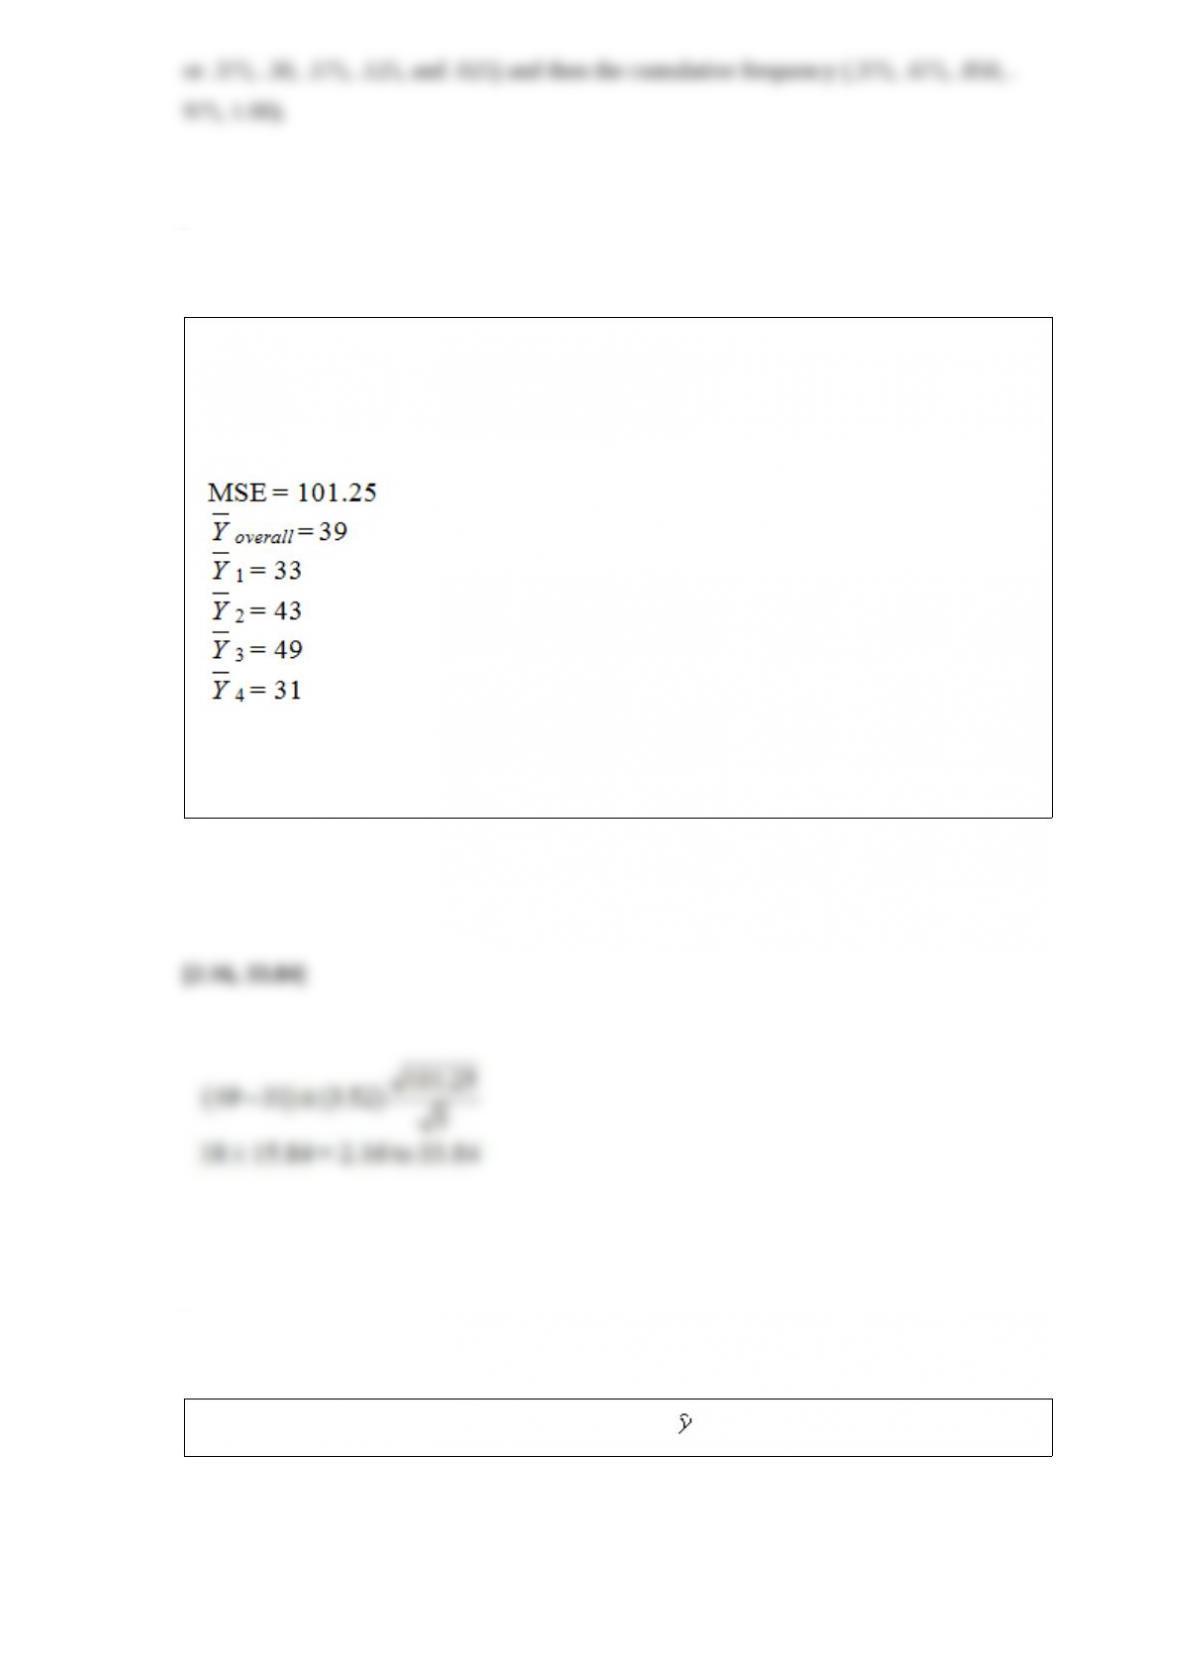
Consider the following calculations for a one-way analysis of variance from a
completely randomized design with 20 total observations. The response variable is sales
in millions of dollars, and the four treatment levels represent the four regions that the
company serves.
Perform a pairwise comparison between treatment mean 3 and treatment mean 4 by
computing a Tukey 90 percent simultaneous confidence interval.
The linear trend equation for the following data is = 1.4286 + 2.5(t) .
Find the residual value (error) for period 7.
Regression Analysis
A local grocery store wants to predict its daily sales in dollars. The manager believes
that the amount of newspaper advertising significantly affects sales. He randomly
selects 7 days of data consisting of daily grocery store sales (in thousands of dollars)
and advertising expenditures (in thousands of dollars). The Excel/MegaStat output
given above summarizes the results of the regression model.
What are the limits of the 95 percent confidence interval for the population slope?
Construct a 95 percent confidence interval for μ1 − μ2, where = 34.36, = 26.45,
s1 = 9, s2 = 6, n1 =10, n2 =16. (Assume equal population variances.)