The number of customers who arrive at a fast food business during a one-hour period is
known to be Poisson distributed with a mean equal to 8.60. The probability that
between 2 and 3 customers inclusively will arrive in one hour is 0.0263.
The probability distribution for a continuous random variable is represented by a
probability density function that defines a curve.
One of the basic differences between a uniform probability distribution and a normal
probability distribution is that the uniform is symmetrical but the normal is skewed
depending on the value of the standard deviation.
A recent study involving a sample of 3,000 vehicles in California showed the following
statistics related to the number of miles driven per day: Q1 = 12, Q2 = 45, and Q3 = 56.
Based on these data, if a box and whisker plot is developed, a value of 110 is an outlier.
If a manager is interested in analyzing the relationship between the age of customers
and the dollar volume of business that is done in the store, a relative frequency
distribution would be most appropriate.
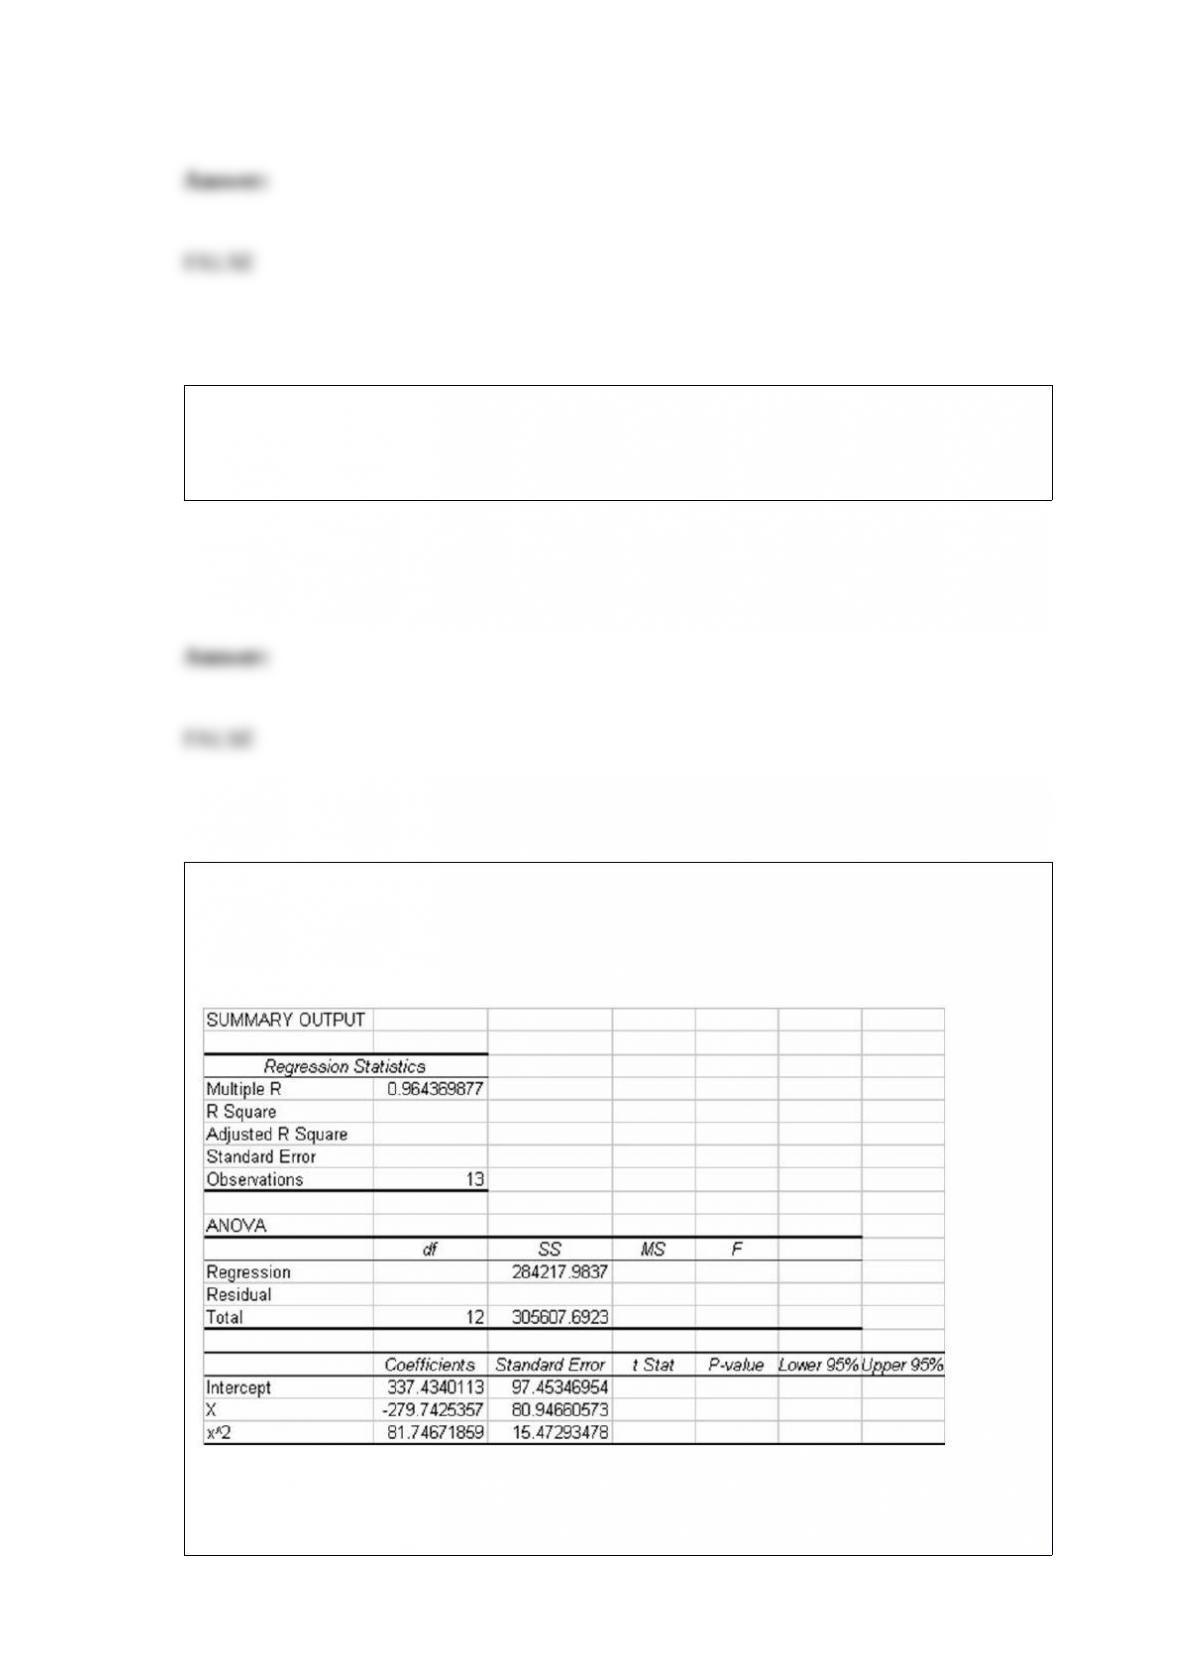
The following output is for a second-order polynomial regression model where the
independent variables are x and x2 (x^2 in output). Some of the output has been
omitted.
Considering the above information, both independent variables in the model are
considered statistically significant at the alpha = 0.05 level.

In a hypothesis test for the equality of two variances, the lower-tail critical value does
not need to be found as long as the larger sample variance is placed in the denominator
of the test statistic.
A sampling distribution for a sample of n = 4 is normally distributed with a standard
deviation equal to 5. Based on this information, the population standard deviation, σ, is
equal to 10 mph.
A random sample of n = 500 people was surveyed recently to determine an estimate for
the proportion of people in the population who had attended at least some college. The
estimate concluded that between 0.357 and 0.443 of the population had attended. Given
this information, we can determine that the confidence level was approximately 95
percent.

The Crystal Window Company makes windows at three locations: Reno, Las Vegas,
and Boise. Some windows made by the company contain a visible defect and must be
replaced. Each defect costs the company $45.00. The Reno plant makes 40 percent of
all windows while the Las Vegas and Boise plants split the remaining production
evenly. A recent quality study shows that 8 percent of the Reno windows contain a
defect, 11 percent of the Las Vegas windows contain a defect, while 4 percent of the
windows made in Boise have a defect. Once the windows are made, they are shipped to
a central warehouse where they are commingled and the location where they were made
is lost.
Based on this information the probability that a defective window was made by the
Boise plant is approximately 0.16.
When a company scans the bar codes on its products in an effort to count the number of
products that remain in inventory, the company is collecting data through
experimentation.
A chain of fast food restaurants wants to compare the average service times at four
different restaurants. They want to conduct a hypothesis test to determine if all four
means are the same or not. If
n = 10 observations are taken at each of the four restaurants, then the degrees of
freedom are D1 = 39 and D2 = 3.
The test statistic that is used when testing hypotheses about the difference between two
population proportions is the t-value from the t-distribution.
Box and whisker plots are often useful for determining whether two populations have
distributions that might each be normally distributed.
In order to analyze any potential interactions between factors in an analysis of variance
study, it is necessary to have at least two measurements at each level of each factor.

For a continuous distribution the total area under the curve is equal to 100.
A model is a representation of an actual system.
A local medical center has advertised that the mean wait for services will be less than
15 minutes. In an effort to test whether this claim can be substantiated, a random
sample of 100 customers was selected and their wait times were recorded. The mean
wait time was 17.0 minutes. Based on this sample result, there is sufficient evidence to
reject the medical center’s claim.
If the test statistic for a chi-square goodness-of-fit test is larger than the critical value,
the null hypothesis should be rejected.
The logic behind the chi-square goodness-of-fit test is based on determining how far the
actual observed frequencies are from the expected frequencies.
A company has 20 copy machines and every day there is a 5 percent chance for each
machine that it will not be working that day. If the company wants to calculate the
probability of, say, 2 machines not working, it should use the Poisson distribution.
If the mean value of a variable is 200 and the median is 150, the third quartile must be
at least 200.
In the best subsets approach to regression analysis, if we start with 4 independent
variables, a total of 33 different regression models will actually be computed for
possible selection as the best model to use.
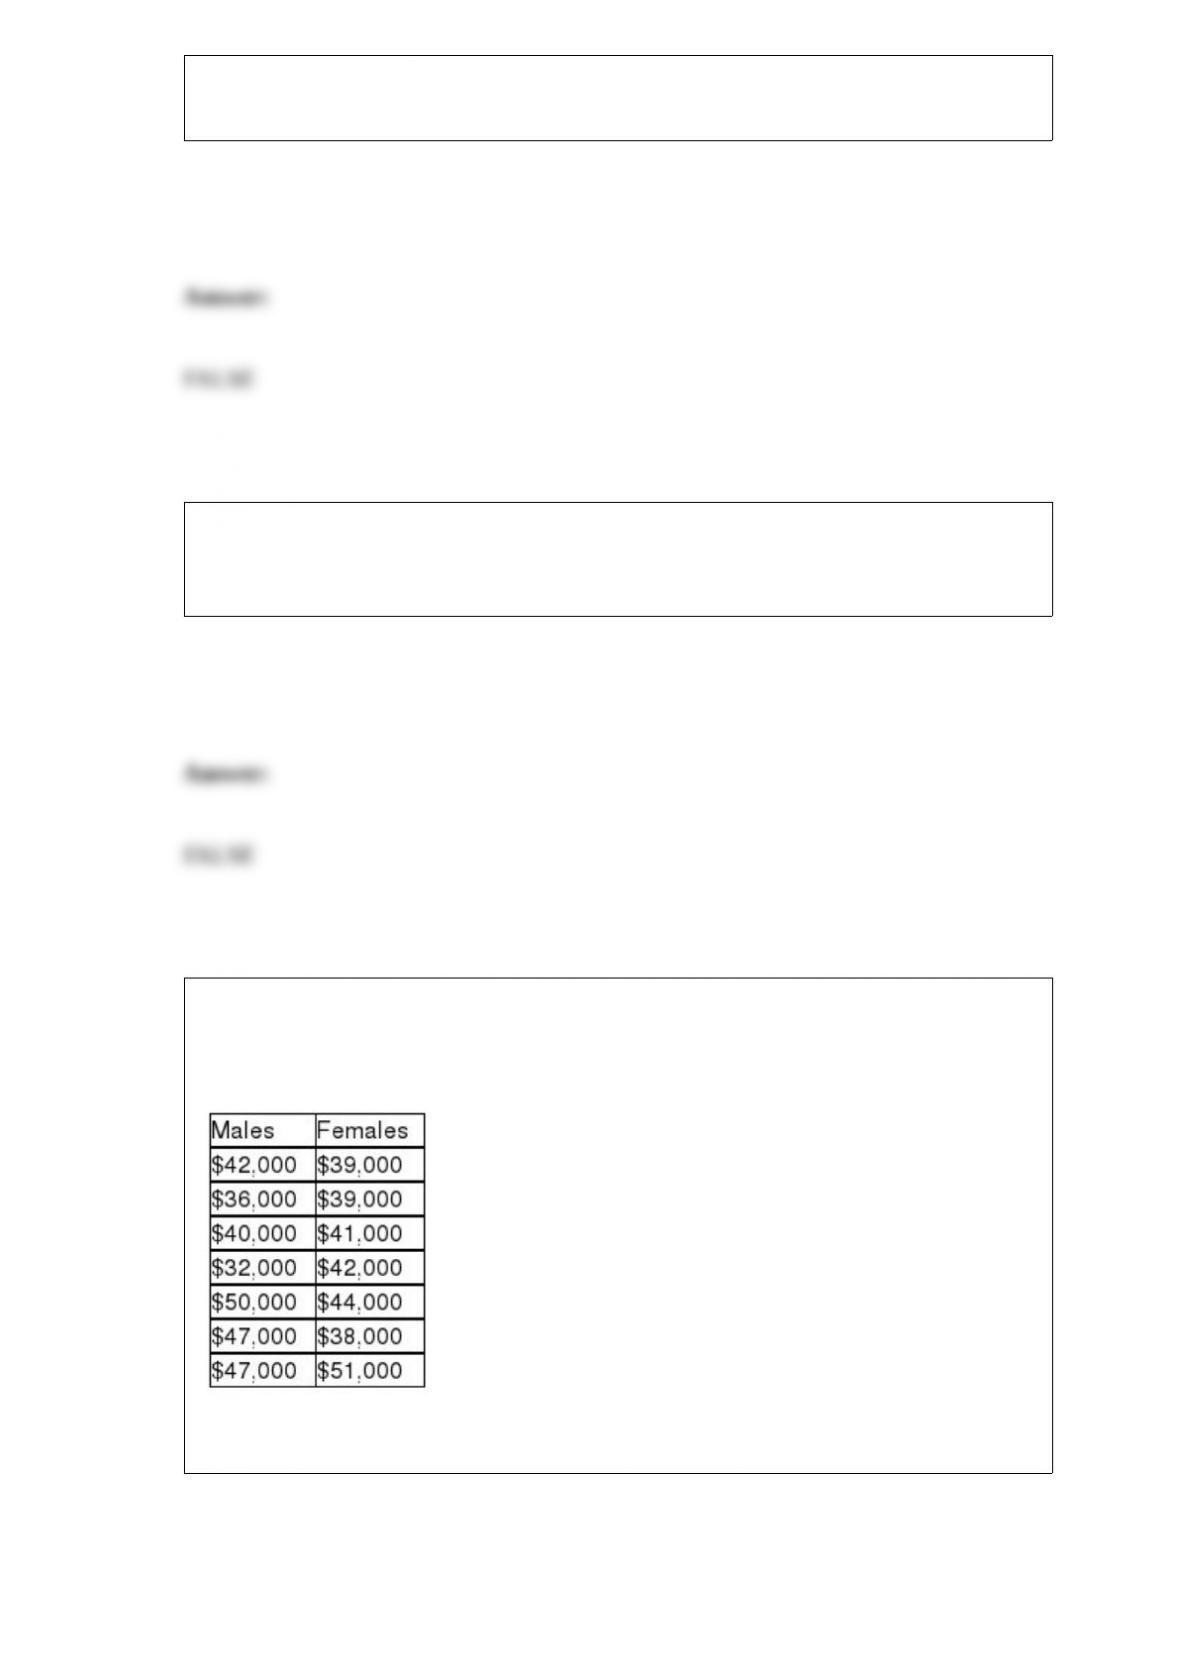
A claim was recently made that stated that the median income for male and female
graduates is the same for those graduating with a degree in operations management. The
following sample data were collected:
In employing the Mann-Whitney U test, the U test statistic is 25.5

Two samples are said to be independent if they are collected at different points in time.
A study of cars arriving at a parking structure at the local airport shows that the time
between arrivals is 1.2 minutes and is exponentially distributed. The probability that
more than 2 minutes will elapse between the arrivals of cars is about 0.81.
The Tukey-Kramer method for multiple comparisons can only be used when the
analysis of variance design is balanced.
Statistical inference would be used as the primary statistical tool by a quality control
manager who wishes to estimate the average weight of her company’s products.
A car salesman states that the probability that the dealership sells a car on a Saturday
morning is .30. The method of probability assessment that he has used is most likely
classical assessment.
A lube and oil change business believes that the number of cars that arrive for service is
the same each day of the week. If the business is open six days a week (Monday –
Saturday) and a random sample of n = 200 customers is selected, the expected number
that will arrive on Monday is about 33.33.
If a random variable is discrete, it means that the outcome for the random variable can
take on only one of two possible values.
The reason that a population mean and the mean of a random sample selected from that
population might be different is that the sample mean is found by dividing by n-1 while
the population mean is found by dividing by n.
In a campaign speech, a candidate for governor stated that about 63 percent of the
people in the state were in favor of spending additional money on higher education.
After the speech, a polling agency surveyed a random sample of 400 people and found
234 people who favored more spending on higher education. Based on the candidate’s
statement, the probability of finding 234 or fewer is approximately 0.97.
In multiple regression analysis, the residual is the absolute difference between the
actual value of y and the predicted value of y.
Which of the following statements is true with respect to a Poisson distribution?
A) The Poisson distribution is symmetrical when the mean is close to 5.
B) The Poisson distribution is more right-skewed for smaller values of the mean.
C) The variance of the Poisson distribution is equal to the square root of the expected
value.
D) The Poisson distribution is an example of a continuous probability distribution.
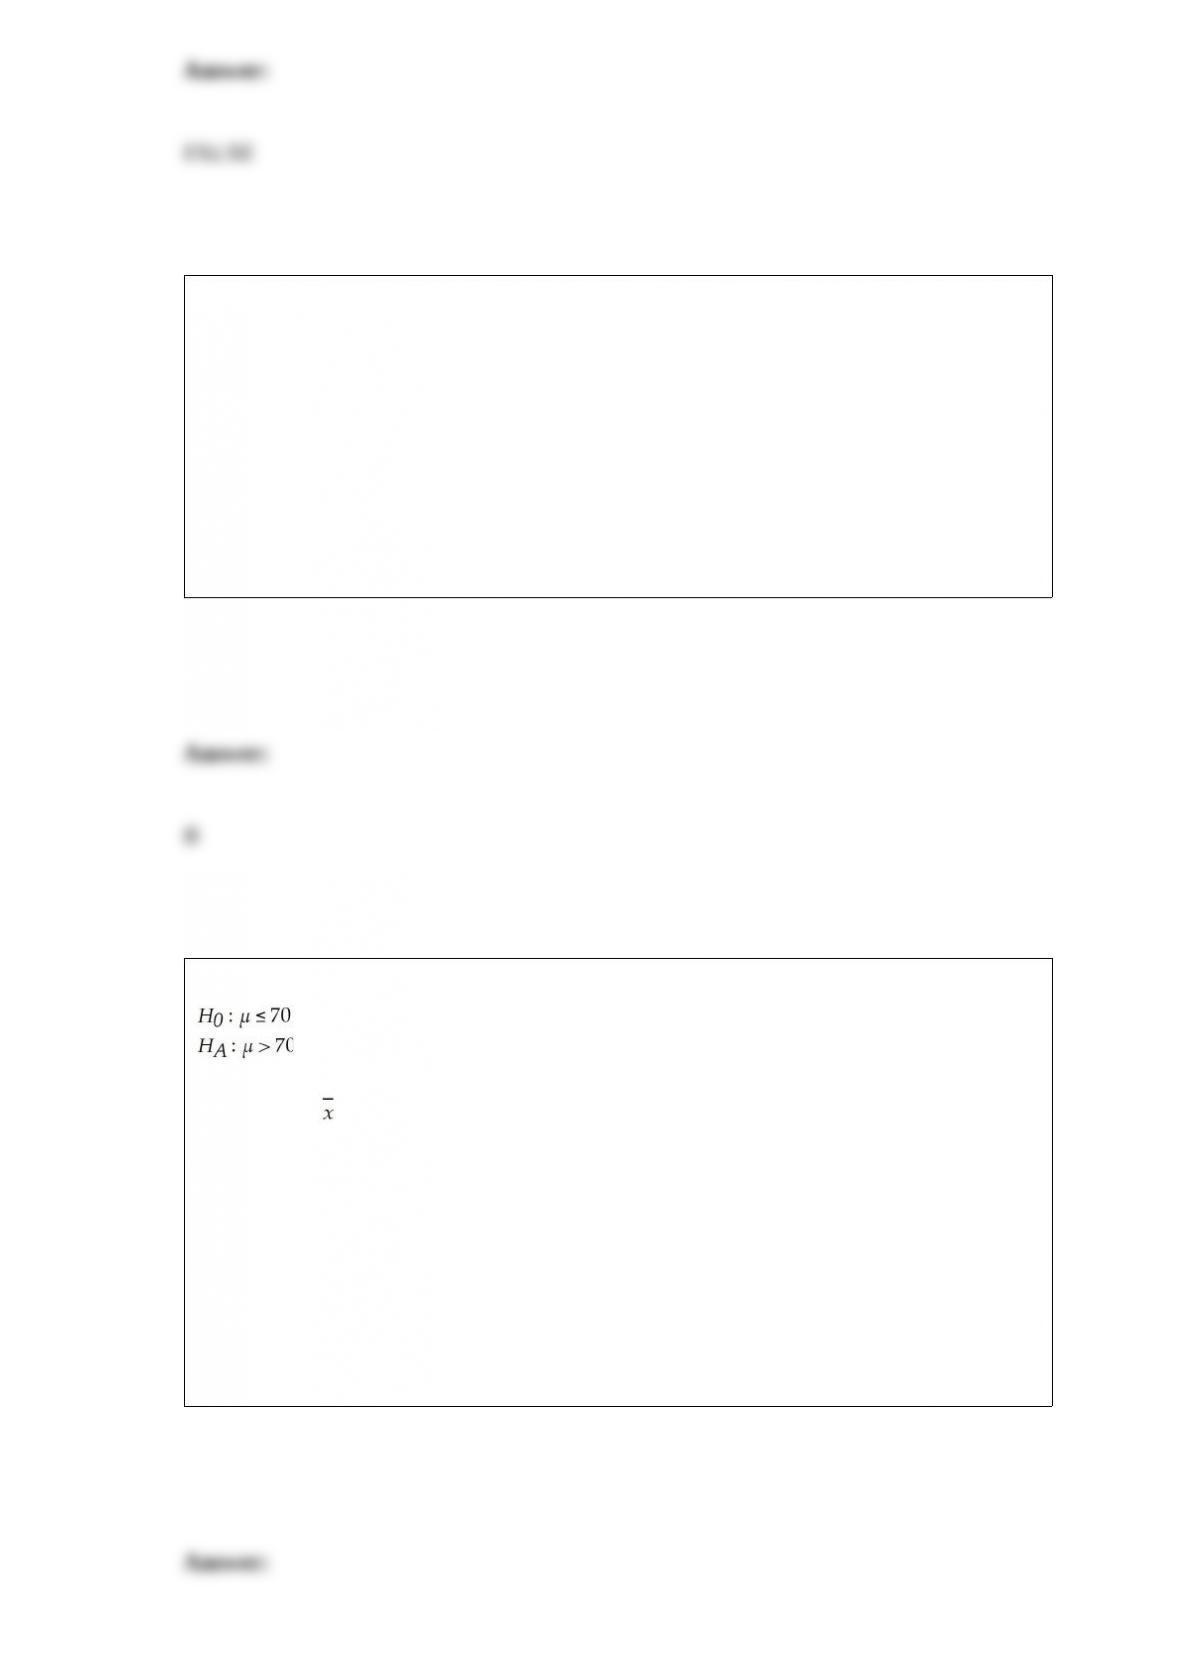
For the following hypothesis:
With n = 20, = 71.2, s = 6.9, and α = 0.1, state the calculated value of the test statistic
t.
A) 1.58
B) 0.78
C) 1.14
D) 0.41
Which of the following is not an assumption of the Kruskal-Wallis one-way analysis of
variance?
A) Variables have a continuous distribution.
B) Samples are independent.
C) Sample sizes are equal for all populations.
D) Population distributions are identical except for possible differences in center.
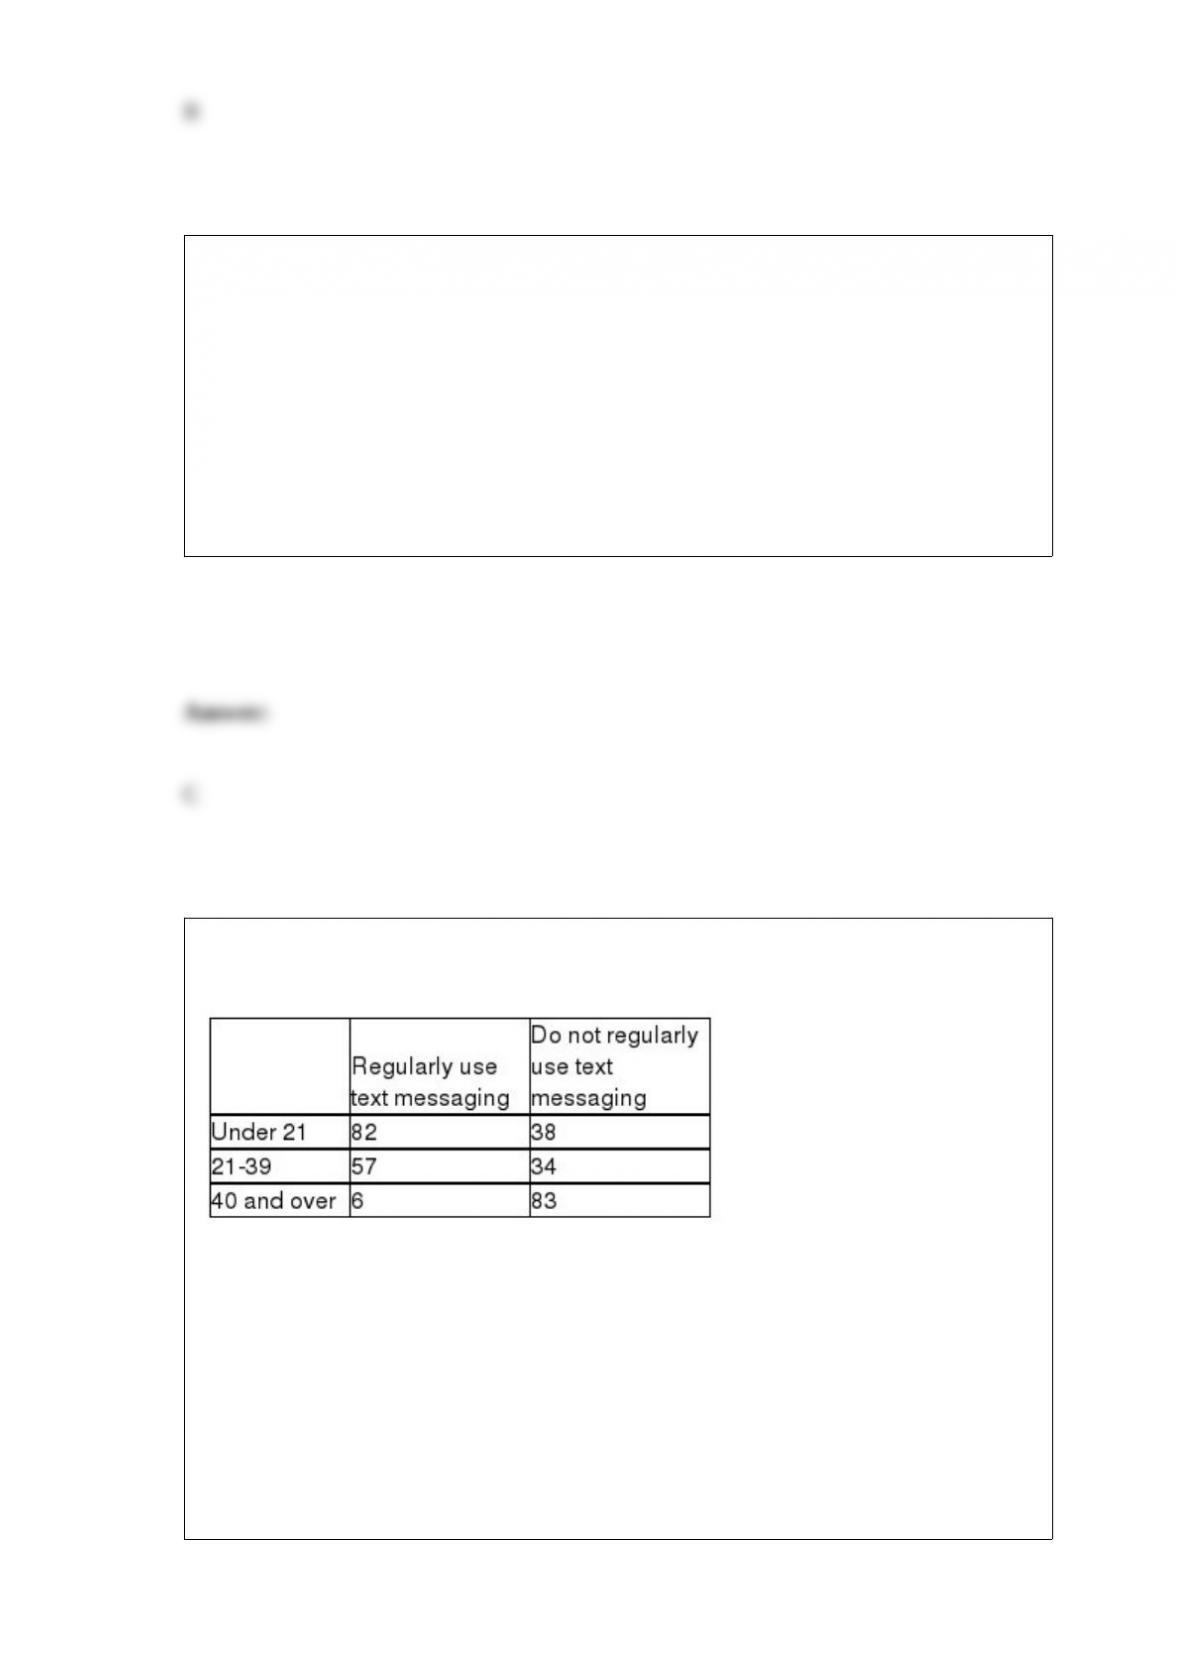
A cell phone company wants to determine if the use of text messaging is independent of
age. The following data has been collected from a random sample of customers.
To conduct a contingency analysis, the number of degrees of freedom is:
A) 6
B) 5
C) 3
D) 2

Which of the following data collection methods is most likely to generate the largest
nonresponse?
A) Mail surveys
B) Direct observation
C) Telephone surveys
D) Personal interviews
Portfolio A of a collection of stocks is considered more risky than portfolio B if:
A) portfolio A has a higher mean than portfolio B.
B) portfolio A has a higher variance than portfolio B.
C) portfolio A has a higher standard deviation.
D) portfolio A has a higher coefficient of variation than portfolio B.

Suppose a study estimated the population mean for a variable of interest using a 99%
confidence interval. If the width of the estimated confidence interval (the difference
between the upper limit and the lower limit) is 600 and the sample size used in
estimating the mean is 1,000, what is the population standard deviation?
A) 26711.14
B) 2451.23
C) 3684.21
D) 5125.11
The control limits in a control chart can be interpreted to mean:
A) any value falling outside the limits is a defect and the product should be discarded.
B) the range of virtually all special cause variation.
C) any value falling within the limits means the product is high quality.
D) the range of virtually all common cause variation.
Mike runs for the president of the student government and is interested to know
whether the proportion of the student body in favor of him is significantly more than 50
percent. A random sample of 100 students was taken. Fifty-five of them favored Mike.
At a 0.05 level of significance, it can be concluded that the proportion of the students in
favor of Mike
A) is significantly greater than 50 percent because 55 percent of the sample favored
him.
B) is not significantly greater than 50 percent.
C) is significantly greater than 55 percent.
D) is not significantly different from 55 percent.
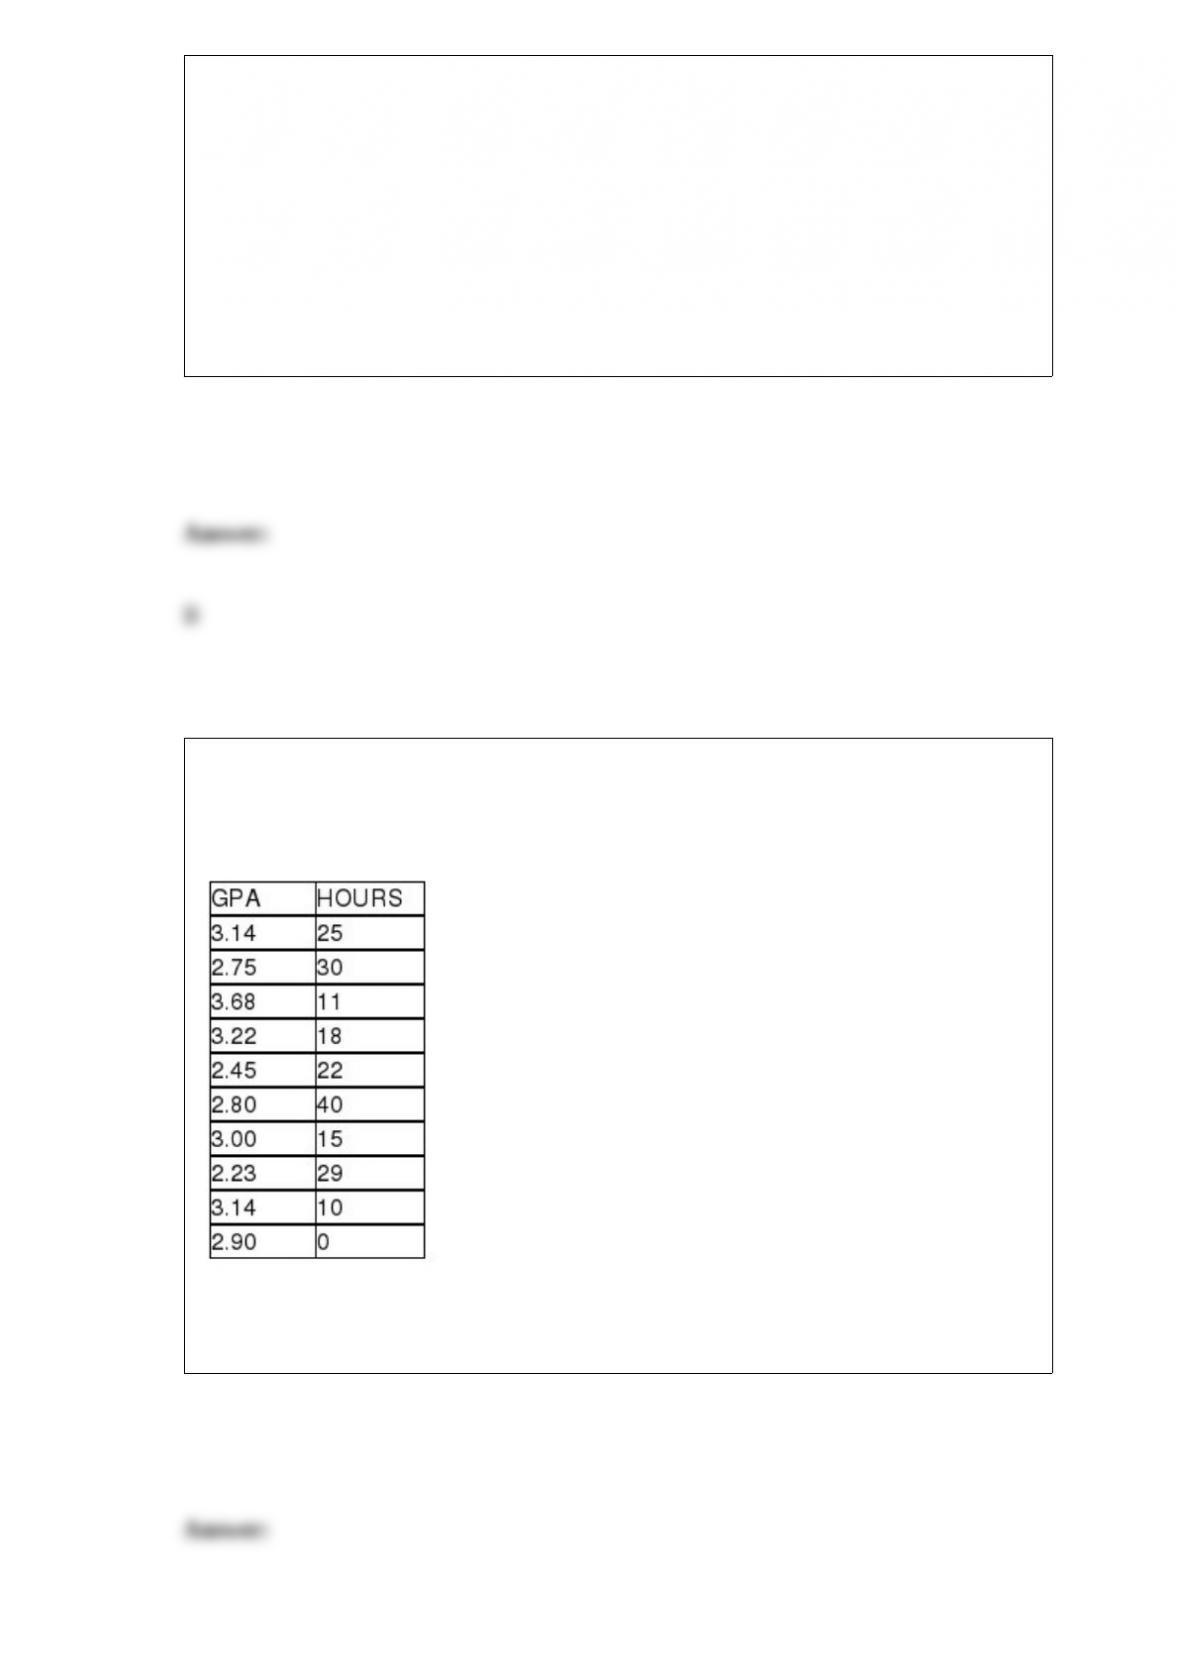
State University recently randomly sampled ten students and analyzed grade point
average (GPA) and number of hours worked off-campus per week. The following data
were observed:
In this study the independent variable is the number of hours worked off campus per
week.
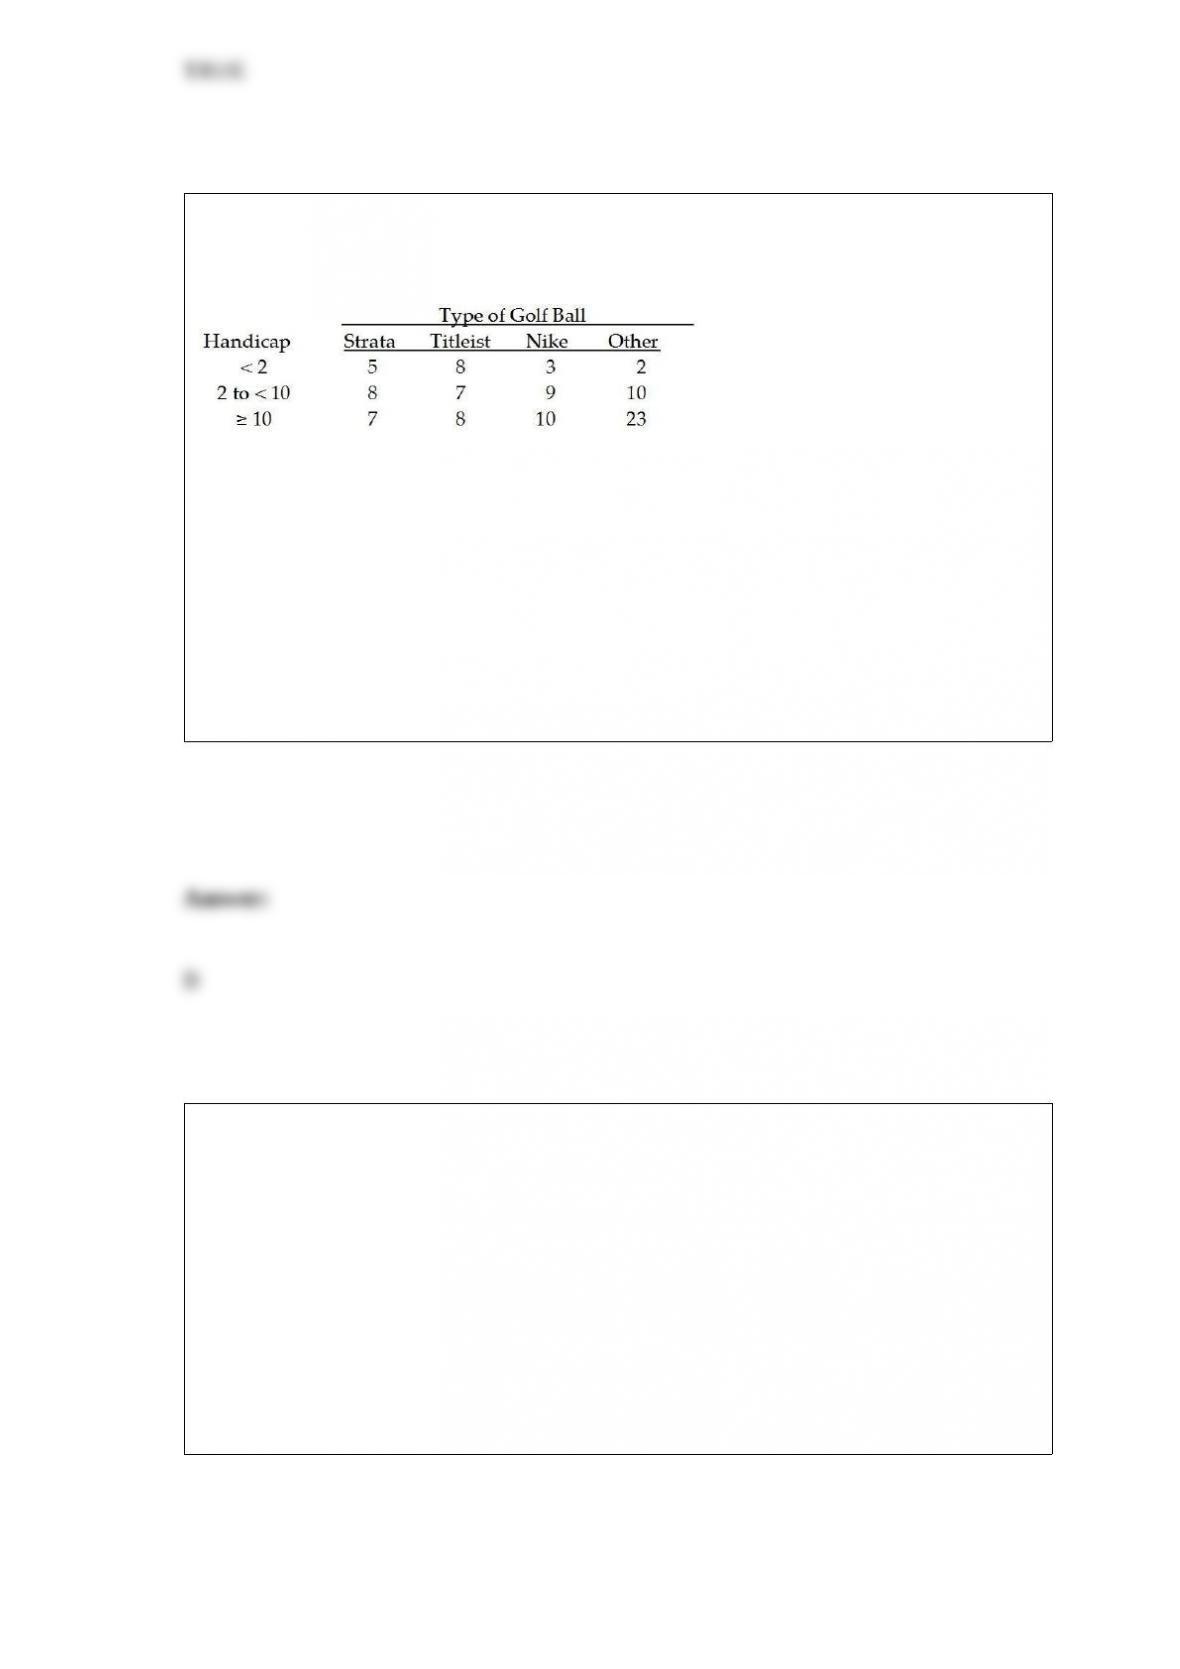
The managers of a local golf course have recently conducted a study of the types of golf
balls used by golfers based on handicap. A joint frequency table for the 100 golfers
covered in the survey is shown below:
Based on these data, the probability that a player will use a Strata golf ball is:
A) 0.15
B) 0.20
C) 0.18
D) None of the above
As a step in establishing its rates, an automobile insurance company is interested in
determining whether there is a difference in the mean highway speeds that drivers of
different age groups drive. To help answer this question, it has selected a random
sample of drivers in three age categories: under 21, 21-50, and over 50. The engineers
then recorded the drivers’ speeds at a designated point on a highway in the state. The
subjects were unaware that their speed was being recorded. The following one-way
ANOVA output was generated from the sample data. Based upon this output, it is
possible that a Type II statistical error has been committed if the null hypothesis is
tested at the alpha equal 0.05 level.
ANOVA: Single Factor

A sampling plan that requires a person to interview 100 people as they exit a
department store would most likely be:
A) a simple random sample.
B) a convenience sample.
C) a systematic random sample.
D) a stratified sample.
The State Transportation Department is thinking of changing its speed limit signs. It is
considering two new options in addition to the existing sign design. At question is
whether the three sign designs will produce the same mean speed. To test this, the
department has conducted a limited test in which a stretch of roadway was selected.
With the original signs up, a random sample of 30 cars was selected and the speeds
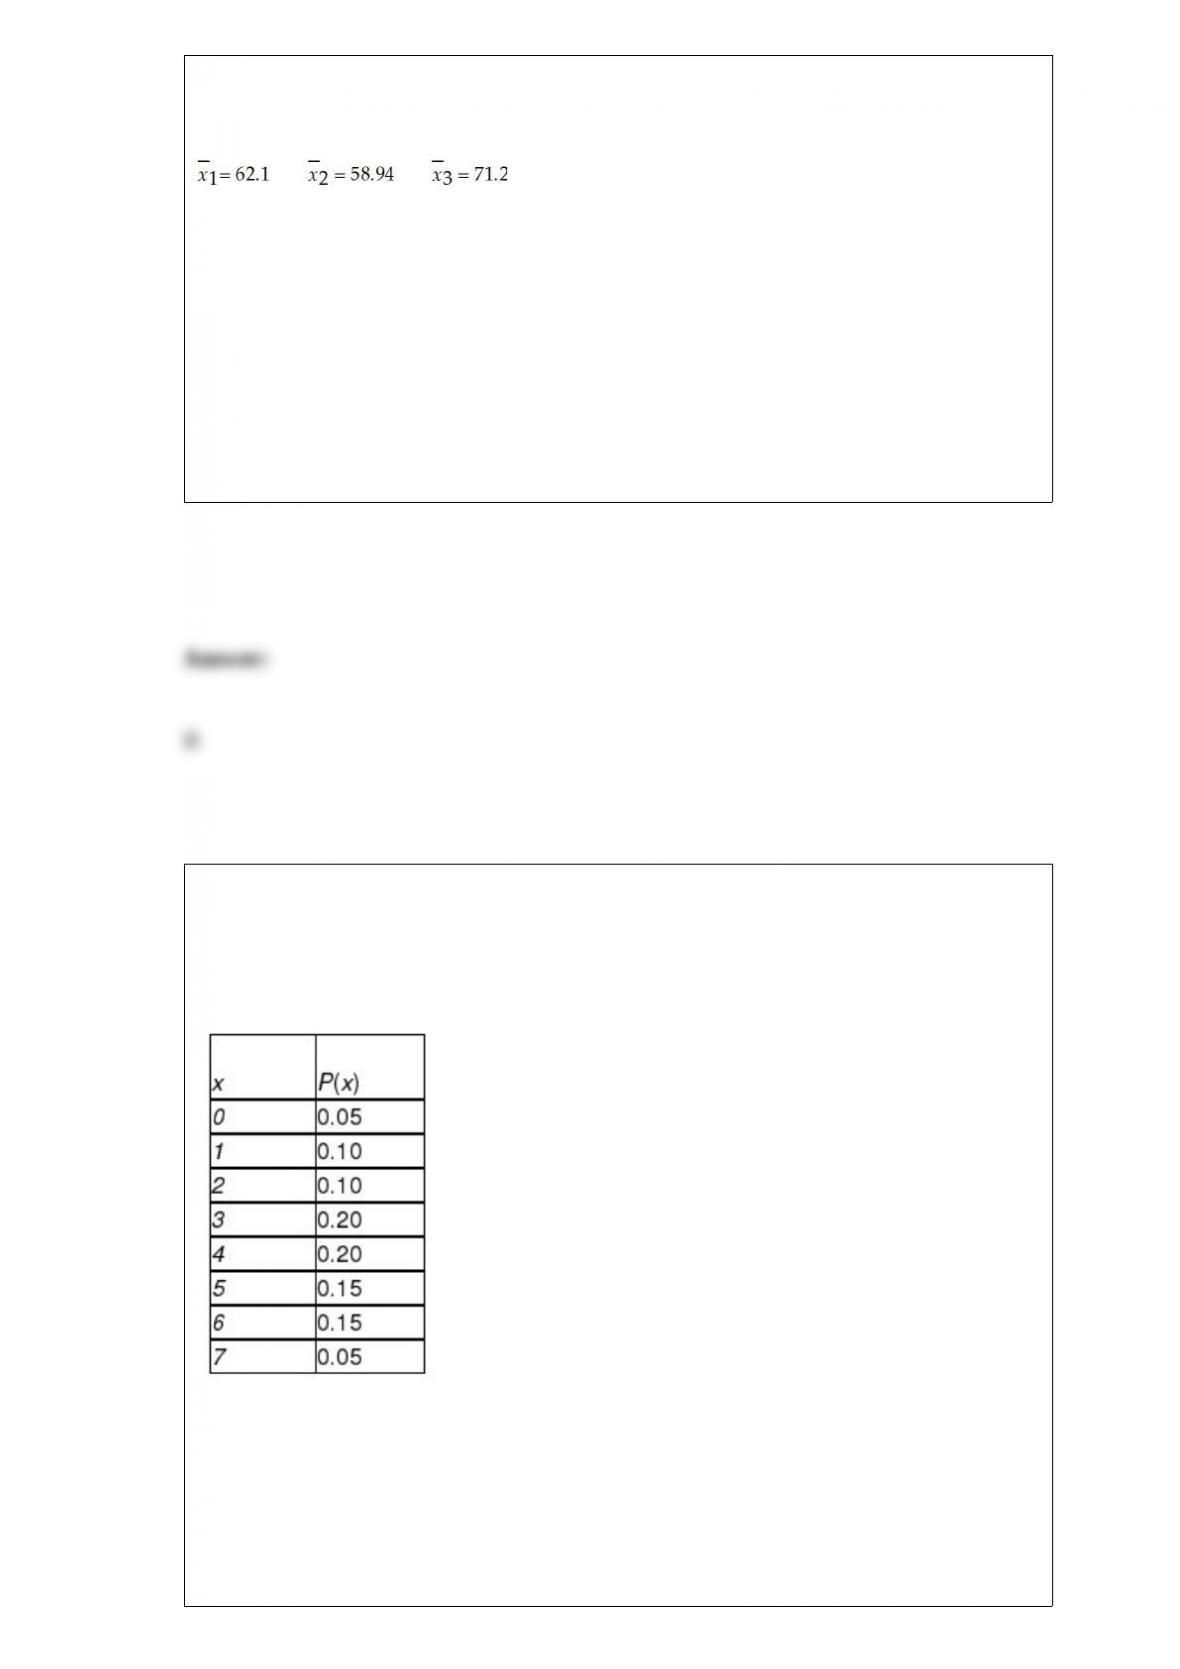
were measured. Then, on different days, the two new designs were installed, 30 cars
each day were sampled, and their speeds were recorded. Suppose that the following
summary statistics were computed based on the data:
The appropriate test to conduct to determine if the population means are equal is:
A) Hartley’s F-max test.
B) one-way analysis of variance.
C) three sample t-test.
D) randomized complete block analysis of variance.
Because of bad weather, the number of days next week that the captain of a charter
fishing boat can leave port is uncertain. Let x = number of days that the boat is able to
leave port per week. The following probability distribution for the variable, x, was
determined based on historical data when the weather was poor:
Based on the probability distribution, what is the expected number of days per week the
captain can leave port?
A) 3.7
B) 4.5
C) 2.8
D) 1.7
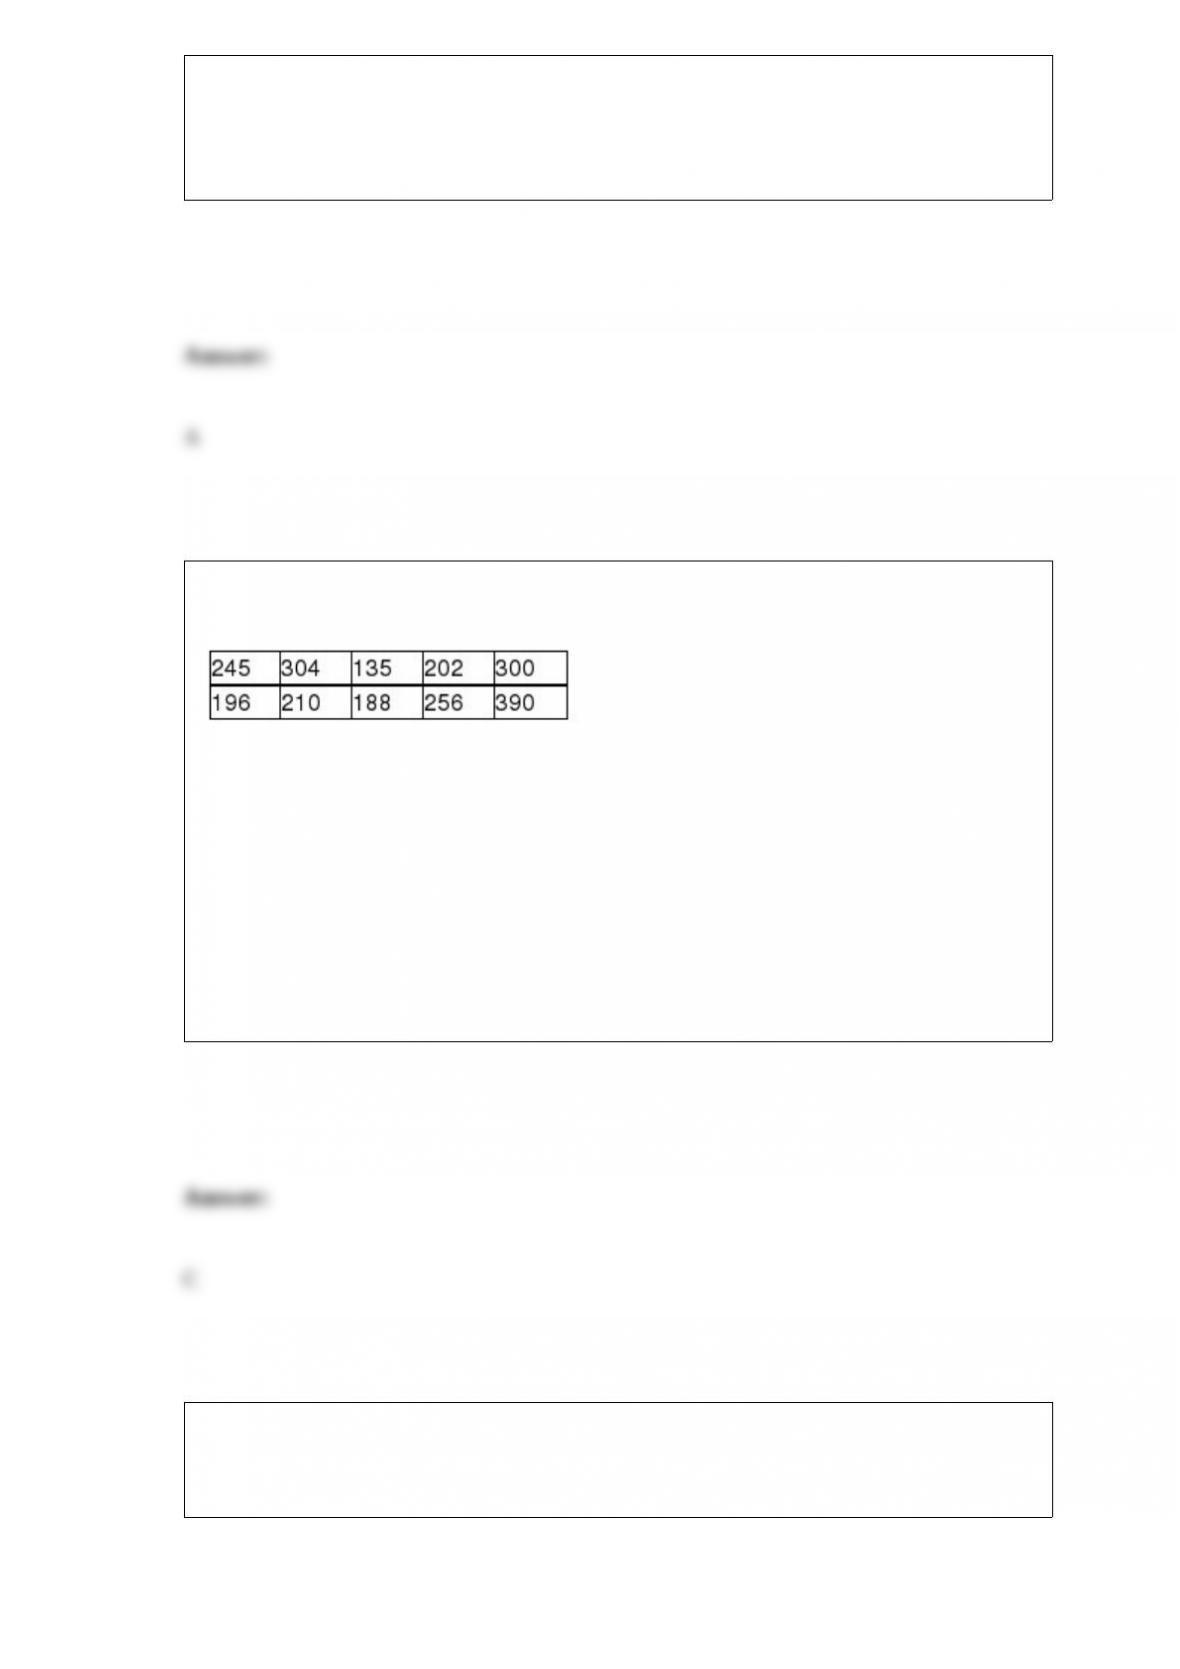
A study was recently conducted to estimate the mean cholesterol for adult males over
the age of 55 years. The following random sample data were observed:
Given this information, what is the point estimate for the population mean?
A) About 73.35
B) 102
C) About 242.6
D) Can’t be determined without knowing the confidence level.
A study was recently done in which 500 people were asked to indicate their preferences
for one of three products. The following table shows the breakdown of the responses by
gender of the respondents.
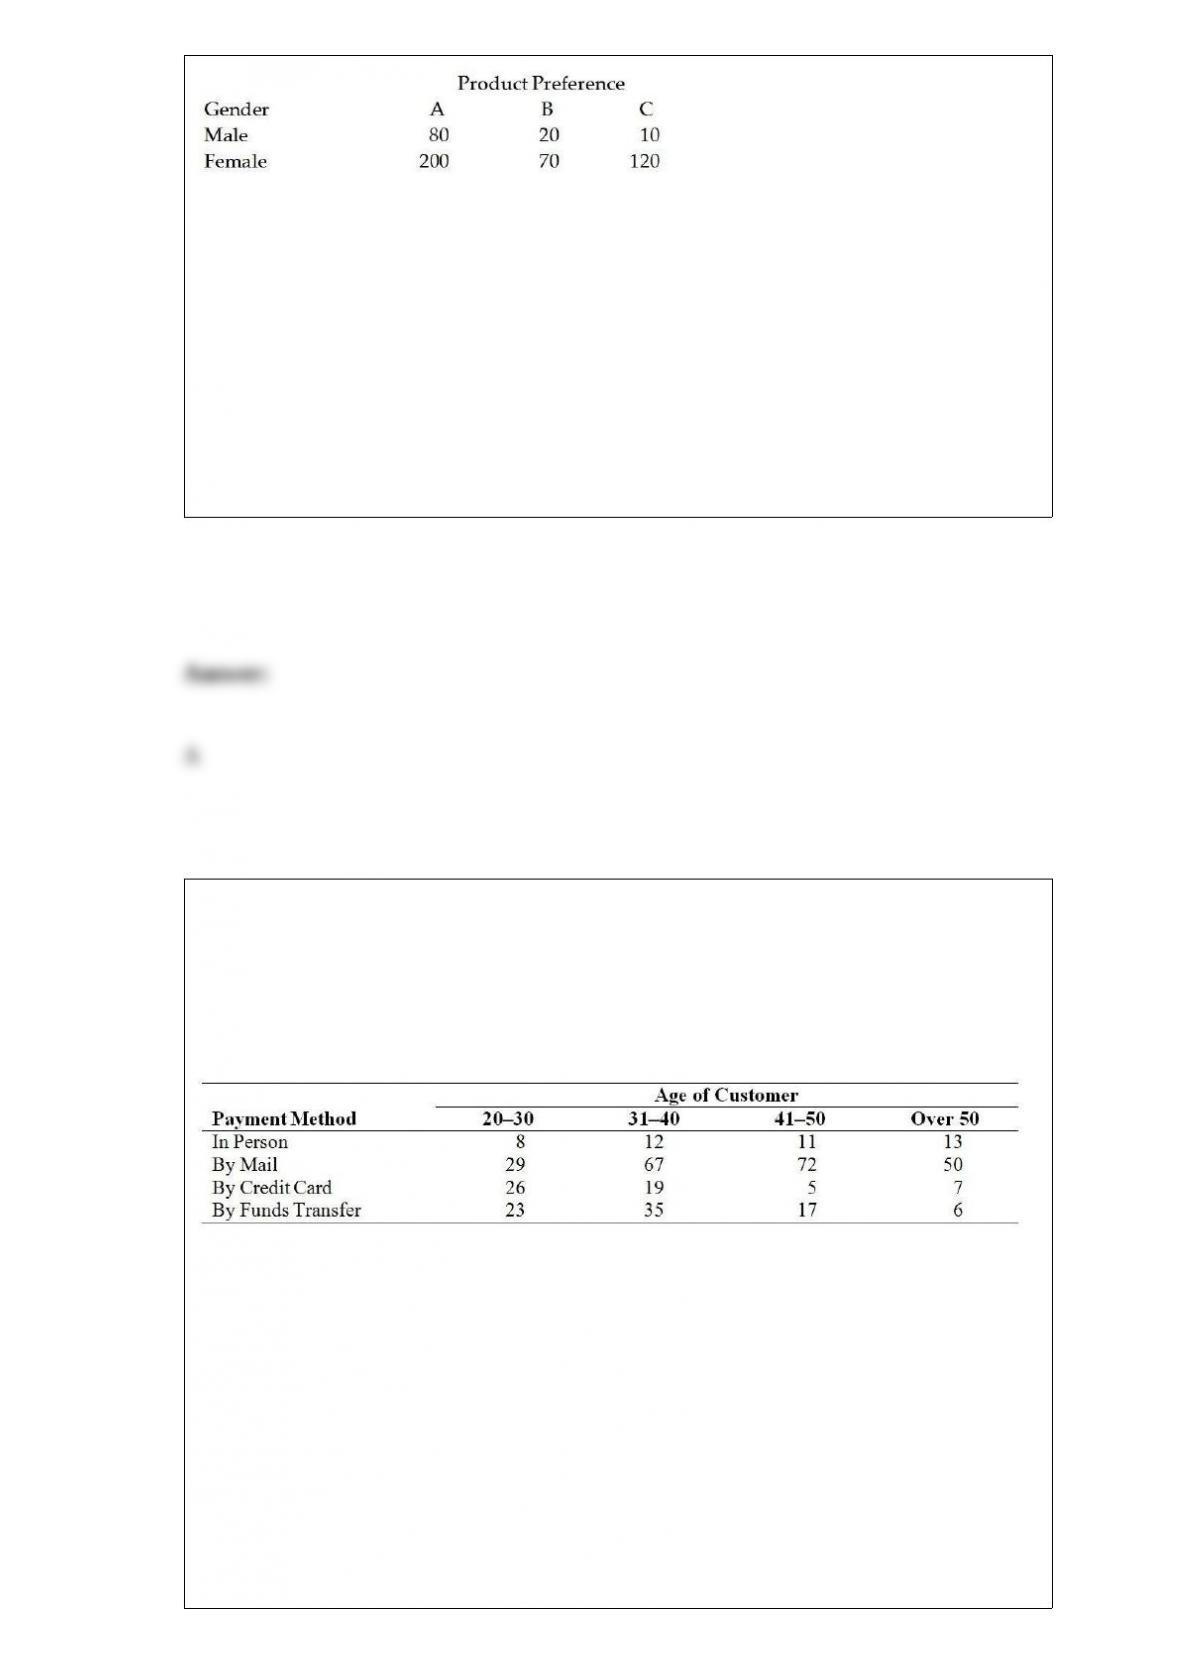
Suppose one person is randomly chosen. Based on this data, what is the probability that
the person chosen is a female who prefers product C?
A) 0.24
B) 0.86
C) 0.92
D) 0.31
The billing department of a national cable service company is conducting a study of
how customers pay their monthly cable bills. The cable company accepts payment in
one of four ways: in person at a local office, by mail, by credit card, or by electronic
funds transfer from a bank account. The cable company randomly sampled 400
customers to determine if there is a relationship between the customer’s age and the
payment method used. The following sample results were obtained:
Based on the sample data, can the cable company conclude that there is a relationship
between the age of the customer and the payment method used? Conduct the
appropriate test at the alpha= 0.01 level of significance.
A) Because x2 = 42.2412 > 21.666, do not reject the null hypothesis. Based on the
sample data conclude that age and type of payment are independent.
B) Because x2 = 42.2412 > 21.666, reject the null hypothesis. Based on the sample data
conclude that age and type of payment are not independent
C) Because x2 = 50.3115 > 21.666, do not reject the null hypothesis. Based on the

sample data conclude that age and type of payment are independent.
D) Because x2 = 50.3115 > 21.666, reject the null hypothesis. Based on the sample data
conclude that age and type of payment are not independent.
The x-bar chart is based on the principles of which distribution?
A) t-distribution
B) Chi square distribution
C) F distribution
D) Normal distribution
Use the following regression results to answer the question below.
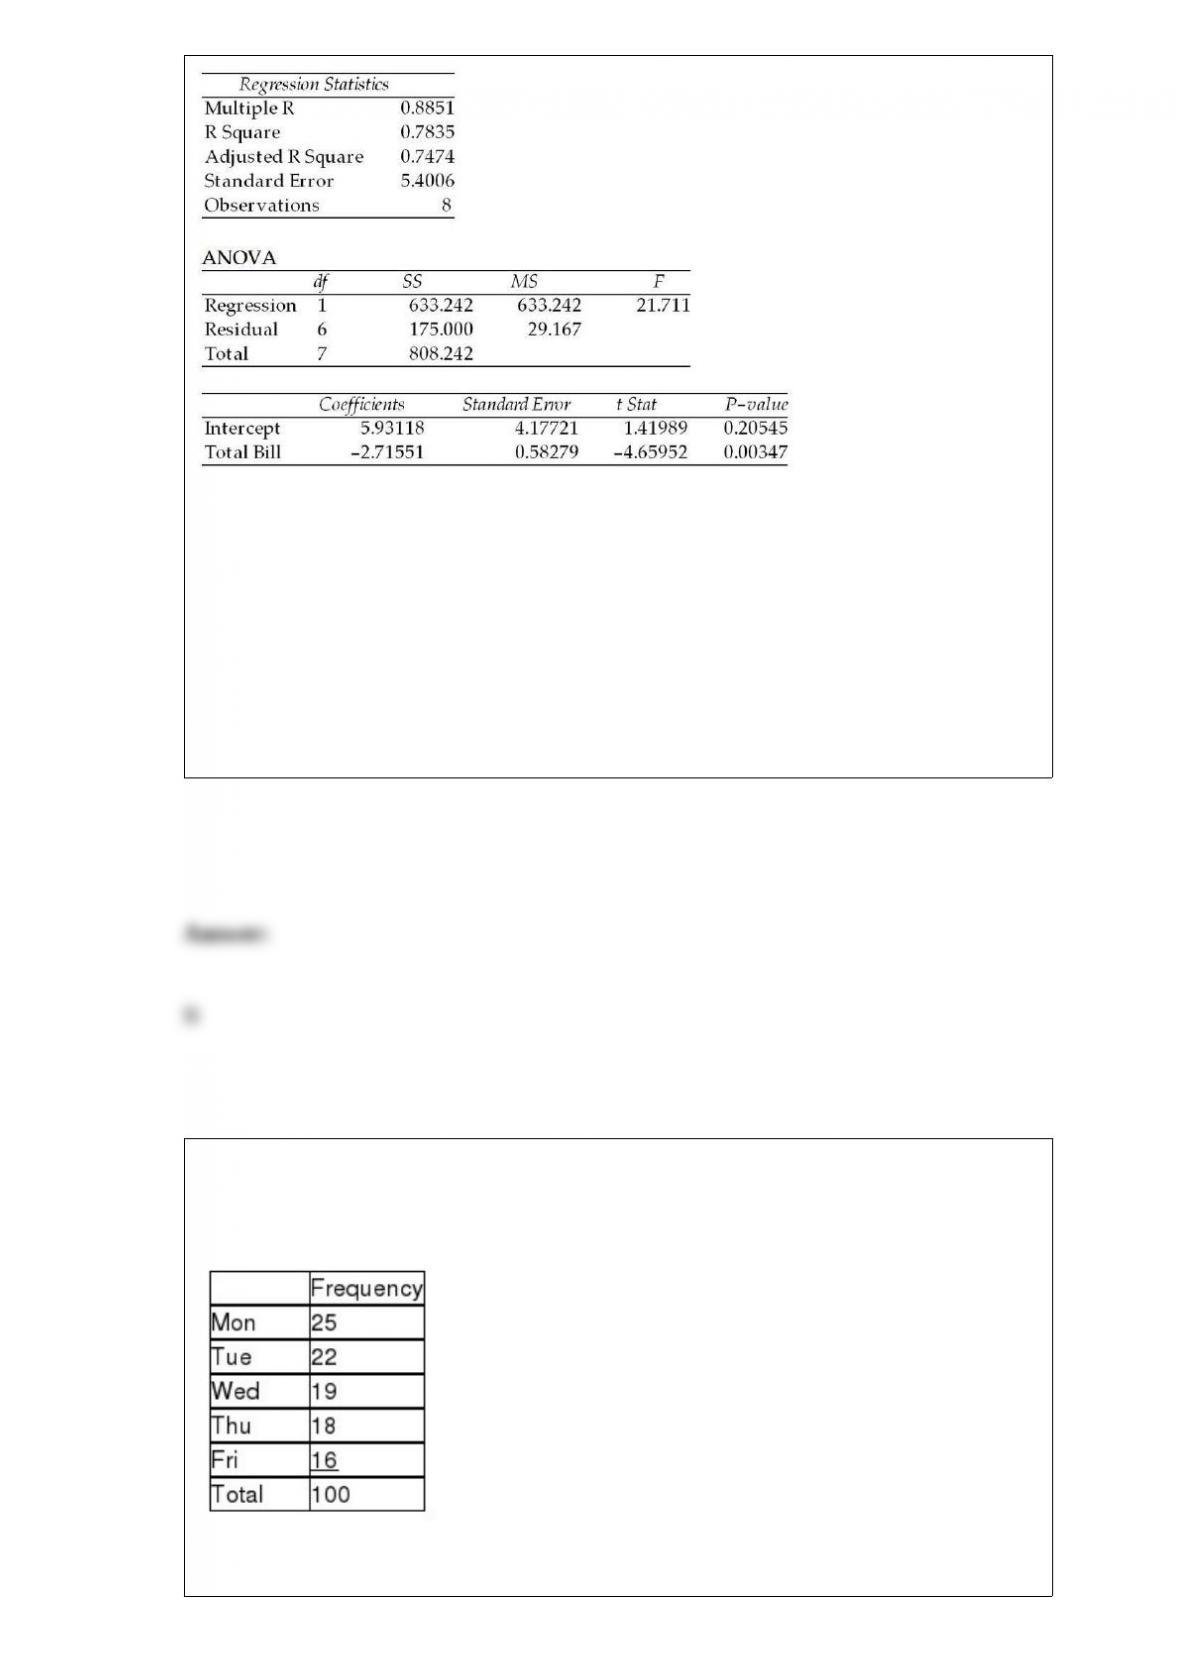
Which of the following is true?
A) The correlation between x and y must be approximately 0.8851.
B) The correlation between x and y must be approximately -0.8851.
C) The correlation between x and y must be approximately 0.7835.
D) The correlation between x and y must be approximately -0.7835.
A walk-in medical clinic believes that arrivals are uniformly distributed over weekdays
(Monday through Friday). It has collected the following data based on a random sample
of 100 days.
What is the value of the test statistic needed to conduct a goodness-of-fit test?

A) 8.75
B) 7.7794
C) 2.46
D) 2.50
If a manager believes that the required sample size is too large for a situation in which
she desires to estimate the mean income of blue collar workers in a state, which of the
following would lead to a reduction in sample size?
A) Reduce the level of confidence
B) Allow a higher margin of error
C) Somehow reduce the variation in the population
D) All of the above
According to USA Today, customers are not settling for automobiles straight off the
production lines. As an example, those who purchase a $355,000 Rolls-Royce typically
add $25,000 in accessories. One of the affordable automobiles to receive additions is
BMW’s Mini Cooper. A sample of 179 recent Mini purchasers yielded a sample mean of
$5,000 above the $20,200 base sticker price. Suppose the cost of accessories purchased
for all Mini Coopers has a standard deviation of $1,500.

Determine the margin of error in estimating the average cost of accessories on Mini
Coopers.
A) 219.75
B) 214.41
C) 231.14
D) 291.11
In conjunction with the housing foreclosure crisis of 2009, many economists expressed
increasing concern about the level of credit card debt and efforts of banks to raise
interest rates on these cards. The banks claimed the increases were justified. A Senate
subcommittee decided to determine if the average credit card balance depends on the
type of credit card used. Under consideration are Visa, MasterCard, Discover, and
American Express. The sample sizes to be used for each level are 25, 25, 26, and 23,
respectively.
State the number of degrees of freedom available for determining the within-samples
variation.
A) 93
B) 95
C) 97
D) 98
A popular restaurant takes a random sample n = 25 customers and records how long
each occupied a table. They found a sample mean of 1.2 hours and a sample standard
deviation of 0.3 hour. Find the 95 percent confidence interval for the mean.
A) 1.2 .118
B) 1.2 .124
C) 1.2 .588
D) 1.2 .609
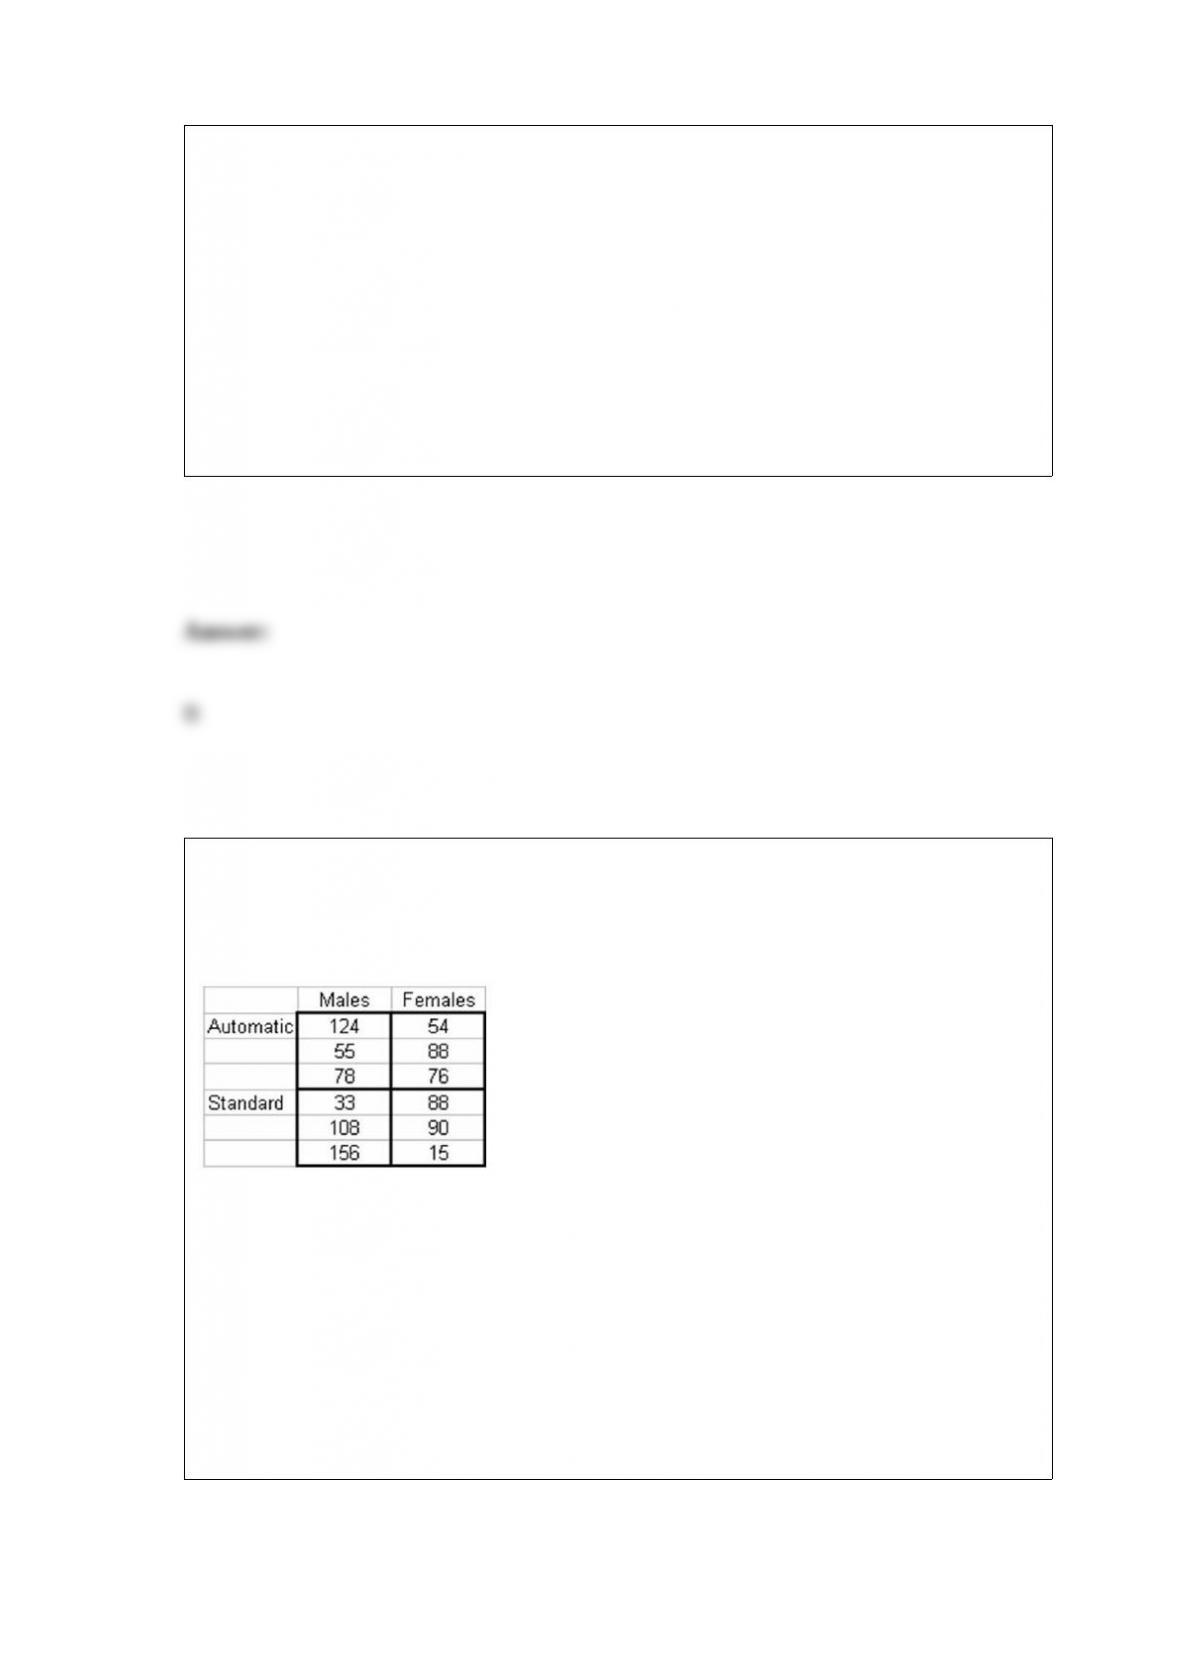
A national car rental company recently conducted a study recently in which cars with
automatic and standard transmissions (factor A-Sample) were rented to male and female
customers (factor B-Columns). Three customers in each category were randomly
selected and the miles driven per day was recorded as follows:
Based on these sample data, and alpha = .05, which of the following statements is true?
A) The means for factor A are significantly different.
B) There is no significant interaction between factors A and B.
C) The means for factor B are significantly different.
D) All of the above statements are true.

Which of the following is not among the most common sources of variation?
A) People
B) Materials
C) Methods
D) Quotas
The Lottaburger restaurant chain in central New Mexico is conducting an analysis of its
restaurants, which take pride in serving burgers and fries to go faster than the
competition. As a part of its analysis, Lottaburger wants to determine if its speed of
service is different across its four outlets. Orders at Lottaburger restaurants are tracked
electronically, and the chain is able to determine the speed with which every order is
filled. The chain decided to randomly sample 20 orders from each of the four
restaurants it operates. The speed of service for each randomly sampled order was noted
and is contained in the file Lottaburger.
At the alpha = 0.05 level of service, can Lottaburger conclude that the speed of service
is different across the four restaurants in the chain?
A) Since F = 18.418 > Fα=0.05 = 2.725, reject the null hypothesis. Based on these
sample data we can conclude that the average service time is different across the four
restaurants in the chain.
B) Since F = 22.666 > Fα=0.05 = 2.725, reject the null hypothesis. Based on these
sample data we can conclude that the average service time is different across the four
restaurants in the chain.
C) Since F = 22.666 > Fα=0.05 = 2.725, do not reject the null hypothesis. Based on these

sample data there is not sufficient evidence to conclude that the average service time is
different across the four restaurants in the chain.
D) Since F = 18.418 > Fα=0.05 = 2.725, do not reject the null hypothesis. Based on these
sample data there is not sufficient evidence to conclude that the average service time is
different across the four restaurants in the chain.
A decision maker is interested in estimating a population proportion. A sample of size n
= 150 yields 115 successes. Based on these sample data, construct a 90% confidence
interval estimate for the true population proportion.
A) (0.714, 0.826)
B) (0.717, 0.823)
C) (0.737, 0.803)
D) (0.750, 0.790)
The director of a state agency believes that the average starting salary for clerical
employees in the state is less than $30,000 per year. To test her hypothesis, she has
collected a simple random sample of 100 starting clerical salaries from across the state
and found that the sample mean is $29,750. State the appropriate null and alternative
hypotheses.
A) H0 : μ ≥ 30,000 HA : μ < 30,000

B) H0 : μ ≥ 29,750 HA: μ < 29,750
C) H0 : μ ≤ 30,000 HA: μ > 30,000
D) H0: μ ≤ 29,750 HA : μ > 29,750
An educational organization in California is interested in estimating the mean number
of minutes per day that children between the age of 6 and 18 spend watching television
per day. A previous study showed that the population standard deviation was 21.5
minutes. The organization selected a random sample of n = 200 children between the
age of 6 and 18 and recorded the number of minutes of TV that each person watched on
a particular day. The mean time was 191.3 minutes. If the leaders of the organization
wish to develop an interval estimate with 98 percent confidence, what would be the
upper and lower limits of the interval estimate?
A) Approximately 187.76 minutes – 194.84 minutes
B) About 141.21 minutes – 241.40 minutes
C) Approximately 188.3 minutes – 194.3 minutes
D) None of the above