
One of the variables that are being considered for inclusion in a multiple regression
model is marital status of the customer. There are four possible responses listed for this
variable. Based on this, four dummy variables will need to be created and incorporated
into the regression model.
A regression equation that predicts the price of homes in thousands of dollars is =
24.6 + 0.055x1 – 3.6x2, where x2 is a dummy variable that represents whether the house
is on a busy street or not. Here
x2 = 1 means the house is on a busy street and x2 = 0 means it is not. From this we can
conclude that on average homes that are on busy streets are worth $3600 more than
homes that are not on busy streets.
A fixed effects analysis of variance differs from a random-effects analysis of variance in
the way in which the sums of squares are computed.
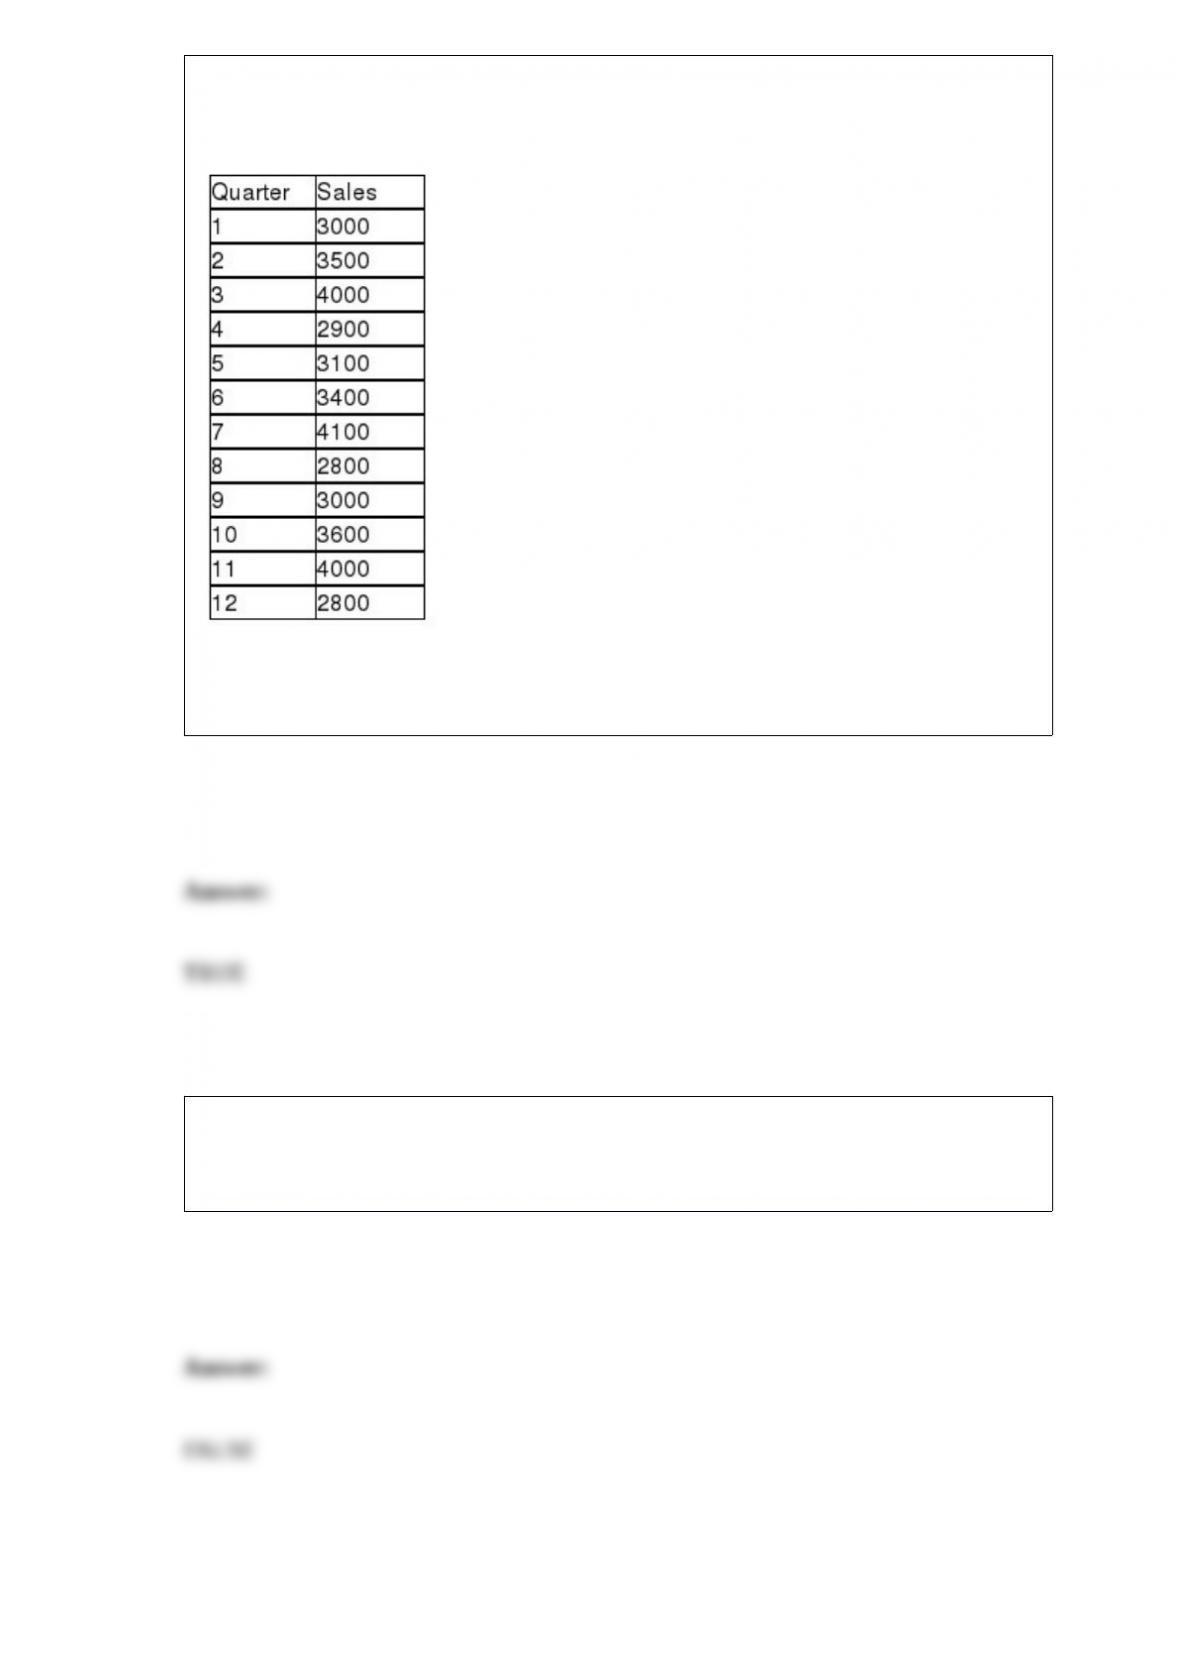
The Baker’s Candy Company has been in business for three years. The quarterly sales
data for the company are shown as follows:
As a first step in computing a seasonal index, the four-period moving average
corresponding to the mid-point between periods 2 and 3 is 3,350.
A stockbroker at a large brokerage firm recently analyzed the combined annual profits
for all firms in the airline industry. One time-series component that may have been
present in these annual data was a seasonal component.
In a recent study of retail daily sales by stores at a mall in Kansas, the minimum daily
sales was $700 and the maximum was $51,000. If you wish to construct a frequency
distribution with 10 classes, the minimum class width would be $5,100.
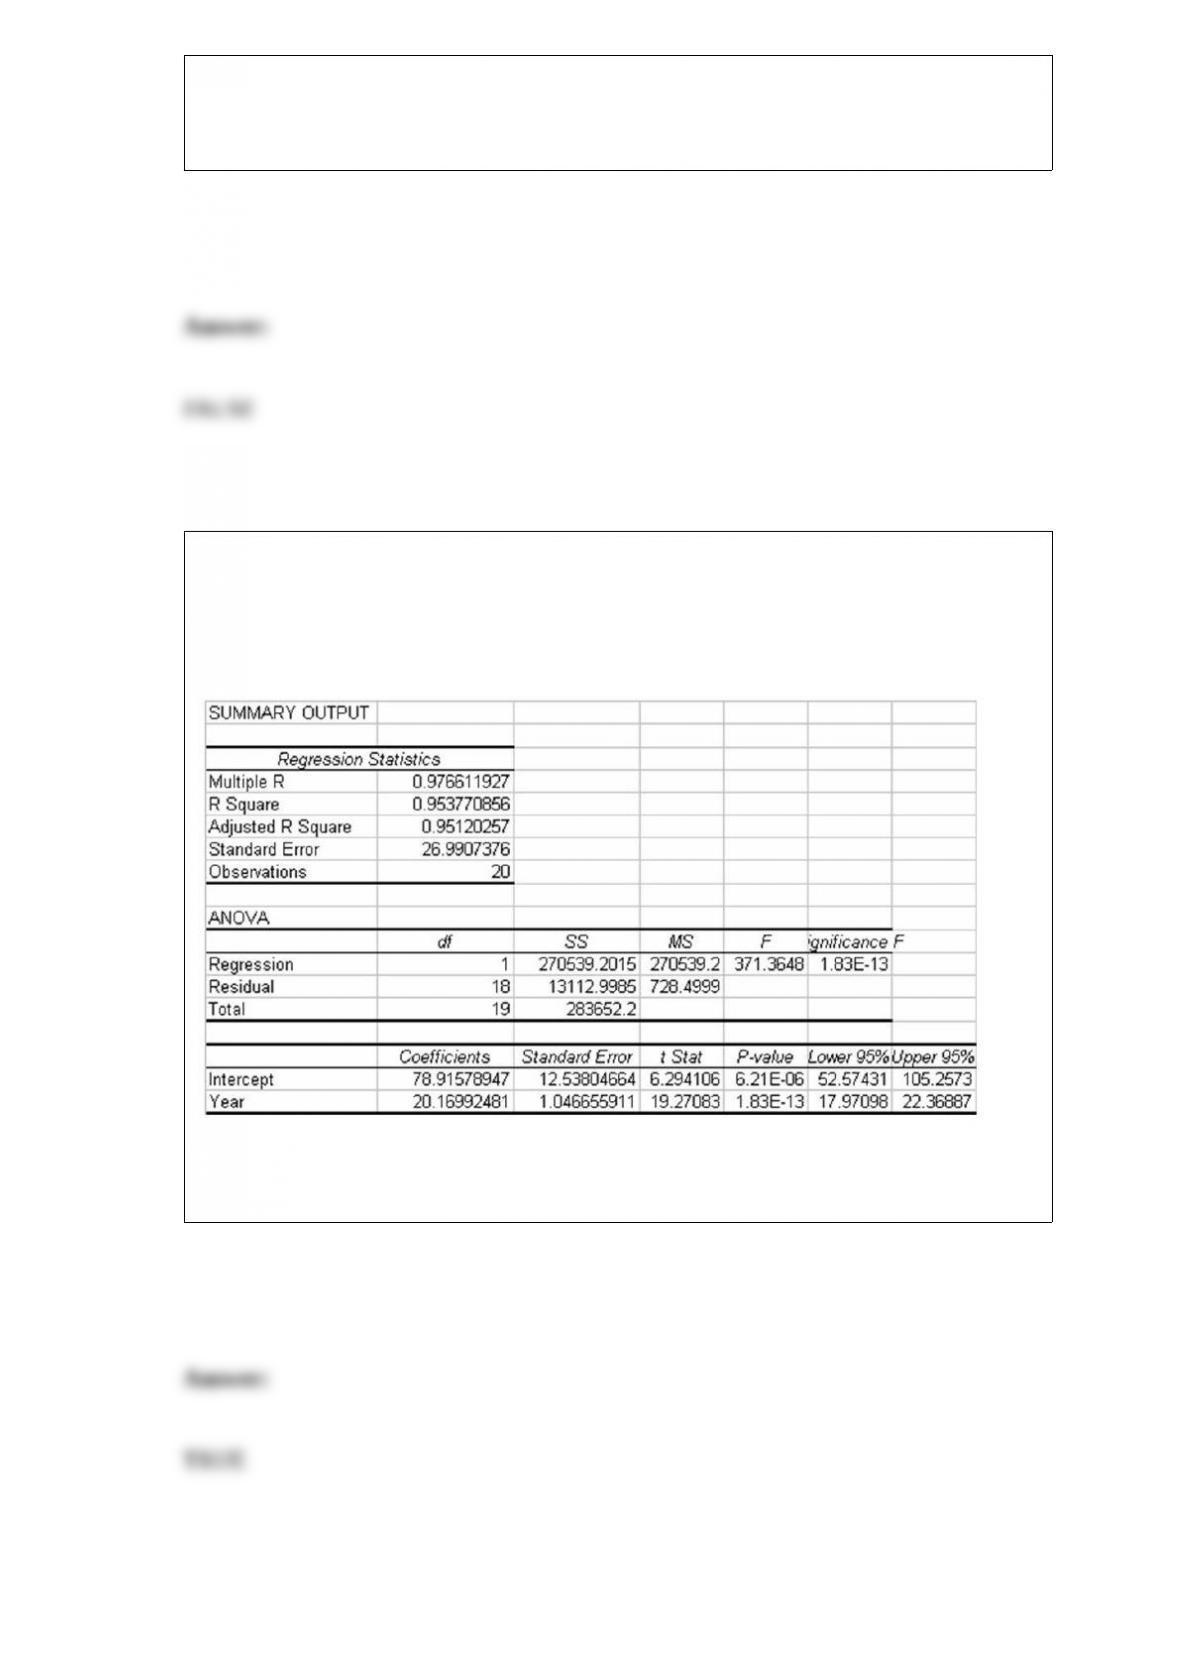
Gibson, Inc. is a holding company that owns several businesses. One such business is a
truck sales company. To help in managing this operation, managers at Gibson have
collected sales data for the past 20 years showing the number of trucks sold each year.
They have then developed the linear trend forecasting model shown as follows:
Based on this information, it appears that the time series has a strong positive linear
trend component.

A recent study involving a sample of 3,000 vehicles in California showed the following
statistics related to the number of miles driven per day: Q1 = 12, Q2 = 45, and Q3 = 56.
Based on these data, if a box and whisker plot is developed, the upper limit value is 122
miles.
When a battery company claims that their batteries last longer than 100 hours and a
consumer group wants to test this claim, the hypotheses should be:
H0: μ ≤ 100
HA : μ > 100
The Parks and Recreation manager for the city of Detroit recently submitted a report to
the city council in which he indicated that a random sample of 500 park users indicated
that the average number of visits per month was 4.56. This value should be viewed as a
statistic by the city council.
In a two-tailed hypothesis test for the difference between two population variances, the
test statistic is an F-ratio formed by putting the larger sample variance in numerator.
In regression model: y = β0 + β1x1 + β2 + ε , if β2< 0, then the value of y is expected
to increase with x until x reaches a certain point after which the value of y is expected
to decrease.
In a simple regression model, if the regression model is deemed to be statistically
significant, it means that the regression slope coefficient is significantly greater than
zero.
The loan manager for State Bank and Trust has claimed that the mean loan balance on
outstanding loans at the bank is over $14,500. To test this at a significance level of 0.05,
a random sample of n = 100 loan accounts is selected. Assuming that the population

standard deviation is known to be $3,000, the null and alternative hypotheses to be
tested are:
H0 : μ ≤ $14,500
HA : μ > $14,500
An article in an operations management journal recently stated that a formal hypothesis
test rejected the hypothesis that mean employee productivity was less than $45.70 per
hour in the wood processing industry. Given this conclusion, it is possible that a Type I
statistical error was committed.
A major car magazine has recently collected data on 30 leading cars in the U.S. market.
It is interested in building a multiple regression model to explain the variation in
highway miles. The following correlation matrix has been computed from the data
collected:
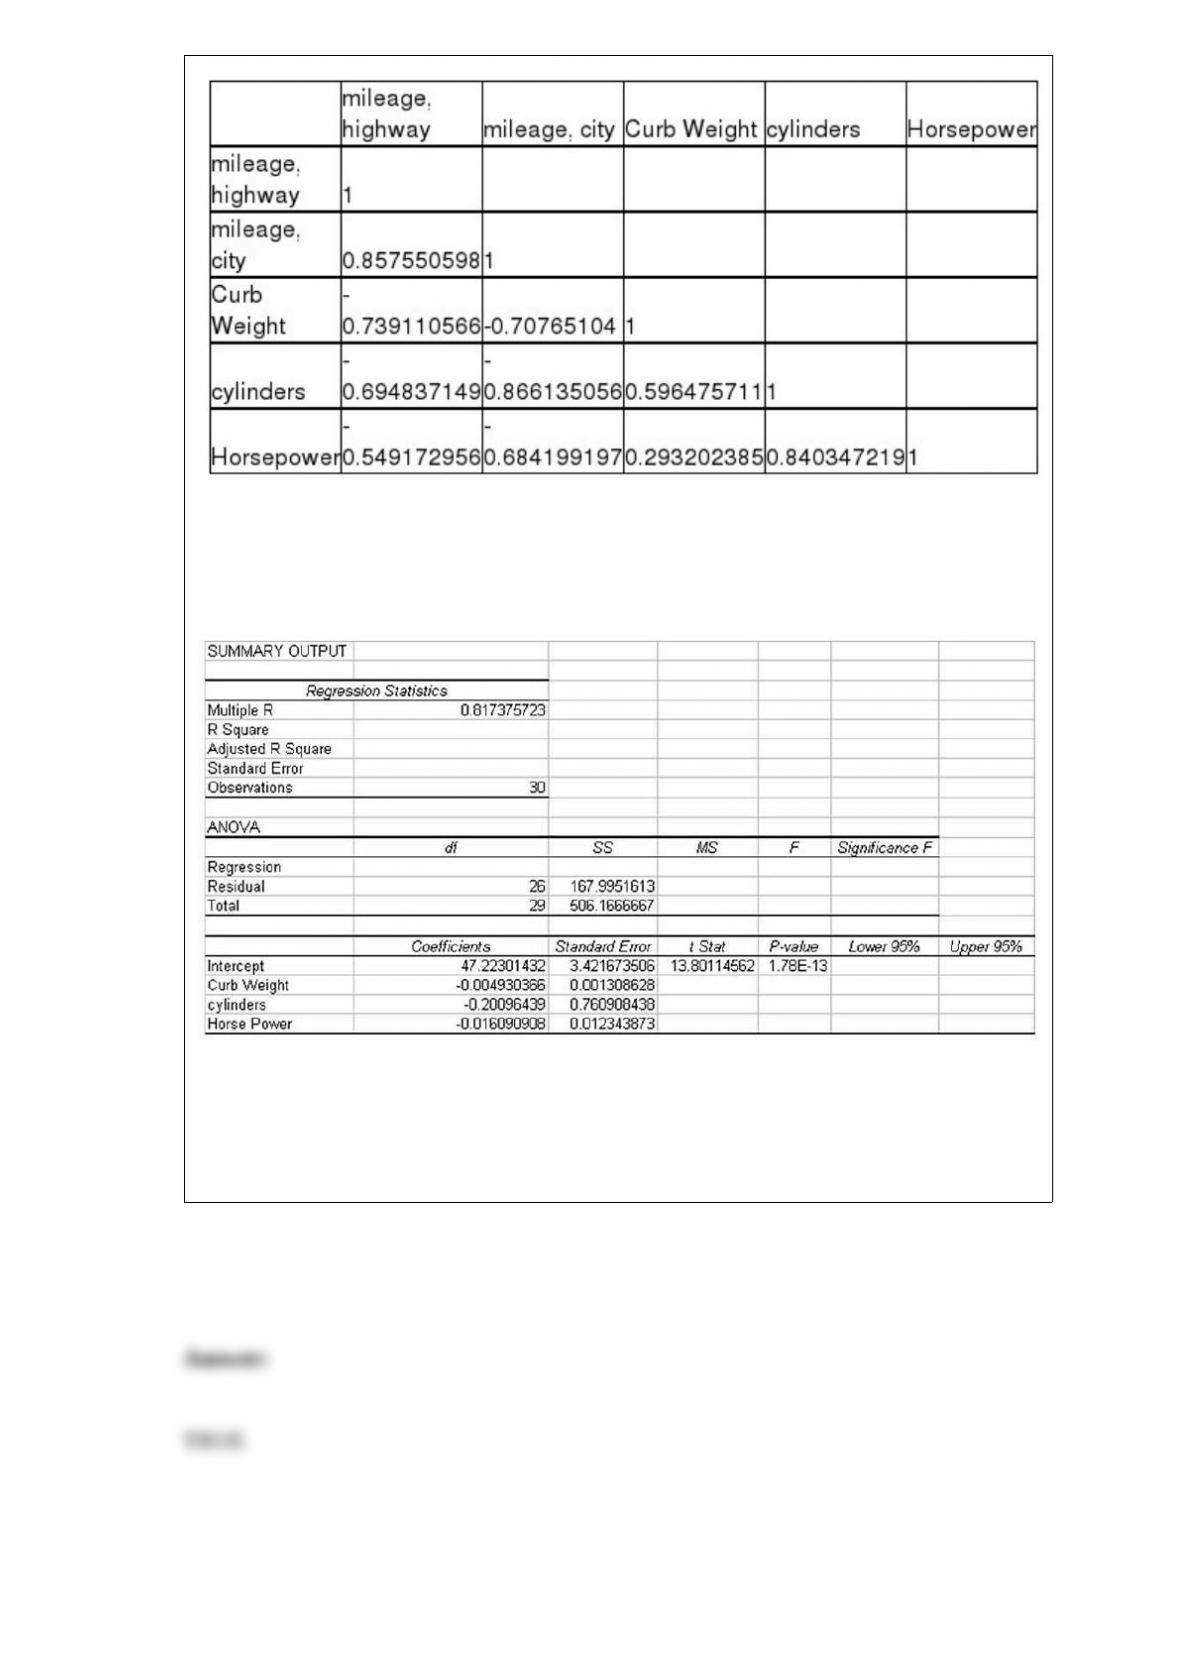
The analysts also produced the following multiple regression output using curb weight,
cylinders, and horsepower as the three independent variables. Note, a number of the
output fields are missing, but can be determined from the information provided.
Based on the information provided, the 95 percent confidence interval estimate for
regression slope coefficient for horsepower is approximately – 0.041 to 0.009 and since
this interval crosses zero, we are unable to conclude that the regression slope coefficient
for this variable is different from zero.

A company has 20 cars that are available for use by company executives for official
business purposes. Six of these cars are SUVs, 8 are luxury type cars, and the rest are
basic sedans. Suppose the cars are randomly assigned each week. If 5 cars are put into
use, the chance that none of the SUVs or luxury cars will be in the group is
approximately .0004.
In a multiple regression model, the adjusted R-square value measures the explained
variation in the dependent variable after taking into account the relationship between
the sample size and the number of independent variables in the model.
One reason for examining the adjusted R-square value in a multiple regression analysis
is that the R-square value will increase just by adding additional independent variables
to the model, whereas the adjusted R-square accounts for the relationship between the
number of independent variables and the sample size and may actually decline if
inappropriate independent variables are included in the model.

The Brockingham Carpet Company prides itself on high quality carpets. At the end of
each day, the company quality managers select 3 square yards for inspection. The
quality standard requires an average of no more than 2.3 defects per square yard. The
expected number of defects that the inspector will find during the inspection is 6.9.
In one-way analysis of variance, the within-sample variation is not affected by whether
the null hypothesis is true or not.
Double exponential smoothing is used instead of single exponential smoothing when
extra smooth forecasts are desired.
The State Department of Forests has determined that annual tree growth in a particular
forest area is normally distributed with a mean equal to 17 inches and a standard
deviation equal to 6 inches. If 2 trees are randomly chosen, the probability that both
trees will have grown more than 20 inches during the year is approximately .037.
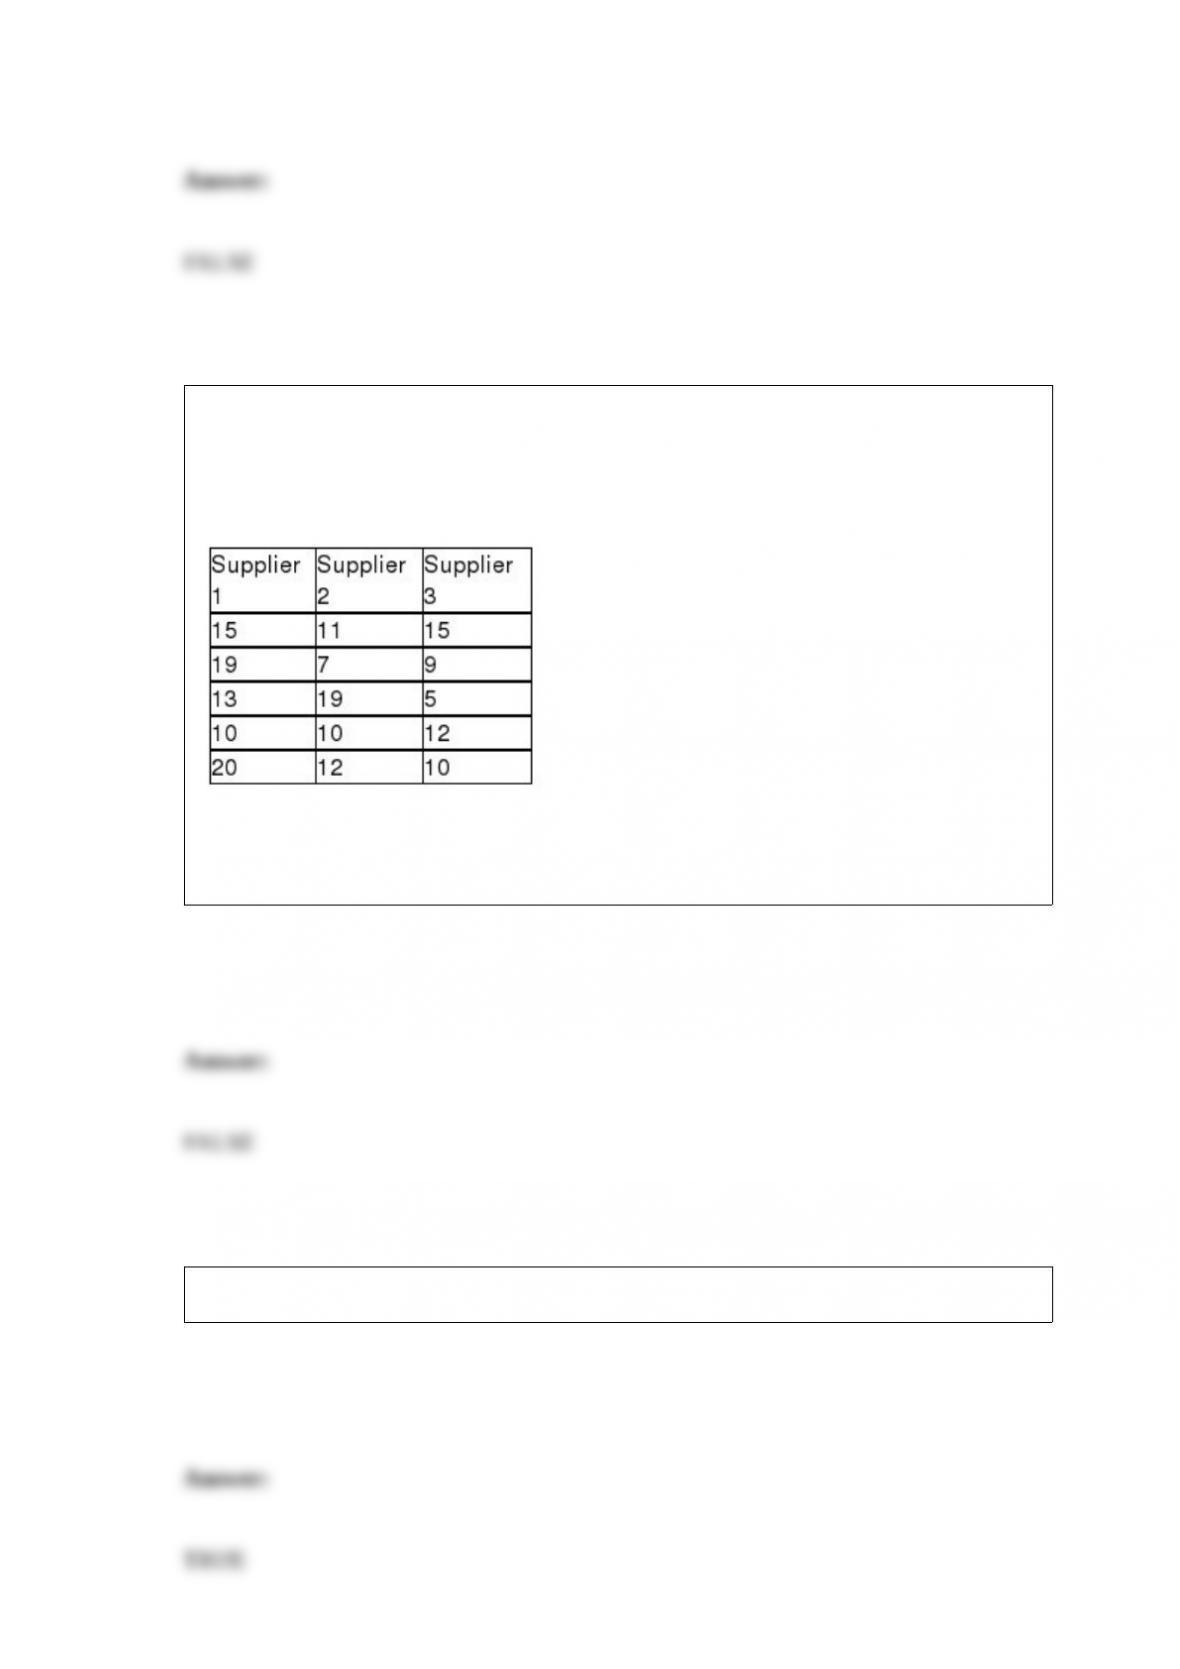
A recent study was conducted to determine if any of three suppliers of electronic
components has a different median delivery time on special orders. To test this, five
orders were given to each supplier and the delivery days were recorded. These data are
shown as follows:
If a Kruskal-Wallis test is to be performed, the critical value for a test conducted using
an alpha = .05 level is χ2 = 11.0705
If a time series involves monthly data there will be a total of 12 seasonal indexes.

If a set of data contains no values of x that are equal to zero, then the regression
coefficient, b0, has no particular meaning.
A histogram can be constructed for data that are either quantitative or qualitative.
Recently a survey was conducted in which customers of a large insurance company
were asked to indicate the number of speeding tickets they had received in the past
three years. The data in this case would most likely be analyzed using a frequency
distribution with the data grouped into classes such as 0-2, 3-5, 6-8, etc.
In a particular city, the proportion of cars that would fail an air quality emissions test is
thought to be 0.13. Given this, the probability that a random sample of n = 200 cars will

have a sample proportion between 0.11 and 0.15 is approximately 0.60.
The size of the sampling error that comes from a random sample depends on both the
variation in the population and the size of the sample being selected.
In Excel, joint frequency distributions can be generated using the Pivot Table feature
under the Data tab.
A survey was recently conducted in which random samples of car owners of Chrysler,
GM, and Ford cars were surveyed to determine their satisfaction. Each owner was
asked to rate overall satisfaction on a scale of 1 (poor) to 1000 (excellent). The
following data were recorded:
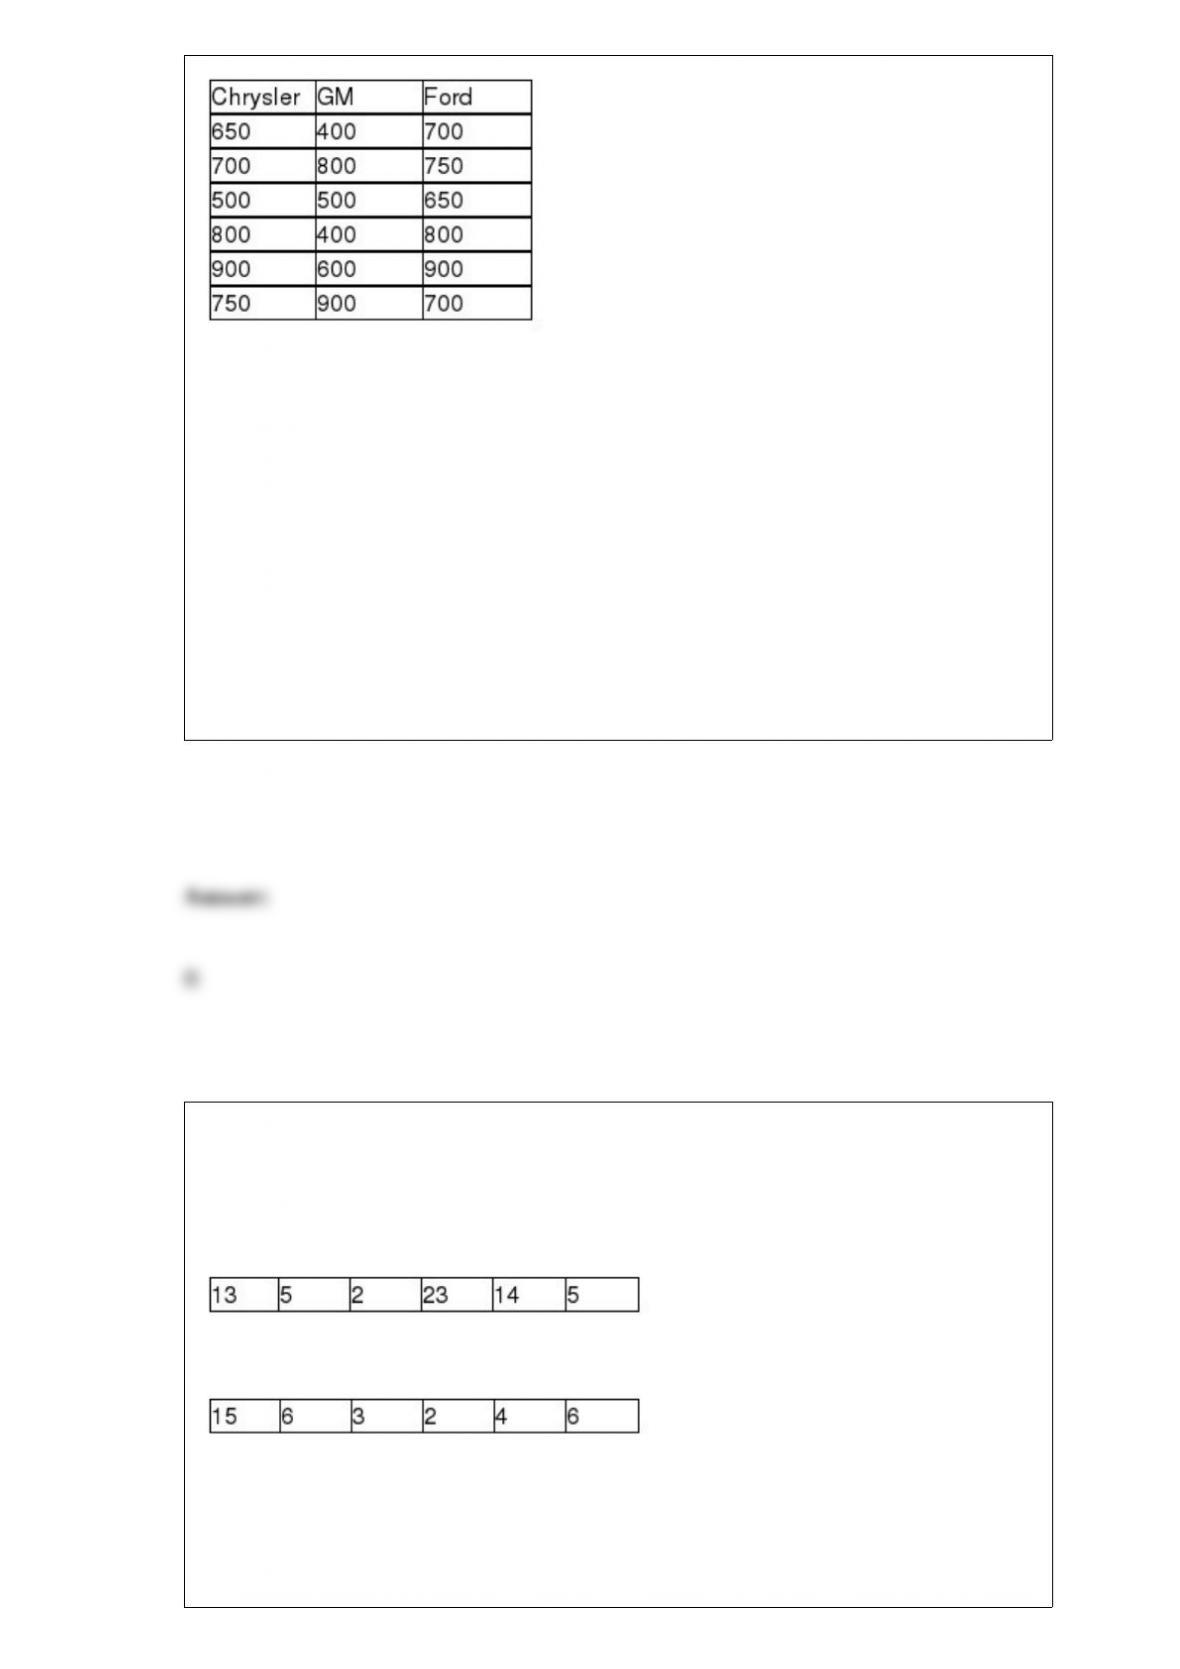
If the analysts are not willing to assume that the population ratings are normally
distributed and will use the Kruskal-Wallis test to determine if the three companies have
different median ratings, what is the appropriate critical value if the test is to be
conducted using an alpha = .05 level?
A) = 5.05
B) χ2 = 5.99
C) χ2 = 24.99
D) = 3.67
Consider the following data, which represent the number of miles that employees
commute from home to work each day. There are two samples: one for males and one
for females.
Males:
Females:
Which of the following statements is true?
A) Females have the larger mean.

B) The coefficient of variation is larger for females than for males.
C) The coefficient of variation is larger for males than for females.
D) Females have the larger range.
Which of the following statements is true with respect to a simple linear regression
model?
A) The percent of variation in the dependent variable that is explained by the regression
model is equal to the square of the correlation coefficient between the x and y variables.
B) If the correlation coefficient between the x and y variables is negative, the sign on
the regression slope coefficient will also be negative.
C) If the correlation between the dependent and the independent variable is determined
to be significant, the regression model for y given x will also be significant.
D) All of the above are true.
A company is interested in determining which of several advertising layouts is most
effective at generating additional sales. The data collection tool that would most likely
be used in this situation is:
A) telephone survey.
B) mail questionnaire.
C) experiment.
D) observation.
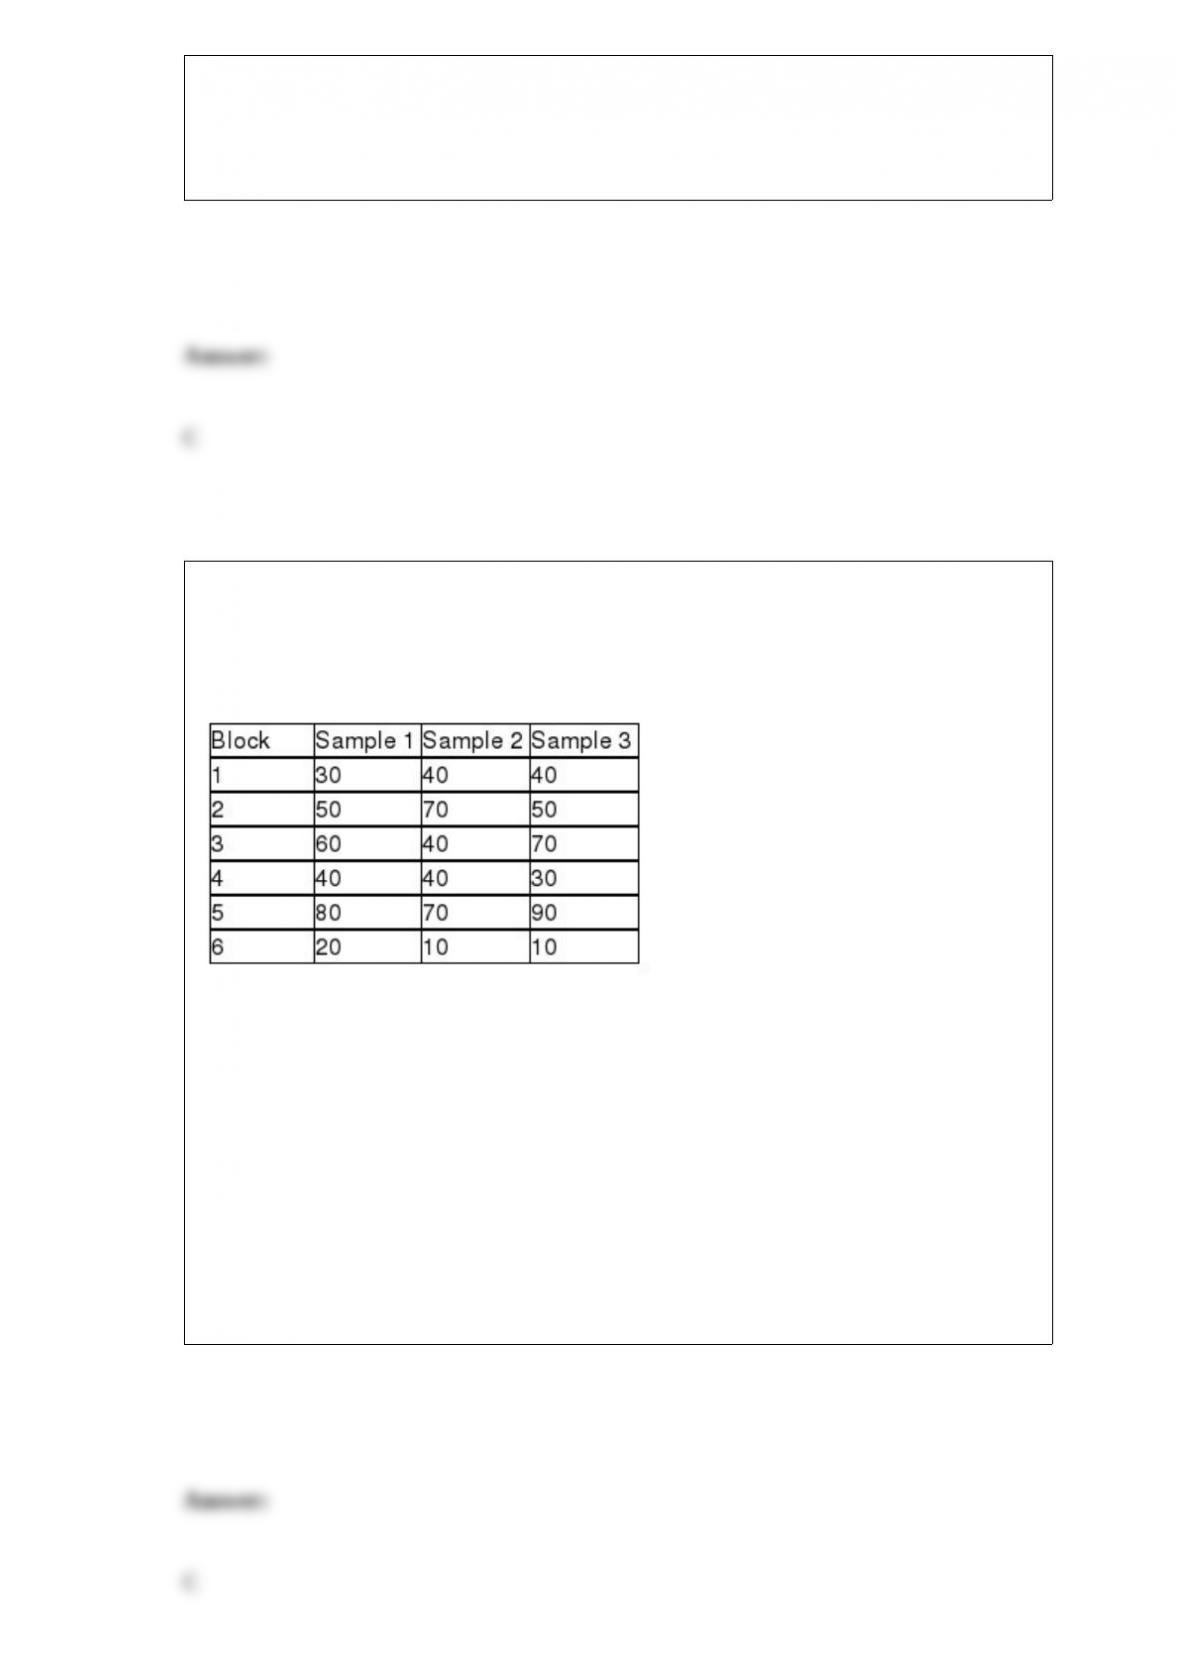
The following sample data were recently collected in the course of conducting a
randomized block analysis of variance. Based on these sample data, what conclusions
should be reached about blocking effectiveness and about the means of the three
populations involved? Test using a significance level equal to 0.05.
A) Because F = 0.4195 < critical F = 4.103, we do not reject the null hypothesis and
conclude that the three populations may have the same mean value.
B) Because F = 0.4195 < critical F = 4.103, we reject the null hypothesis and conclude
that the three populations do not have the same mean value.
C) Because F = 0.1515 < critical F = 4.103, we do not reject the null hypothesis and
conclude that the three populations may have the same mean value.
D) Because F = 0.1515 < critical F = 4.103, we reject the null hypothesis and conclude
that the three populations do not have the same mean value.

Which of the following time-series components is almost always present in sales data
for electronics companies?
A) Random
B) Trend
C) Seasonal
D) All of the above
Nonparametric statistical tests are used when:
A) the sample sizes are small.
B) we are unwilling to make the assumptions of parametric tests.
C) the standard normal distribution cannot be computed.
D) the population parameters are unknown.
Which of the following is an acceptable format for setting up class boundaries for a
frequency distribution?
A) 20 to under 40

B) 20 to 40
C) 200 to 299.99
D) All of the above.
If the number of defective items selected at random from a parts inventory is considered
to follow a binomial distribution with n = 50 and p = 0.10, the standard deviation of the
number of defective parts is:
A) 5
B) 4.5
C) 45
D) about 2.12
The managers of a local golf course have recently conducted a study of the types of golf
balls used by golfers based on handicap. A joint frequency table for the 100 golfers
covered in the survey is shown below:

Based on these data, the probability of a golfer having a handicap less than 10 is:
A) 0.52
B) 0.10
C) 0.34
D) None of the above
If a Mann-Whitney U test was performed and U1 = 50 and U2 = 40, if the sample from
population 1 was 10, the sample size from population 2 was:
A) 10
B) 15
C) 9
D) Can’t be determined without more information.
If we are interested in testing to determine whether the center of three or more
populations is equal when the data in the samples are ordinal, what is the appropriate
test to conduct?
A) A t-test

B) An ANOVA
C) A Kruskal-Wallis
D) A Wilcoxon Matched-Pairs Sign Rank test
Assume that you have calculated a prediction of = 110 where the specific value for x
is equal to the average value of x. Also assume that n = 201 and that the standard error
of the estimate is sε = 4.5. Find the approximate 95 percent prediction interval.
A) About 101 —– 119
B) About 109.4 —– 110.6
C) About 105.5 —– 104.5
D) About 98.4 —– 121.6
A major airline is interested in monitoring customer satisfaction with its baggage
handling process. To do so, each day the airline randomly selects 100 customers and
surveys them to determine if they are satisfied or not with the service provided. After 20
samples, a total of 260 unsatisfied customers were surveyed.
a. If the airline wishes to use a control chart, which chart would you recommend and
why?
b. Determine the 3-sigma control limits for the appropriate control chart.

Assume that 10 people join a weight loss program for 3 months. Each person’s weight
both before and after the program is recorded and the number of pounds each person
lost is found. The following summarizes the results for the 10 people:
Mean weight lost = 9 pounds
Sample standard deviation of weight lost = 4.6 pounds
Assume that the hypothesis test will be conducted to determine whether or not the
weight loss program is effective using a 0.05 level of significance. What is the value of
the test statistic?
A) t = 6.19
B) t = 1.96
C) z = 1.96
D) z = 6.19
A population has a proportion equal to 0.30. Calculate the following probabilities with
n = 100. Find P( > 0.40).
A) 0.0146
B) 0.0411
C) 0.0521
D) 0.0312

Considering the following printout for a two-factor ANOVA design, which of the
following is a proper conclusion to reach?
A) There is no significant interaction between the two factors.
B) The levels of factor A (Sample) have significantly different means.
C) The levels of factor B (Columns) have significantly different means.
D) The total number of observations is 47.
Woof Chow Dog Food Company believes that it has a market share of 25 percent. It
surveys n = 100 dog owners and ask whether or not Woof Chow is their regular brand
of dog food, and 23 people say yes. Based upon this information, what is the value of
the test statistic?
A) -0.462
B) -0.475
C) 0.462
D) 0.475
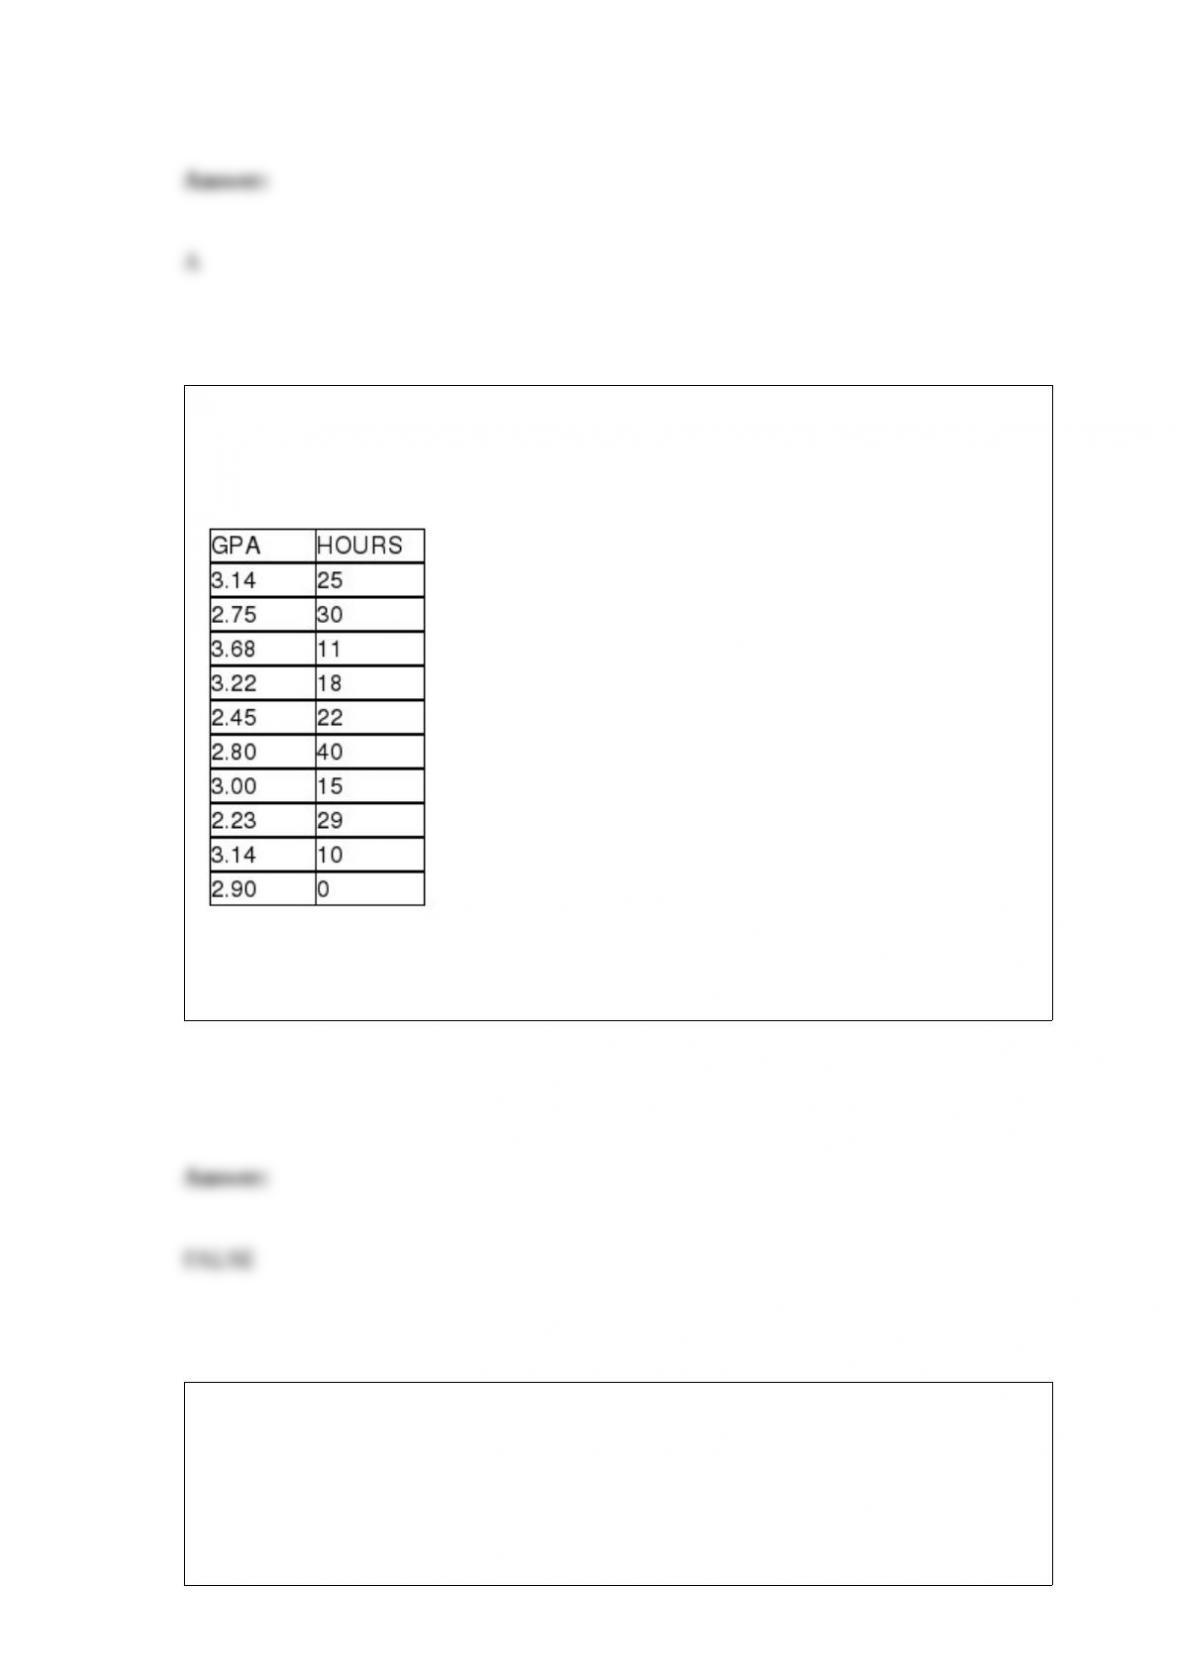
State University recently randomly sampled ten students and analyzed grade point
average (GPA) and number of hours worked off-campus per week. The following data
were observed:
The test statistic for testing whether the two variables are significantly correlated is
approximately z = 1.56.
The Olsen Agricultural Company has determined that the weight of hay bales is
normally distributed with a mean equal to 80 pounds and a standard deviation equal to 8
pounds. Based on this, what is the probability that the mean weight of the bales in a
sample of n = 64 bales will be between 78 and 82 pounds?
A) 0.4772

B) 0.0228
C) 0.6346
D) 0.9544
Allante Pizza delivers pizzas throughout its local market area at no charge to the
customer. However, customers often tip the driver. The owner is interested in estimating
the mean tip income per delivery. To do this, she has selected a simple random sample
of 12 deliveries and has recorded the tips that were received by the drivers. These data
are:
Based on these sample data, what is the best point estimate to use as an estimate of the
true mean tip per delivery?
A) 1.875
B) 1.811
C) 1.50
D) 1.312

Which of the following is true about forecast bias?
A) It is the mean absolute deviation.
B) It is equal to the square root of the MSE.
C) When it is negative it means that the forecasts tended to be high.
D) When it is positive it means that the forecasts tended to be high.
Which of the following statements is true?
A) A binomial distribution with n = 20 and p = 0.05 will be right-skewed.
B) A binomial distribution with n = 6 and p = 0.50 will be symmetric.
C) A binomial distribution with n = 20 and p = 0.05 has an expected value equal to 1.
D) A, B, and C are all true.
The makers of Sweet-Things candy sell their candy by the box. Based on company
policy, the mean target weight of all boxes is 2.0 pounds. To make sure that they are not
putting too much in the boxes, the manager wants no more than 3 percent of all boxes
to contain more than 2.10 pounds of candy. In order to do this, what should the mean
fill weight be set to if the fill standard deviation is 0.13 pounds? Assume that the box
weights are normally distributed.

A) Just over 2 pounds
B) Approximately 2.33 pounds
C) Nearly 1.27 pounds
D) Approximately 1.86 pounds
Sampling error occurs when:
A) a nonstatistical sample is used.
B) the statistic computed from the sample is not equal to the parameter for the
population.
C) a random sample is used rather than a convenience sample.
D) a confidence interval is used to estimate a population value rather than a point
estimate.
An animal shelter wants to estimate the mean number of animals housed daily and they
know the standard deviation. If they want to find a 98 percent confidence interval the
critical value to use is:
A) 1.645
B) 1.98
C) 2.33
D) 2.575
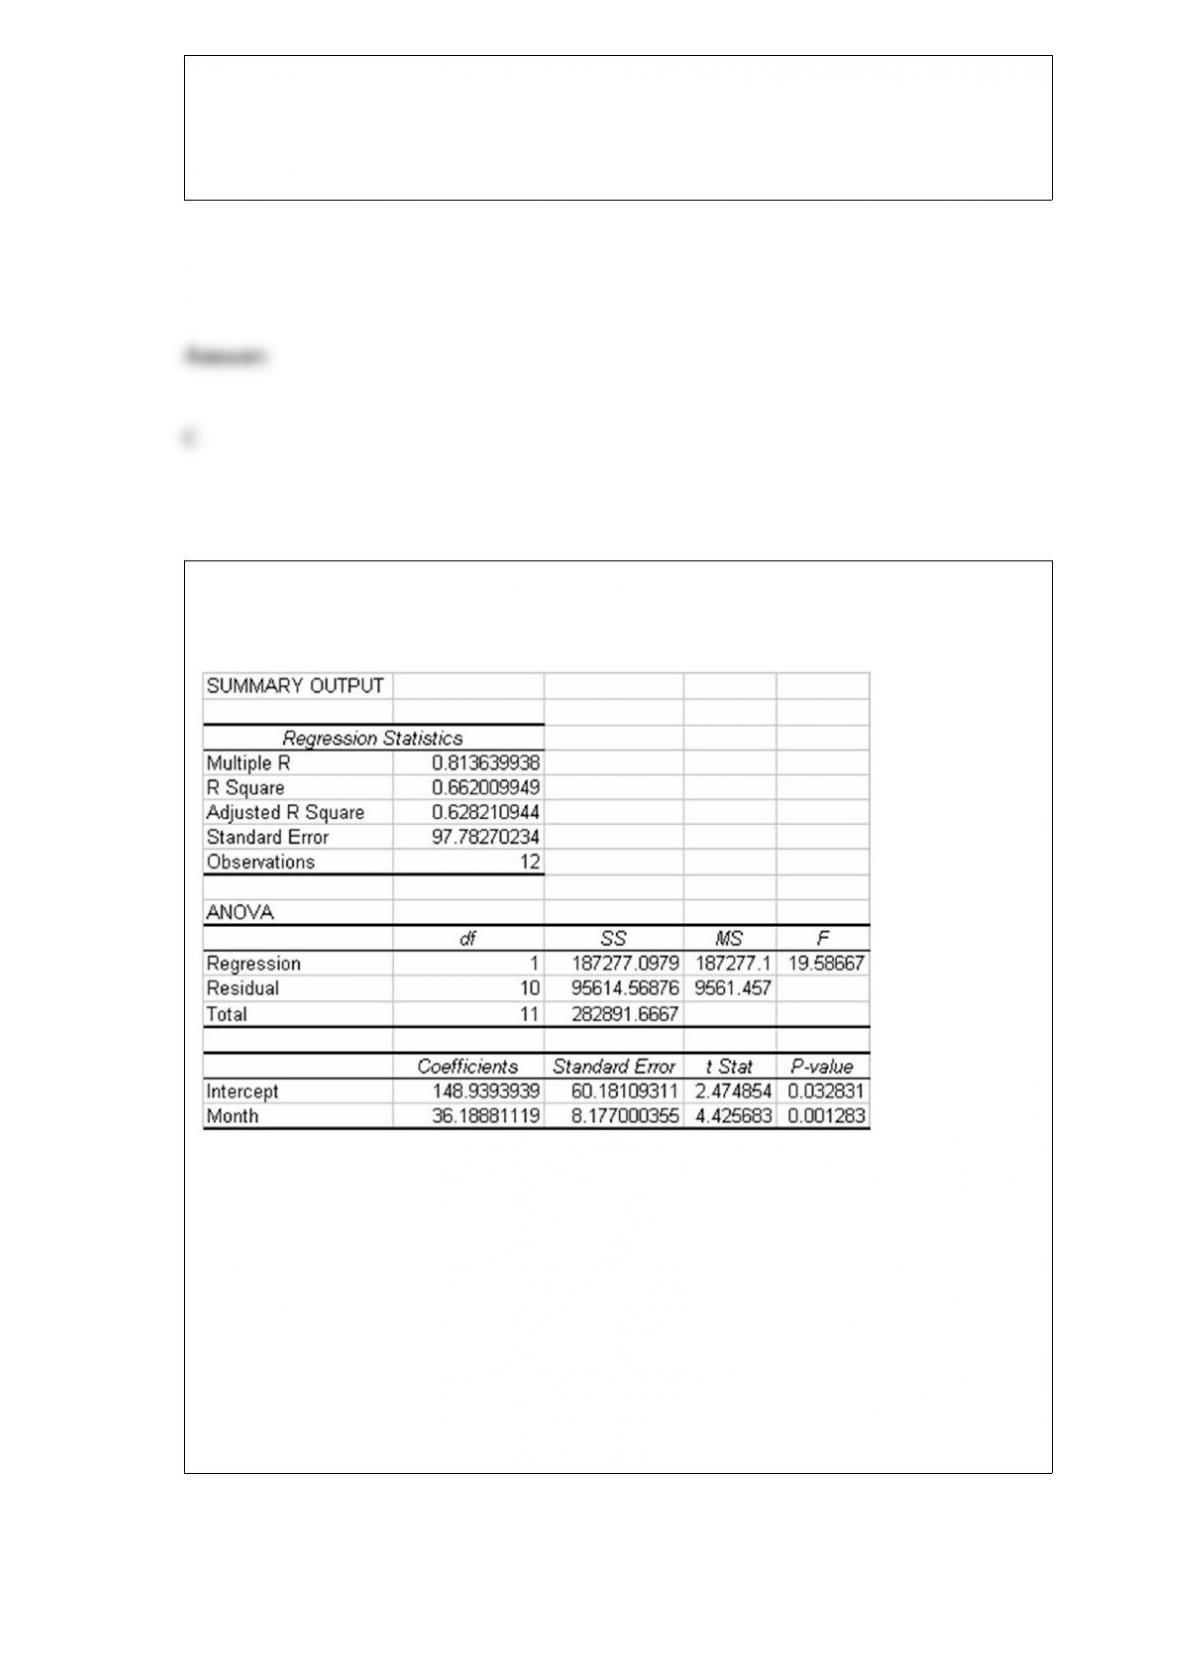
The following output is provided for a linear trend regression-based forecasting model
based on 12 months of data:
Suppose that the actual sales for months 13-15 are: 720, 680, 800. Given this, which of
the following is the forecast bias value for months 13-15?
A) Approximately 77.7
B) Approximately 233.2
C) About -56.8
D) Just under 80

A particular subdivision has 20 homes. The number of people living in each of these
homes is listed as follows:
If a sample of size n = 5 is selected, the largest possible sample mean is:
A) 7
B) 6.5
C) 6
D) 5.4
When someone is on trial for suspicion of committing a crime, the hypotheses are:
H0 : innocent
HA : guilty
Which of the following is correct?
A) Type I error is acquitting a guilty person.
B) Type I error is convicting an innocent person.
C) Type II error is acquitting an innocent person.

D) Type II error is convicting an innocent person.
In a regression analysis situation, the standard error of the slope is:
A) a measure of the variation in the regression slope from sample to sample.
B) equal to the square root of the standard error of the estimate.
C) a measure of the amount of change in y that will occur for a one-unit change in x.
D) All of the above
A standardized residual is:
A) equal to the sum of the residuals divided by n-1.
B) the ratio of each residual divided by an estimate for the standard deviation of the
residuals.
C) a value that is normally distributed with a mean equal to zero and a standard
deviation equal to one.
D) None of the above