

The Brockingham Carpet Company prides itself on high quality carpets. At the end of
each day, the company quality managers select 3 square yards for inspection. The
quality standard requires an average of no more than 2.3 defects per square yard. Last
night, the inspector found 8 defects in the sample of 3 square yards. The chance of
finding 8 or more defects in the sample is 0.9975.
In a scatter plot the points should always be connected with a line.
Twenty one (21) customers out of a simple random sample of 50 said that they came to
the grocery store within one month after getting a card from the company. Based on the
data, the marketing manager thinks that the number of total customers who would come
in to the grocery store within one month is 4,200 because 10,000 cards were mailed.
A dairy farm in Wisconsin bottles milk in one gallon containers. At a recent meeting,
the production manager asked top management for a new filling machine that he argued


would assure that all containers had exactly one gallon of milk. Based on sound
statistical principles, the top management group should conclude that the production
manager could have merit to his argument.
The reason that a decision maker might want to combine groups before performing a
goodness-of-fit test is to avoid accepting the null hypothesis due to an inflated value of
the test statistic.
If two variables are related in a positive linear manner, the scatter plot will show points
on the x,y space that are generally moving from the lower left to the upper right.
Suppose a study of houses that have sold recently in your community showed the
following frequency distribution for the number of bedrooms:

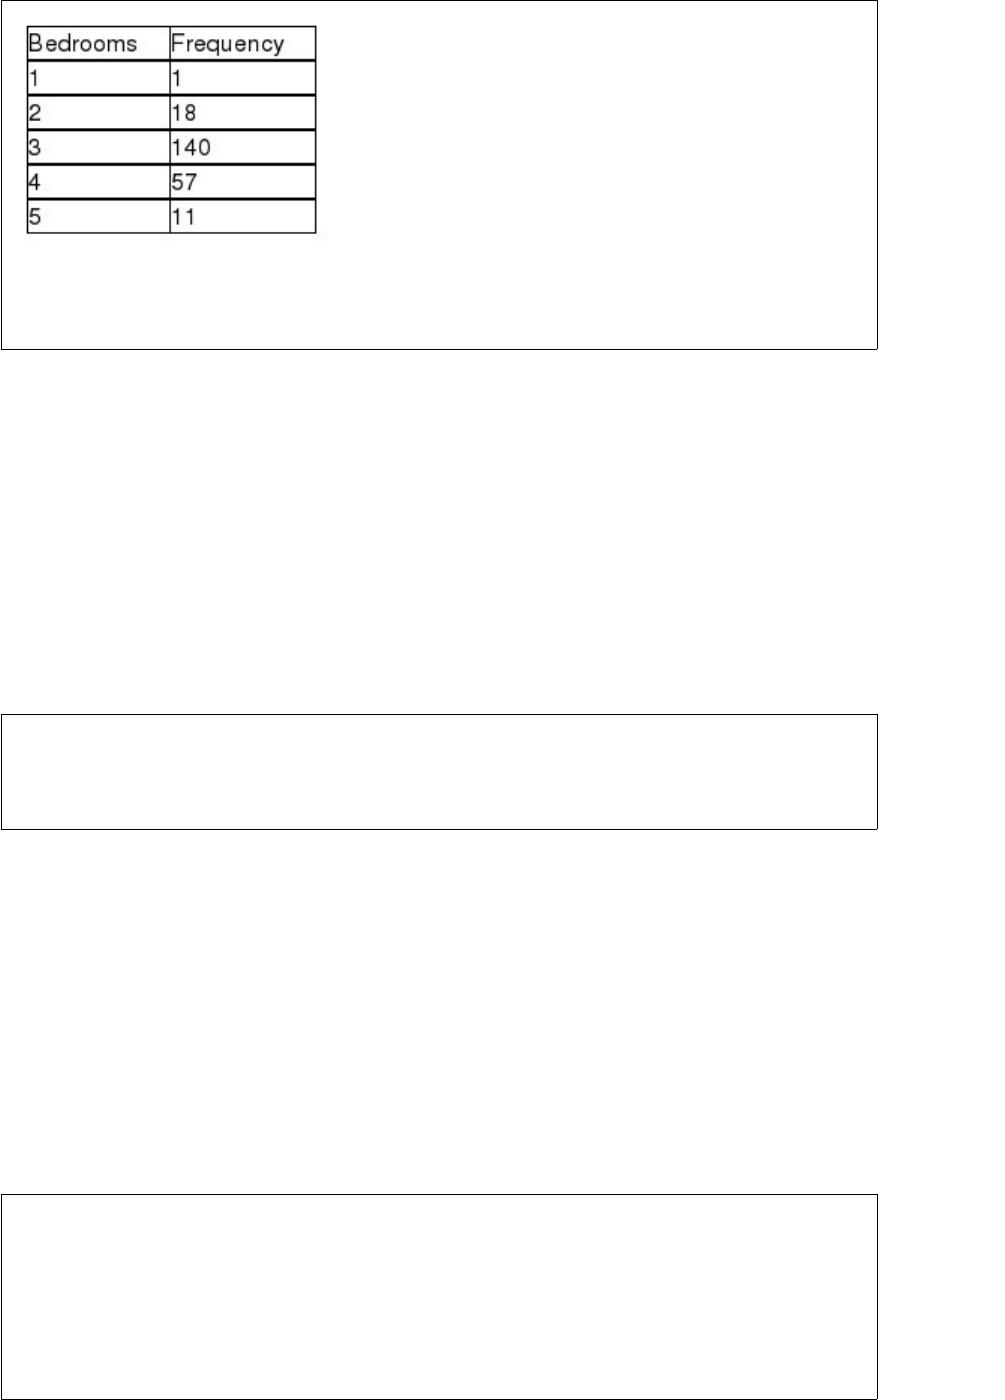
Based on this information, it is possible to determine that the distribution of bedrooms
in homes sold is right-skewed.
The Tukey-Kramer method for multiple comparison is used after the analysis of
variance F-test has lead us to reject the null hypothesis that all population means are
equal.
A study was recently performed by the Internal Revenue Service to determine how
much tip income waiters and waitresses should make based on the size of the bill at
each table. A random sample of bills and resulting tips were collected and the following
regression results were observed:
SUMMARY OUTPUT
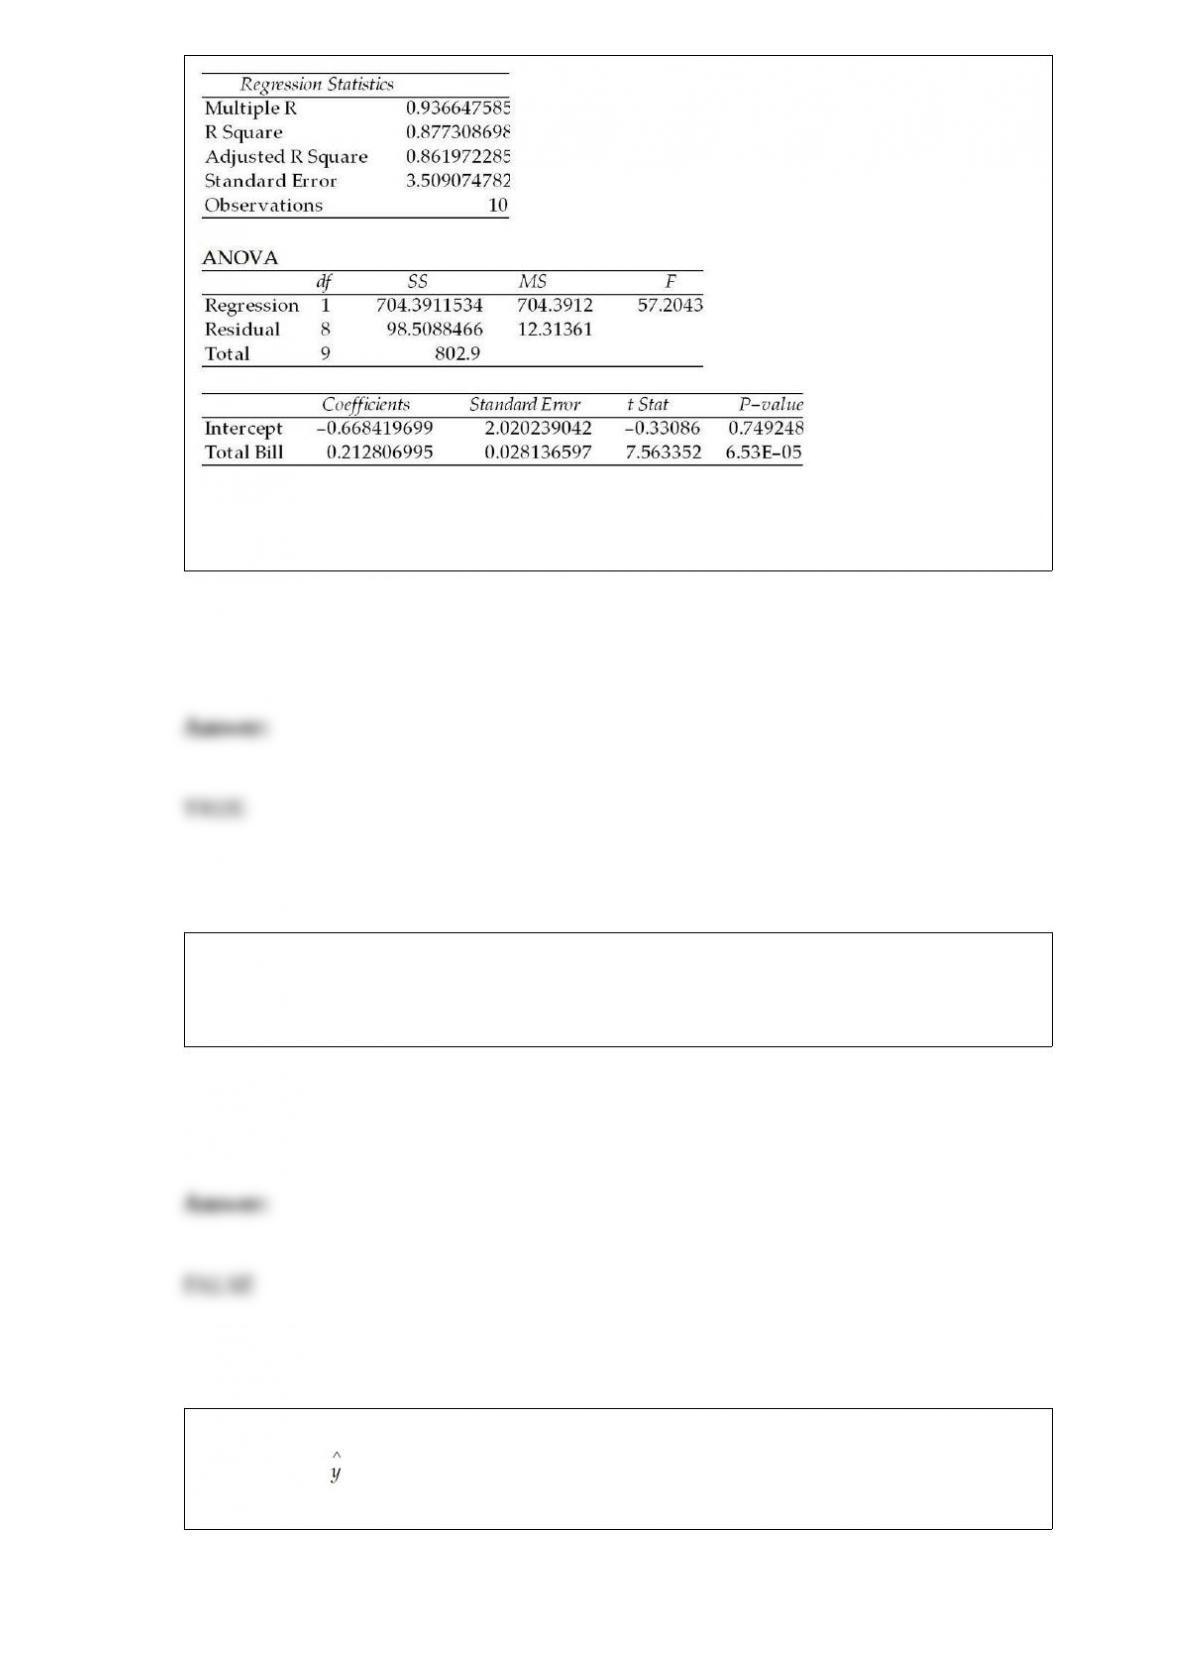
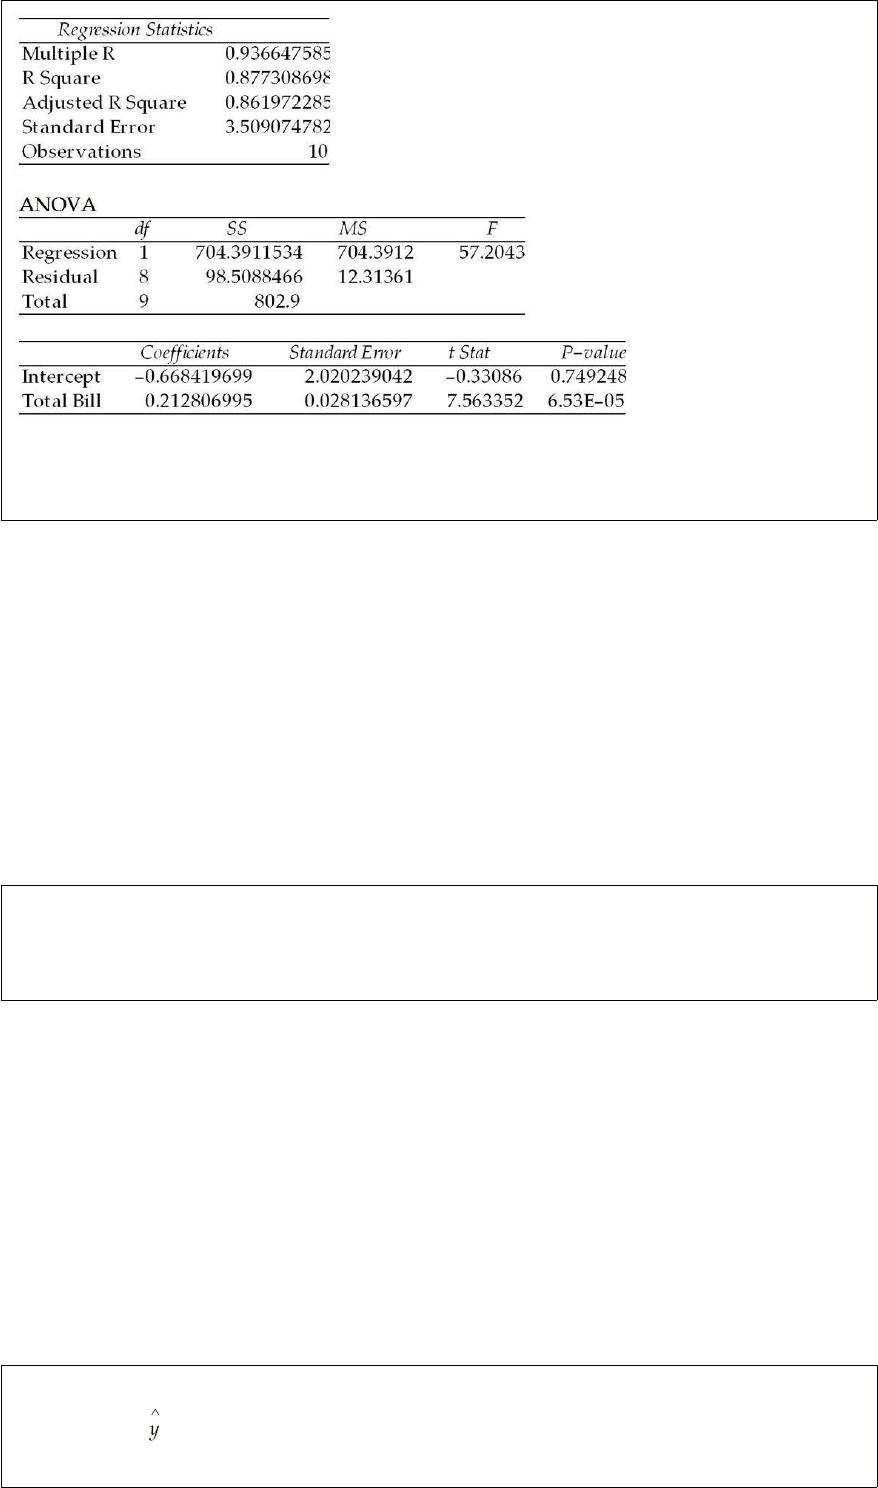
Given this output, the point estimate for the average tip per dollar amount of the bill is
approximately $0.21.
Recently, a marketing research company reported that based on a random sample of 300
households the mean number of trips to a major shopping mall per month per household
is 4.12 trips. This value is referred to as a parameter and is subject to sampling error.
The following regression model has been computed based on a sample of twenty
observations: = 34.2 + 19.3x. Given this model, the predicted value for y when x = 40
is 806.2.

Another name for a joint frequency distribution is a cross-tabulation table.
Consider the following regression model: = B0 + B1x1 + B1 + ε. If B2 > 0, then the
parabola will open downward and if B2< 0, then the parabola will open downward.
A study has recently been conducted by a major computer magazine publisher in which
the objective was to develop a multiple regression model to explain the variation in
price of personal computers. Three quantitative independent variables were used along
with one qualitative variable. The qualitative variable was coded 1 if the computer
included a monitor, 0 otherwise. The following computer printout shows the final
output.

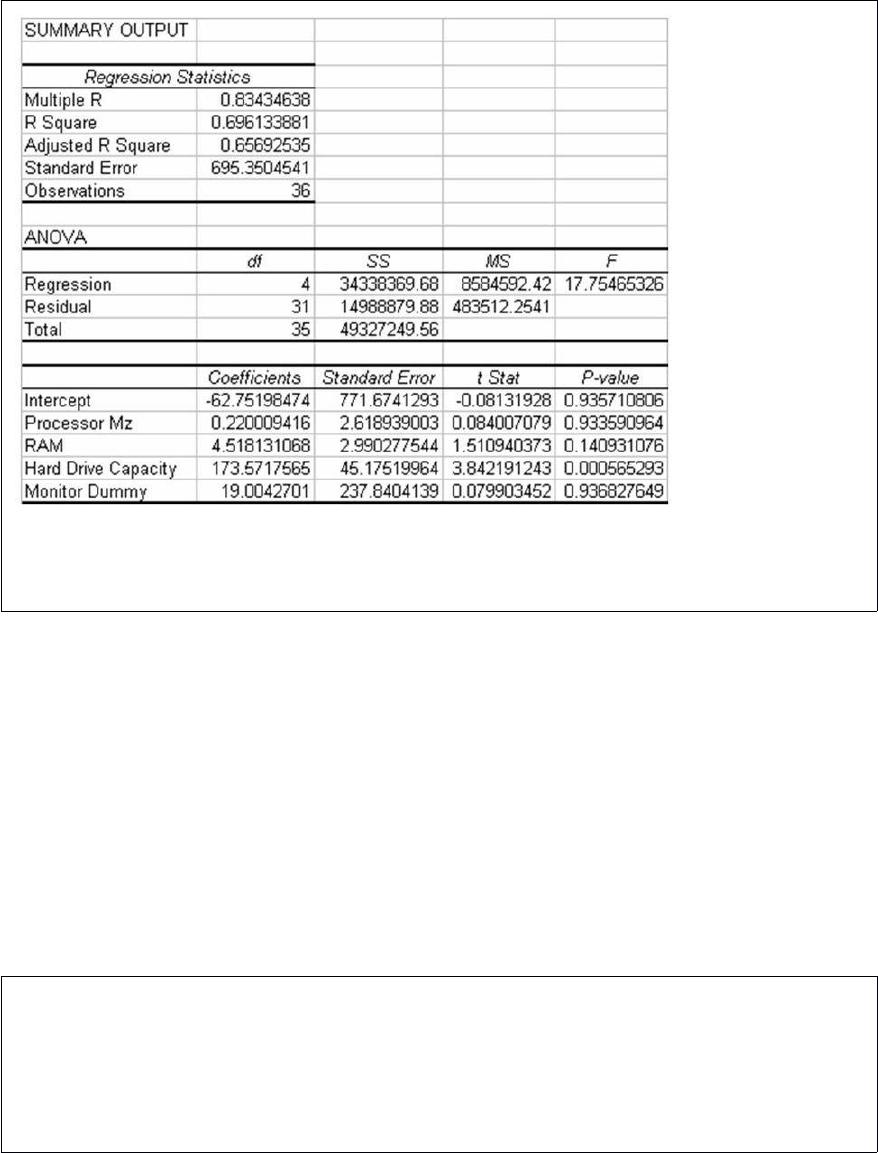
Based on this information, it is possible to determine that 4 of the PCs in the data set
did not have a monitor included.
The procurement manager for a large company wishes to estimate the proportion of
parts from a supplier that are defective. She has selected a random sample of n = 200
incoming parts and has found 11 to be defective. Based on a 95 percent confidence
level, the upper and lower limits for the confidence interval estimate are approximately
0.0234 to 0.0866.


When developing a confidence interval estimate, the confidence level is calculated
based on the size of the sample and the population standard deviation.
A study of cars arriving at a parking structure at the local airport shows that the time
between arrivals is 1.2 minutes and is exponentially distributed. Based on this
information, the mean number of cars arriving per minute is about 0.83.
A statistic is a value that describes a population characteristic while a parameter is
computed from a sample.
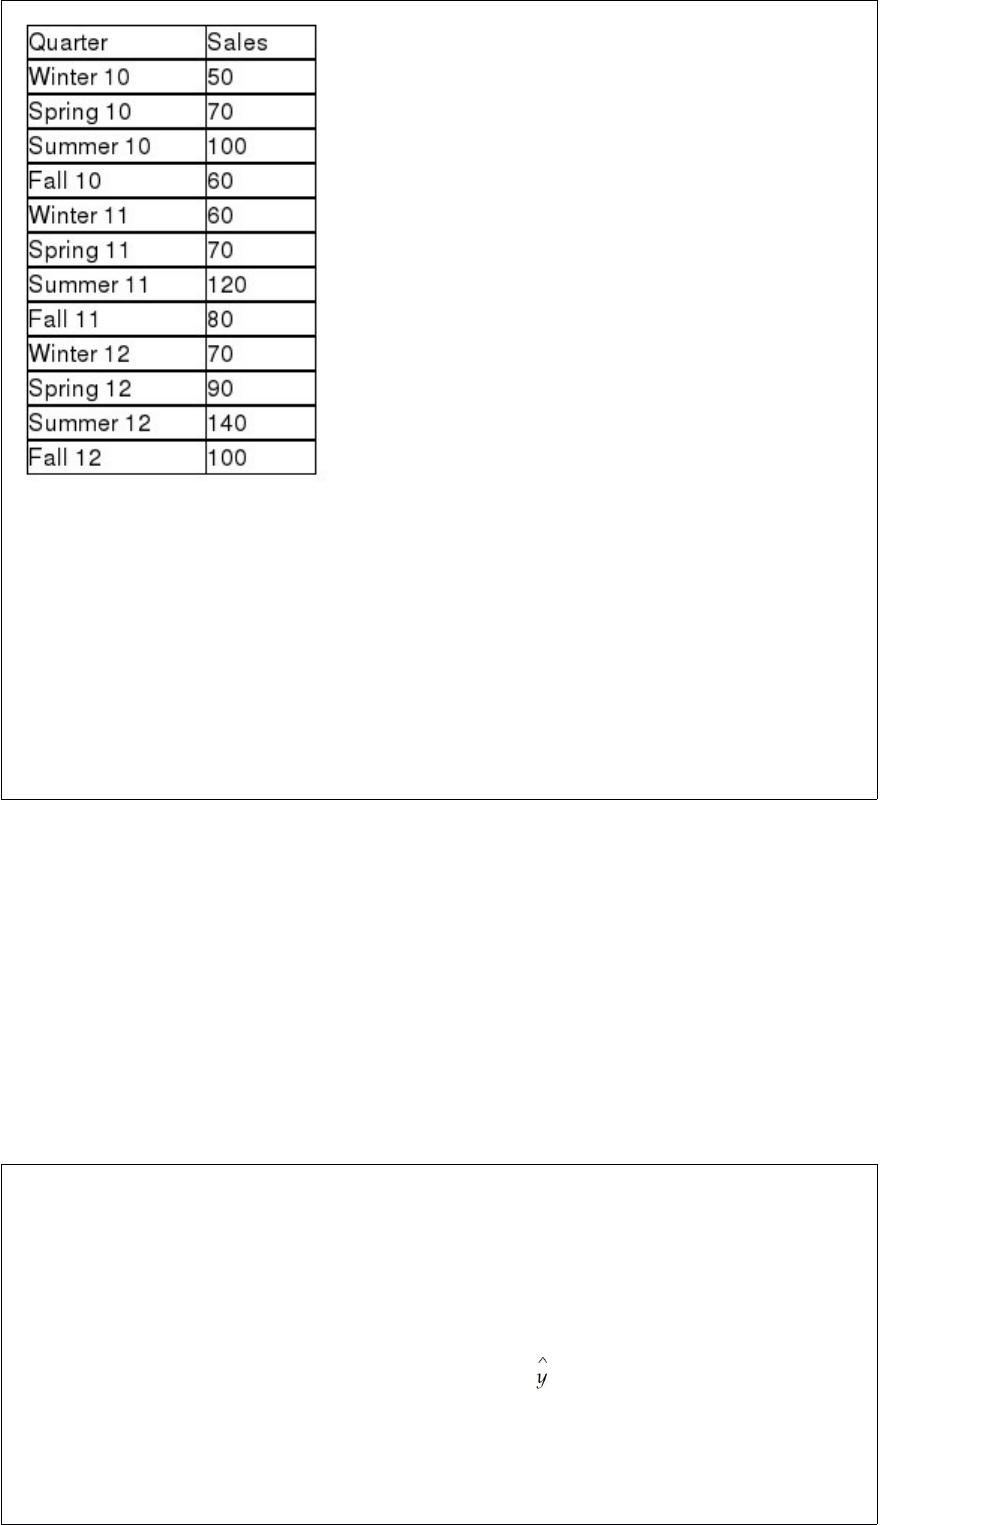
The Baker’s Candy Company has been in business for three years. The quarterly sales
data for the company are shown as follows:
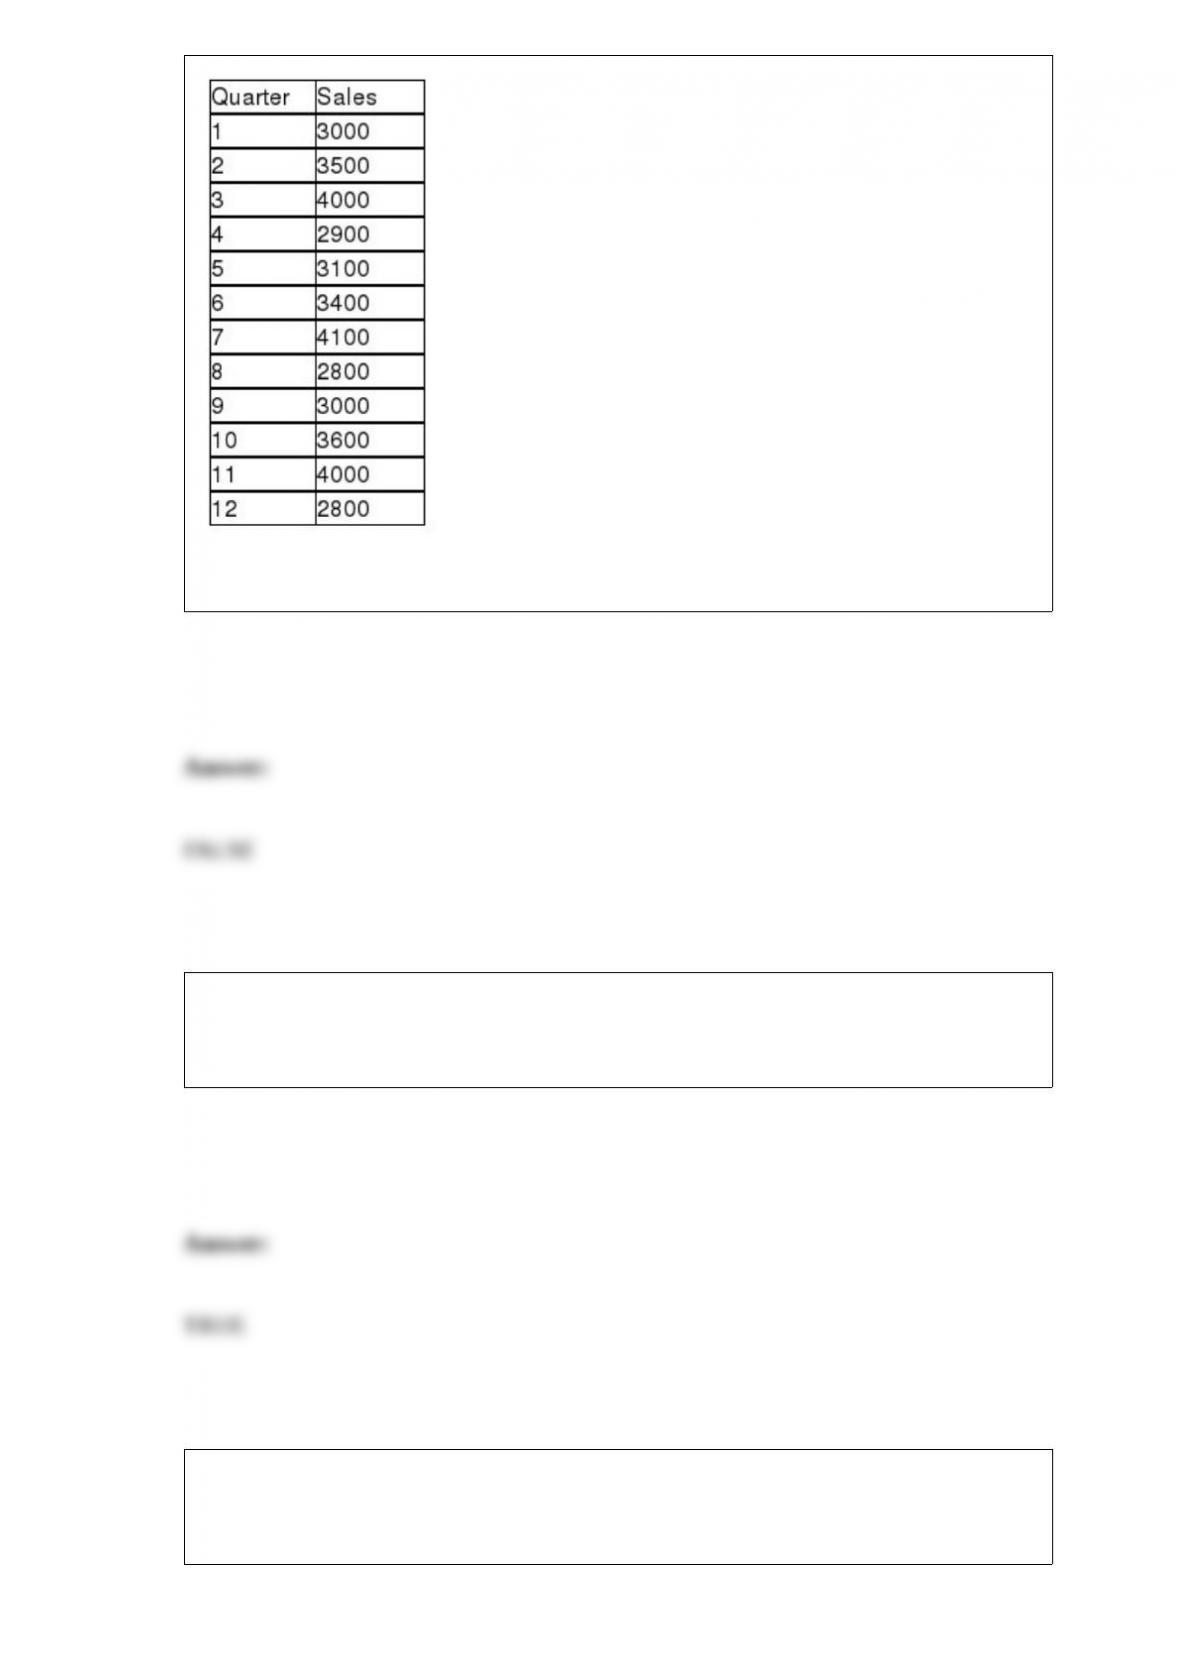
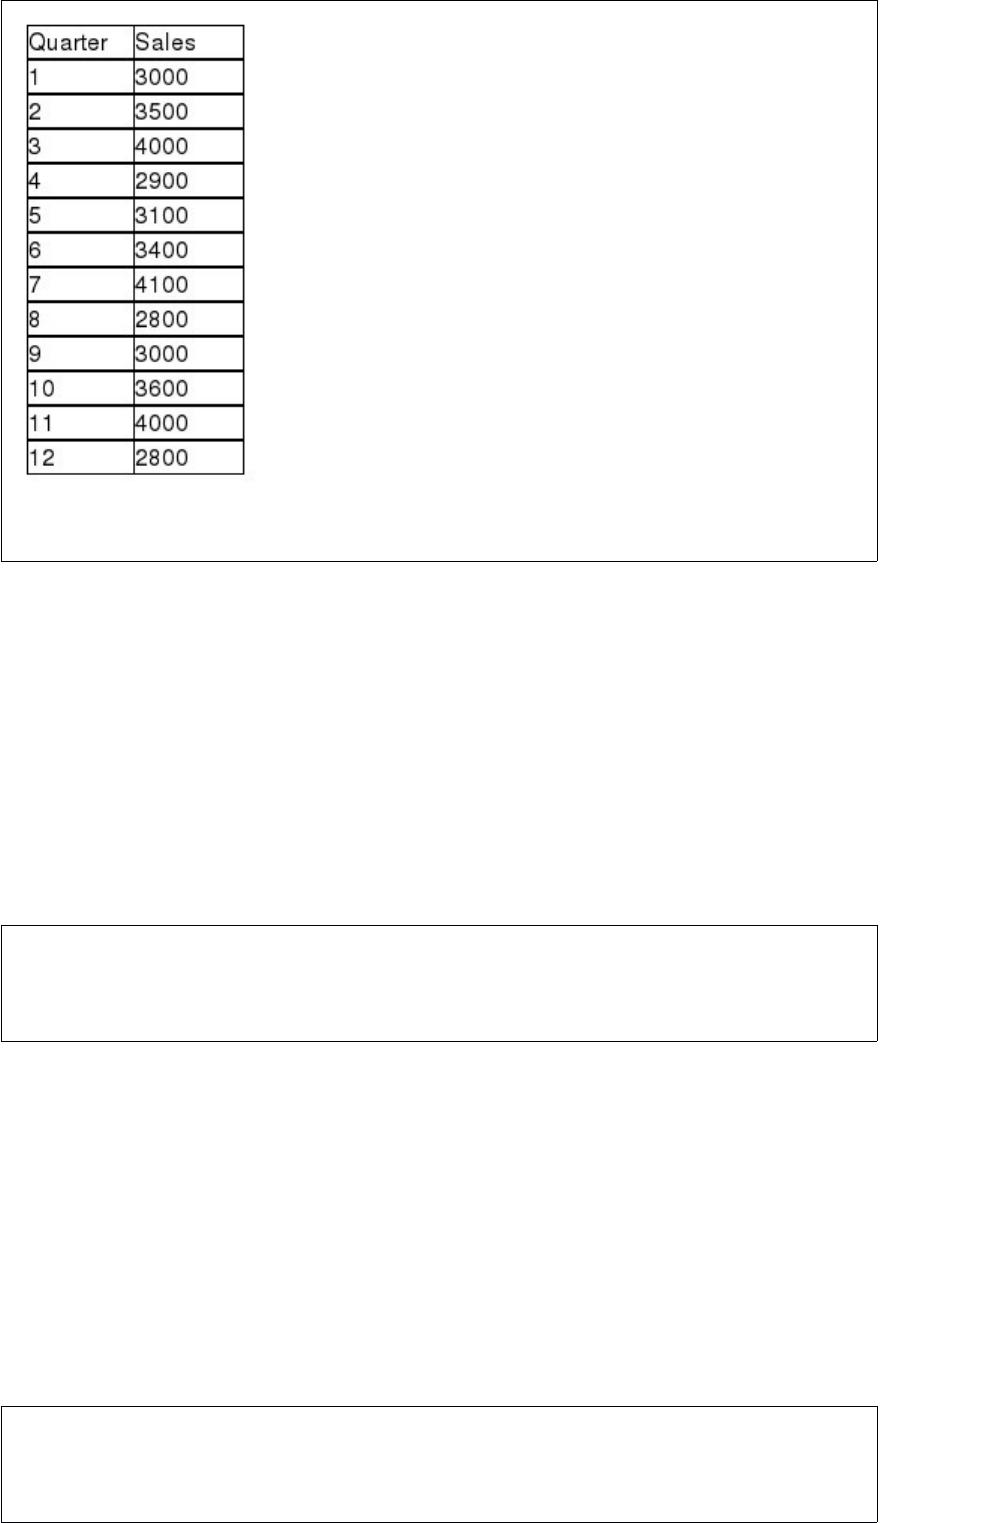
Based on this information, the data reflect both a linear trend and seasonal components.
When an independent variable, that has a positive correlation with the dependent
variable, receives a negative slope in a multiple regression, this is probably caused by
multicollinearity.
In a two-factor ANOVA design with replications, there are three hypotheses to be
tested; test for factor A, test for factor B, and test for interaction between factors A and
B.


In determining the required sample size in an application involving an estimate for the
population mean, if the population standard deviation is known, there is no compelling
reason to select a pilot sample.
If the null hypothesis that all population means are equal is rejected by the analysis of
variance F-test, the alternative hypothesis that all population means differ is concluded
to be true.
A common underpinning of all statistical sampling techniques is the concept of random
selection.


Descriptive statistical tools include graphs, charts, and numerical measures.
A company that makes and markets a device that is aimed at helping people quit
smoking claims that at least 70 percent of the people who have used the product have
quit smoking. To test this, a random sample of n = 100 product users was selected. Of
these, 65 people were found to have quit smoking. Given these results, the test statistic
value is z = -1.0911.
The probability distribution for a continuous random variable is represented by a
probability density function that defines a curve.


The t-distribution can be used to test hypotheses about the difference between two
population means given the following two assumptions:
– each population is normally distributed, and
– the two populations have equal variances.
If a population standard deviation is 100, then the sampling distribution for will have
a standard deviation that is less than 100 for all sample sizes greater than 2.
A major car magazine has recently collected data on 30 leading cars in the U.S. market.
It is interested in building a multiple regression model to explain the variation in
highway miles. The following correlation matrix has been computed from the data
collected:
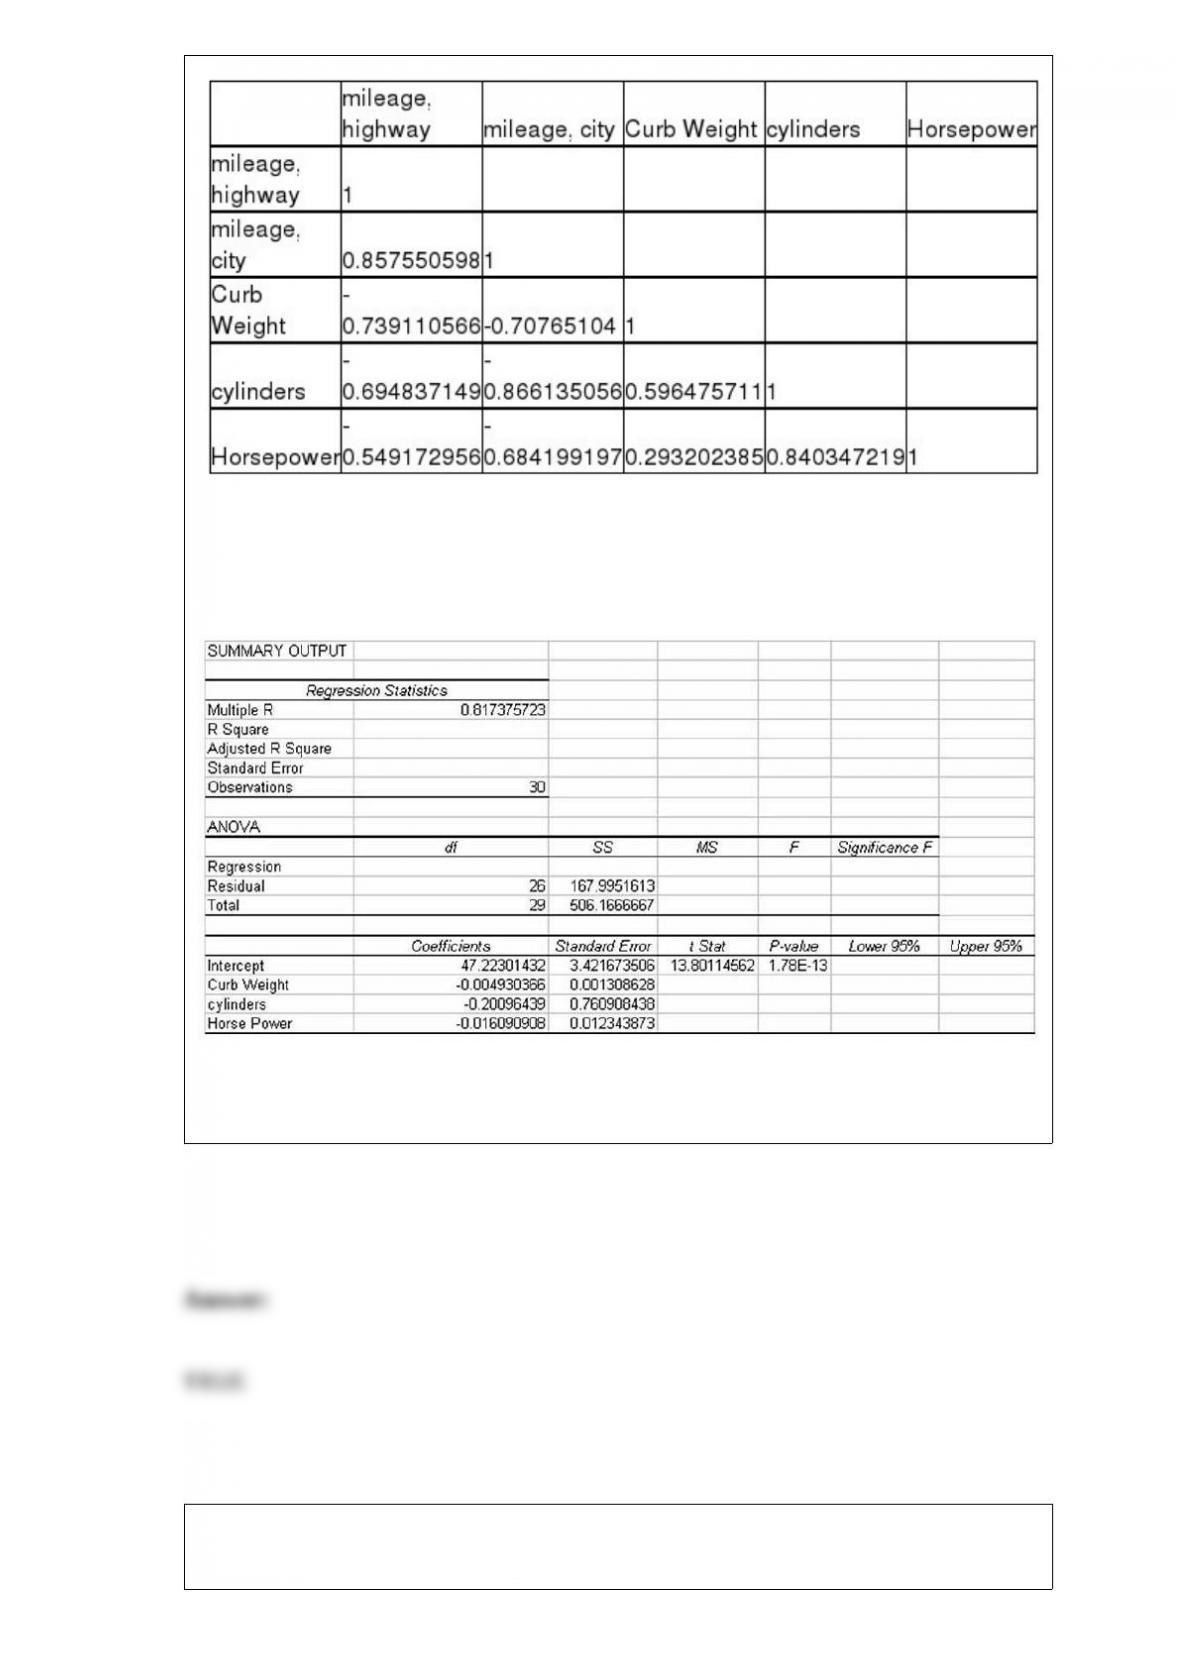
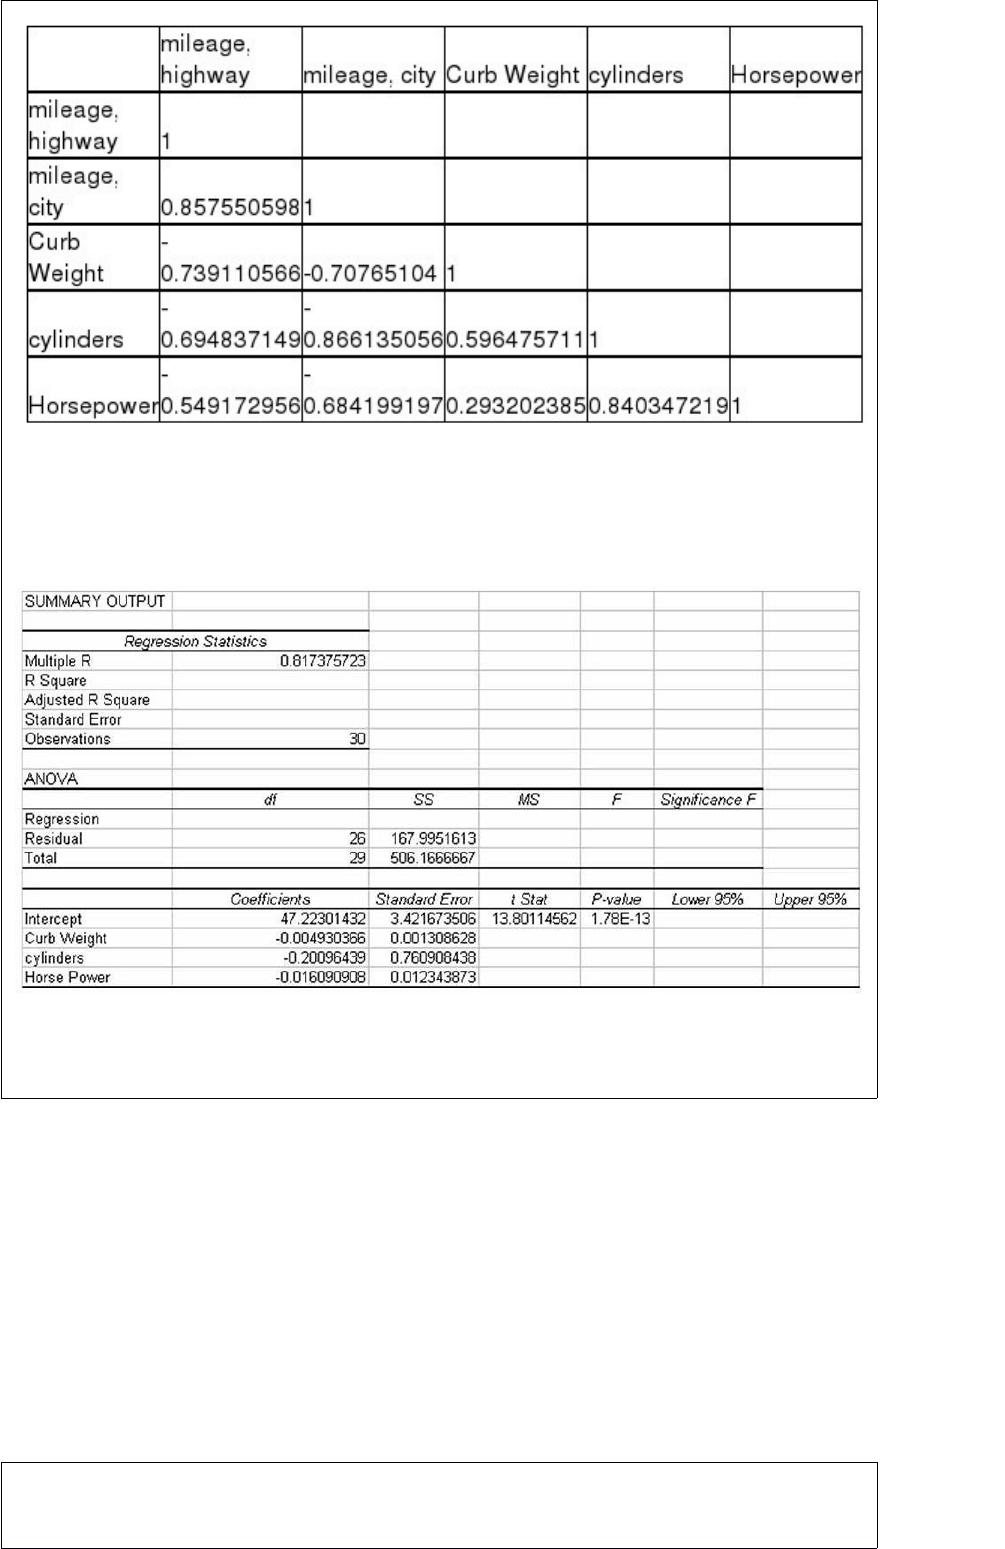
The analysts also produced the following multiple regression output using curb weight,
cylinders, and horsepower as the three independent variables. Note, a number of the
output fields are missing, but can be determined from the information provided.
Based on the above information, the test statistic for testing whether the overall model
is statistically significant is approximately F = 17.4
The director of the city Park and Recreation Department claims that the mean distance
people travel to the city’s greenbelt is more than 5.0 miles. Assuming that the


population standard deviation is known to be 1.2 miles and the significance level to be
used to test the hypothesis is 0.05 when a sample size of n = 64 people are surveyed, the
critical value is approximately 4.75 miles.
Data collected on the Internet can generally be considered accurate since the data must
go through a screening process before they can be placed on the Internet.
Sawyer & Company is a law firm in Dallas, Texas. Recently, the administrative
manager prepared a report for the managing partners that showed the number of court
cases handled by the firm monthly over the past three years. One of the objectives of
graphing these data might have been to identify a trend in the number of court cases.
A histogram is an effective tool for graphically describing a joint frequency distribution.
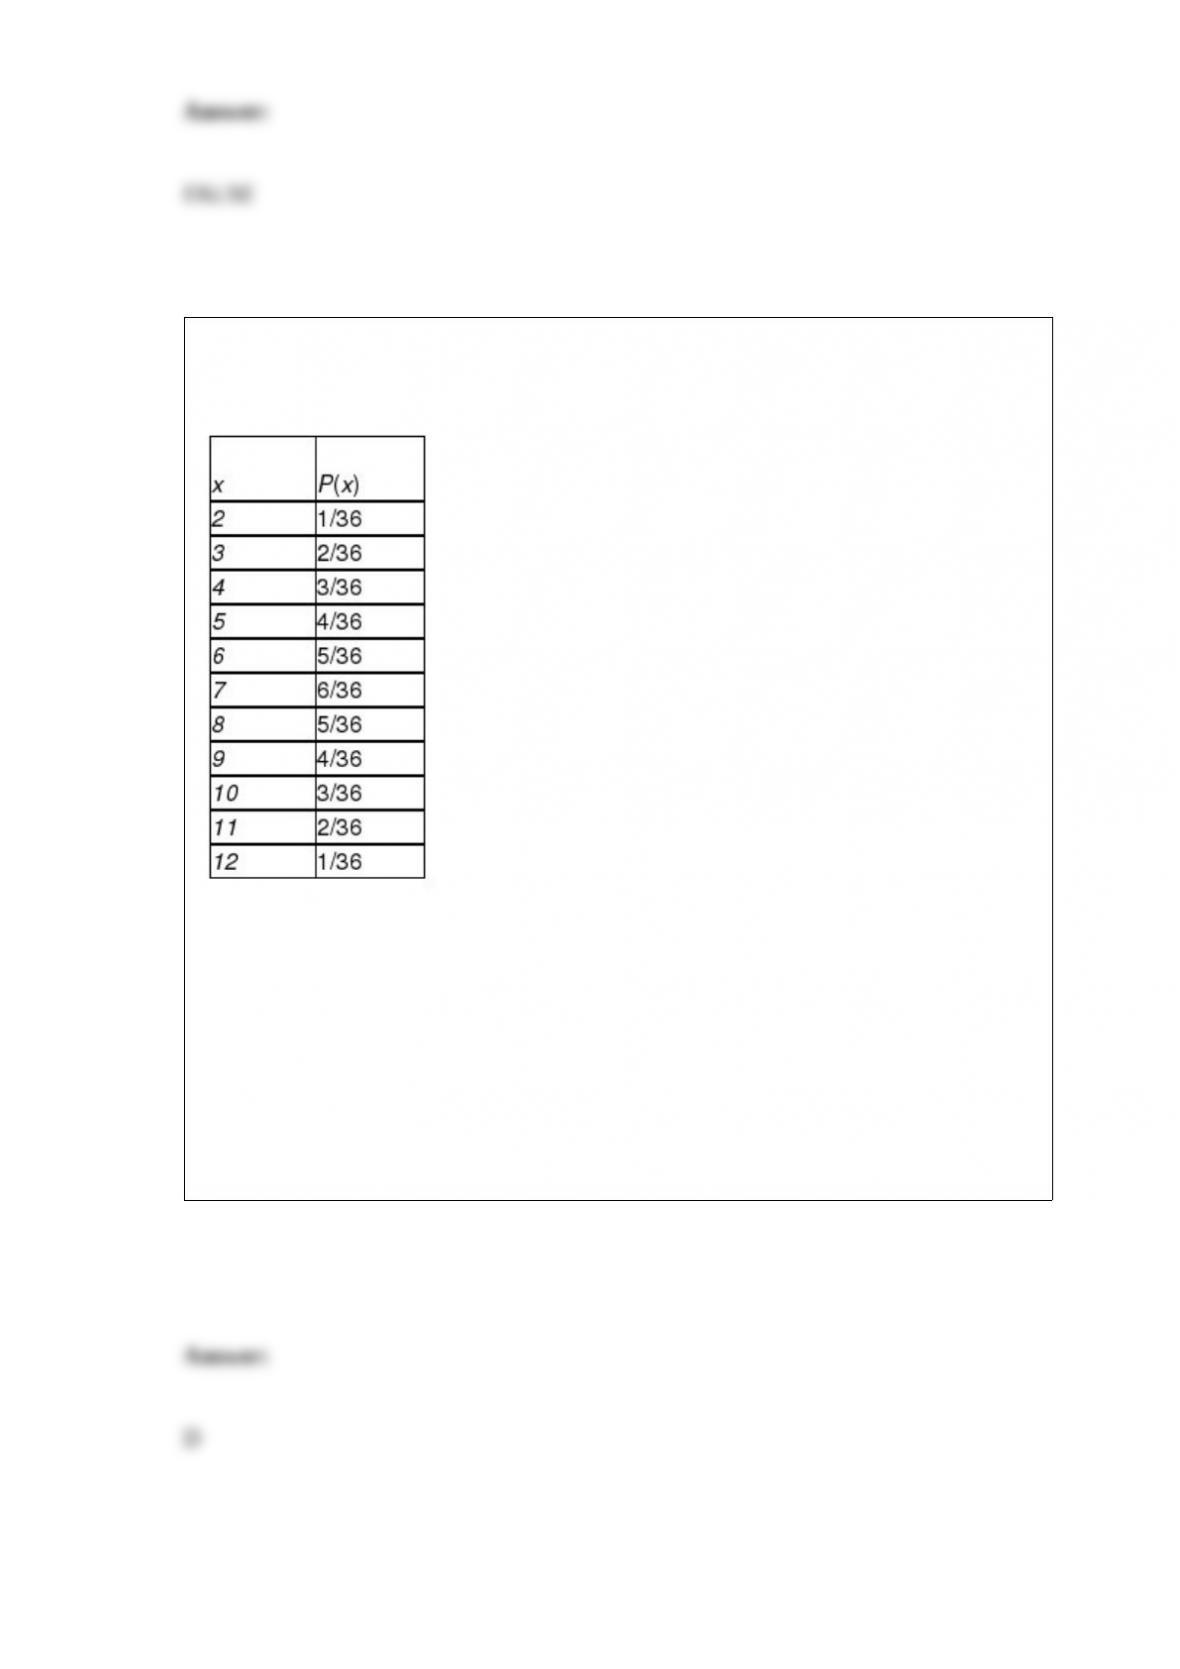
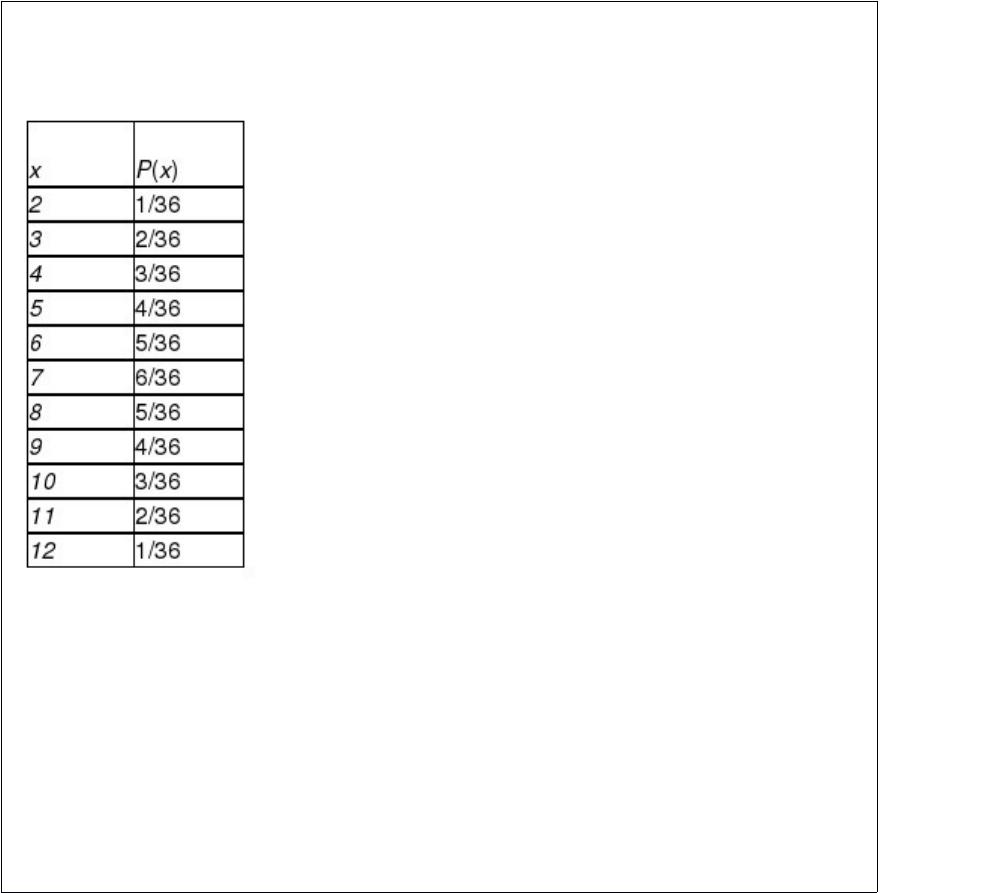
The roll of a pair of dice has the following probability distribution, where the random
variable is the sum of the values produced by each die:
Calculate the standard deviation of x.
A) 3.415
B) 2.333
C) 3.125
D) 2.415


A pet food producer manufactures and then fills 25-pound bags of dog food on two
different production lines located in separate cities. In an effort to determine whether
differences exist between the average fill rates for the two lines, a random sample of 19
bags from line 1 and a random sample of 23 bags from line 2 were recently selected.
Each bag’s weight was measured and the following summary measures from the
samples are reported:
Management believes that the fill rates of the two lines are normally distributed with
equal variances.
Develop a 95% confidence interval estimate of the true mean difference between the
two lines.
A) -0.1412 ≤ (1 – 2) ≤ -0.0912
B) -0.0974 ≤ (1 – 2) ≤ -0.0026
C) -0.0231 ≤ (1 – 2) ≤ -0.0069
D) -0.0812 ≤ (1 – 2) ≤ -0.0188
What does the term observed cell frequencies refer to?
A) The frequencies found in the population being examined
B) The frequencies found in the sample being examined
C) The frequencies computed from H0


D) The frequencies computed from H1
For a standardized normal distribution, calculate P(z < 1.5).
A) 0.9332
B) 0.0668
C) 0.333
D) 0.667
Many people believe that they can tell the difference between Coke and Pepsi. Other
people say that the two brands can’t be distinguished. To test this, a random sample of
20 adults was selected to participate in a test. After being blindfolded, each person was
given a small taste of either Coke or Pepsi and asked to indicate which brand soft drink
it was. If people really can’t tell the difference, the expected number of correct
identifications in the sample would be:
A) 10.
B) 0.
C) between 4 and 9.
D) Can’t be determined without more information.


According to USA Today, customers are not settling for automobiles straight off the
production lines. As an example, those who purchase a $355,000 Rolls-Royce typically
add $25,000 in accessories. One of the affordable automobiles to receive additions is
BMW’s Mini Cooper. A sample of 179 recent Mini purchasers yielded a sample mean of
$5,000 above the $20,200 base sticker price. Suppose the cost of accessories purchased
for all Mini Coopers has a standard deviation of $1,500.
Calculate a 95% confidence interval for the average cost of accessories on Mini
Coopers.
A) (4850.33, 5149.67)
B) (4878.82, 5121.18)
C) (4788.86, 5211.14)
D) (4780.25, 5219.75)
Suppose the life of a particular brand of calculator battery is approximately normally
distributed with a mean of 75 hours and a standard deviation of 10 hours. What is the
probability that 16 randomly sampled batteries from the population will have a sample
mean life of between 70 and 80 hours?
A) 0.9444
B) 0.5121
C) 0.7124

D) 0.1512
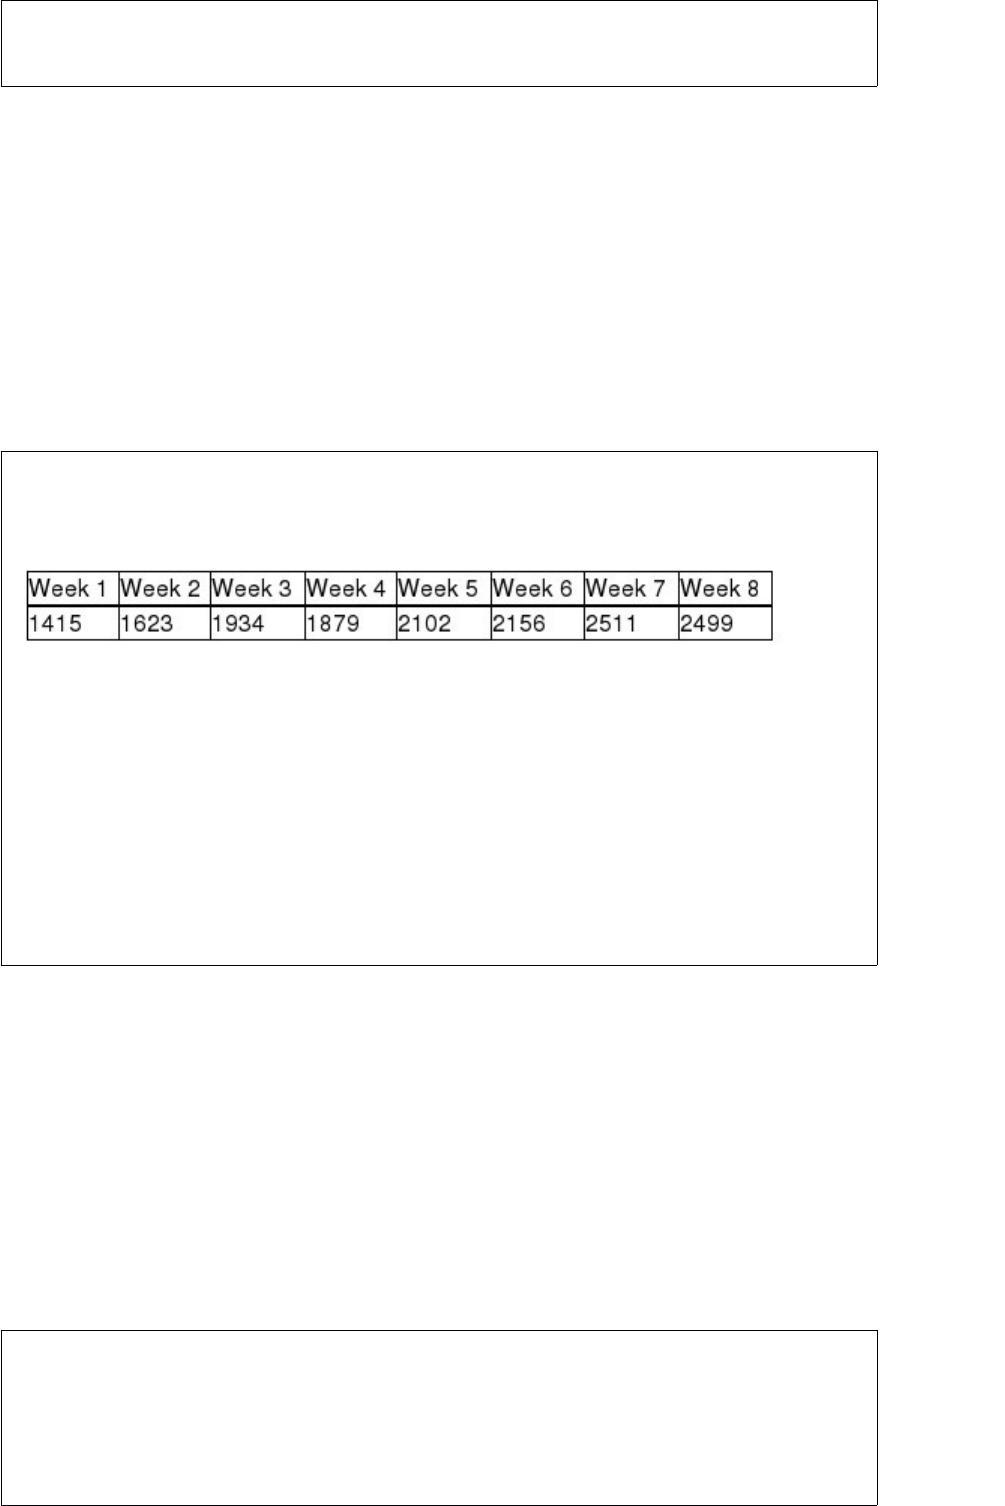
The Fitness Center manager has collected data on the number of visits to the club each
week for the past 8 weeks. These data are shown as follows. Which of the following
statements is most correct?
A) A histogram will illustrate whether a linear relationship exists between the number
of visits and the week number.
B) A scatter diagram would be useful for displaying these data.
C) A line chart for these data will show that an upward trend in the number of visits to
the club has occurred over two weeks.
D) None of the above
Princess Cruises recently offered a 16-day voyage from Beijing to Bangkok during the
time period from May to August. The announced price, excluding airfare, for a room
with an ocean view or a balcony was listed as $3,475. Cruise fares usually are quite
variable due to discounting by the cruise line and travel agents. A sample of 20
passengers who purchased this cruise paid the following amounts (in dollars):

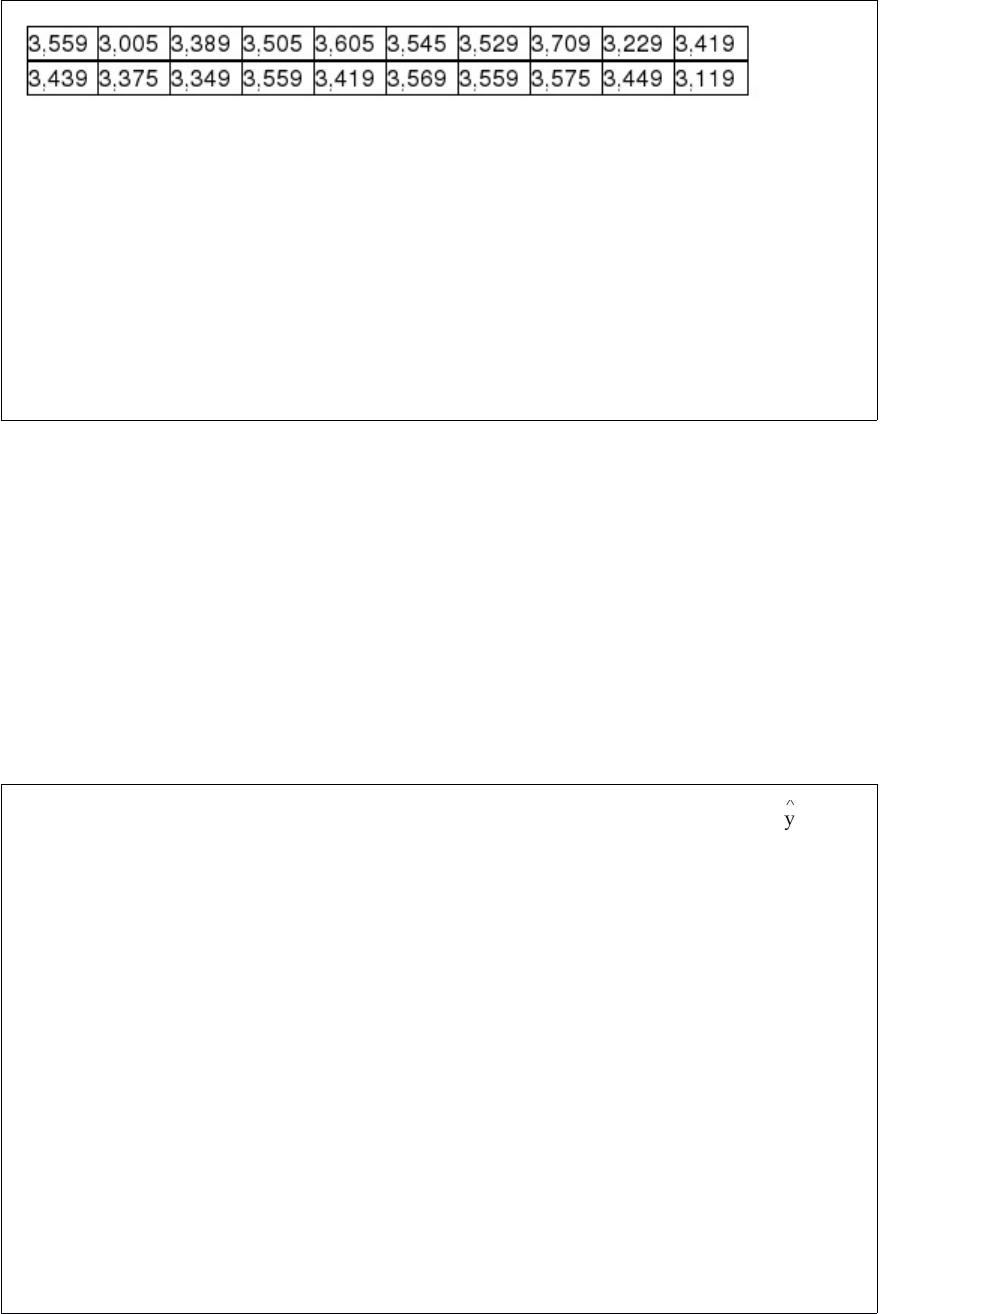
Calculate the sample mean cruise fare.
A) 3715.24
B) 3445.30
C) 4581.81
D) 6314.24
A regression equation that predicts the price of homes in thousands of dollars is t =
24.6 + 0.055x1 – 3.6x2, where x2 is a dummy variable that represents whether the house
in on a busy street or not. Here x2 = 1 means the house is on a busy street and x2 = 0
means it is not. Based on this information, which of the following statements is true?
A) On average, homes that are on busy streets are worth $3600 less than homes that are
not on busy streets.
B) On average, homes that are on busy streets are worth $3.6 less than homes that are
not on busy streets.
C) On average, homes that are on busy streets are worth $3600 more than homes that
are not on busy streets.
D) On average, homes that are on busy streets are worth $3.6 more than homes that are
not on busy streets.


The State Transportation Department is thinking of changing its speed limit signs. It is
considering two new options in addition to the existing sign design. At question is
whether the three sign designs will produce the same mean speed. To test this, the
department has conducted a limited test in which a stretch of roadway was selected.
With the original signs up, a random sample of 30 cars was selected and the speeds
were measured. Then, on different days, the two new designs were installed, 30 cars
each day were sampled, and their speeds were recorded. Suppose that the following
summary statistics were computed based on the data:
Based on these sample results and significance level equal to 0.05, the sum of squares
between is:
A) approximately 3,586.
B) approximately 2,430.
C) approximately 1,215.
D) None of the above
The makers of Mini-Oats Cereal have an automated packaging machine that can be set
at any targeted fill level between 12 and 32 ounces. Every box of cereal is not expected
to contain exactly the targeted weight, but the average of all boxes filled should. At the
end of every shift (eight hours), 16 boxes are selected at random and the mean and
standard deviation of the sample are computed. Based on these sample results, the
production control manager determines whether the filling machine needs to be
readjusted or whether it remains all right to operate. Use α= 0.05. At the end of a
particular shift during which the machine was filling 24-ounce boxes of Mini-Oats, the
sample mean of 16 boxes was 24.32 ounces, with a standard deviation of 0.70 ounce.
Assist the production control manager in determining if the machine is achieving its
targeted average using test statistic and critical value t.
A) Since -1.2445 < 1.013 < 1.2445, do not reject H0 and conclude that the filling
machine remains all right to operate.


B) Since -1.2445 < 1.013 < 1.2445, reject H0 and conclude that the filling machine
needs to be moderated.
C) Since -2.1315 < 1.83 < 2.1315, do not reject H0 and conclude that the filling
machine remains all right to operate.
D) Since -2.1315 < 1.83 < 2.1315, reject H0 and conclude that the filling machine needs
to be moderated.
John Thurgood founded a company that translates Chinese books into English. His
company is currently testing a computer-based translation service. Since Chinese
symbols are difficult to translate, John assumes the computer program will make some
errors, but then so do human translators. The computer error rate is supposed to be an
average of 3 per 400 words of translation. Suppose John randomly selects a 1,200-word
passage. Assuming that the Poisson distribution applies, if the computer error rate is
actually 3 errors per 400 words, calculate the probability that more than 14 errors will
be found.
A) 0.000123
B) 0.0141
C) 0.0415
D) 0.4557

Given a population in which the probability of success is p = 0.20, if a sample of 500
items is taken, then calculate the probability the proportion of successes in the sample
will be between 0.18 and 0.23 if the sample size is 200.
A) 0.8911
B) 0.7121
C) 0.8712
D) 0.6165
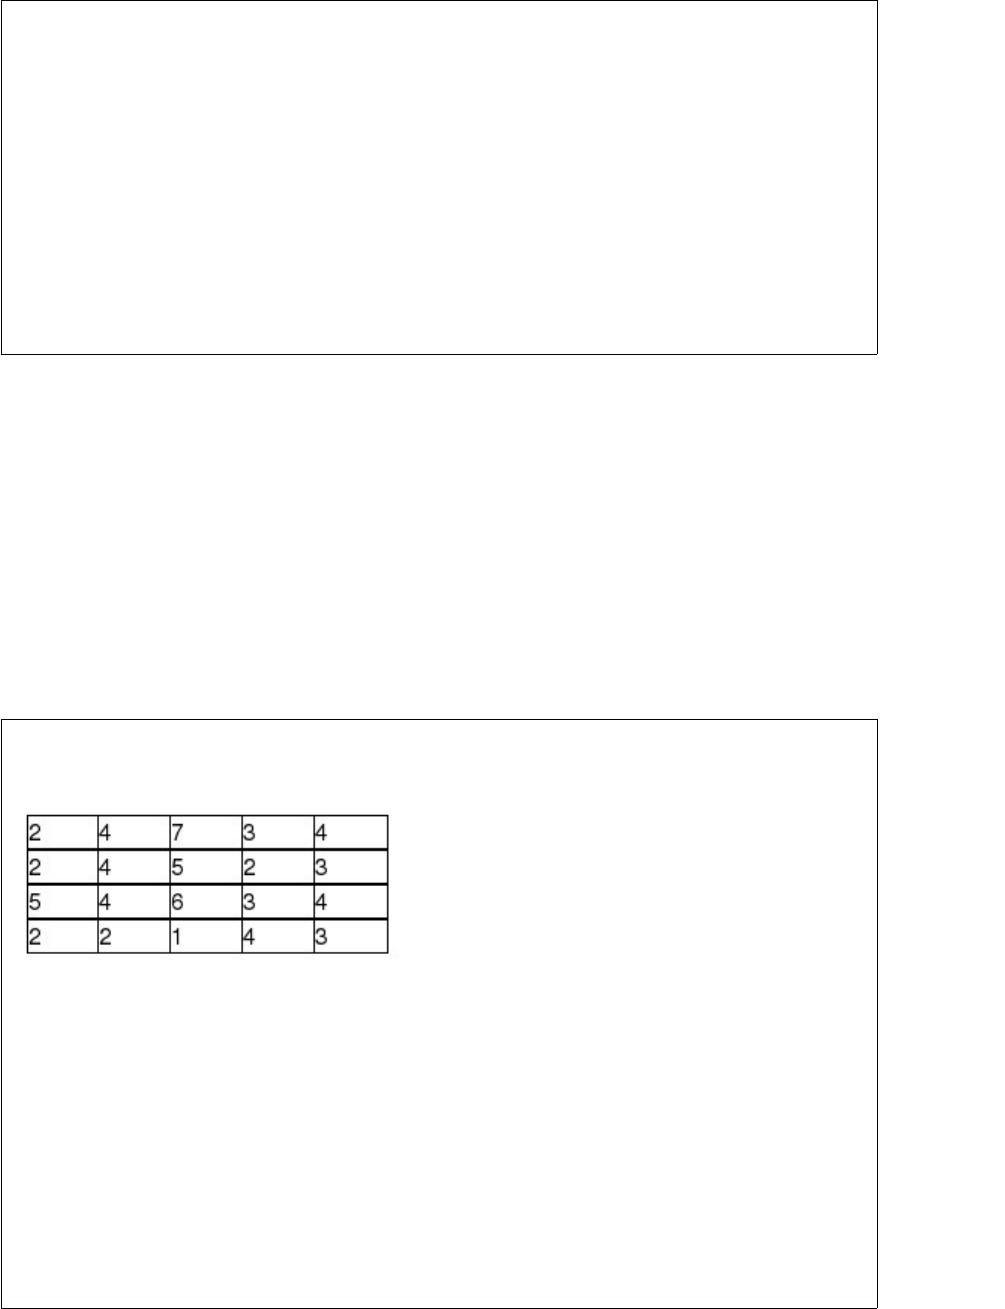
A particular subdivision has 20 homes. The number of people living in each of these
homes is listed as follows:
If a random sample of n = 3 homes were selected, what would be the highest possible
positive sampling error?
A) 6.0
B) 3.0
C) 0.5
D) 2.5

In conjunction with the housing foreclosure crisis of 2009, many economists expressed
increasing concern about the level of credit card debt and efforts of banks to raise
interest rates on these cards. The banks claimed the increases were justified. A Senate
subcommittee decided to determine if the average credit card balance depends on the
type of credit card used. Under consideration are Visa, MasterCard, Discover, and
American Express. The sample sizes to be used for each level are 25, 25, 26, and 23,
respectively.
State the number of degrees of freedom available for determining the between-samples
variation.
A) 6
B) 5
C) 2
D) 3
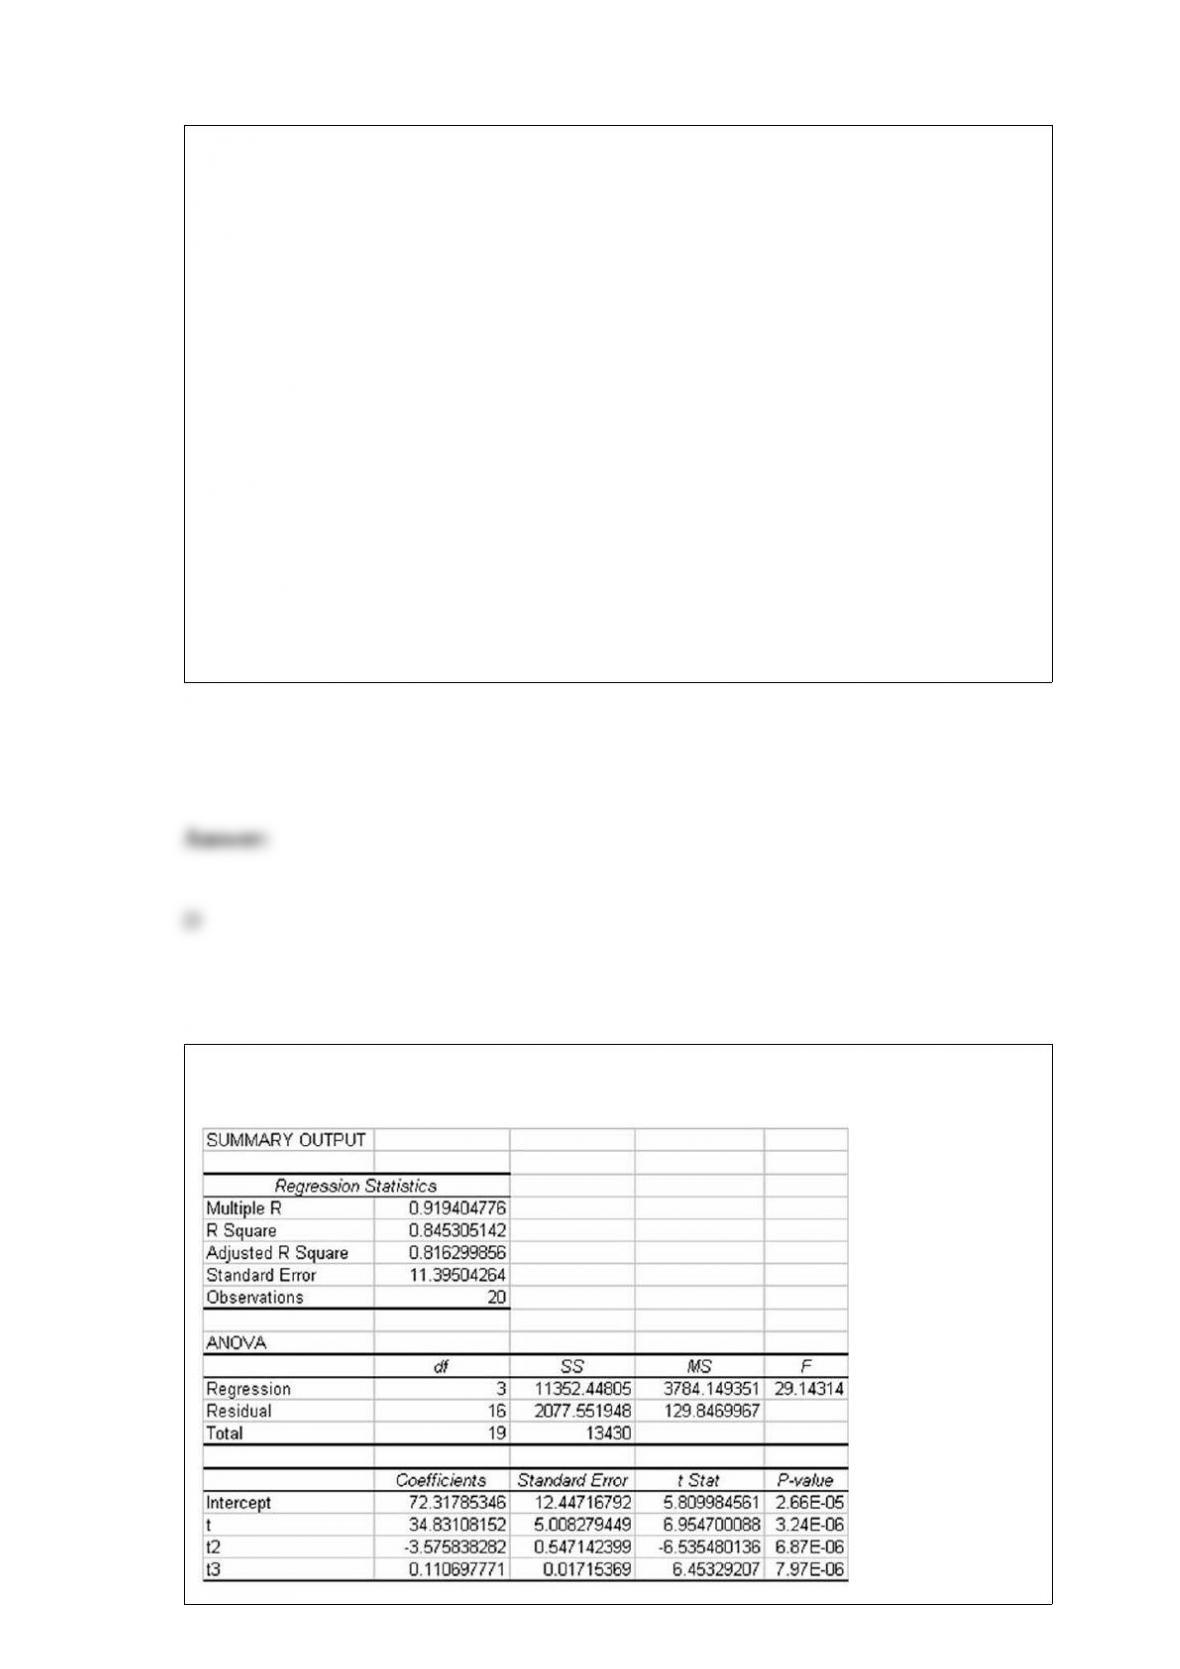
The following regression output is from a multiple regression model:


The variables t, t2, and t3 represent the t, t-squared, and t-cubed respectively where t is
the indicator of time from periods t = 1 to t = 20. Which of the following best describes
the type of forecasting model that has been developed?
A) A complete third-order polynomial model
B) A tri-variate smoothed regression model
C) A nonlinear trend model
D) A qualitative regression model
The General Electric service department believes that the median time for a service call
should be 30 or fewer minutes. To test this, the following random sample of service
times was collected:
Given that the managers do not wish to make the assumption that the population is
normally distributed, the appropriate statistical test for testing about service times is:
A) the t-test.
B) the Kruskal-Wallis test.
C) the Wilcoxon signed rank sum test.
D) the F-test.


According to data from the Environmental Protection Agency, the average daily water
consumption for a household of four people in the United States is approximately at
least 243 gallons. (Source:
http://www.catskillcenter.org/programs/csp/H20/Lesson3/house3.htm) Suppose a state
agency plans to test this claim using an alpha level equal to 0.05 and a random sample
of 100 households with four people.
Calculate the probability of committing a Type II error if the true population mean is
230 gallons. Assume that the population standard deviation is known to be 40 gallons.
A) 0.0331
B) 0.0712
C) 0.0537
D) 0.1412
In comparing two or more forecasting models, the MAD value is useful in determining
how successful the models were in fitting historical data.
A random variable, x, has a normal distribution with μ = 13.6 and σ = 2.90. Determine a
value, x0, so that P(x > x0) = 0.05.
A) 14.46
B) 15.33
C) 18.37
D) 12.45
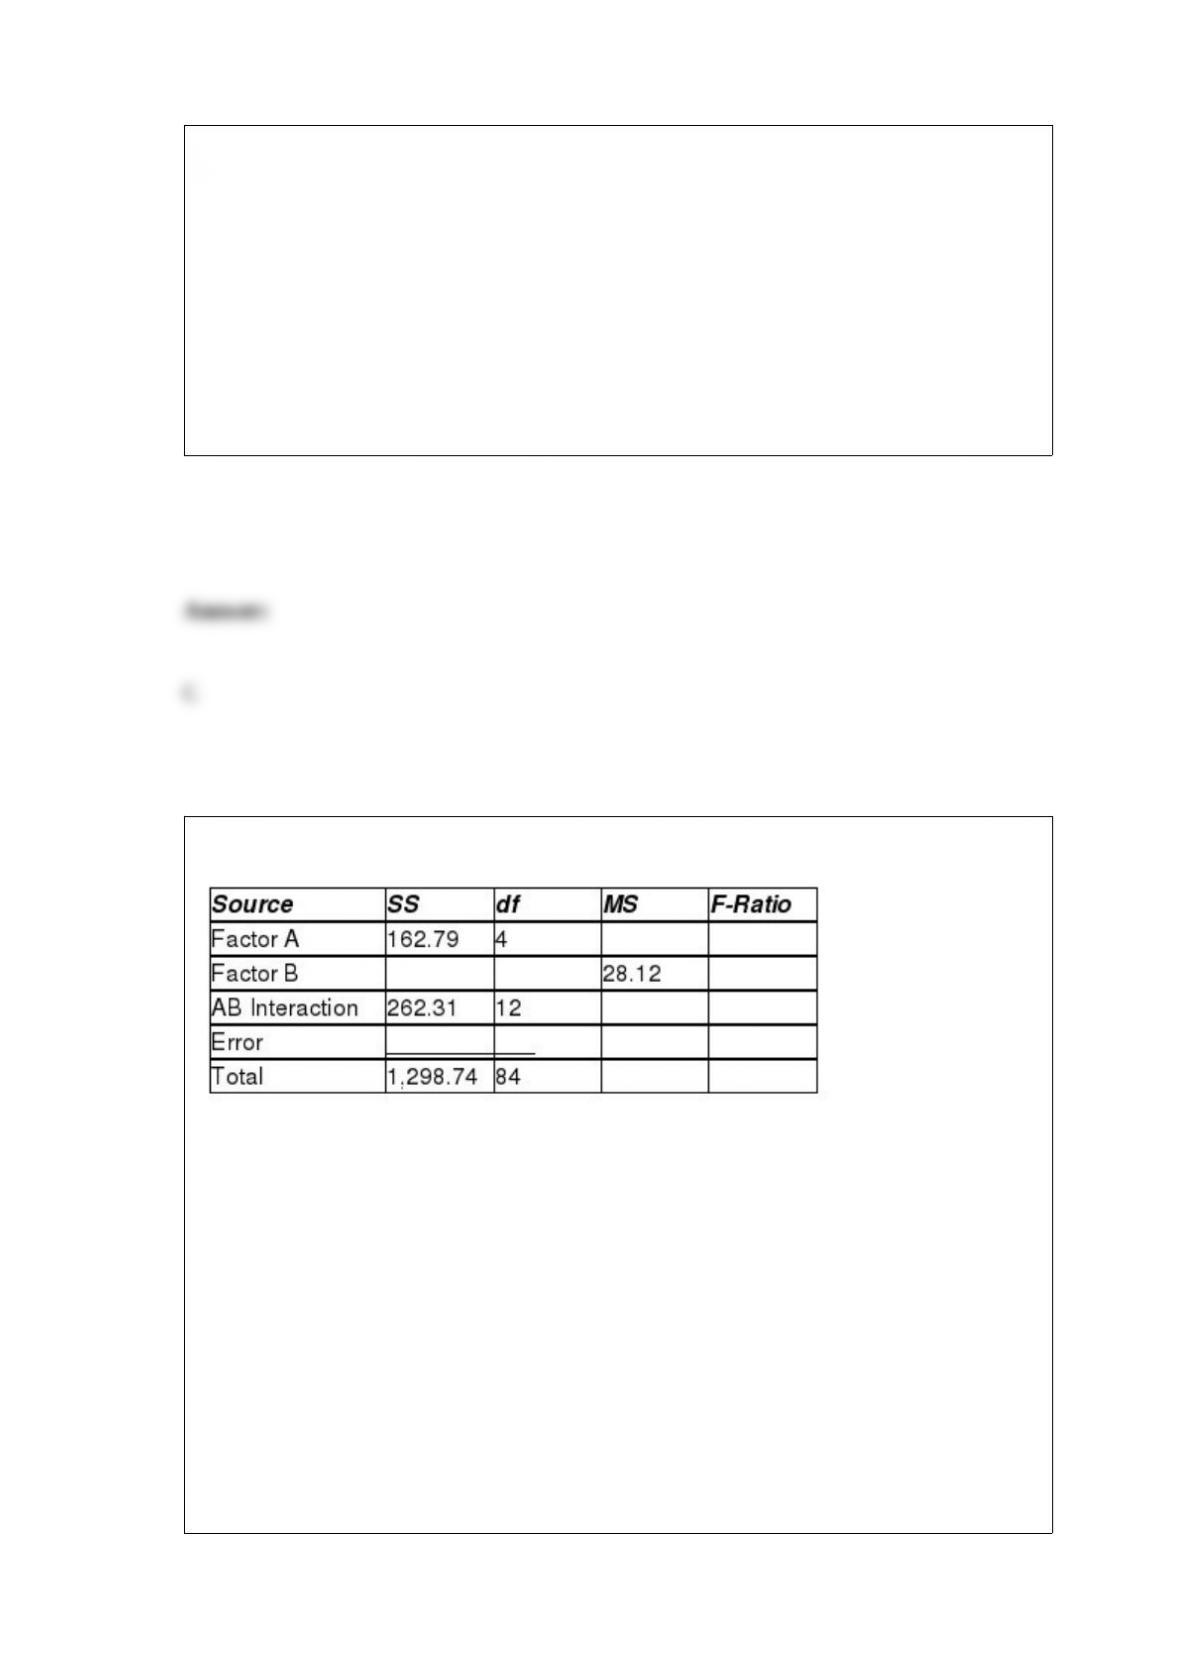
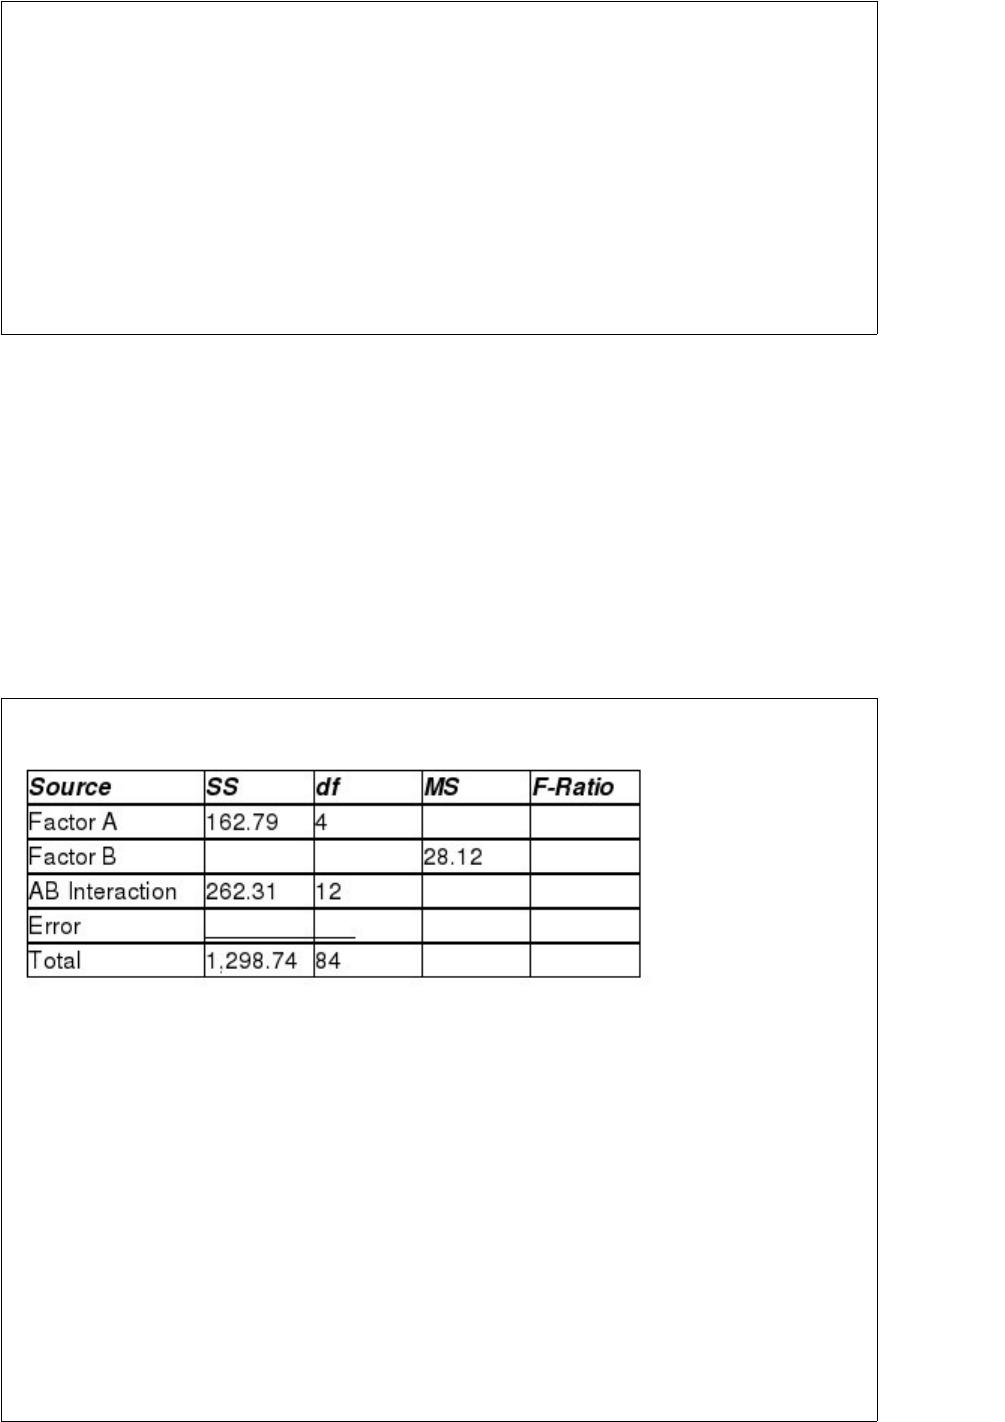
Examine the following two-factor analysis of variance table:
Complete the analysis of variance table.
A) MSA = 40.928, F Factor A =3.35, SSB = 85.35, Factor B df = 3, F Factor B = 2.316,
MSAB = 21.859, F Factor AB = 1.8, SSE = 789.29, SSE df = 66, MSE = 12.143
B) MSA = 40.928, F Factor A = 3.35, SSB = 85.35, Factor B df = 4, F Factor B = 2.316,
MSAB = 21.859, F Factor AB = 2.1 SSE = 789.29, SSE df = 66, MSE = 12.143
C) MSA = 40.698, F Factor A = 3.35, SSB = 84.35, Factor B df = 5, F Factor B = 2.316,
MSAB = 21.859, F Factor AB = 2.1, SSE = 789.29, SSE df = 65, MSE = 12.143
D) MSA = 40.698, F Factor A = 3.35, SSB = 84.35, Factor B df = 3, F Factor B =
2.316, MSAB = 21.859, F Factor AB = 1.8, SSE = 789.29, SSE df = 65, MSE = 12.143


If an economist wishes to determine whether there is evidence that average family
income in a community exceeds $25,000. The best null hypothesis is:
A) μ = 25,000.
B) μ > 25,000.
C) μ ≤ 25,000.
D) μ ≥ 25,000.
The Olsen Agricultural Company has determined that the weight of hay bales is
normally distributed with a mean equal to 80 pounds and a standard deviation equal to 8
pounds. Based on this, what is the mean of the sampling distribution for if the sample
size is n = 64?
A) 80
B) 10
C) Between 72 and 88
D) 8
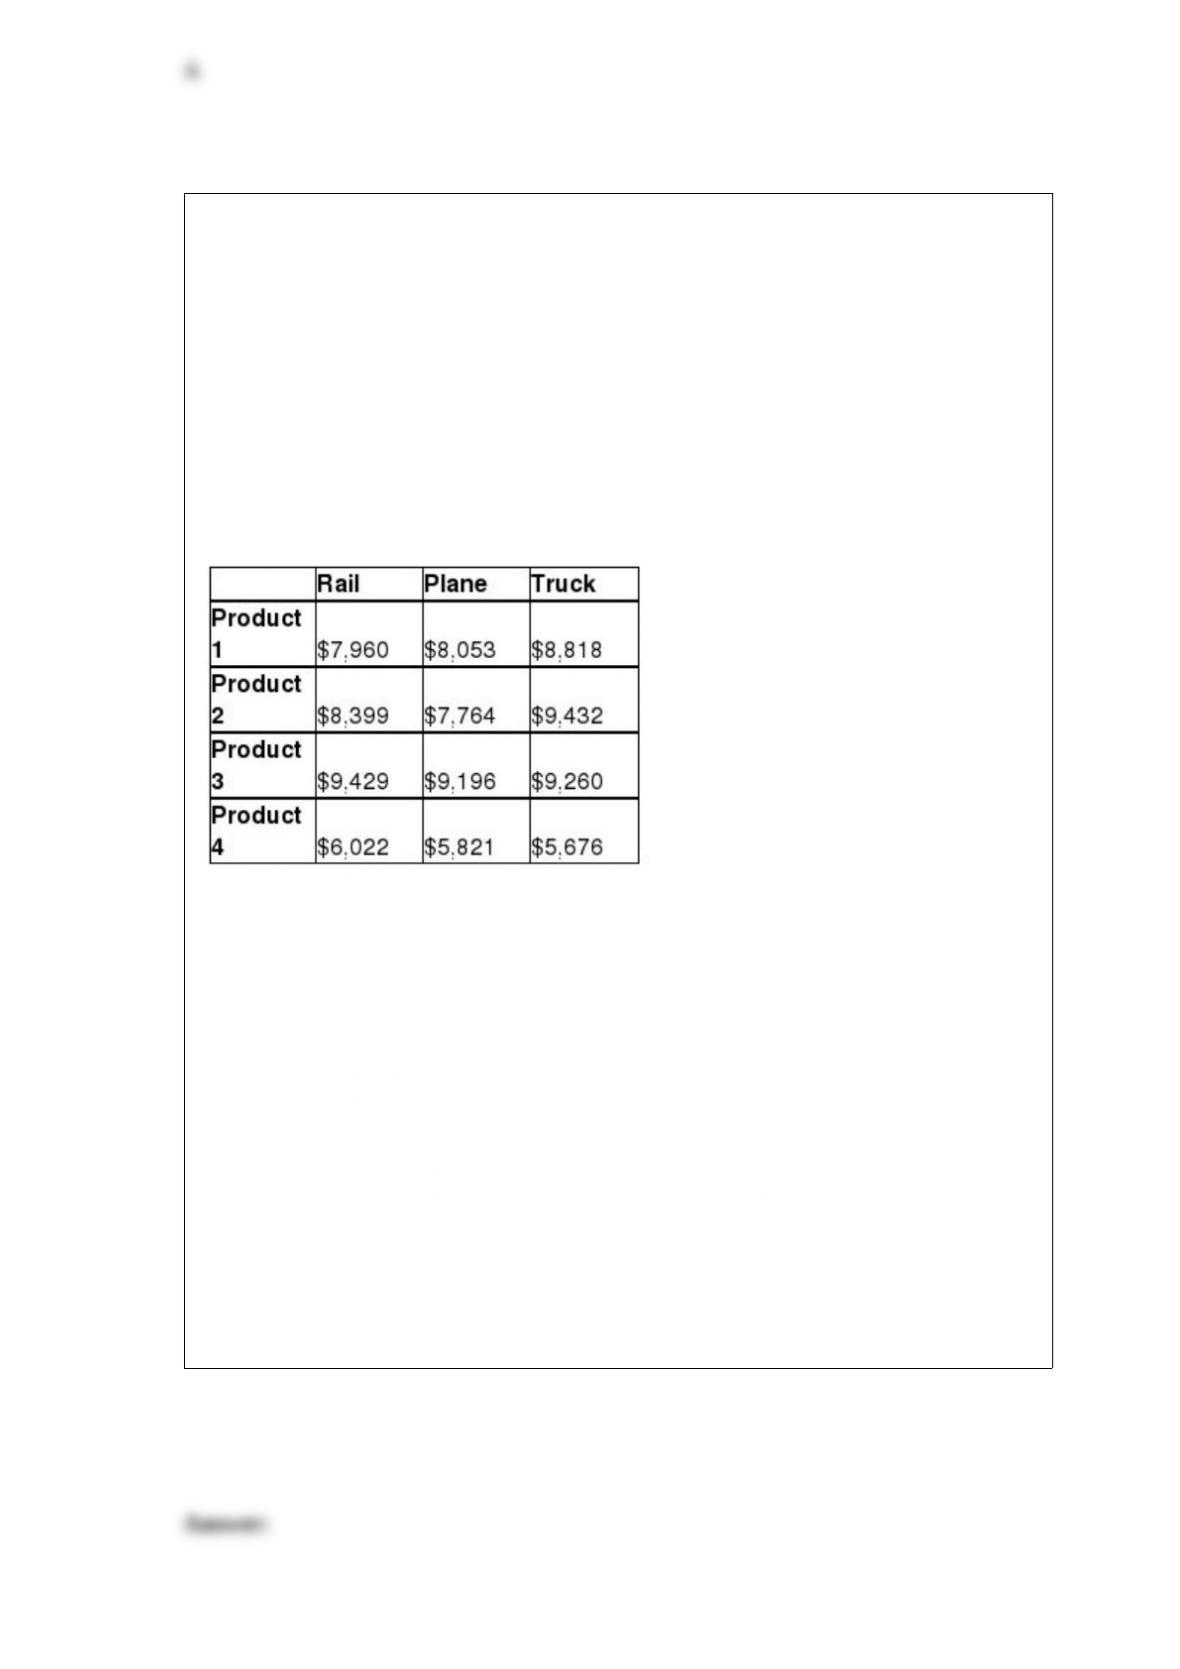
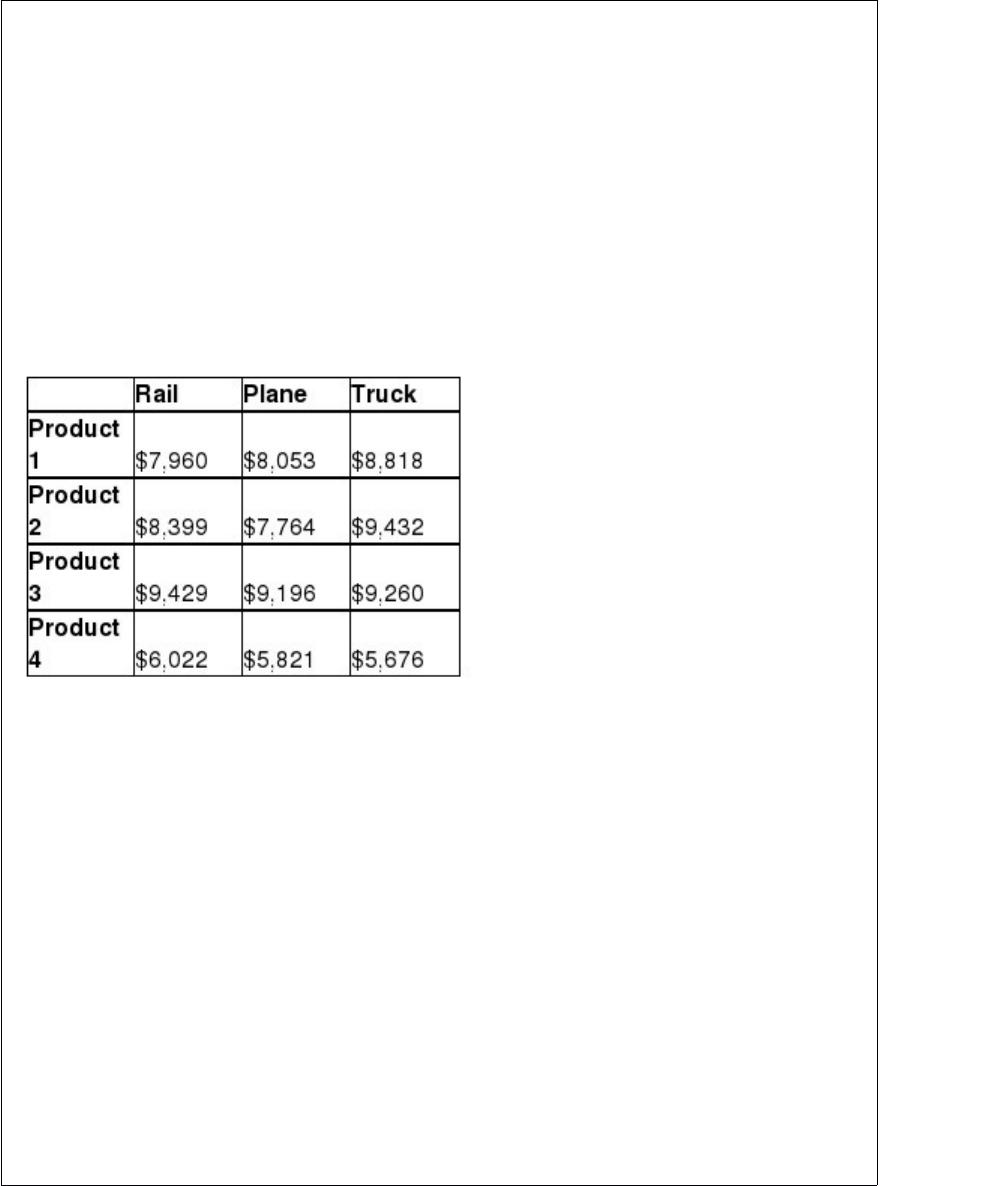
Frasier and Company manufactures four different products that it ships to customers
throughout the United States. Delivery times are not a driving factor in the decision as
to which type of carrier to use (rail, plane, or truck) to deliver the product. However,
breakage cost is very expensive, and Frasier would like to select a mode of delivery that
reduces the amount of product breakage. To help it reach a decision, the managers have
decided to examine the dollar amount of breakage incurred by the three alternative
modes of transportation under consideration. Because each product’s fragility is
different, the executives conducting the study wish to control for differences due to type
of product. The company randomly assigns each product to each carrier and monitors
the dollar breakage that occurs over the course of 100 shipments. The dollar breakage
per shipment (to the nearest dollar) is as follows:
Was Frasier and Company correct in its decision to block for type of product? Conduct
the appropriate hypothesis test using a level of significance of 0.01.
A) Because F = 32.12 > Fα=0.01 = 9.78, reject the null hypothesis. Thus, based on these
sample data we conclude that blocking is effective.
B) Because F = 28.14 > Fα=0.01 = 7.63, reject the null hypothesis. Thus, based on these
sample data we conclude that blocking is effective.
C) Because F = 32.12 > Fα=0.01 = 9.78, do not reject the null hypothesis. Thus, based on
these sample data we conclude that blocking is not effective.
D) Because F = 28.14 > Fα=0.01 = 7.63, do not reject the null hypothesis. Thus, based on
these sample data we conclude that blocking is not effective.


For the normal distribution with parameters μ = 0, σ = 3; calculate P(x > 1).
A) 0.5812
B) 0.1214
C) 0.3707
D) 0.4412
A pharmaceutical company claims that only 5 percent of patients experience nausea
when they take a particular drug. In a research study, n = 100 patients were given this
drug and 8 experienced nausea. Assuming that the company’s claim is true, what is the
probability of 8 or more patients experiencing nausea?
A) About 0.9162
B) About 0.0300
C) About 0.0838
D) About 0.4162


A decision maker wishes to test the following null and alternative hypotheses using an
alpha level equal to 0.05:
H0 : μ1 – μ2 = 0
HA : μ1 – μ2 ≠ 0
The population standard deviations are assumed to be known. After collecting the
sample data, the test statistic is computed to be z = 1.78
Using the p-value approach, what decision should be reached about the null hypothesis?
A) Since p-value = 0.0018 < α/2 = 0.025, reject the null hypothesis
B) Since p-value = 0.0415 > α/2 = 0.025, do not reject the null hypothesis.
C) Since p-value = 0.0033 < α/2 = 0.025, reject the null hypothesis.
D) Since p-value = 0.0375 > α/2 = 0.025, do not reject the null hypothesis.
Suppose that two population proportions are being compared to test whether there is
any difference between them. Assume that the test statistic has been calculated to be z =
2.21. Find the p-value for this situation.
A) p-value = 0.0136
B) p-value = 0.4864
C) p-value = 0.0272
D) p-value = 0.9728


When comparing data measured by substantially different scales, we must use:
A) standardized data values.
B) standardized data scales.
C) standardized data variations.
D) standardized data scores.
If a stratified random sample is to be conducted, which of the following is true?
A) The population will be broken down into subgroups called strata.
B) Each subgroup should contain items that are homogeneous with respect to the
characteristic of interest.
C) If effective, the total required sample size should be less than that which would be
needed if a simple random sample were selected.
D) All of the above.
A recent article in The Wall Street Journal entitled “As Identity Theft Moves Online,
Crime Rings Mimic Big Business” states that 39% of the consumer scam complaints by
American consumers are about identity theft. Suppose a random sample of 90


complaints is obtained. Of these complaints, 40 were regarding identity theft. Based on
these sample data, what conclusion should be reached about the statement made in The
Wall Street Journal? (Test using α= 0.10.)
A) Since z = 1.947 > 1.645, we reject the null hypothesis.
There is sufficient evidence to conclude that the 0.39 rate quoted in the WSJ article is
wrong.
B) Since z = 2.033 > 1.96, we reject the null hypothesis.
There is sufficient evidence to conclude that the 0.39 rate quoted in the WSJ article is
wrong.
C) Since z = 1.341 < 1.645, we do not reject the null hypothesis.
There is insufficient evidence to conclude that the 0.39 rate quoted in the WSJ article is
wrong.
D) Since z = 0.97 < 1.645, we do not reject the null hypothesis.
There is insufficient evidence to conclude that the 0.39 rate quoted in the WSJ article is
wrong.
The Boxer Company has been in business since 1998. The following sales data are
recorded by quarter for the years 2010-2012.
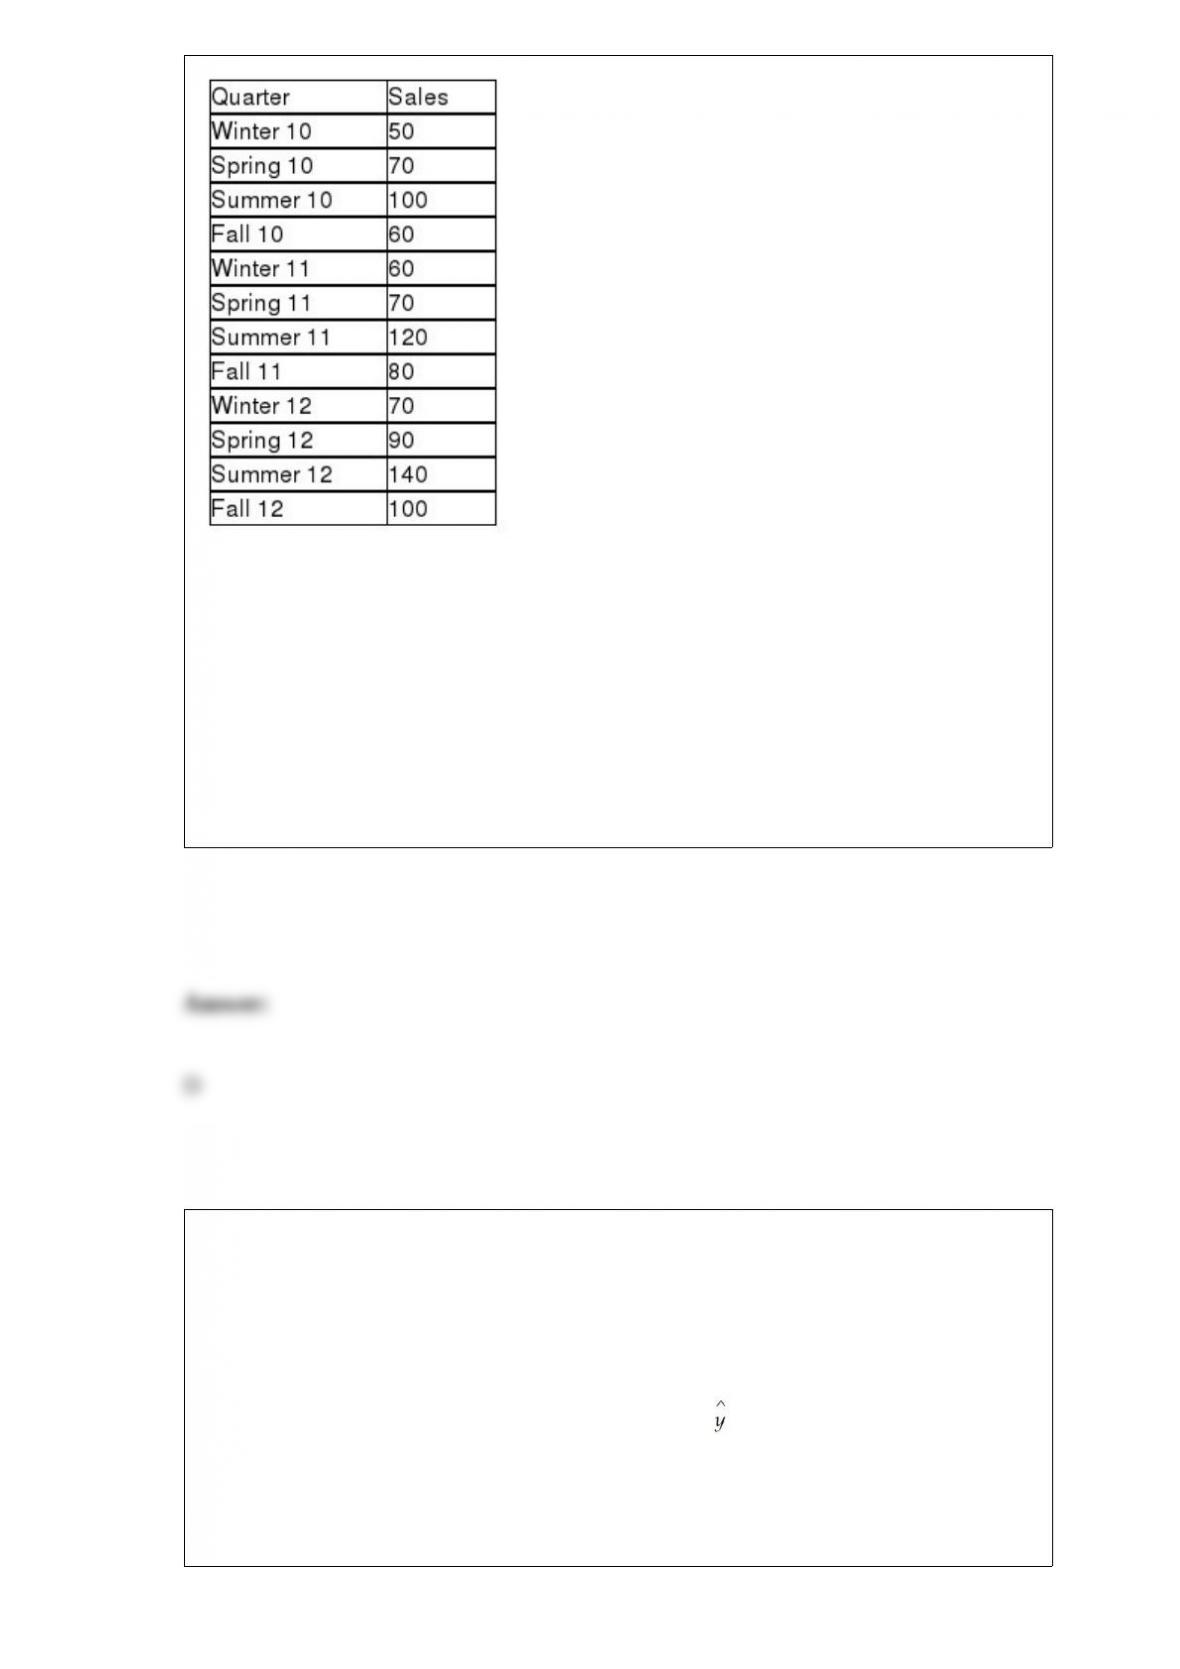
Which of the following time-series components are present in these data?
A) Trend component
B) Seasonal component
C) Random component
D) All of the above
In analyzing the residuals to determine whether the simple regression analysis satisfies
the regression assumptions, which of the following is true?
A) The histogram of the residuals should be approximately bell-shaped.
B) The scatter plot of the residuals against the dependent variable should illustrate that
the variation in residuals is the same over all levels of .
C) Neither A nor B are true.
D) Both A and B are true.