Unlock document.
This document is partially blurred.
Unlock all pages and 1 million more documents.
Get Access

Standard stepwise regression is a good way of identifying potential multicollinearity
problems since we are able to see the impact on the model at each step that occurs when
a new variable is added to the model. For instance, if bringing in a new variable causes
the sign to change on a previously entered variable, we have evidence of
multicollinearity.
If a decision maker wishes to test whether four independent populations have the same
center and is unwilling to make the assumption that the populations are normally
distributed with equal variances, she can use the Kruskal-Wallis test.
A random sample of n = 500 people was surveyed recently to determine an estimate for
the proportion of people in the population who had attended at least some college. The
estimate concluded that between 0.357 and 0.443 of the population had attended. Given
this information, we can determine that the confidence level was approximately 95
percent.
Suppose the time it takes for a customer to be served at a fast-food chain business is
thought to be uniformly distributed between 3 and 8 minutes, then the probability that a
customer is served in less than 3 minutes is 0.
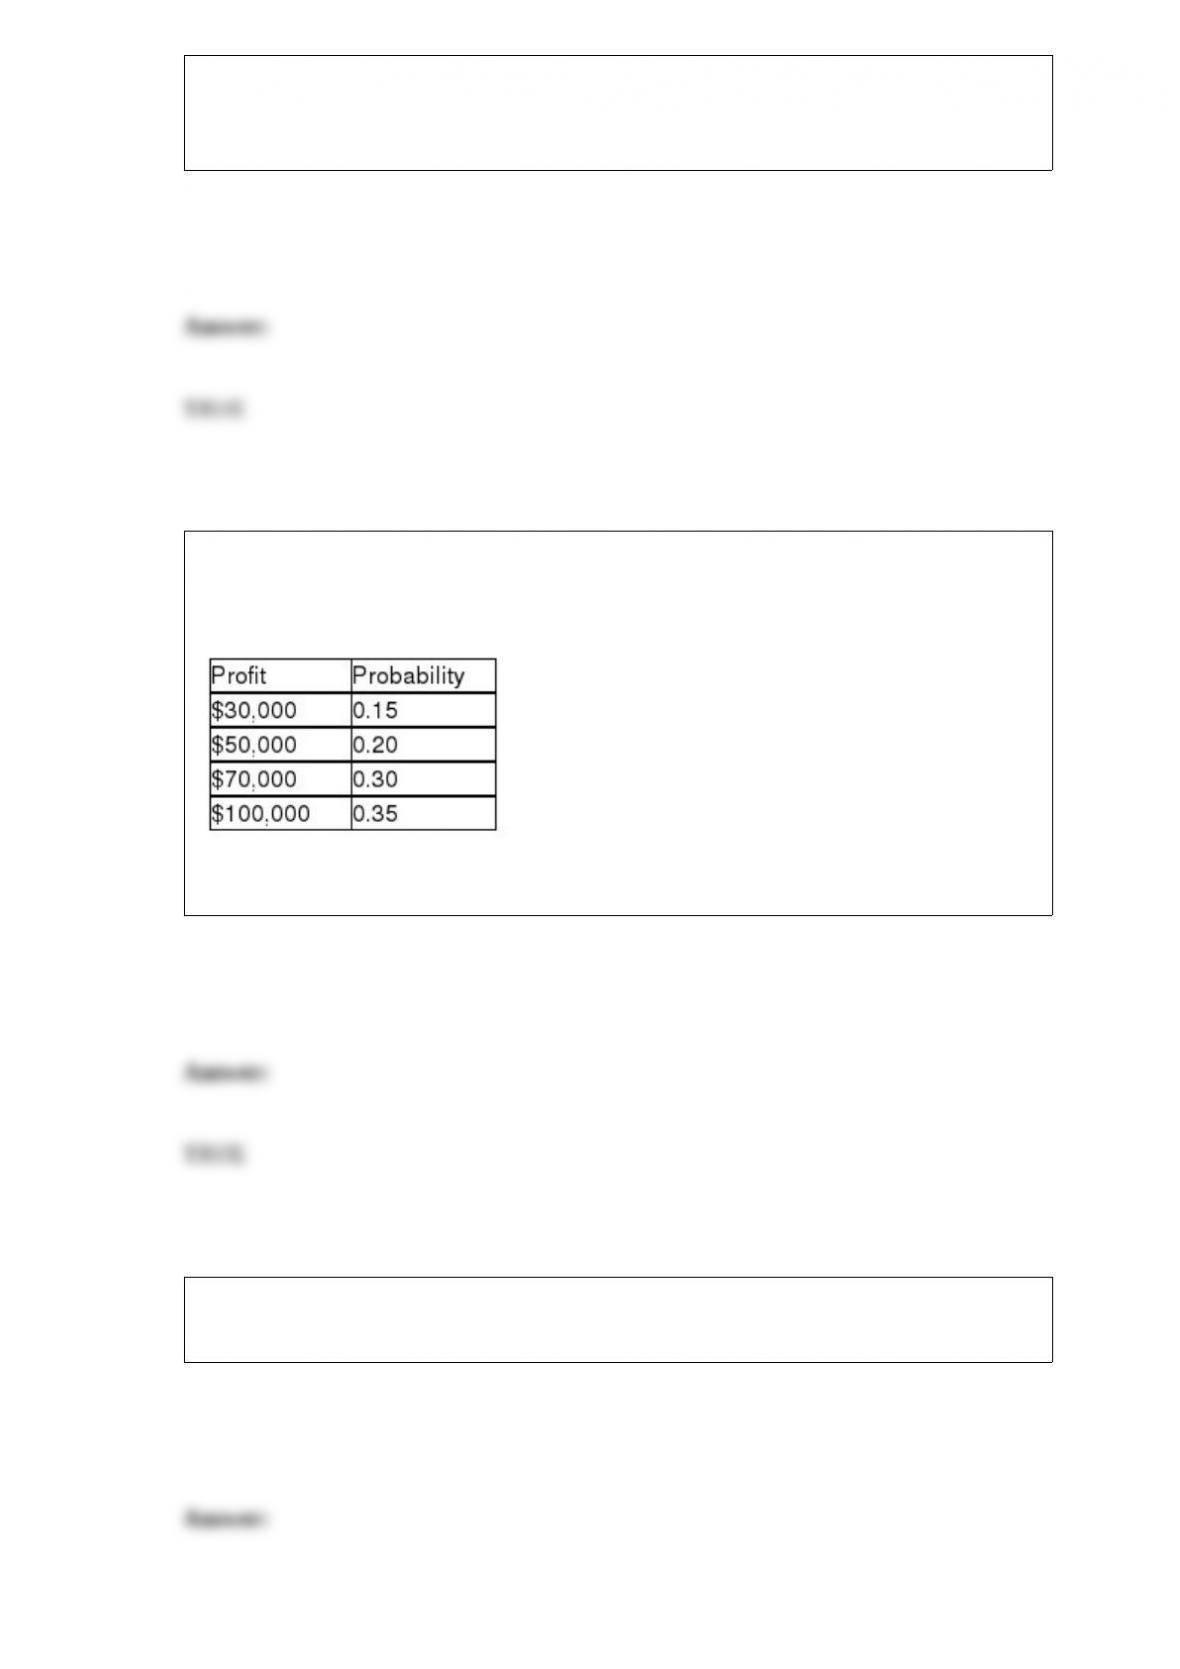
The Cromwell Construction Company has the opportunity to enter into a contract to
build a mountain road. The following table shows the probability distribution for the
profit that could occur if it takes the contract:
Based on this information, the probability of profit being at least $70,000 is 0.65.
Simple random sampling involves selecting members of the population in such as way
that all members are equally likely to be chosen.

If the sample size is large, the standard normal distribution can be used in place of the
chi-square in a goodness-of-fit test for testing whether the population is normally
distributed.
One of the most common sources of common cause variation is the people who are
working in the process.
When the hypothesized proportion is close to 0.50, the spread in the sampling
distribution of is greater than when the hypothesized proportion is close to 0.0 or 1.0.

When the Histogram tool in Excel is used to construct a frequency distribution and
histogram, the default histogram is in the proper format and will require only that you
add appropriate labels.
When surveyed, a sample of 1,250 patients at a regional hospital provided interviewers
with the following summary statistics pertaining to the hospital charges:
Minimum = $278.00 Q1 = $1,245 Q2 = $3,567 Q3= $4,702.
Based on these data, if you were to construct a box and whisker plot, the value
corresponding to the right-hand edge of the box would be $4,702.
Assume that we have found a regression equation of = 3.6 - 2.4x, and that the
coefficient of determination is 0.72, then the correlation of x and y must be about 0.849.

A sample of n observations is taken from a normally distributed population to estimate
the population variance. The degrees of freedom for the chi-square distribution are n-2.
In a two-tailed test for the equality of two variances, the critical value is determined by
going to the F-distribution table with an upper-tail area equal to alpha divided by two.
In a recent study at First National Bank, a frequency count was made for the variable
marital status for the bank's 10,000 customers. It would also be appropriate to develop a
histogram for this variable to show how marital status is distributed.
In election years, the polls that are conducted by such companies as Gallup and Harris
typically employ stratified random sampling to reduce the number of people that will
need to be surveyed.
A study of 4000 Dell PC customers listed the age of the customer among other
variables. The youngest customer was 14 years old and the oldest customer was 84
years old. If analysts for the company wish to develop a frequency distribution with 7
classes, the smallest value that the class width can be is 10 years.
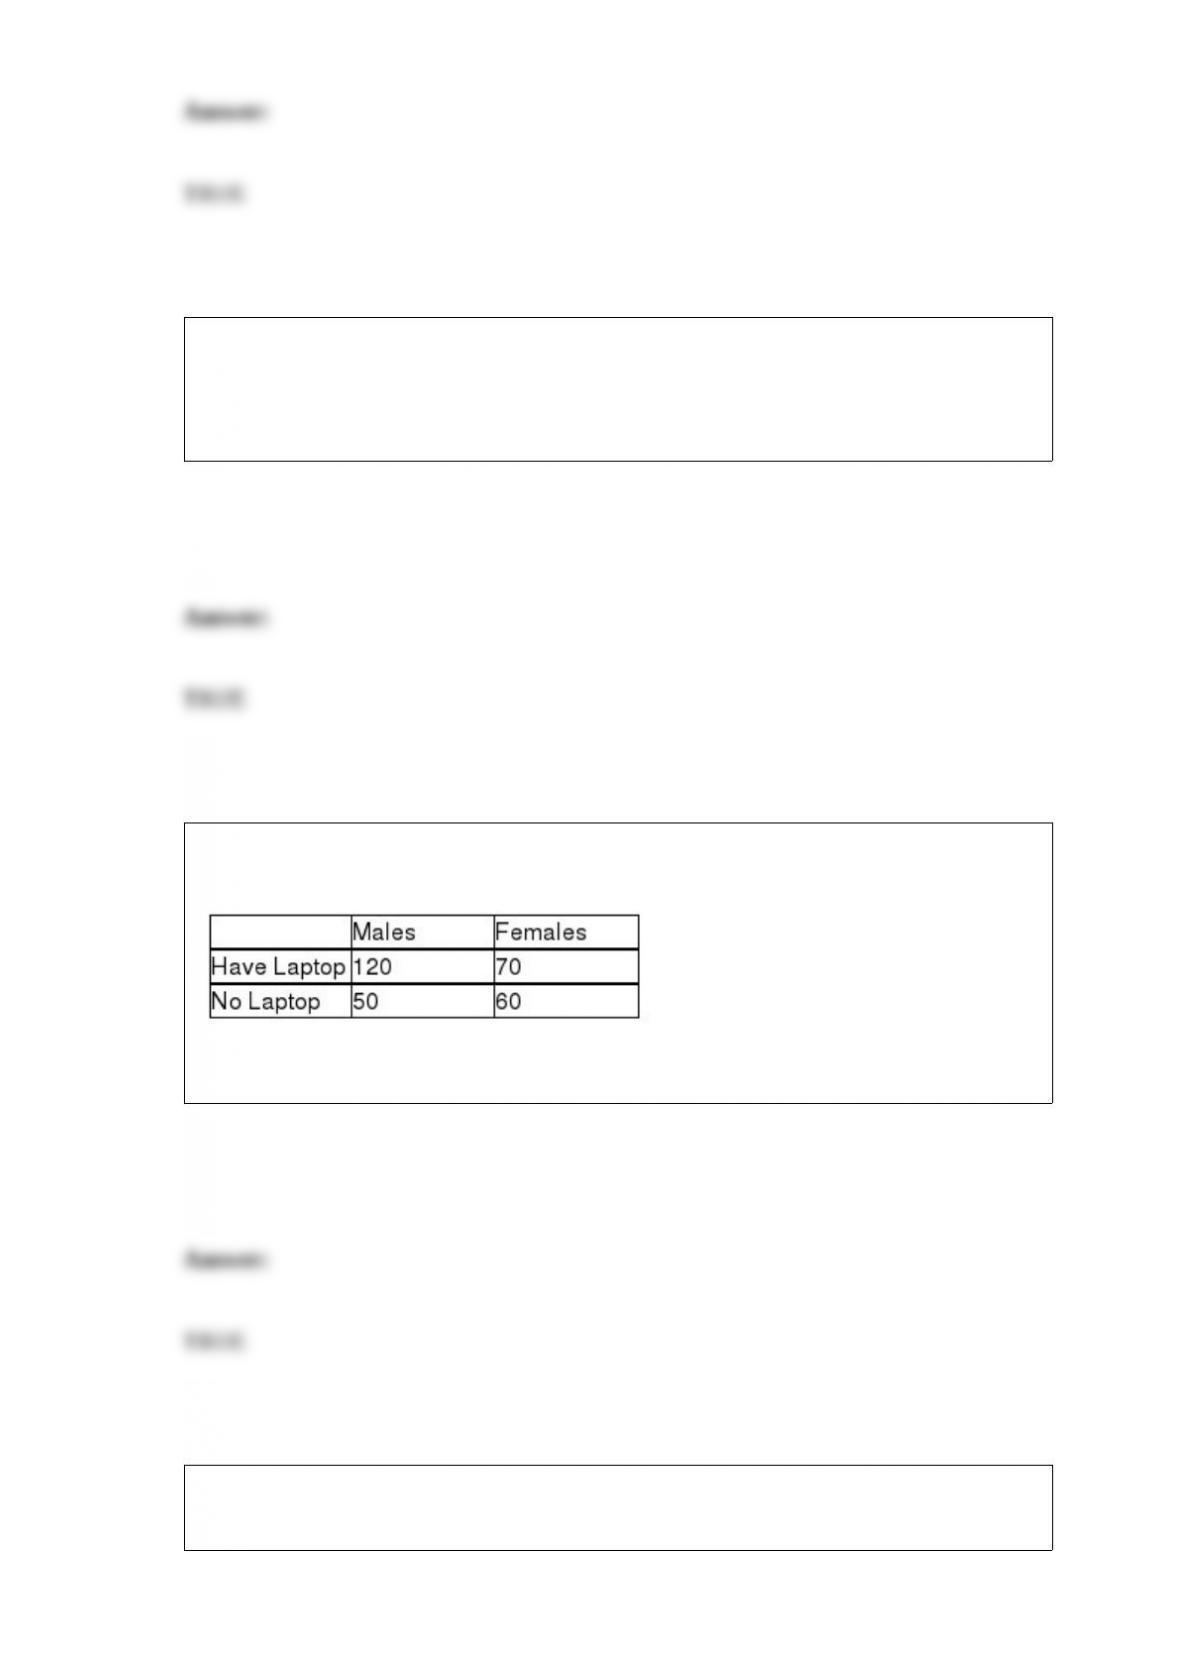
A survey was recently conducted in which males and females were asked whether they
owned a laptop personal computer. The following data were observed:
Given this information, the sample size in the survey was 300 people.
Box and whisker plots are often useful for determining whether two populations have
distributions that might each be normally distributed.

The makers of Crustfree Bread in Boston have a quality standard that allows no more
than 3 burned loaves per batch on average. Recently, the manager inspected a batch and
found 5 burned loaves. She did not appear to be upset at the production meeting. This is
because the chance of exactly 5 burned loaves occurring is 0.1008.
The logic behind the F-test for testing whether two populations have equal variances is
to determine whether sample variances computed from random samples selected from
the two populations differ due to sampling error, or whether the difference is more than
can be attributed to sampling error alone, in which case, we conclude that the
populations have different variances.
The regional sales manager for a medical supply company recently collected data on the
reasons why customers returned the merchandise for a refund. She actually formed a
frequency distribution for this variable. It would now be acceptable to construct a bar
chart to graphically display the results.

In estimating a confidence interval for the difference between two means, when the
samples are independent and the standard deviations are unknown, it can be acceptable
for there to be small violations of the assumptions of normality and equal variances,
especially when the sample sizes are equal.
The reason that a population mean and the mean of a random sample selected from that
population might be different is that the sample mean is found by dividing by n-1 while
the population mean is found by dividing by n.
A research study has stated that the taxes paid by individuals is correlated at a .78 value
with the age of the individual. Given this, the scatter plot would show points that would
fall on straight line on a slope equal to .78.

Stepwise regression is the approach that is always taken when developing a regression
model to fit a curvilinear relationship between the dependent and potential independent
variables.
In a Mann-Whitney U test, the test statistic will be equal to the sum of the ranks from
sample one, or sample two, whichever is larger.
Stock analysts have recently stated in a meeting on Wall Street that over the past 50
years there have been periods of high market prices followed by periods of lower prices
but over time prices have moved upwards. Given their statement, stock prices most
likely exhibit only trend and cyclical components.

A model is a representation of an actual system.
During the past week, of the 250 customers at the Dairy Queen who ordered a Blizzard,
50 ordered strawberry. This means that of the next five Blizzard customers, exactly one
will order strawberry.
Data are considered to be right-skewed when the mean lies to the right of the median.
In a contingency analysis the expected values are based on the assumption that the two
variables are independent of each other.

At a potato processing plant in the state of Washington, 400 potatoes have been
examined for disease. Of these, four were diseased. Based on this, the plant manager
has stated that the probability of finding a diseased potato is 0.01. He is applying
subjective probability to arrive at this 0.01 value.
When the production manager selects a sample of items that have been produced on her
production line and computes the proportion of those items that are defective, the
proportion is referred to as a statistic.
A correlation of -0.9 indicates a weak linear relationship between the variables.

All symmetric distributions can be assumed normally distributed.
In multiple regression analysis, the residual is the absolute difference between the
actual value of y and the predicted value of y.
When analyzing annual incomes of adults in a market area, the marketing manager's
report indicated that the 90th percentile is $123,400. That means that 90 percent of the
adult incomes in the market area fall at or below $123,400.
The following probability distribution was subjectively assessed for the number of sales
a salesperson would make if he or she made five sales calls in one day.

Given this distribution, the probability that the number of sales is 2 or 3 is 0.50.
It is entirely possible for the R-chart to show that a process is in statistical control and
the -chart to show that the same process is out of control.
Which of the following would be an appropriate null hypothesis?
A) The mean of a population is equal to 55.
B) The mean of a sample is equal to 55.
C) The mean of a population is greater than 55.
D) The mean of a sample is greater than 55.
A randomly selected value from a normal distribution is found to be 2.1 standard
deviations above its mean. What is the probability that a randomly selected value from
the distribution will be greater than 2.1 standard deviations above the mean?
A) 0.0179
B) 0.0512
C) 0.0231
D) 0.0024
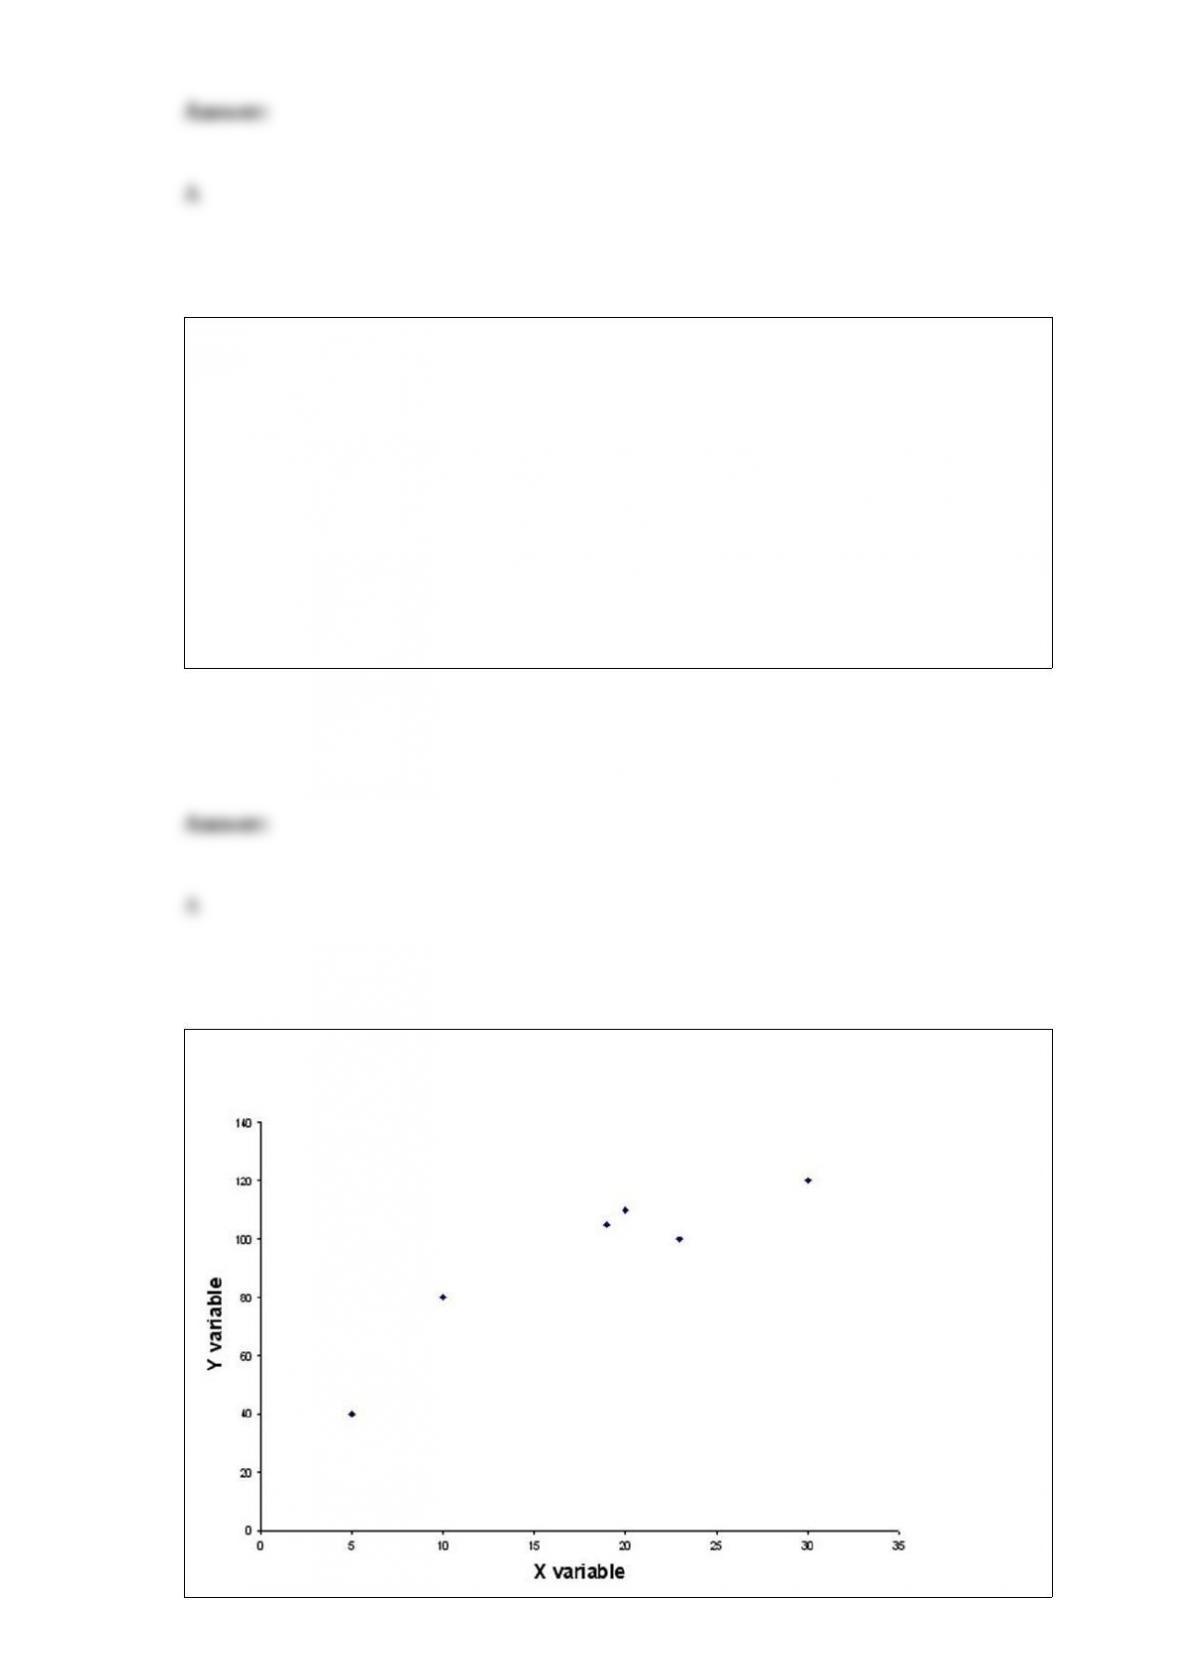
Consider the following chart. Which of the following statements is most correct?

A) The values for the dependent variable are determined by the values for the
independent variable.
B) The values in a scatter plot should be connected by a straight line.
C) The variable on the horizontal axis should be the independent variable.
D) A scatter plot like this one shows the trend in the data over time.
General Electric Corporation tracks employee turnover annually. It currently has a data
set that contains turnover for the past 20 years. What type of data does it have?
A) Time-series data
B) Cross-sectional data
C) Nominal data
D) Ordinal data
A company that sells an online course aimed at helping high-school students improve
their SAT scores has claimed that SAT scores will improve by more than 90 points on
average if students successfully complete the course. To test this, a national school
counseling organization plans to select a random sample of n = 100 students who have
previously taken the SAT test. These students will take the company's course and then
retake the SAT test. Assuming that the population standard deviation for improvement

in test scores is thought to be 30 points and the level of significance for the hypothesis
test is 0.05, what is the probability that the counseling organization will incorrectly
"accept" the null hypothesis when, in fact, the true mean increase is actually 95 points?
A) Approximately 0.508
B) About 0.492
C) Approximately 0.008
D) Can't be determined without knowing the sample results.
Many companies use well-known celebrities as spokespeople in their TV
advertisements. A study was conducted to determine whether brand awareness of
female TV viewers and the gender of the spokesperson are independent. Each in a
sample of 300 female TV viewers was asked to identify a product advertised by a
celebrity spokesperson. The gender of the spokesperson and whether or not the viewer
could identify the product was recorded. The numbers in each category are given below.
Referring to these sample data, if the appropriate hypothesis test is to be conducted
using a .05 level of significance, which of the following is correct critical value?
A) 9.4877
B) 3.8415
C) 1.96
D) 7.8147

Given a population where the proportion of items with a desired attribute is p = 0.25, if
a sample of 400 is taken, what is the probability the proportion of successes in the
sample will be greater than 0.22?
A) 0.9162
B) 0.8812
C) 0.7141
D) 0.8412
A common rule of thumb for determining how many classes to use when developing a
frequency distribution with classes is:
A) between 5 and 20 classes.
B) no fewer than 6 classes.
C) equal to 0.25 times the number of data values.
D) at least 10 classes.

At a sawmill in Oregon, a process improvement team measured the diameters for a
sample of 1,500 logs. The following summary statistics were computed:
Given this information, in a box and whisker plot, which of these four values will NOT
appear?
A) 8.9 in.
B) 13.5 in.
C) 15.6 in.
D) 14.2 in.
According to CNN business partner Careerbuilder.com, the average starting salary for
accounting graduates in 2008 was at least $47,413. Suppose that the American Society
for Certified Public Accountants planned to test this claim by randomly sampling 200
accountants who graduated in 2008.
Compute the power of the hypothesis test to reject the null hypothesis if the true
average starting salary is only $47,000. Assume that the population standard deviation
is known to be $4,600 and the test is to be conducted using an alpha level equal to 0.01.
A) 0.0872
B) 0.1323
C) 0.8554
D) 0.9812

In a randomized complete block design analysis of variance, how many factors are
there to be analyzed?
A) Depends on the sample size in each treatment
B) One factor, but multiple levels
C) Two factors
D) Can't be determined without additional information
A walk-in medical clinic believes that arrivals are uniformly distributed over weekdays
(Monday through Friday). It has collected the following data based on a random sample
of 100 days.
Based on this information how many degrees for freedom are involved in this goodness
of fit test?
A) 99
B) 100
C) 4

D) 5
A major airline is concerned that the waiting time for customers at its ticket counter
may be exceeding its target average of 190 seconds. To test this, the company has
selected a random sample of 100 customers and times them from when the customer
first arrives at the checkout line until he or she is at the counter being served by the
ticket agent. The mean time for this sample was 202 seconds with a standard deviation
of 28 seconds. Given this information and the desire to conduct the test using an alpha
level of 0.02, which of the following statements is true?
A) The chance of a Type II error is 1 - 0.02 = 0.98.
B) The test to be conducted will be structured as a two-tailed test.
C) The test statistic will be approximately t = 4.286, so the null hypothesis should be
rejected.
D) The sample data indicate that the difference between the sample mean and the
hypothesized population mean should be attributed only to sampling error.
The assumption that the errors or residuals are independent is best checked by:
A) looking at a normal probability plot of the residuals.
B) looking a scatter plot of each x versus y.

C) looking at a residual plot versus x and checking for curvature.
D) looking at a plot of the residuals versus time and checking for trends.
When stratified random sampling is employed, the population is divided into
homogeneous subgroups called strata.
Many people believe that they can tell the difference between Coke and Pepsi. Other
people say that the two brands can't be distinguished. To test this, a random sample of
20 adults was selected to participate in a test. After being blindfolded, each person was
given a small taste of either Coke or Pepsi and asked to indicate which brand soft drink
it was. If people really can't tell the difference, the probability that fewer than 6 people
will guess correctly is:
A) 0.0148
B) approximately 0.02
C) 0.0307
D) 0.0514
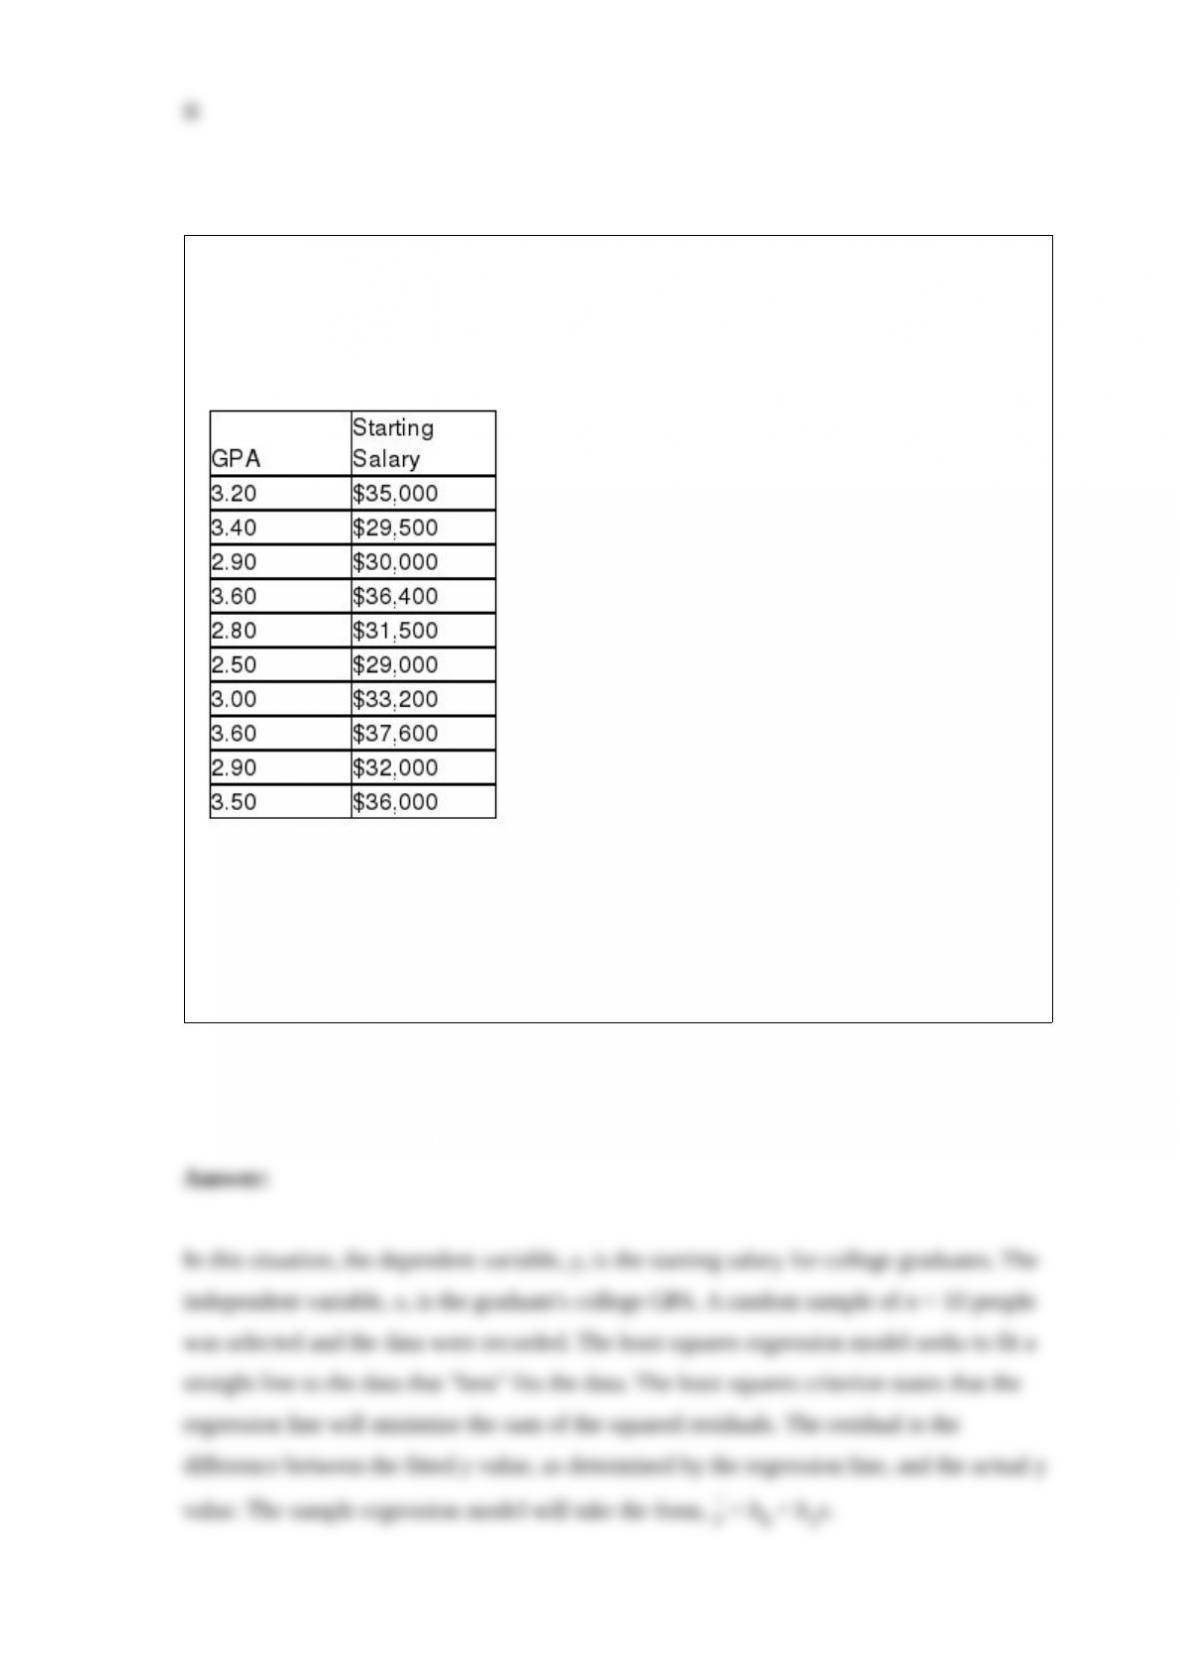
A national job placement company is interested in developing a model that might be
used to explain the variation in starting salaries for college graduates based on the
college GPA. The following data were collected through a random sample of the clients
with which this company has been associated.
Based on this sample information, determine the least squares regression model,
determine what percent of the variation in starting salaries is explained by GPA, and
test to determine whether the regression model is statistically significant at the 0.05
level of significance. Also, develop a scatter plot of the data and locate the regression
line on the scatter plot.

A normally distributed population has a mean of 500 and a standard deviation of 60.
Determine the probability that a random sample of size 25 selected from the population
will have a sample mean greater than or equal to 515.
A) 0.1056
B) 0.1761
C) 0.0712
D) 0.0151
Which of the following is not a characteristic of the normal distribution?

A) Symmetric
B) Mean = median = mode
C) Bell-shaped
D) Equal probabilities at all values of x
After a linear forecasting model is found for a time series, if the Durbin-Watson statistic
is less than dL this means that:
A) no positive autocorrelation exists, the linear model is adequate.
B) positive autocorrelation exists, a nonlinear model should be tried.
C) no positive autocorrelation exists, a nonlinear model should be tried.
D) positive autocorrelation exists, the linear model is adequate.
Suppose you are given the following data.
If you wish to have a histogram with five classes, what should the first class limits be?
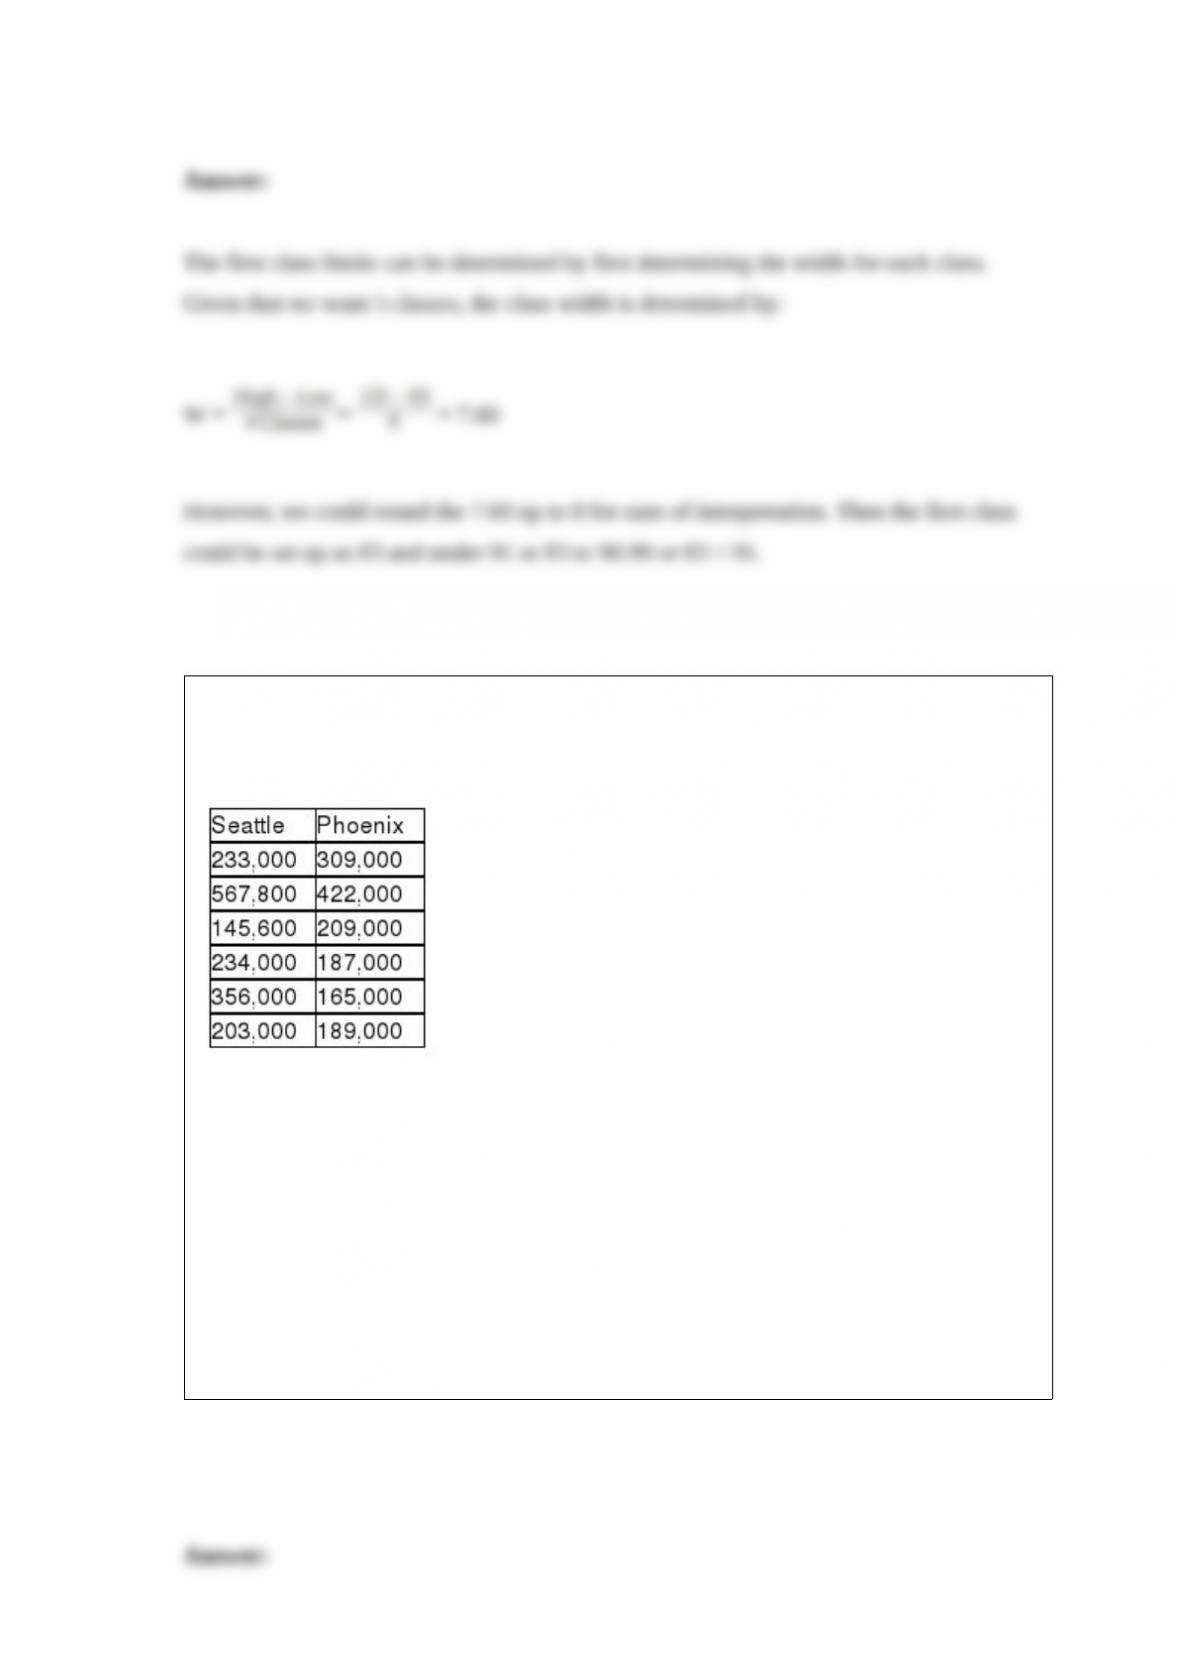
Consider the situation in which a study was recently conducted to determine whether
the median price of houses is the same in Seattle and Phoenix. The following data were
collected.
Given these data, if a Mann-Whitney U test is to be used, the sum of the ranks for
Seattle is:
A) 43
B) 35
C) 25.5
D) 40

Recently, an automobile insurance company performed a study of a random sample of
15 of its customers to determine if there is a positive relationship between the number
of miles driven and the age of the driver. The sample correlation coefficient is r = .38.
Given this information, which of the following is appropriate critical value for testing
the null hypothesis at an alpha = .05 level?
A) t = 2.6104
B) t = 1.7613
C) t = 1.7531
D) t = 1.7709
Which of the following statements is true with respect to the sampling distribution of a
proportion?
A) An increase in the sample size will result in a reduction in the size of the standard
deviation.
B) As long as the sample size is sufficiently large, the sampling distribution will be
approximately normal.
C) The mean of the sampling distribution will equal the population proportion.
D) All of the above are true.

A random variable is normally distributed with a mean of 25 and a standard deviation of
5. If an observation is randomly selected from the distribution, determine two values of
which the smallest has 25% of the values below it and the largest has 25% of the values
above it.
A) 18.85 and 27.94
B) 19.31 and 21.12
C) 16.23 and 18.82
D) 21.65 and 28.35
When discussing variation in the output of a process, which of the following is not true?
A) Variation is natural.
B) No two products or services are exactly the same.
C) With a fine enough measurement gauge, all things can be seen to differ.
D) Common cause variation can be eliminated.
Suppose an airline decides to conduct a survey of its customers to determine their
opinion of a proposed one-bag limit. The plan calls for a random sample of customers

on different flights to be given a short written survey to complete during the flight. One
key question on the survey will be: "Do you approve of limiting the number of carry-on
bags to a maximum of one bag?" Airline managers expect that only about 15% will say
"yes." Based on this assumption, what size sample should the airline take if it wants to
develop a 95% confidence interval estimate for the population proportion who will say
"yes" with a margin of error of 0.02?
A) 1151
B) 1341
C) 1512
D) 1225
The makers of Sweet-Things candy sell their candy by the box. Based on company
policy, the mean target weight of all boxes is 2.0 pounds. To make sure that they are not
putting too much in the boxes, the manager wants no more than 3 percent of all boxes
to contain more than 2.10 pounds of candy. In order to do this, with a mean weight of 2
pounds, what must the standard deviation be? Assume that the box weights are
normally distributed.
A) Approximately 0.05 pounds
B) -0.133 pounds
C) 1.144 pounds
D) None of the above

A cell phone company wants to determine if the use of text messaging is independent of
age. The following data has been collected from a random sample of customers.
Based on the data above what is the expected value for the "under 21 and regularly use
text messaging" cell?
A) 82
B) 50
C) 120
D) 58
Which of the following is a false statement?
A) A bar chart is usually constructed so that gaps exist between the bars.
B) The bars on a bar chart can be different colors.
C) A histogram is usually constructed without gaps between the bars.
D) A bar chart and histogram can typically be used interchangeably.


