
____________ theory is a methodology that attempts to determine the number of
servers that strikes an optimum balance between the time customers wait for service
and the cost of providing service.
A. Exponential
B. Binomial
C. Uniform distribution
D. Queuing
A random sample of size 1,000 is taken from a population where p = .20. Find P( < .
18).
A. .9429
B. .0571
C. .2643
D. .0793
A powder metal manufacturing company is producing sleeves for a locking mechanism.
The target (nominal) value for the inside diameter is 1 inch. The inside diameter
specifications are 1 .005 inches. Assume that the process is in statistical control with =
1.0002 inches, = .003 inches, and subgroup size of 5. Calculate the control limits for
the chart.
A. .99781 to 1.00219

B. .99801 to 1.00238
C. .99830 to 1.00713
D. .99847 to 1.00193
E. .995 to 1.005
The process of assigning a value of a variable to each element in a data set is called
___________.
A. sampling
B. measurement
C. experimental analysis
D. observational analysis
The _______________________is the difference between the expected payoff that
would have been realized had the best alternative action been selected if we knew
which state of nature would occur and the expected payoff under risk.
A. expected monetary value
B. expected value of perfect information
C. expected value of sample information
D. expected net gain of sampling
When we carry out a chi-square goodness-of-fit test for a normal distribution, the null
hypothesis states that the population
A. does not have a normal distribution.
B. has a normal distribution.
C. has a chi-square distribution.
D. does not have a chi-square distribution.
E. has k − 3 degrees of freedom.
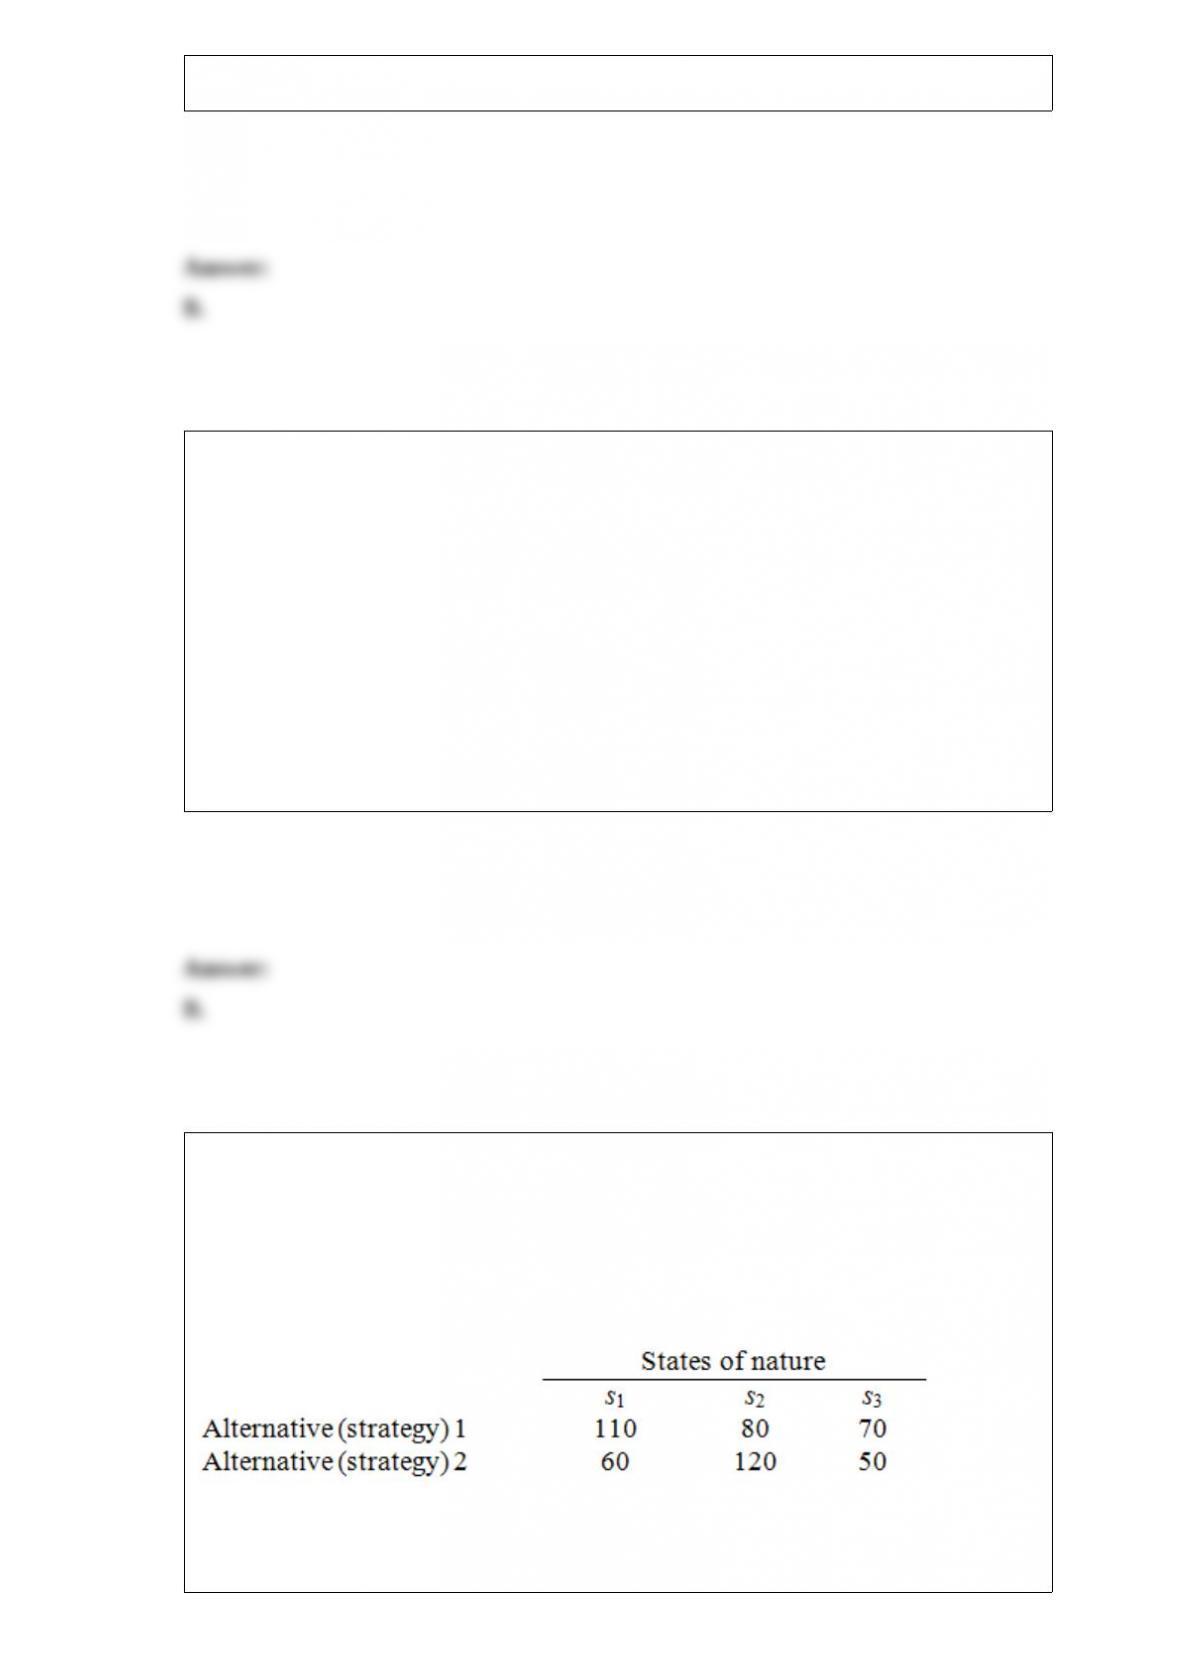
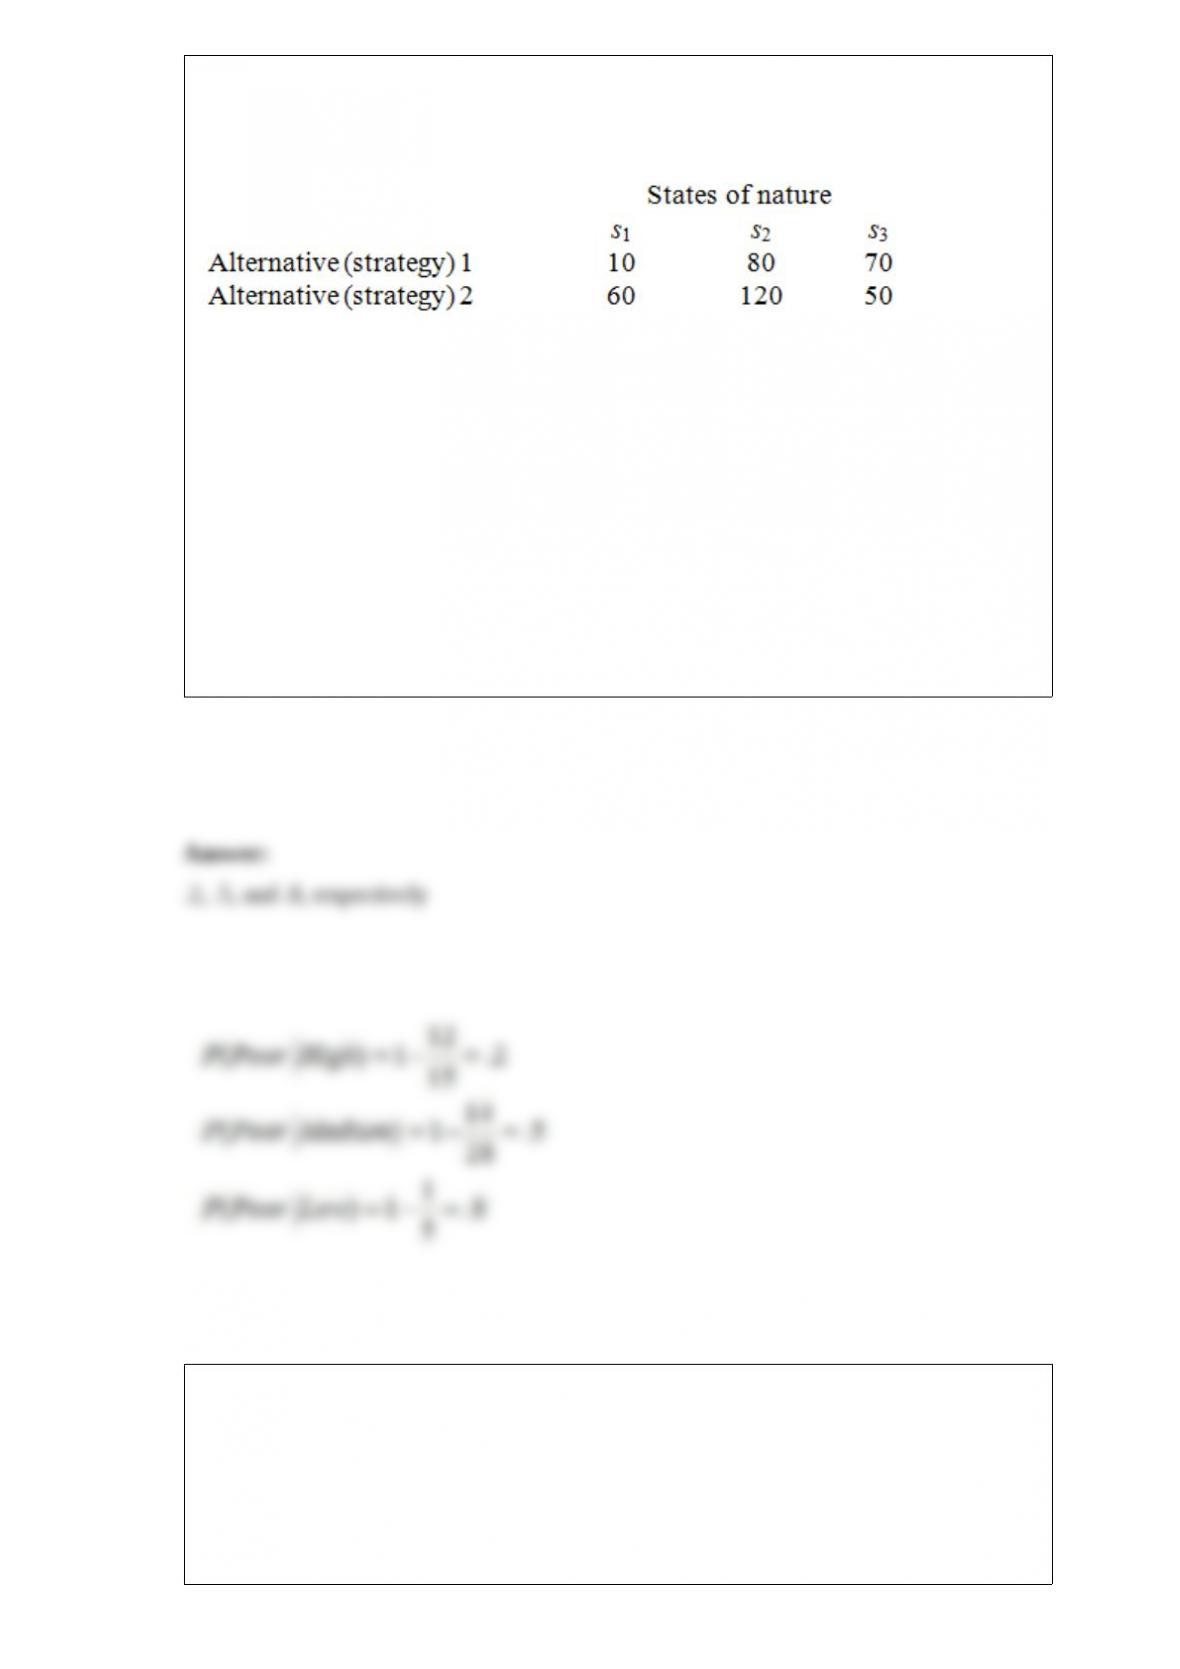
Alternatives 1 and 2 in the following payoff table represent the two possible
manufacturing strategies that the EKA manufacturing company can adopt. The level of
demand affects the success of both strategies. The states of nature (SI) represent the
levels of demand for the company products. S1, S2, and S3 characterize high, medium,
and low demand, with probabilities of .3, .6, and .1, respectively. The payoff values are
in thousands of dollars.
The management believes that weather conditions significantly affect the level of
demand. 48 monthly sales reports are randomly selected. These monthly sales reports

show 15 months with high demand, 28 months with medium demand, and 5 months
with low demand. 12 of the 15 months with high demand had favorable weather
conditions. 14 of the 28 months with medium demand had favorable weather
conditions. Only 1 of the 5 months with low demand had favorable weather conditions.
The estimated probabilities of poor weather conditions given different levels of demand
are presented below.
What is the probability of high demand given that the weather conditions are poor?
A. .06
B. .44
C. .1371
D. .12
E. .1818
The expected value criterion is used for decision making under _______________.
A. risk
B. utility
C. certainty
D. uncertainty

____________ is not rejecting H0 when H0 is false.
A. A Type I error
B. A Type II error
C. The random error
D. α
The success rate of an experimental medical procedure is 37 per 120 cases in a sample.
Find a 95 percent confidence interval for the actual success proportion of the procedure.
A. [.2975, .4425]
B. [.2389, .3776]
C. [.2836, .4564]
D. [.2250, .3910]
A fair die is rolled 36 times. What is the standard deviation of the even number (2, 4, or
6) outcomes?
A. 18
B. 9
C. 5

D. 3
E. 1.732
When comparing the variances of two normally distributed populations using
independent random samples, the correct test statistic to use is __________.
A. z
B. t
C. F
D. chi-square
E. None of the other choices is correct.
A large disaster cleaning company estimates that 30 percent of the jobs it bids on are
finished within the bid time. Looking at a random sample of 8 jobs that it has
contracted, find the probability that x (number of jobs finished on time) is within one
standard deviation of the mean.
A. .6867
B. .7483
C. .5506

D. .8844
The ___________________ units are the entities (objects, people, etc.) to which the
treatments are assigned.
A. variable
B. block
C. experimental
D. random
The flying time of a drone airplane has a normal distribution with mean 4.76 hours and
standard deviation of .04 hours. What is the probability that the drone will fly between
4.70 and 4.82 hours?
A. .1336
B. .8664
C. .9332
D. .4332

The average time an individual reads online national news reports is 49 minutes.
Assume the standard deviation is 16 minutes and that the times are normally
distributed. What is the probability someone will spend at least one hour reading online
national news reports?
A. .9987
B. .7549
C. .2451
D. .0013
A random sample n = 15 is taken from a population assumed to be normal, and = 1.2
and the sample variance is .36. Calculate a 99 percent confidence interval for μ.
A. [.923, 1.477]
B. [.794, 1.607]
C. [.801, 1.600]
D. [.739, 1.661]

Suppose that the waiting time for a license plate renewal at a local office of a state
motor vehicle department has been found to be normally distributed with a mean of 30
minutes and a standard deviation of 8 minutes. Complete the following statement: Only
20 percent of the individuals wait less than _____ minutes.
A. 36.72
B. 23.28
C. 34.63
D. 25.37
In a local survey, 100 citizens indicated their opinions on a revision to a local land-use
plan. Of the 62 persons giving favorable responses, 40 were males. Of the 38 giving
unfavorable responses, 15 were males. If one citizen is randomly selected, find the
probability that person is male and has a favorable opinion.
A. 0.40
B. 0.65
C. 0.62
D. 0.55
E. 0.25
The chi-square goodness-of-fit test for multinomial probabilities with 5 categories has
_____ degrees of freedom.
A. 5
B. 4
C. 3
D. 6
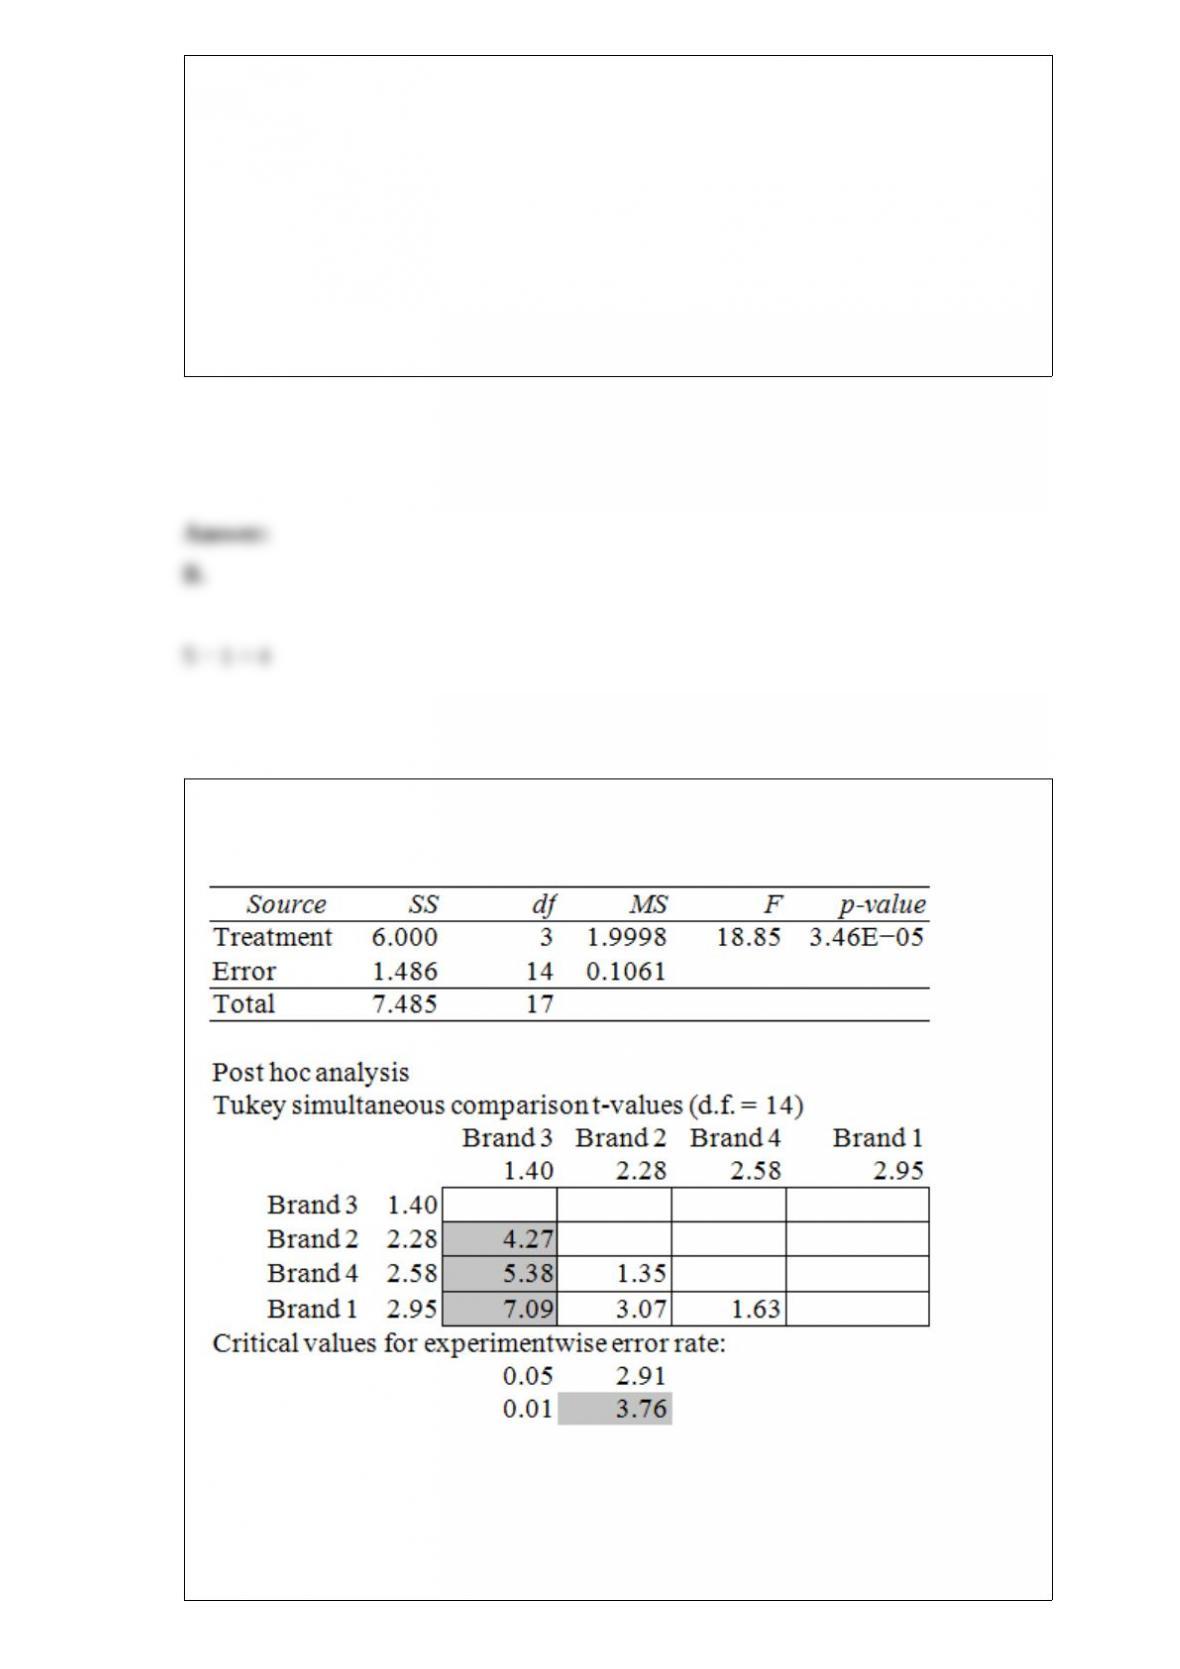
ANOVA table
The Excel/MegaStat output given above summarizes the results of a one-way analysis
of variance in an attempt to compare the performance characteristics of four brands of
vacuum cleaners. The response variable is the amount of time it takes to clean a specific
size room with a specific amount of dirt.

At a significance level of .05, we would
A. not be able to reject the null hypothesis of equal population means.
B. reject the null hypothesis of equal population means.
C. reject or fail to reject depending on the value of the t statistic.
D. not be able to decide whether or not to reject the null hypothesis due to insufficient
information.
When there is _______________ seasonal variation, the magnitude of the seasonal
swing does not depend on the level of the time series.
A. cyclical
B. constant
C. irregular
D. increasing
The _________ curve of an individual decision maker is a plot of their utilities versus
the profits.
A. utility
B. maximax

C. posterior
D. preposterior
A ____________ index is a weighted aggregate price index. It is accurate in its
calculation of periodic prices. However, when using this index, it is difficult to compare
the prices in different time periods.
A. Paasche
B. first-order autocorrelation
C. Laspeyres
D. cyclical (seasonal)
Given the regression model y = β0 + β1x1 + β2x2 + β3x12 + β4x22 + ε, if we wish to test
the significance of higher-order terms (x12and x22),which test would we use?
A. overall F test
B. Durbin-Watson test
C. partial F test
D. t test
E. Cook’s distance measure

Which percentile describes the first quartile, Q1?
A. 25th
B. 50th
C. 75th
D. 100th
It is very common for television series to draw a large audience for special events or for
cliff-hanging story lines. Suppose that on one of these occasions, the special show drew
viewers from 38.2 percent of all US TV households. Suppose that three TV households
are randomly selected.
What is the probability that all three households viewed this special show?
A. 0.382
B. 0.127
C. 0.146
D. 0.726
E. 0.056

A bank officer wishes to study how many customers write bad checks. To accomplish
this, the officer randomly selects a weekly sample of 100 checking accounts and records
the number that wrote bad checks. The numbers of customers who wrote bad checks in
20 consecutive weekly samples of 100 account holders are, respectively, 1, 4, 9, 0, 4, 6,
0, 3, 8, 5, 3, 5, 2, 9, 4, 4, 3, 6, 4, and 0. Find the LCL and UCL for the p chart.
A. [.0204, .0596]
B. [.034, .046]
C. [0, .0988]
D. [0, .171]
Unusual sources of process variation that can be attributed to specific reasons are called
____________ causes of variation.
A. common
B. assignable
C. usual
D. expected

If a time series exhibits increasing seasonal variation, one approach is to first use a(n)
______________ transformation that produces a transformed time series that exhibits
constant seasonal variation. Then, _________ variables can be used to model the time
series with constant seasonal variation.
A. autocorrelation, dummy
B. fractional power, dummy
C. fractional power, constant
D. autocorrelation, constant
In a Wilcoxon rank sum test, when two or more observations are equal, we assign to
each tied observation a rank equal to the _________ of the consecutive ranks.
A. average
B. median
C. sum
D. difference
A vitamin-water manufacturer wants to compare the effects on sales of three water
colors: green, blue, and red. Four regions are selected for the test, with the following
ANOVA results.

Source of Variation df SS MSE
Color 2 243.25 121.63
Region 3 354.00 118.00
Interaction 6 189.75
Error 12 129.00
Total 23 916.00
If there is no interaction effect, test the individual null hypotheses on the effect of each
factor on mean sales at α = .01.
The manager of a local specialty store is concerned with a possible slowdown in
payments by her customers. She measures the rate of payment in terms of the average
number of days receivables are outstanding. Generally, the store has maintained an
average of 50 days with a standard deviation of 10 days. A random sample of 25
accounts gives an average of 54 days outstanding with a standard deviation of 8 days.
Calculate the appropriate test statistic to apply the critical value rule.
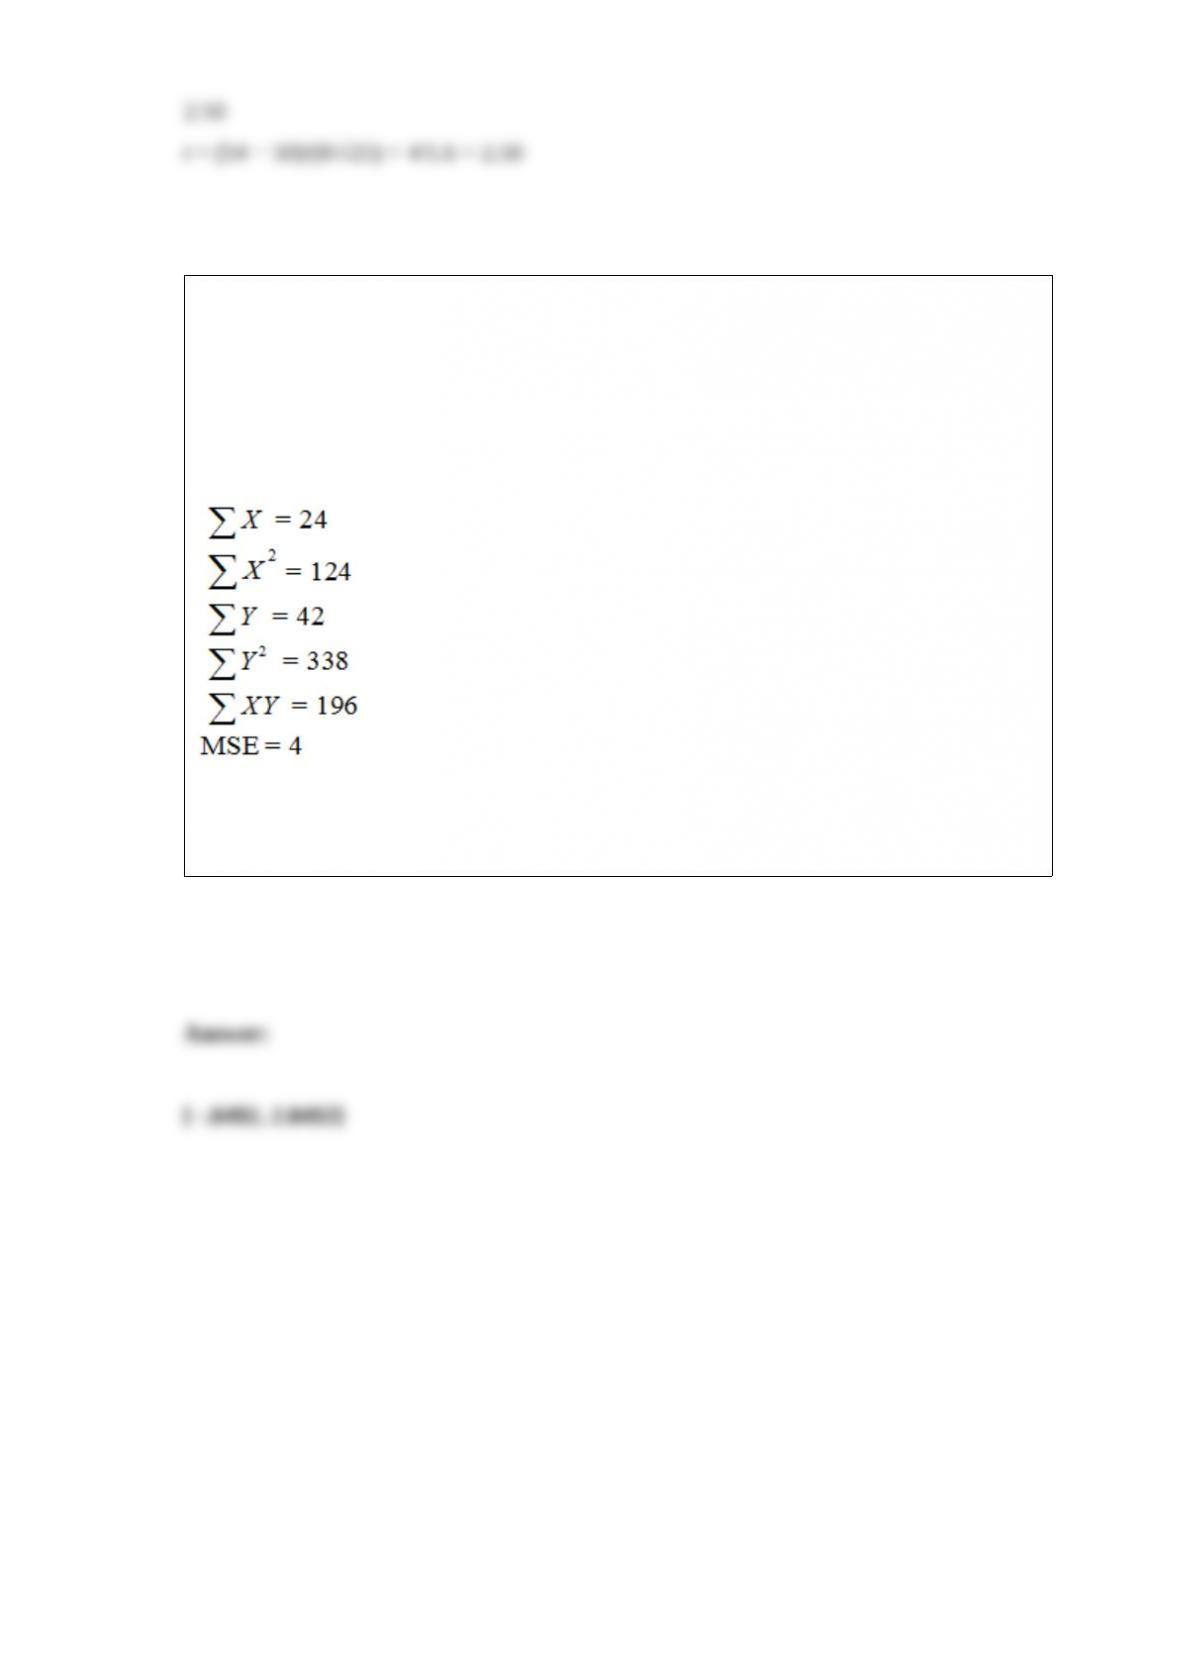
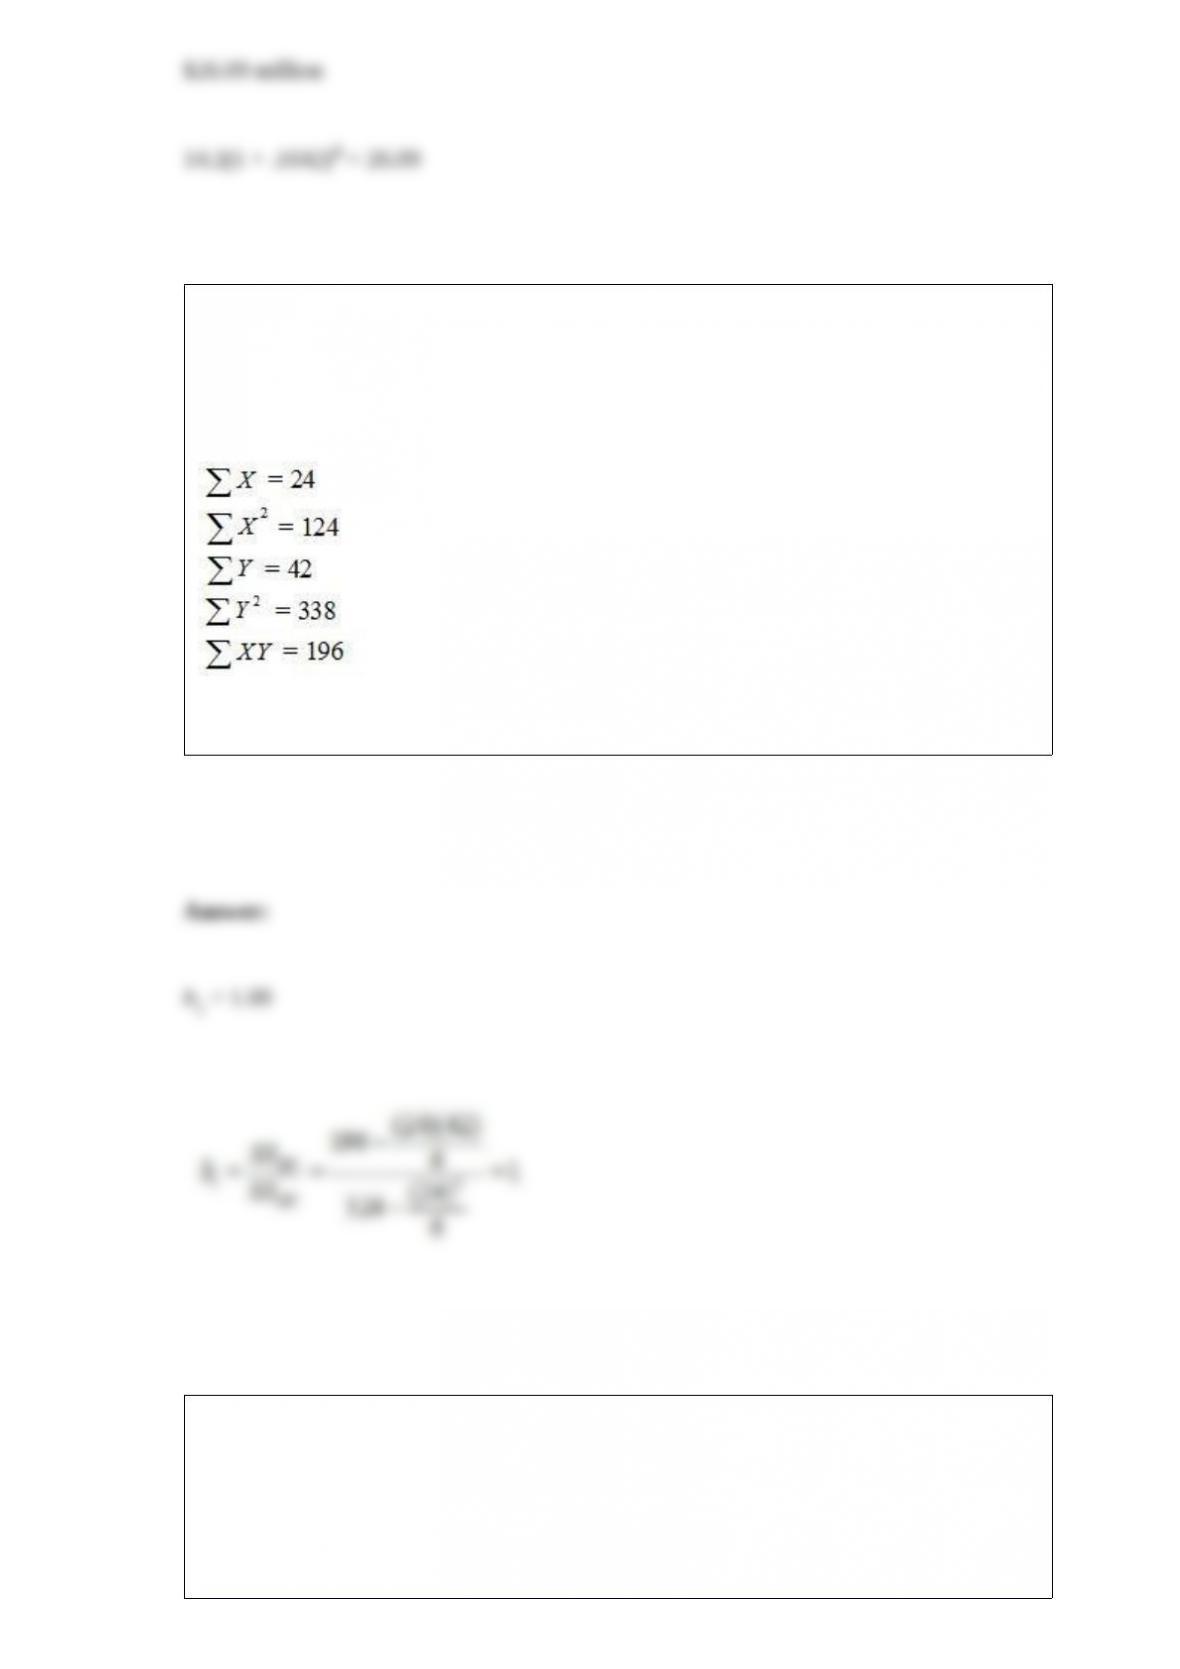
A local tire dealer wants to predict the number of tires sold each month. He believes
that the number of tires sold is a linear function of the amount of money invested in
advertising. He randomly selects 6 months of data consisting of tire sales (in thousands
of tires) and advertising expenditures (in thousands of dollars). Based on the data set
with 6 observations, the simple linear regression equation of the least squares line is ŷ =
3 + 1x.
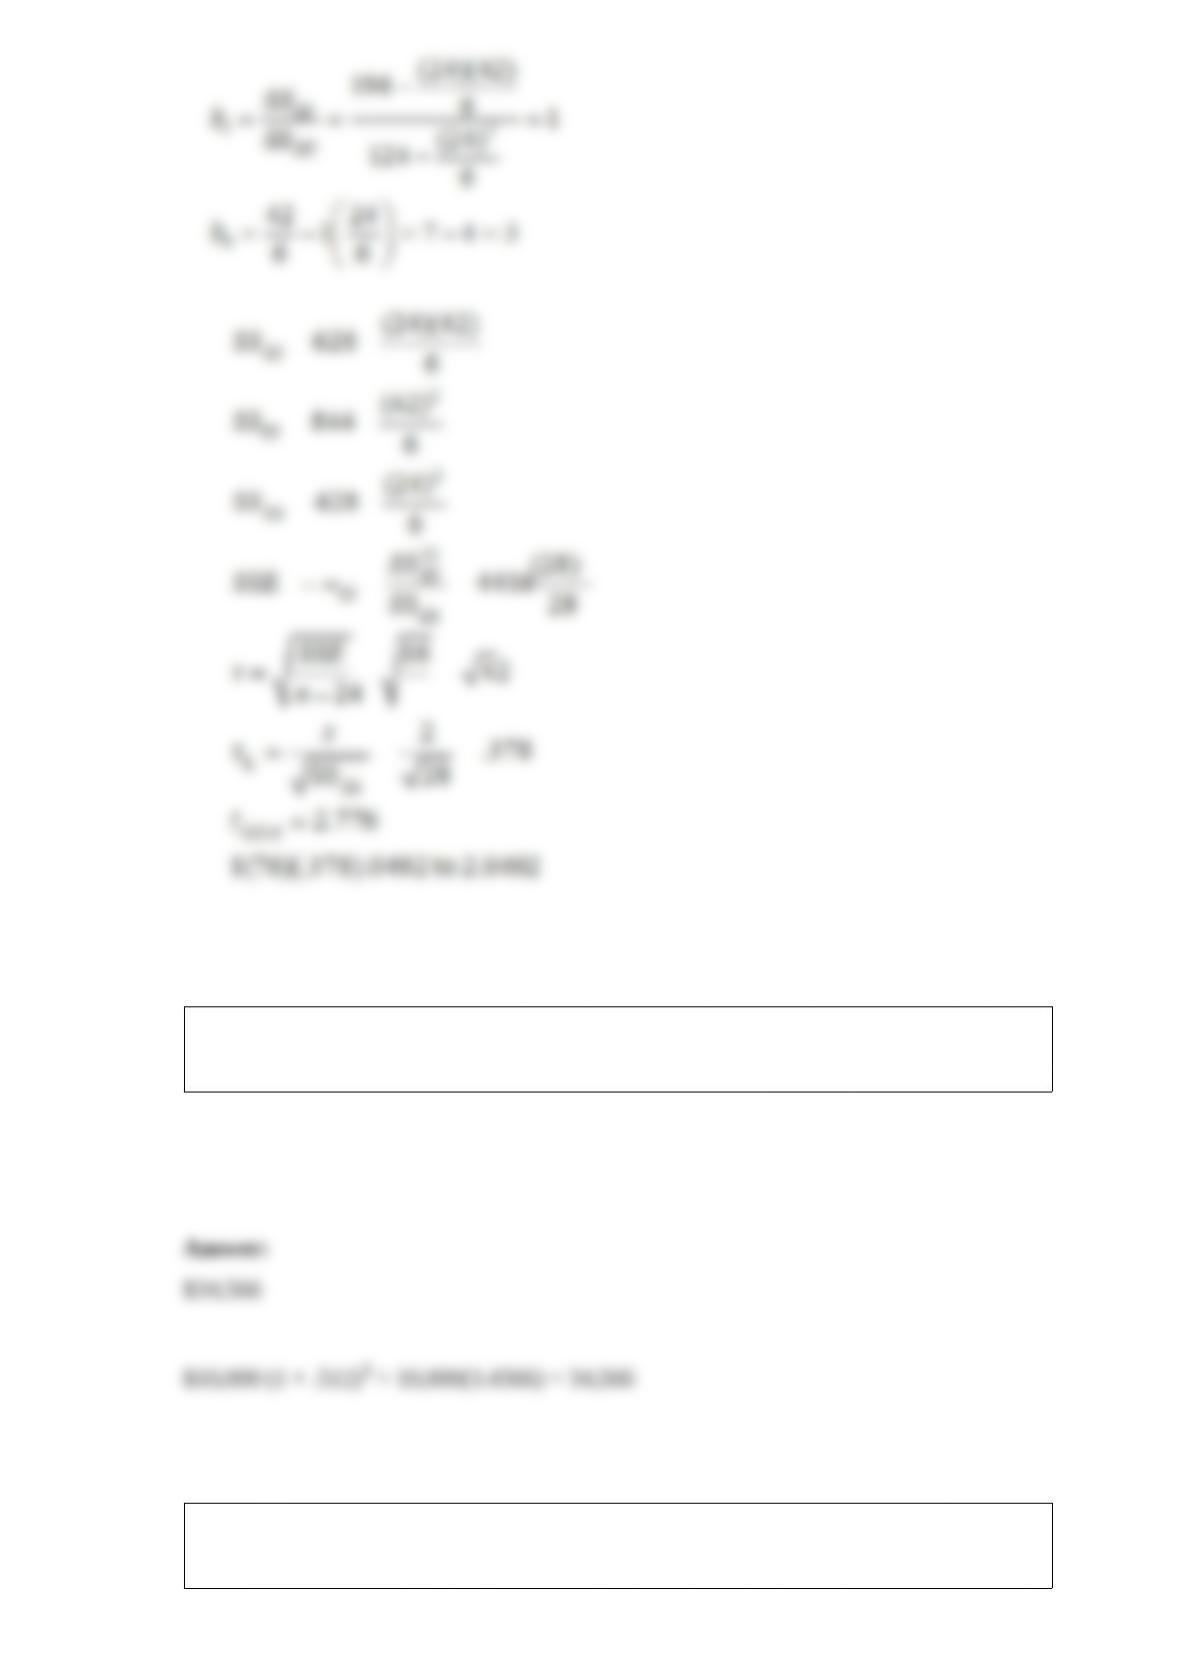
Using the sums of the squares given above, determine the 95 percent confidence
interval for the slope.
An initial investment of $10,000 is observed over 3 years with a geometric mean return
at the end of year 3 of 0.512. Determine the value of the investment after 3 years.
Alternatives 1 and 2 in the following payoff table represent the two possible
manufacturing strategies that the EKA manufacturing company can adopt. The level of
demand affects the success of both strategies. The states of nature (SI) represent the
levels of demand for the company products. s1, s2, and s3 characterize high, medium,
and low demand, respectively. The payoff values are in thousands of dollars.
The management believes that weather conditions significantly affect the level of
demand. 48 monthly sales reports are randomly selected. These monthly sales reports
show 15 months with high demand, 28 months with medium demand, and 5 months
with low demand. 12 of the 15 months with high demand had favorable weather
conditions. 14 of the 28 months with medium demand had favorable weather
conditions. Only 1 of the 5 months with low demand had favorable weather conditions.
What is the probability that weather conditions are poor, given that the demand is high?
What is the probability that weather conditions are poor, given that the demand is
medium? What is the probability that weather conditions are poor, given that the
demand is low?
Let p1 represent the population proportion of U.S. senatorial and congressional (House
of Representatives) Democrats who are in favor of a new modest tax on junk food. Let
p2 represent the population proportion of U.S. senatorial and congressional Republicans
who are in favor of a new modest tax on junk food. Out of the 265 Democratic senators
and members of Congress, 106 of them are in favor of a junk food tax. Out of the 285
Republican senators and members of Congress, only 57 are in favor of a junk food tax.
Find a 95 percent confidence interval for the difference between proportions l and 2.
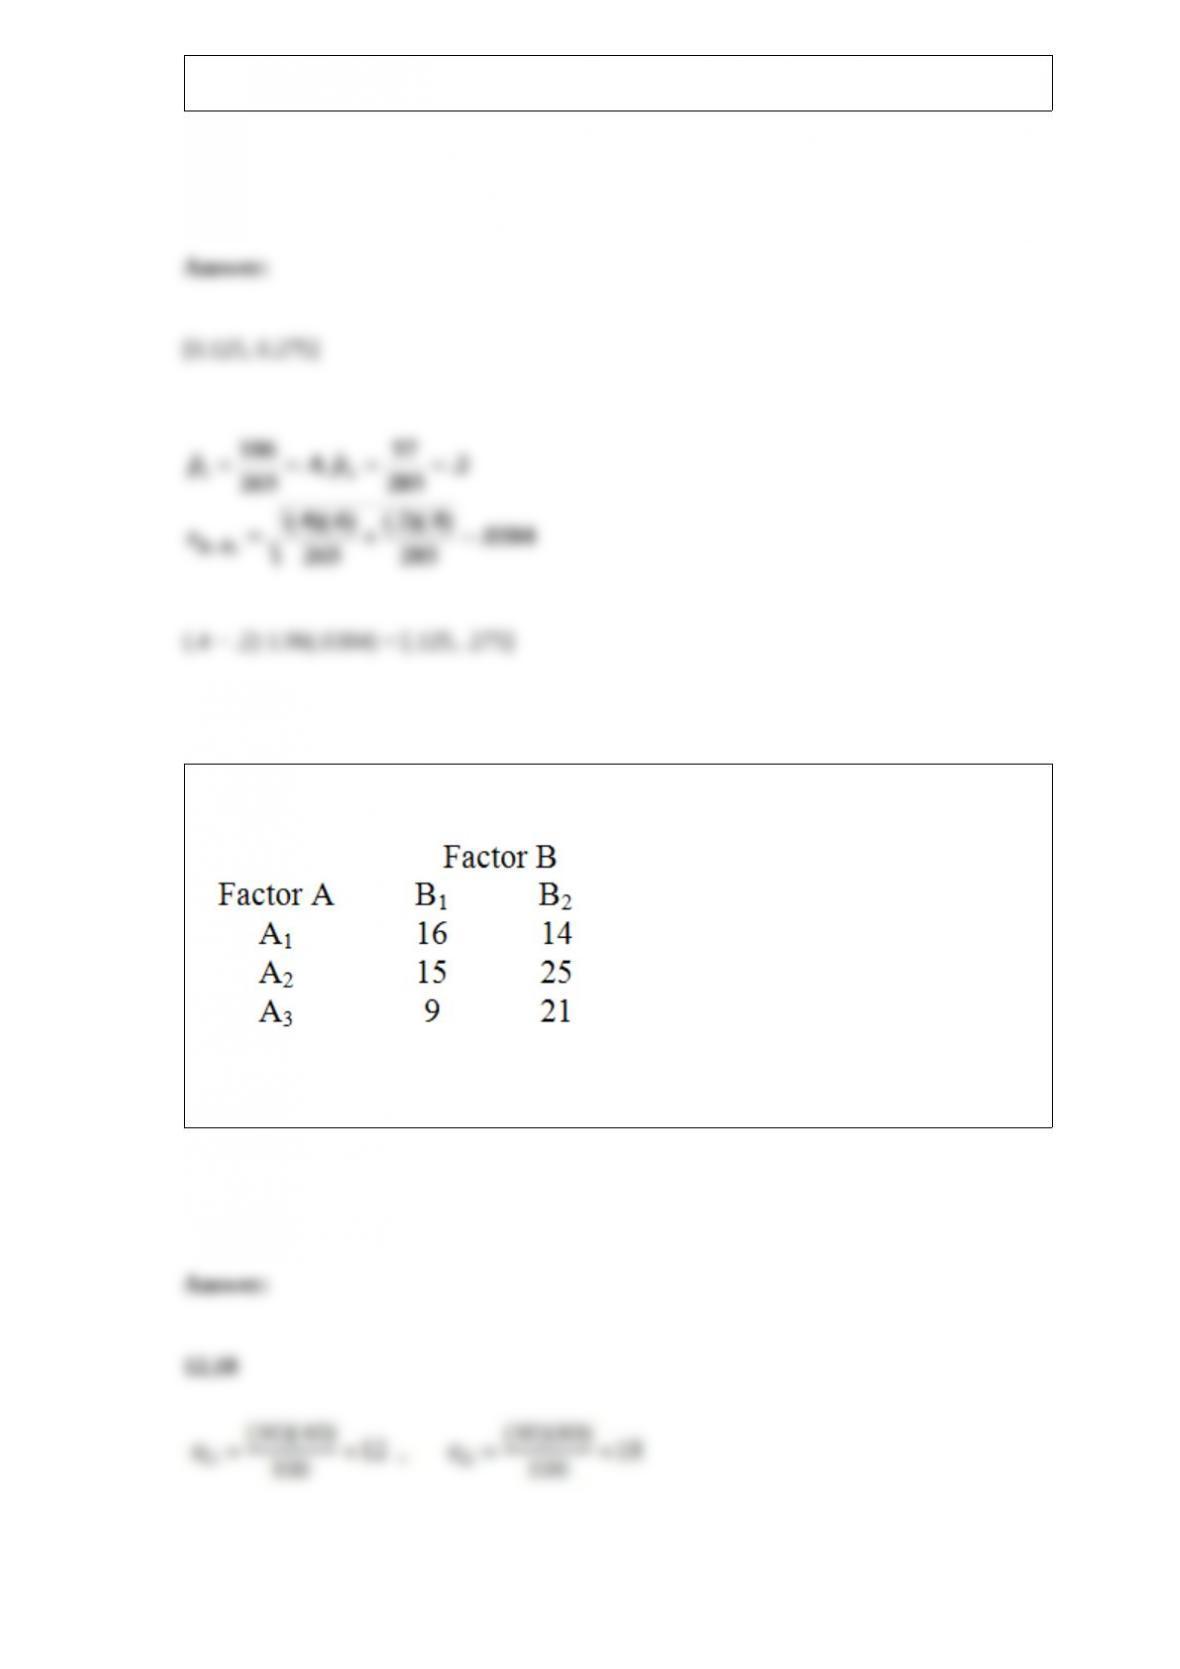
Consider the 3 x 2 contingency table below.
Compute the expected frequencies in row 3.
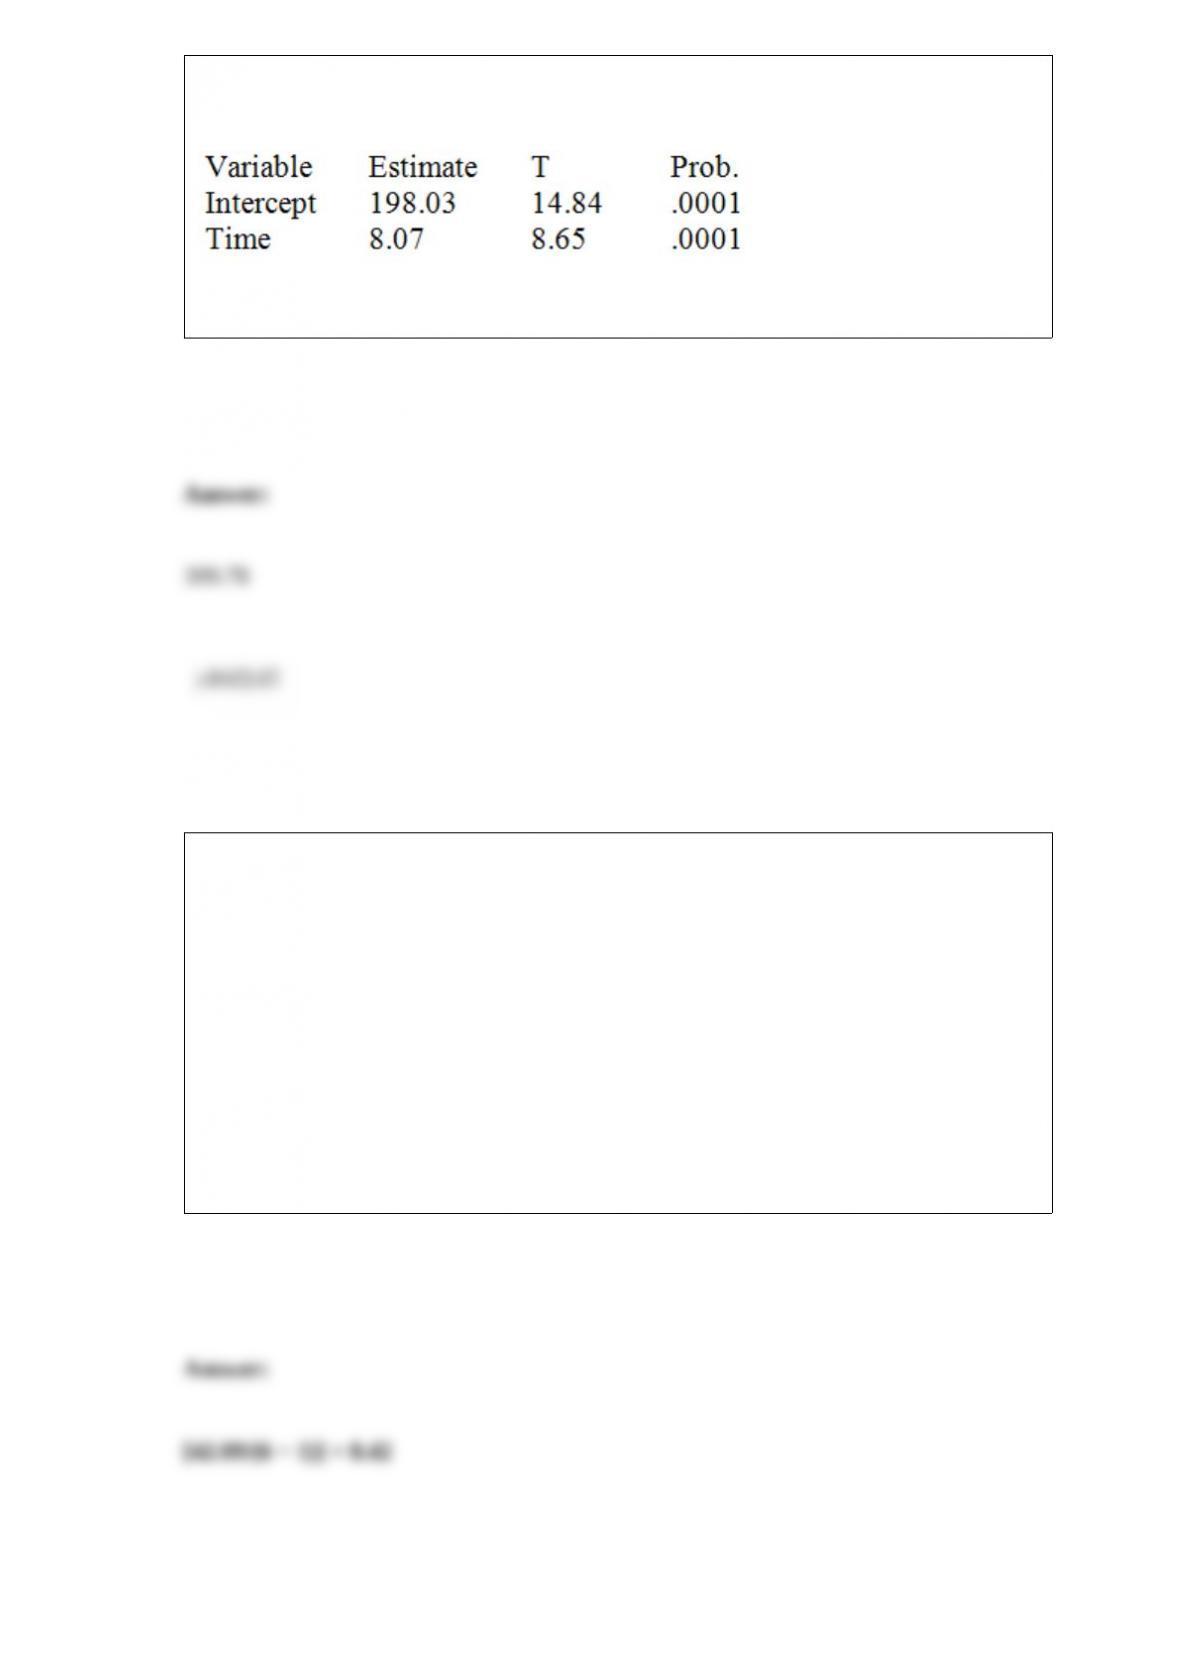
The linear regression trend model was applied to a time series sales data set based on
the last 24 months’ sales. The following partial computer output was obtained.
What is the predicted value of y when t = 25?
Consider the following partial analysis of variance table from a randomized block
design with 6 blocks and 4 treatments.
Source Sum of Squares
Treatments 15.93
Blocks 42.09
Error 23.84
Total 81.86
What is the block mean square?
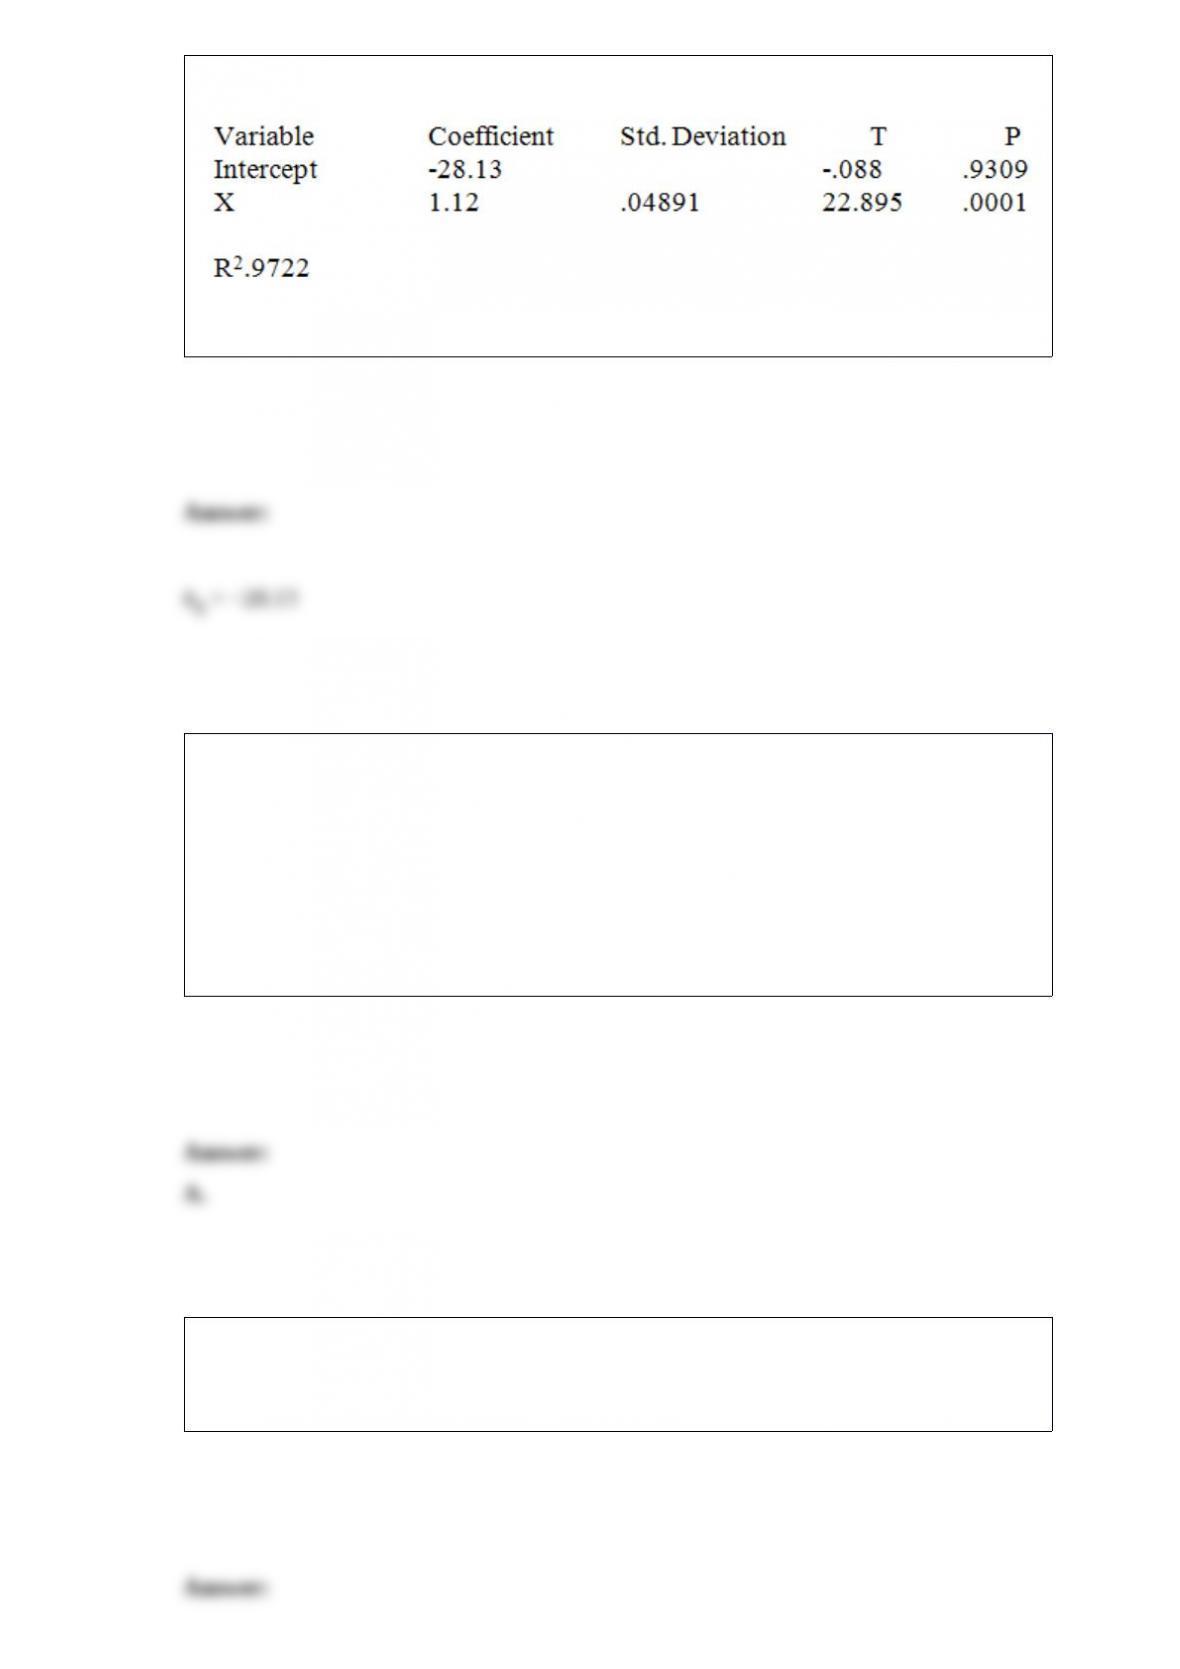
Consider the following partial computer output from a simple linear regression analysis.
What is the estimated y-intercept?
Consider a standard deck of 52 playing cards, a randomly selected card from the deck,
and the following events: R = red, B = black, A = ace, N = nine, D = diamond, and C =
club.
Are A and N mutually exclusive?
A. Yes, mutually exclusive.
B. No, not mutually exclusive.
The geometric mean growth rate of sales for used cars in a geographic area from 2005
to 2009 was 16.42 percent. Annual sales in 2005 were $14.2 million. Find the ending
value of sales after this four-year period.
A local tire dealer wants to predict the number of tires sold each month. He believes
that the number of tires sold is a linear function of the amount of money invested in
advertising. He randomly selects 6 months of data consisting of tire sales (in thousands
of tires) and advertising expenditures (in thousands of dollars). Based on the data set
with 6 observations, the simple linear regression model yielded the following results.
Find the estimated slope.
A U.S.-based company offers an online proficiency course in basic accounting.
Completing this online course satisfies the Fundamentals of Accounting course
requirement in many MBA programs. In the first semester, 315 students have enrolled
in the course. The marketing research manager divided the country into seven regions
of approximately equal population. The course enrollment values for each of the seven
regions are given below. The management wants to know if there is equal interest in the
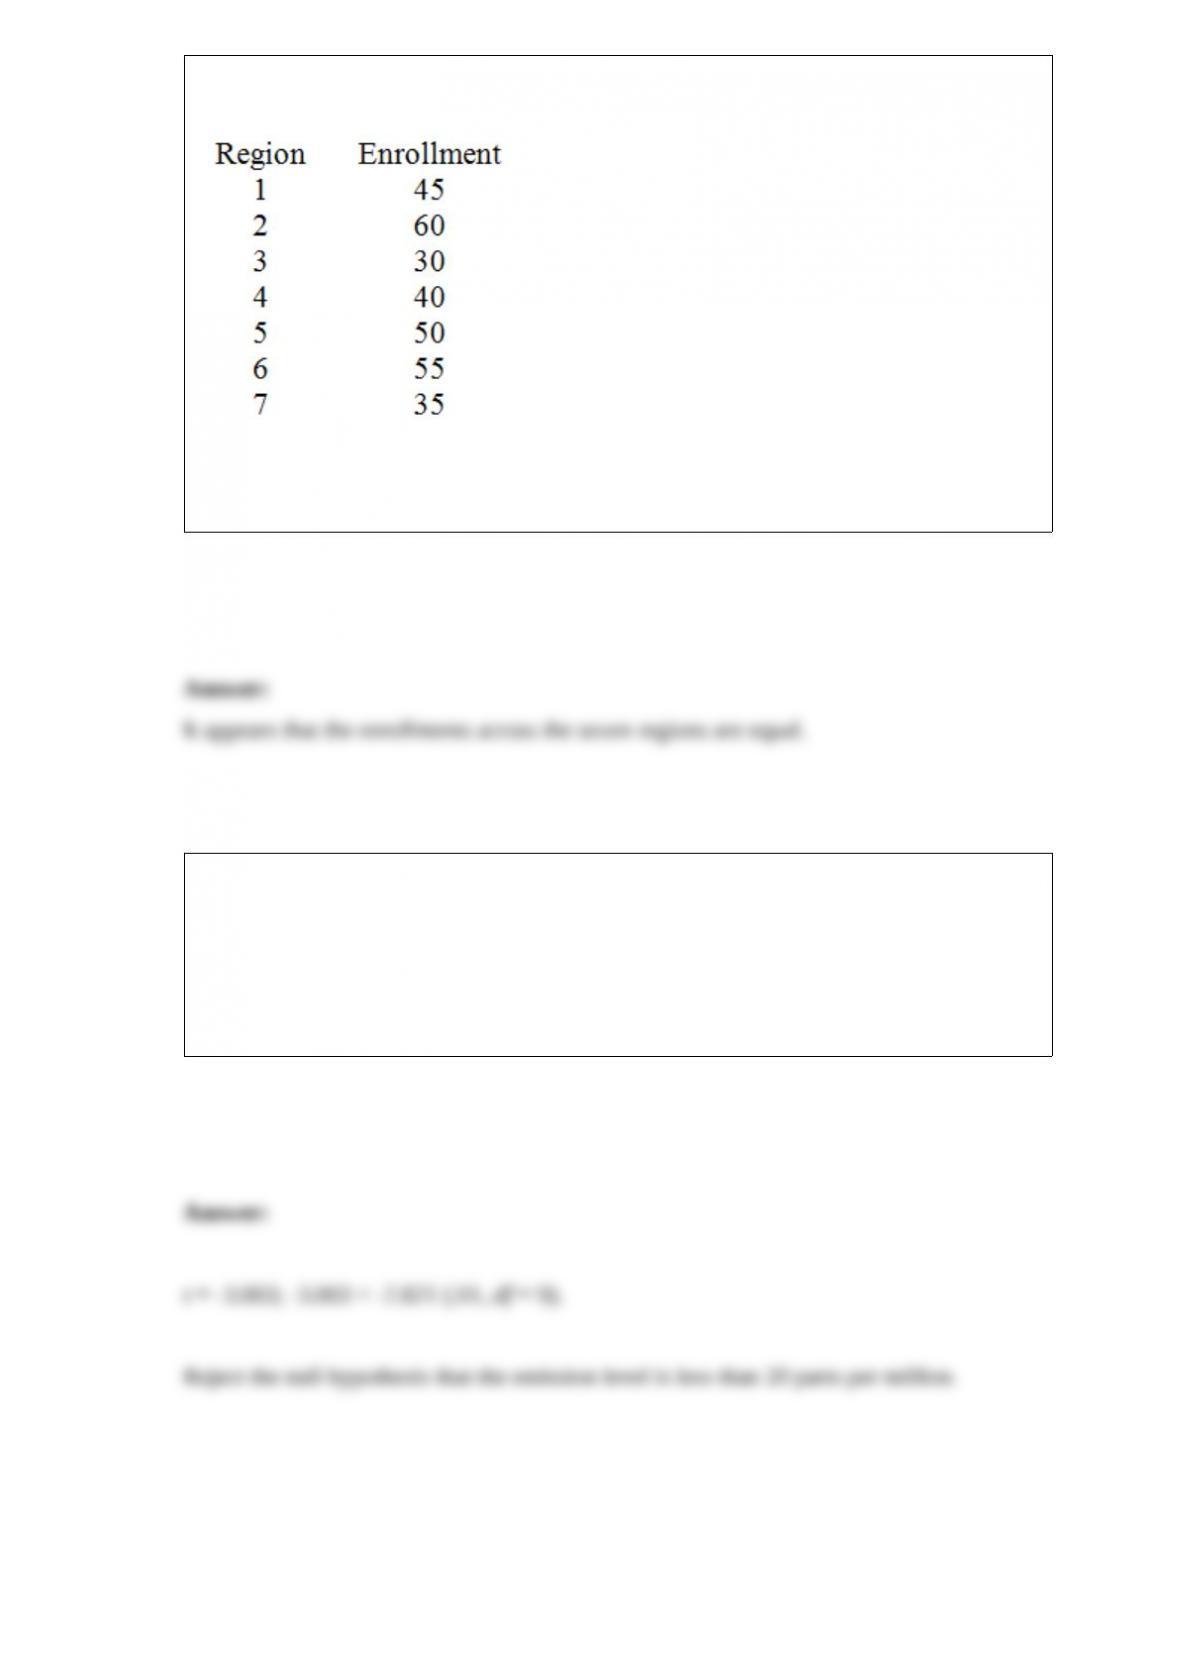
course across all regions.
Assume that H0: p1 = p2 = p3 = p4 = p5 = p6 = p7 is not rejected, and state a
one-sentence managerial conclusion.
A major car manufacturer wants to test a new catalytic converter to determine whether
it meets new air pollution standards. The mean emission of all converters of this type
must be less than 20 parts per million of carbon monoxide. Ten (10) converters are
manufactured for testing purposes and their emission levels are measured, with a mean
of 17.17 and a standard deviation of 2.98. Test the hypotheses at α = .01 using the
critical value rule.