
A qualitative variable which represents categories such as geographical territories or job
classifications may be included in a regression model by using indicator or dummy
variables.
The alternative hypothesis for the Friedman test is that at least one treatment is different
from at least one other treatment.
The Tukey-Kramer procedure allows us to simultaneously examine all pairs of
population means after the ANOVA test has been completed without increasing the true
level.α

If the populations are normally distributed and the variances of the two populations are
not equal, it is appropriate to use the “unpooled” formula to determine the t-statistic for
the hypothesis test of the difference in the two population means.
When only ordinal-level data are available, Spearman’s rank correlation rather than the
Pearson product-moment correlation coefficient must be used to analyze the association
between two variables.
A chi-square goodness-of-fit test to determine if the observed frequencies in seven
categories are uniformly distributed has six degrees of freedom.
If two or more independent variables are highly correlated, the regression analysis

might suffer from the problem of singular collinearity.
For large datasets, the mean error (ME) and mean absolute deviation (MAD) always
have the same numerical value.
If the populations are normally distributed and the variances of the two populations are
equal, it is appropriate to use the “pooled” formula to determine the t-statistic for the
hypothesis test of the difference in the two population means.
In a set of matched samples, each data value in one sample is related to or matched with
a corresponding data value in the other sample.

In some situations, sampling may be the only option because the population is
inaccessible.
Two popular general categories of smoothing techniques are exponential models and
logarithmic models.
A histogram can be described as a type of vertical bar chart.

Interaction effects in a factorial design can be analyzed in randomized block design.
When testing for the difference between two population proportions we use the pooled
estimate of the proportion.
The value of sample information is the ratio of the expected monetary value with
information to the expected monetary value without information.
If the population is normally distributed, the sample means of size n=5 are normally
distributed.
The sampling distribution of the sample means is less variable than the population
distribution.
The number of successes in a hypergeometric distribution is unknown
A major limitation of nonrandom samples is that they are not appropriate for most
statistical methods.

A disadvantage of nonparametric statistics is that the probability statements obtained
from most nonparametric tests are not exact probabilities.
Increasing the sample size reduces the probability of committing a Type I and Type II
simultaneously.
Increasing the sample size causes the numerical value of standard error of the sample
means to increase.
Two general types of control charts are (1) control charts for measurements and (2)
control charts for compliance items.
A t-distribution is similar to a normal distribution, but with flatter tails.
The regression model y =
0+
1x1+
2x2+
3x3+
is a third order model.
If two events are mutually exclusive, then their joint probability is always zero.

Quality control can be undertaken in two distinct ways: after-process control and
before-process control.
With interval-level data, the zero point is a matter of convention and does not mean the
absence of the phenomenon under observation.
The most appropriate measure of central tendency for nominal-level data is the median.
21. Autoregression is a multiple regression technique in which the independent
variables are time-lagged versions of the dependent variable.
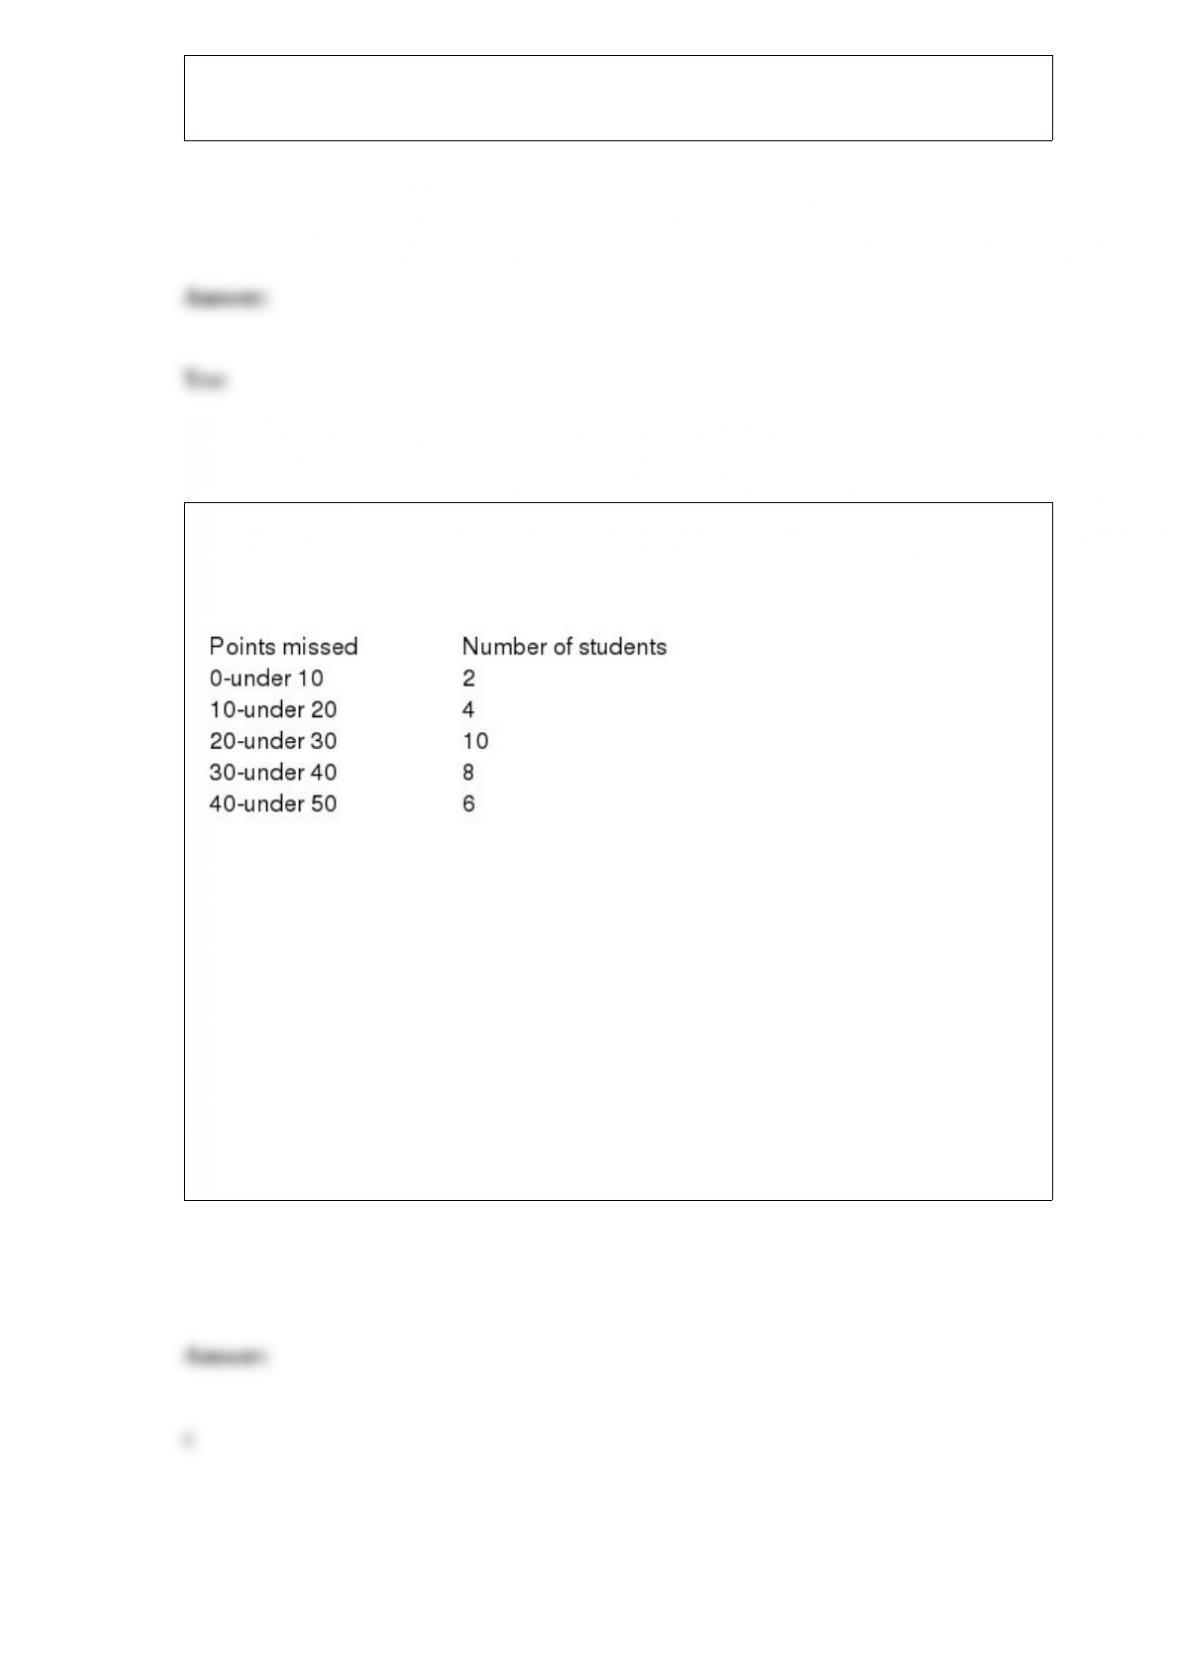
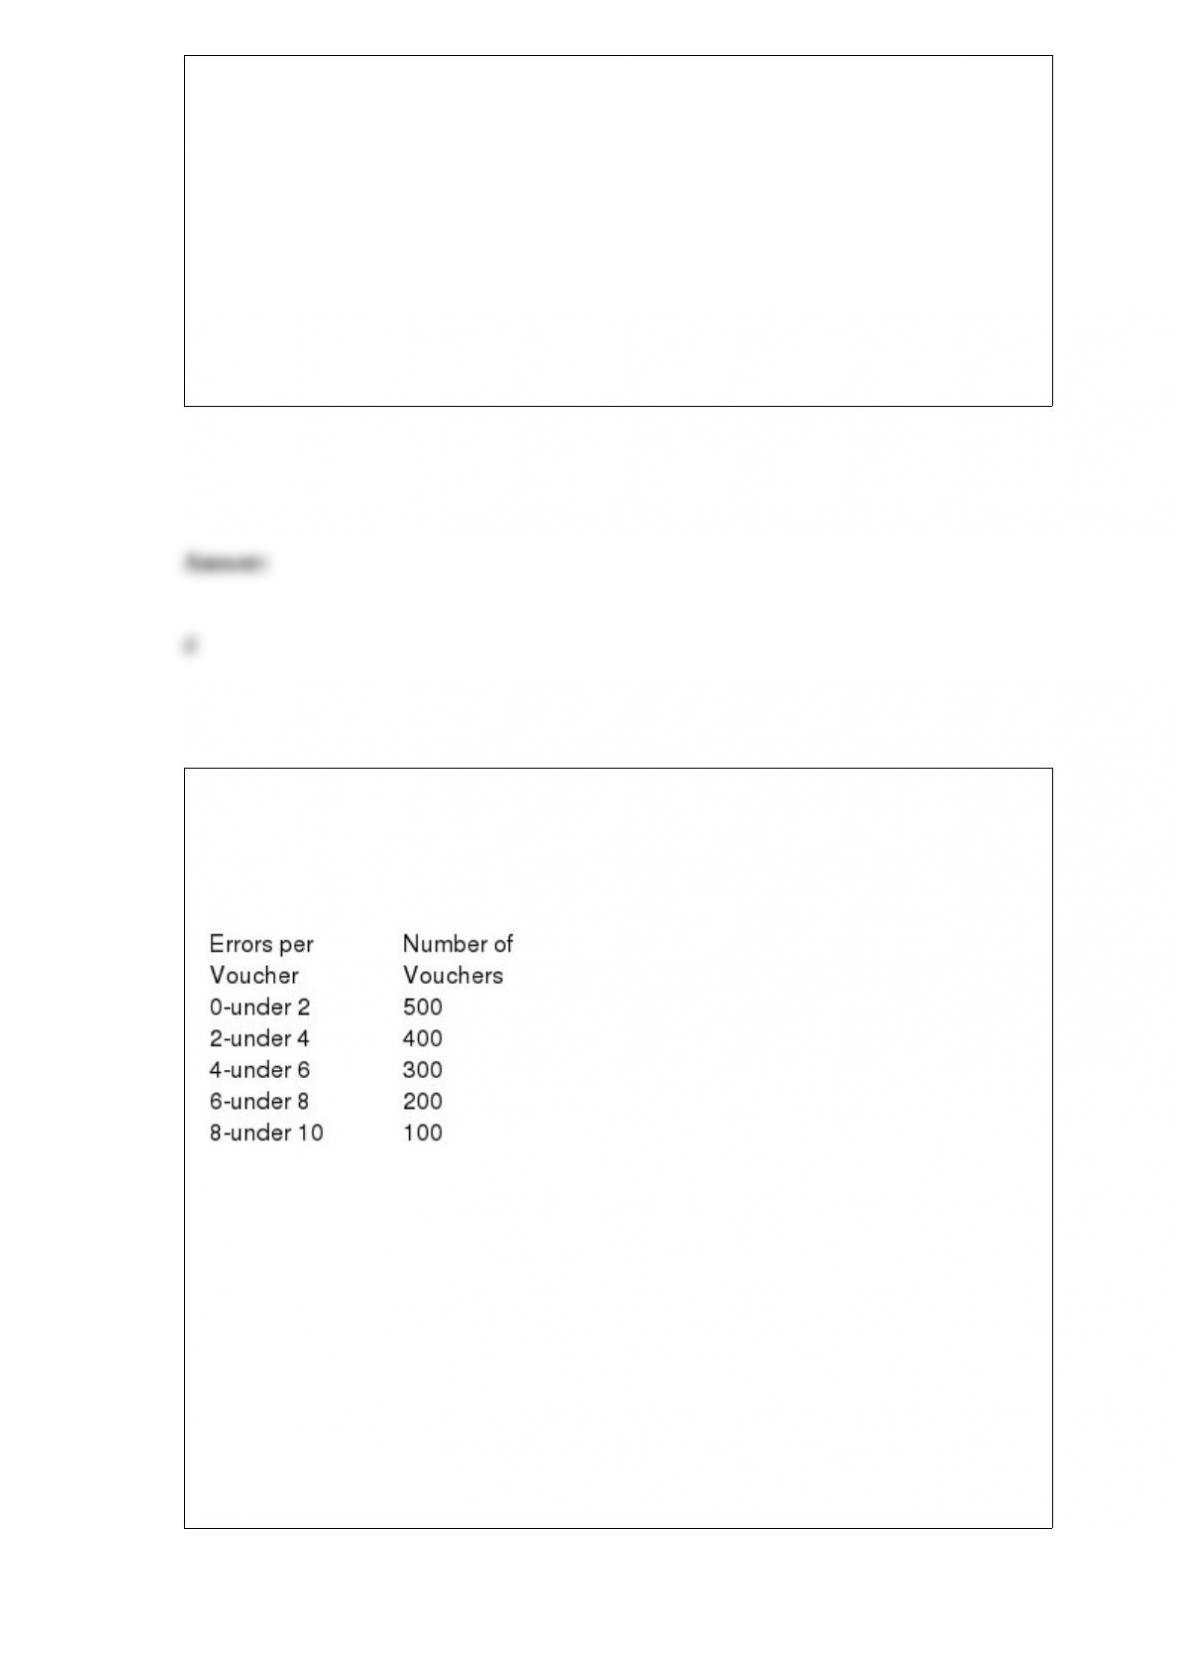
An instructor is evaluating the performance of students on a test. He records the number
of points that each student missed and created a frequency distribution. This is provided
below:
What is the variance for this population?
a) 11.43
b) 135.17
c) 130.67
d) 180.67
e) 198.07
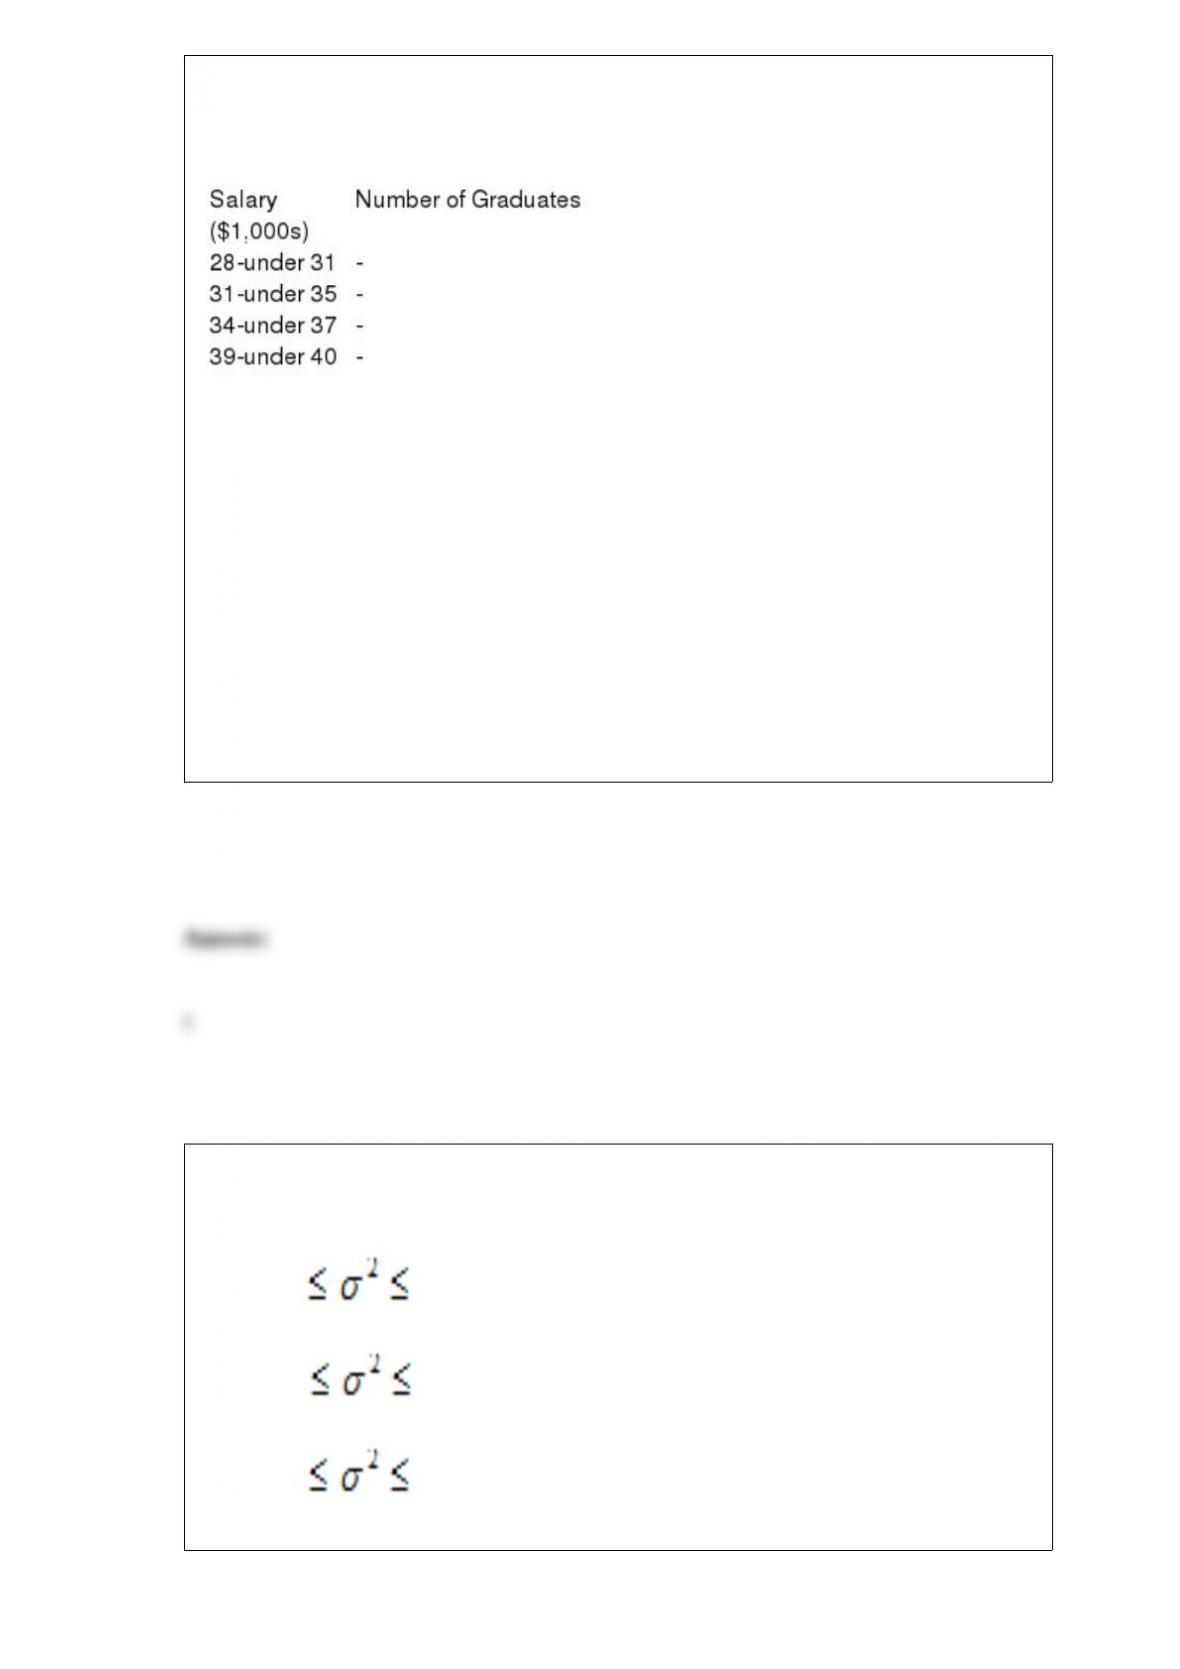
The following class intervals for a frequency distribution were developed to provide
information regarding the starting salaries for students graduating from a particular
school:
Before data was collected, someone questioned the validity of this arrangement. Which
of the following represents a problem with this set of intervals?
a) There are too many intervals.
b) The class widths are too small.
c) Some numbers between 28,000 and 40,000 would not fall into any of these intervals.
d) The first and the second interval overlap.
e) There are too few intervals.
Given n = 17, s2 = 18.56, and that the population is normally distributed, the 80%
confidence interval for the population variance is ________.
a) 11.4372 36.3848
b) 23.5418 9.31223
c) 12.6141 31.8892
d) 11.2929 37.2989
e) 14.2929 39.2989
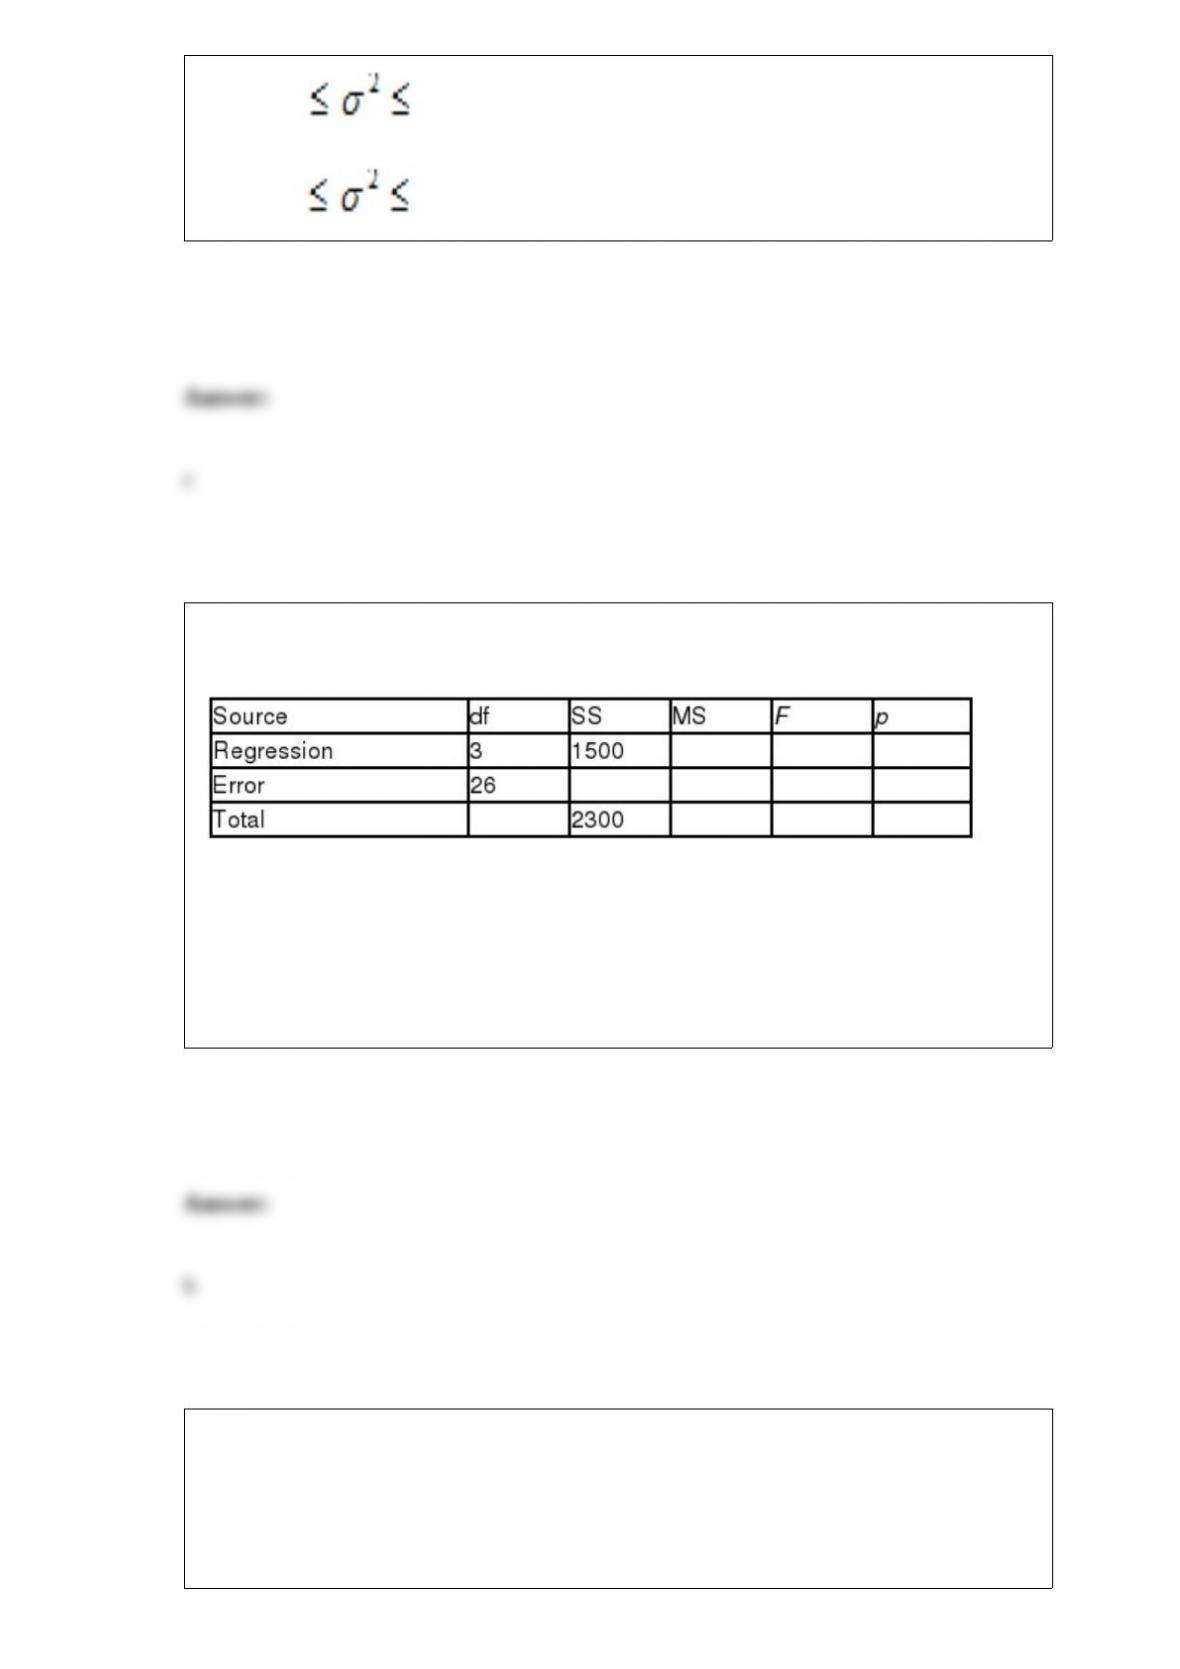
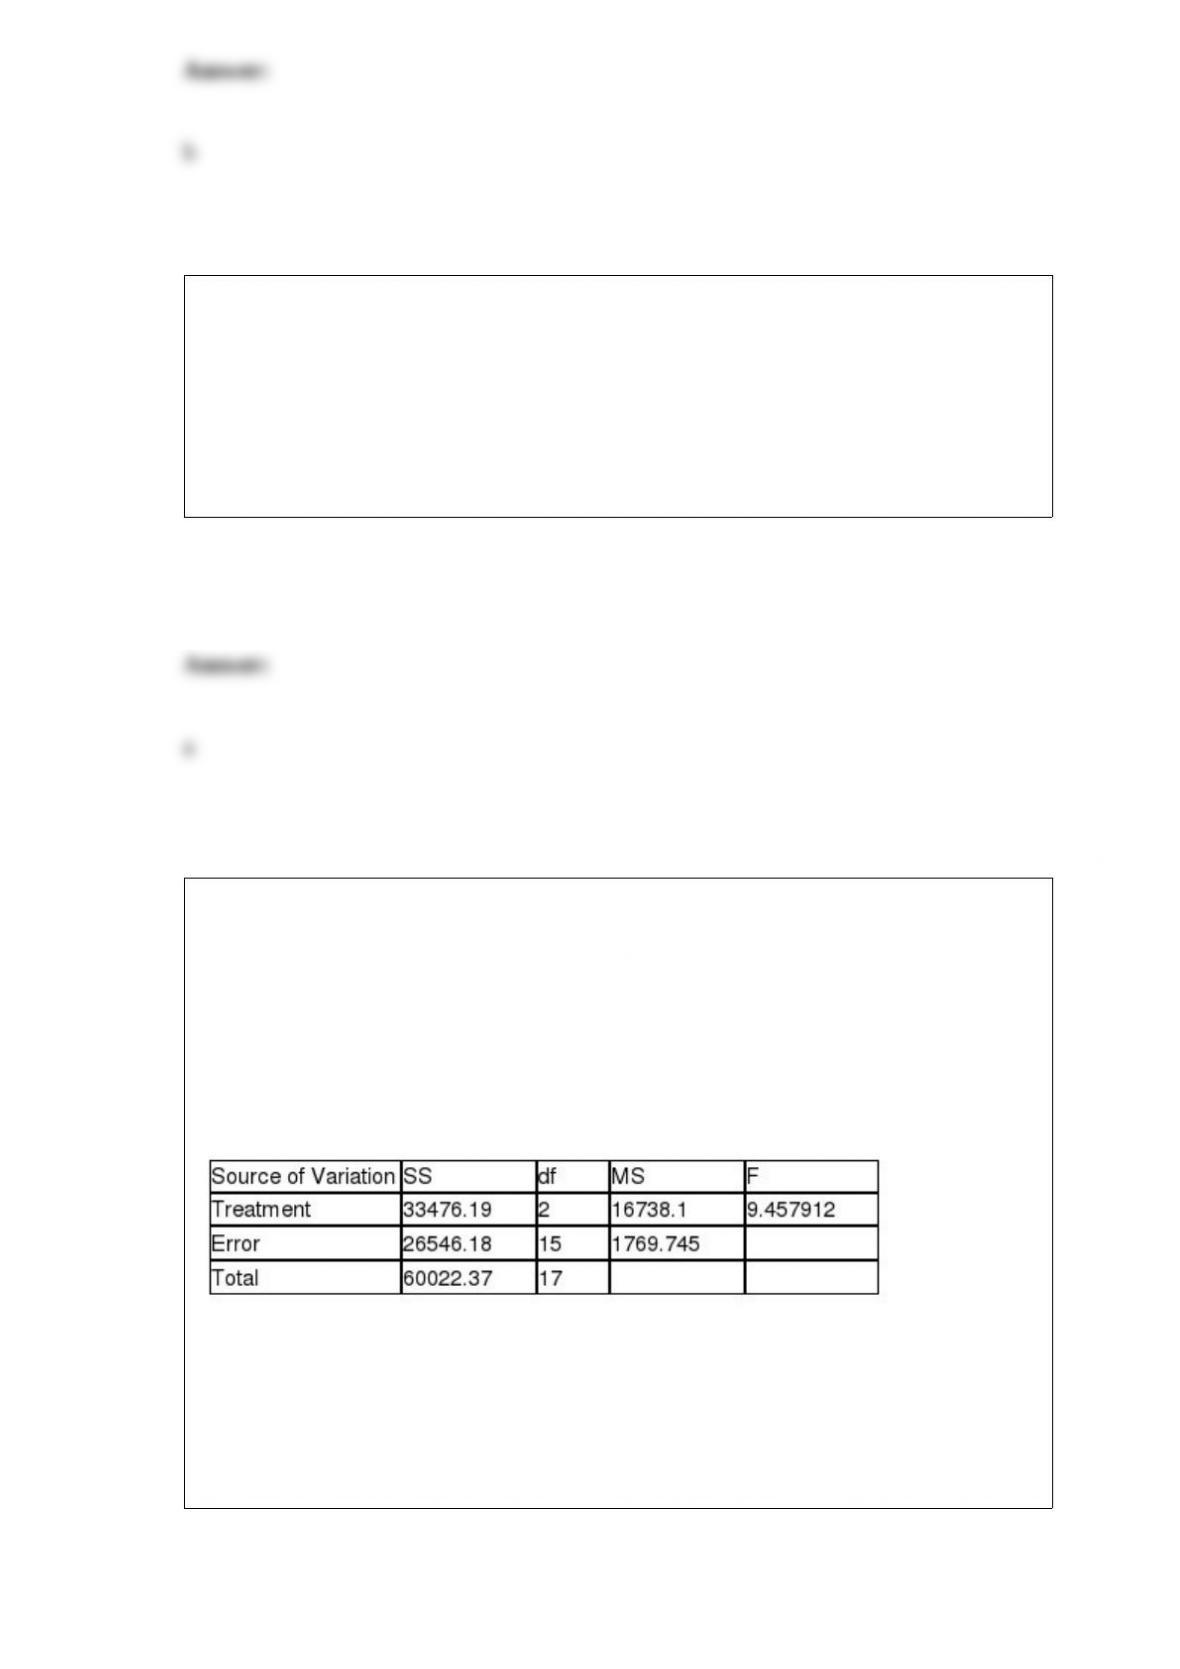
The following ANOVA table is from a multiple regression analysis.
The value of the standard error of the estimate seis __________.
a) 30.77
b) 5.55
c) 4.03
d) 3.20
e) 0.73
A Kruskal-Wallis test is to be performed. There will be five categories, and alpha is
chosen to be 0.01. The critical chi-square value is _______.
a) 15.086
b) 13.277

c) 7.779
d) 9.236
e) 8.987
Brian Vanecek, VP of Operations at Portland Trust Bank, is evaluating the service level
provided to walk-in customers. Accordingly, his staff recorded the waiting times for 64
randomly selected walk-in customers and determined that their mean waiting time was
15 minutes. Assume that the population standard deviation is 4 minutes. The 95%
confidence interval for the population mean of waiting times is ________.
a) 14.02 to 15.98
b) 7.16 to 22.84
c) 14.06 to 15.94
d) 8.42 to 21.58
e) 19.80 to 23.65
Which types of data are normally used with nonparametric statistics?
a) Interval or ratio level data
b) Ordinal or nominal level data
c) Nominal or ratio level data
d) Ratio or ordinal level data
e) Relative or ratio level data
Golf course designer Roberto Langabeer is evaluating two sites, Palmetto Dunes and
Ocean Greens, for his next golf course. He wants to prove that Palmetto Dunes
residents (population 1) play golf more often than Ocean Greens residents (population
2). Roberto commissions a market survey to test this hypothesis. The market researcher
used a random sample of 64 individuals from each suburb, and reported the following:
1= 15 times per month and 2= 14 times per month. Assume that
1= 2 and 2= 3. With a= .01, the appropriate decision is
_________________.
a) reject the null hypothesis 1
2< 2
2
b) accept the alternate hypothesis 1– m2> 0
c) reject the alternate hypothesis n1= n2= 64
d) fail to reject the null hypothesis 1– 2= 0
e) do nothing

A cancer research group surveys 100 women more than 40 years old to test the
hypothesis that 50% of women in this age group have regularly scheduled
mammograms. Forty of the women respond affirmatively. Using a= 0.05, the observed
value of chi-square is __________.
a) 4.00
b) 2.00
c) 0.5
d) 3.71
e) 2.97
Cindy Ho, VP of Finance at Discrete Components, Inc. (DCI), theorizes that the
discount level offered to credit customers affects the average collection period on credit
sales. Accordingly, she has designed an experiment to test her theory using four sales
discount rates (0%, 2%, 4%, and 6%). First, she classified DCI’s credit customers into
three categories by total assets (small, medium, and large). Then, she randomly
assigned four customers from each category to a sales discount rate. In Cindy’s
experiment “average collection period” is ________.
a) a concomitant variable
b) the dependent variable
c) a treatment variable
d) a blocking variable
e) a constant
A student randomly guesses the answers to a five question true/false test. If there is a
50% chance of guessing correctly on each question, what is the probability that the
student misses exactly 1 question?
a) 0.200
b) 0.031
c) 0.156
d) 0.073
e) 0.001
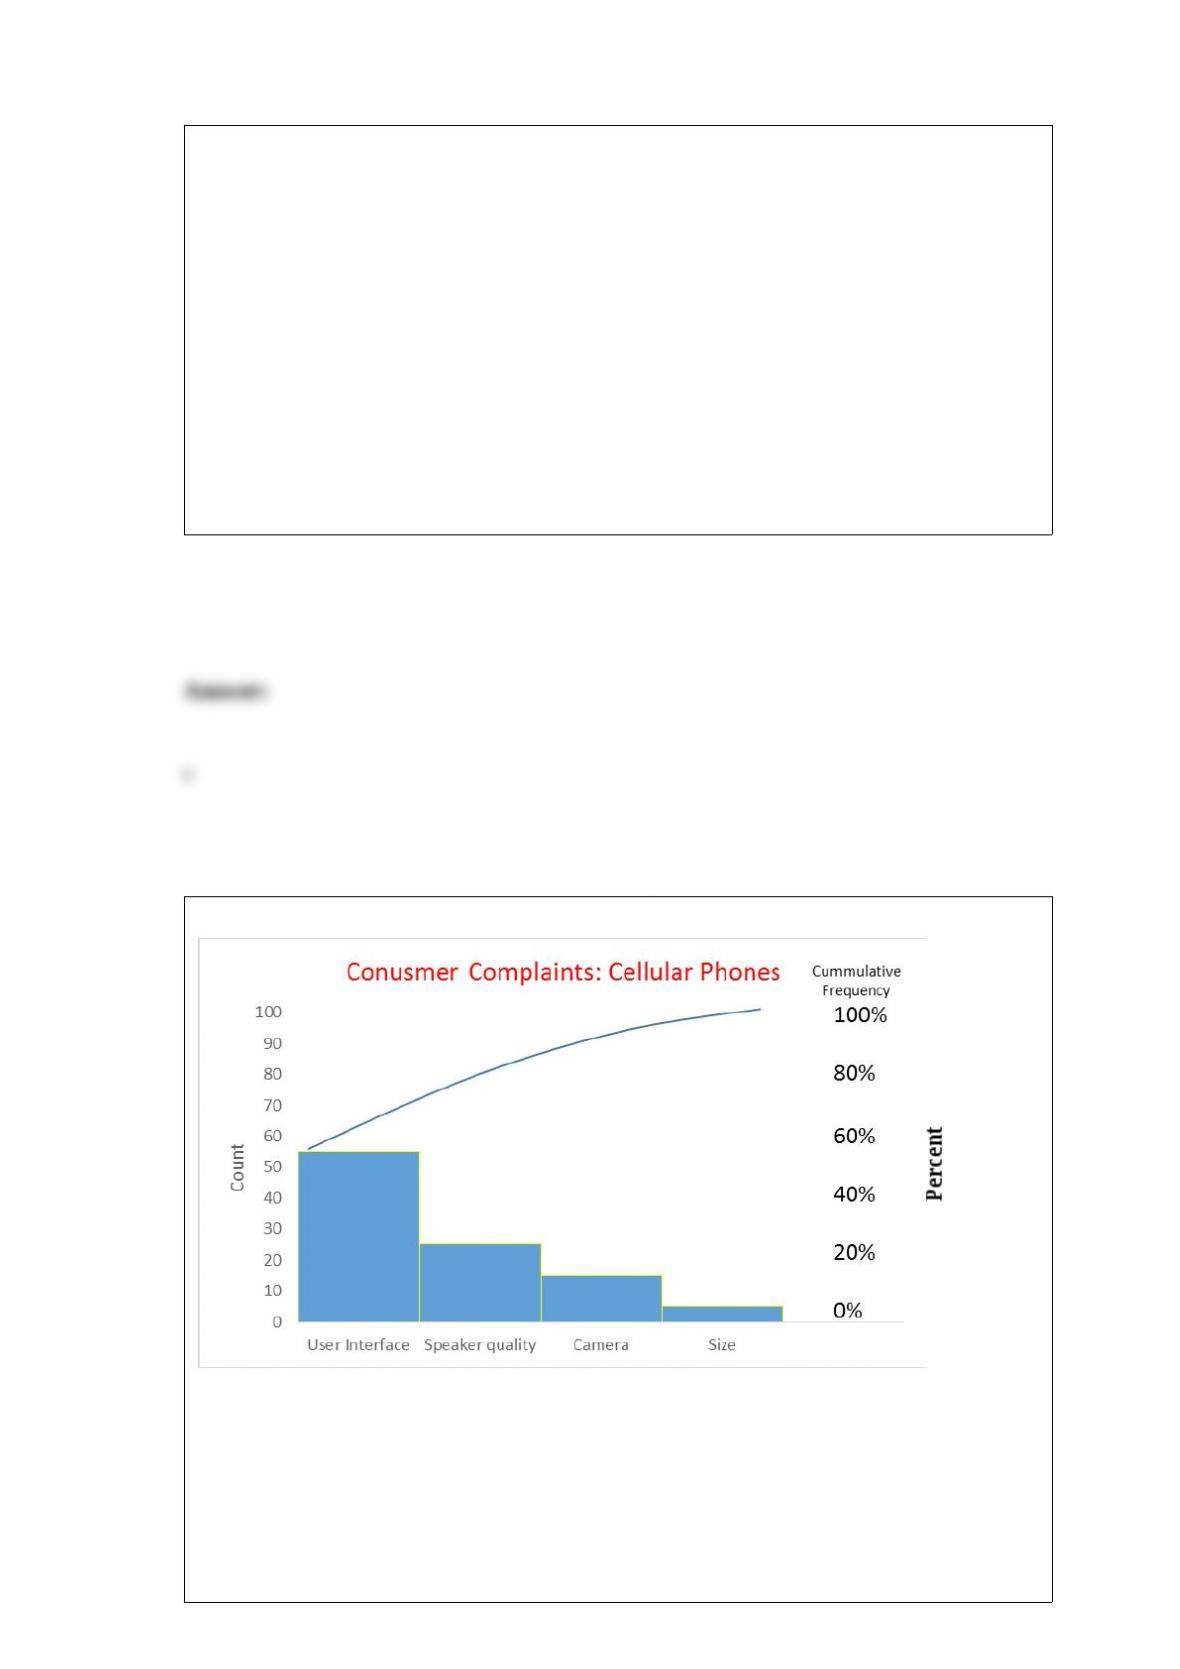
According to the following Pareto chart, the most common complaint was ______.
a)
user interface
b) speaker quality
c) camera
d) size
e) all of the above
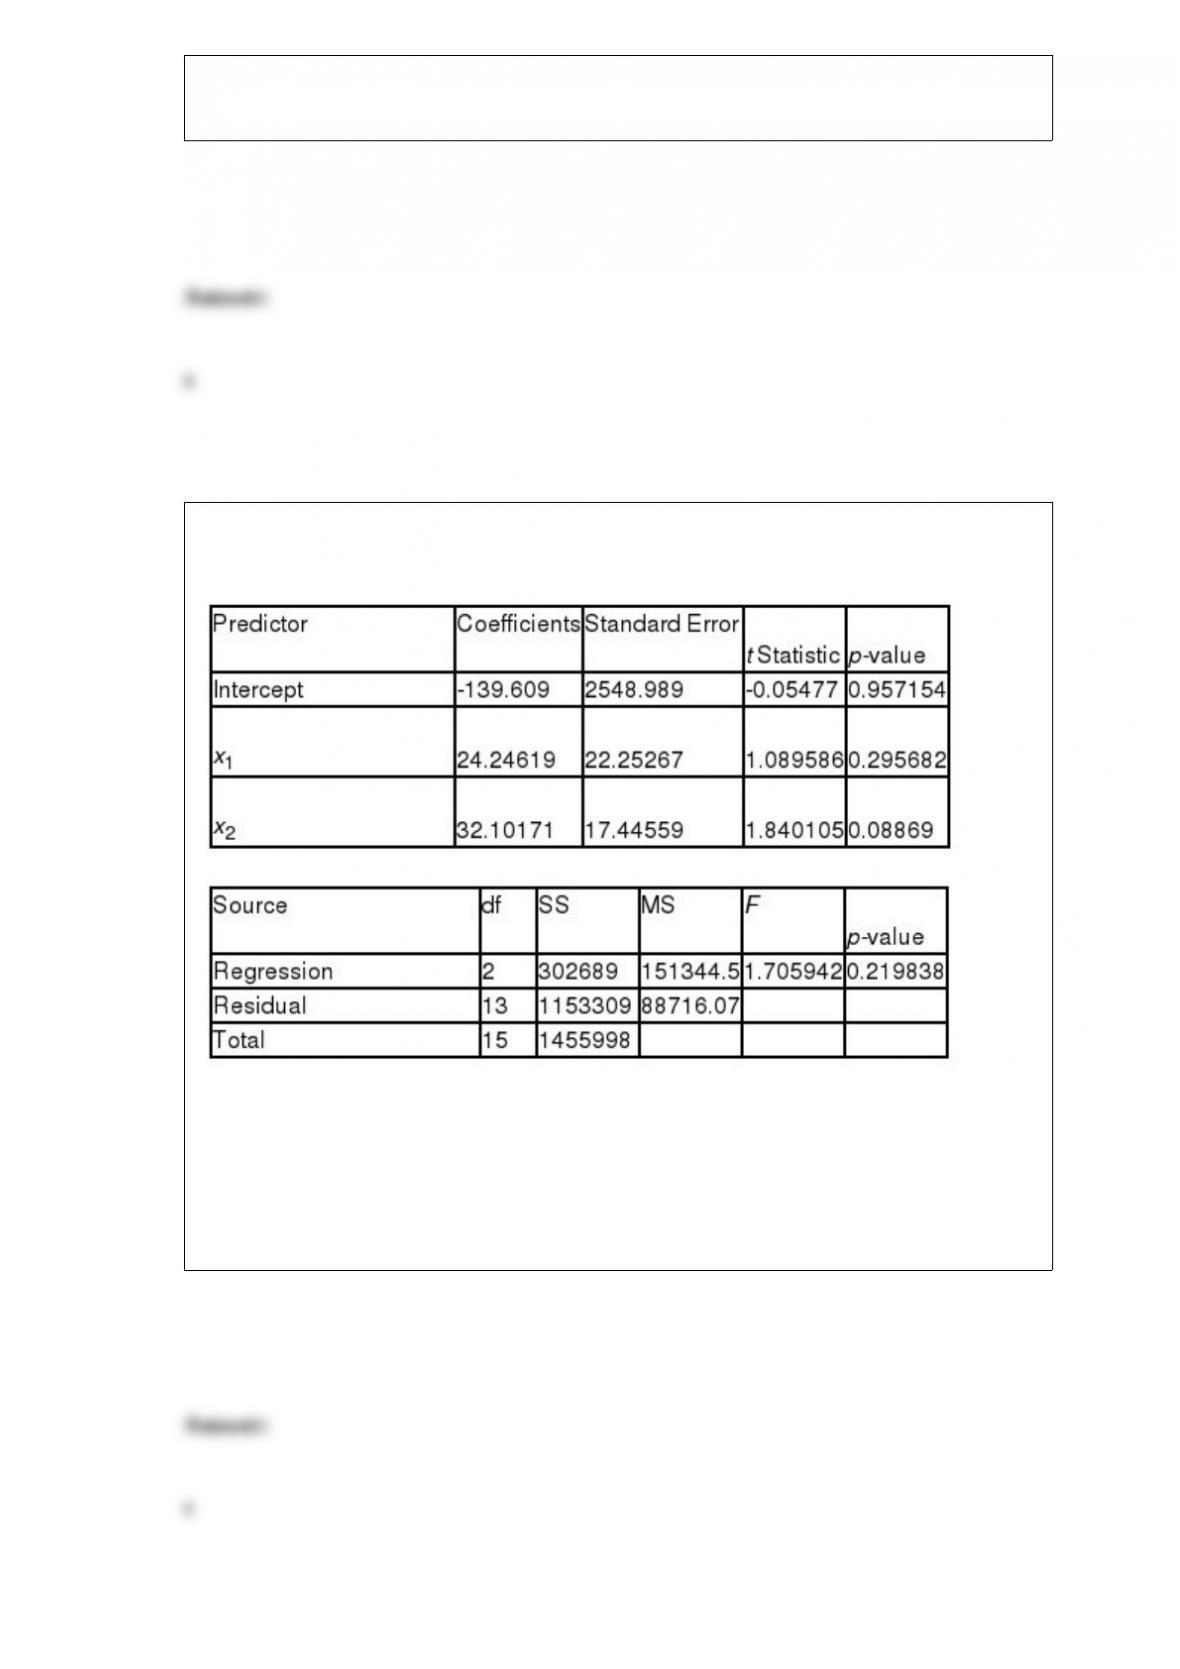
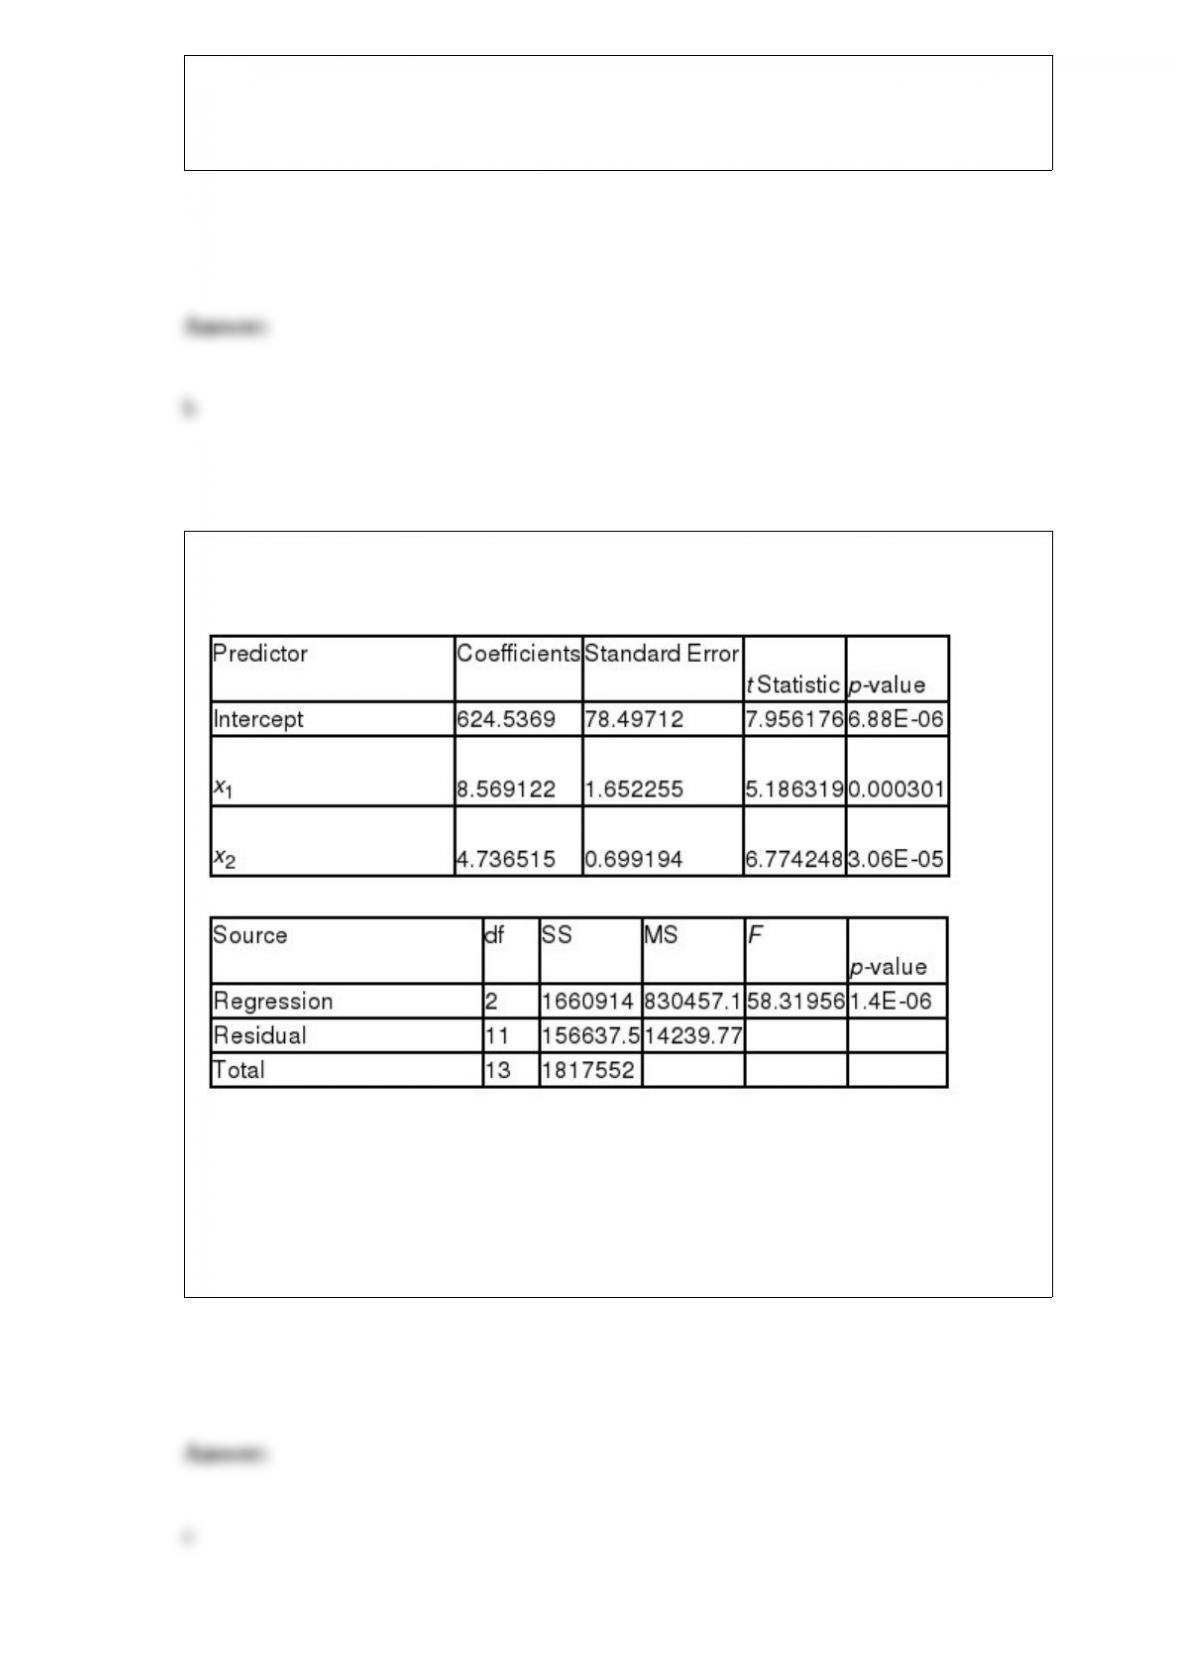
A multiple regression analysis produced the following tables.
Using
= 0.01 to test the null hypothesis H0:
2= 0, the critical t value is ____.
a) 1.174
b) 2.093
c) 2.131
d) 4.012
e) 3.012

Failure Mode Effect Analysis is best described as _________.
a) a quality scheme for building a failure free product or process.
b) a descriptive tool for analyzing measurement data and identifying failures.
c) a new approach to identifying potential failures.
d) a methodology for identifying the potential negative outcomes related to the failure
of a specific product or process.
e) an approach to business making which minimizes failures through quality circles
Suppose a company is interested in understanding the effect of age and gender on the
likelihood a customer will purchase a new product. The data analyst intends to run a
logistic regression on her data. Which of the following variable(s) will the analyst need
to code as 0 or 1 prior to performing the logistic regression analysis?
a) age and gender
b) age and purchase status
c) age
d) purchase status
e) gender and purchase status
If x is a binomial random variable withn=10 andp=0.8, the mean value of x is _____.
a) 6
b) 4.8
c) 3.2
d) 8
e) 48
Pinky Bauer, Chief Financial Officer of Harrison Haulers, Inc., suspects irregularities in
the payroll system and orders an inspection of “each and every payroll voucher issued
since January 1, 2000.” Each payroll voucher was inspected and the following
frequency distribution was compiled.
The relative frequency of the first class interval is _________.
a) 0.50
b) 0.33
c) 0.40
d) 0.27
e) 0.67
If xis uniformly distributed over the interval 8 to 12, inclusively (8 x 12), then the
probability, P(9 x 11), is __________________.
a) 0.250
b) 0.500
c) 0.333
d) 0.750
e) 1.000
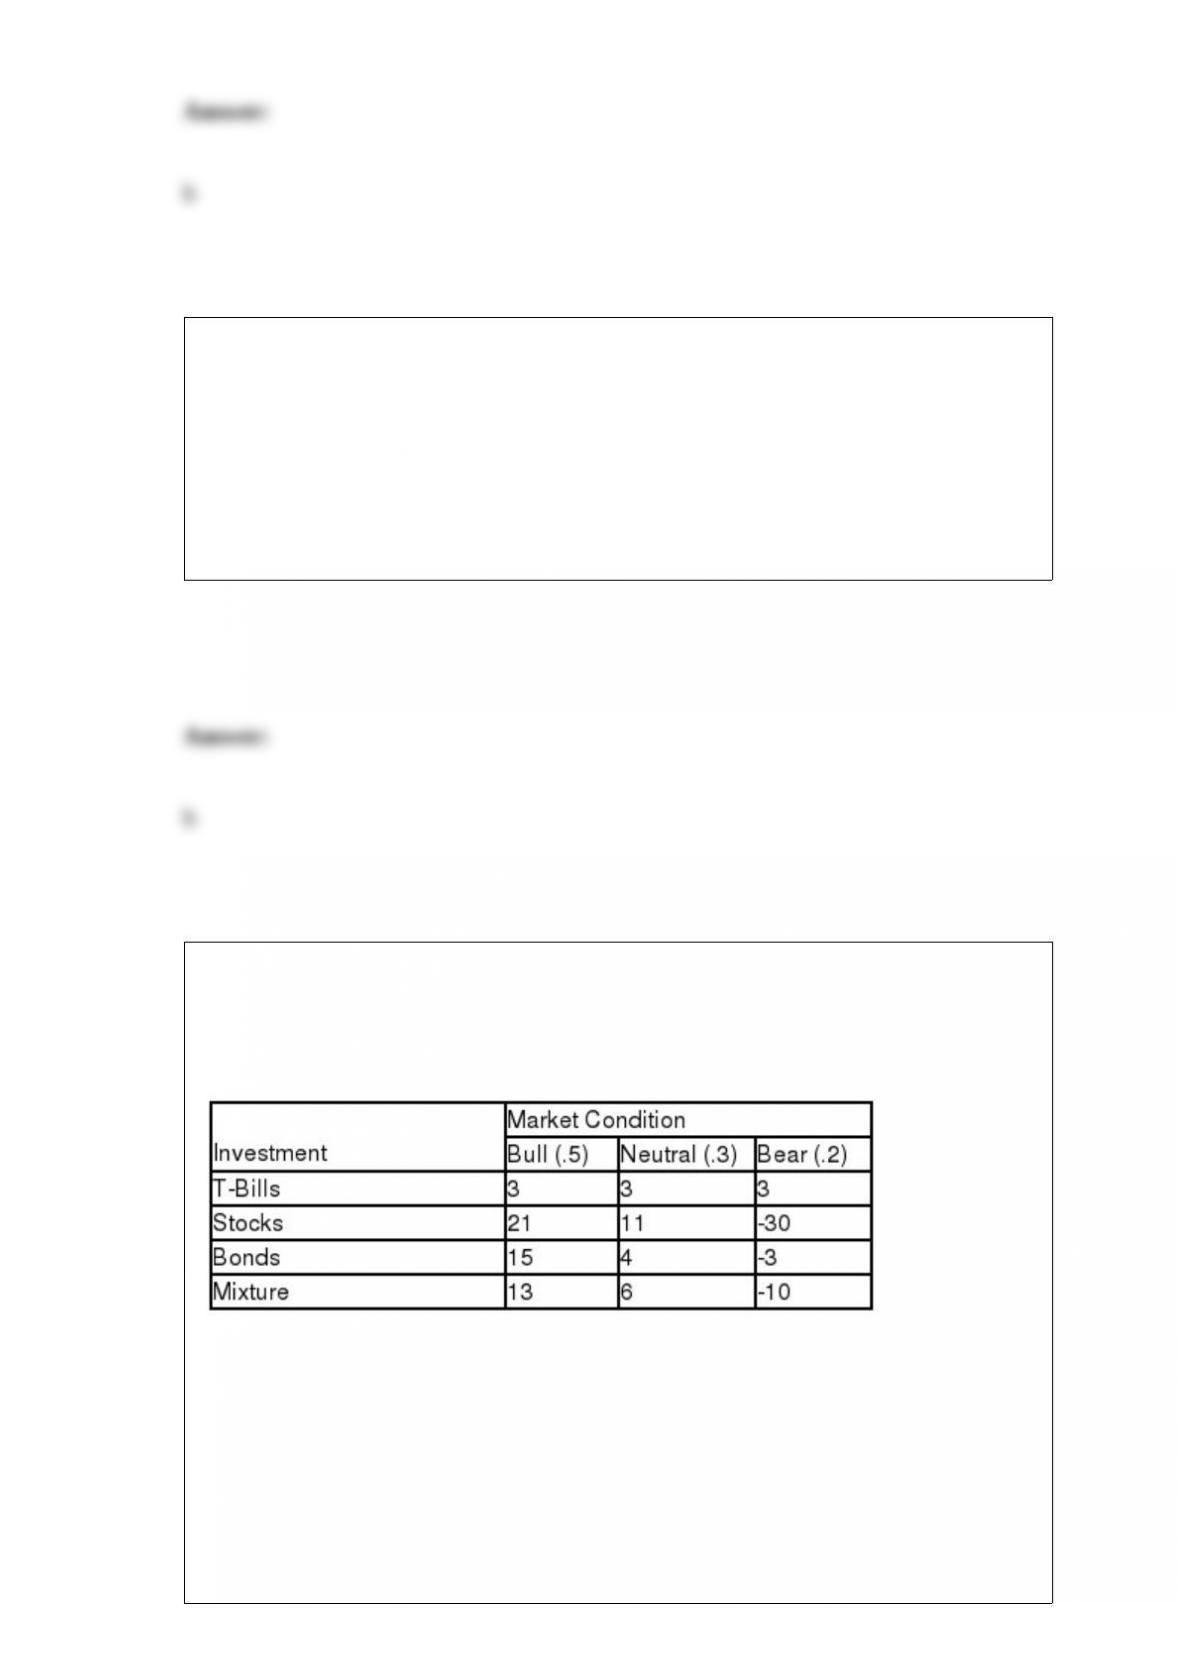
Ray Crofford is evaluating investment alternatives for the $100,000 which he inherited
from his grandfather. His investment advisor has identified four alternatives and
constructed the following table which shows expected profits (in $10,000’s) for various
market conditions and their probabilities.
The EMV of investing in Mixture is ________.
a) $30,000
b) $63,000
c) $78,000
d) $81,000
e) $100,000
A multiple regression analysis produced the following tables.
The adjusted R2is ____________.
a) 0.9138
b) 0.9408
c) 0.8981
d) 0.8851
e) 0.8891

Hope Hernandez is the new regional Vice President for a large gasoline station chain.
She wants a regression model to predict sales in the convenience stores. Her data set
includes two qualitative variables: the gasoline station location (inner city, freeway, and
suburbs), and curb appeal of the convenience store (low, medium, and high). The
number of dummy variables needed for “curb appeal” in Hope’s regression model is
______.
a) 1
b) 2
c) 3
d) 4
e) 5
Ray Crofford is evaluating investment alternatives for the $100,000 which he inherited
from his grandfather. His investment advisor has identified two alternatives and
constructed the following tables which show (1) expected profits (in $10,000’s) for
various market conditions and their probabilities, and (2) the advisor’s track record on
predicting Bull and Bear markets.
The probability that the advisor predicts a Bull market, P (F1), is ________.
a) 0.78
b) 0.894
c) 0.953
d) 0.923
e) 1.000
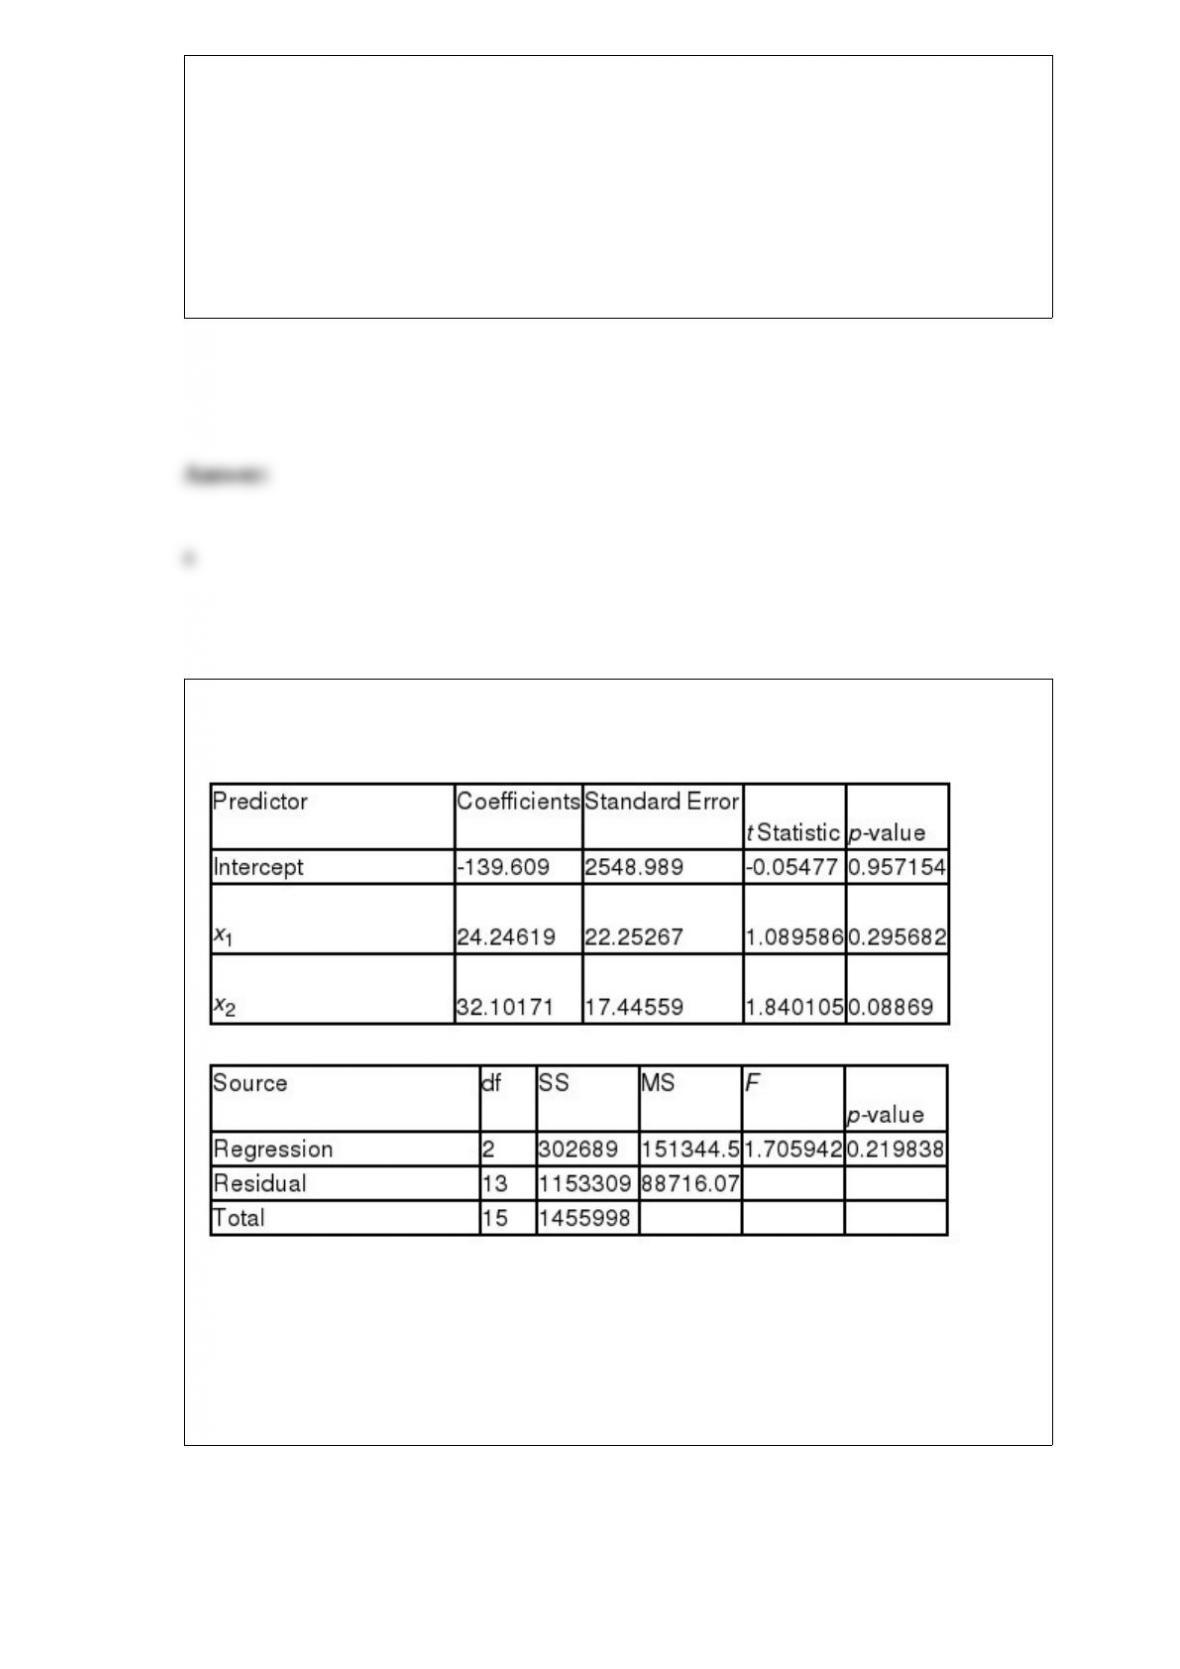
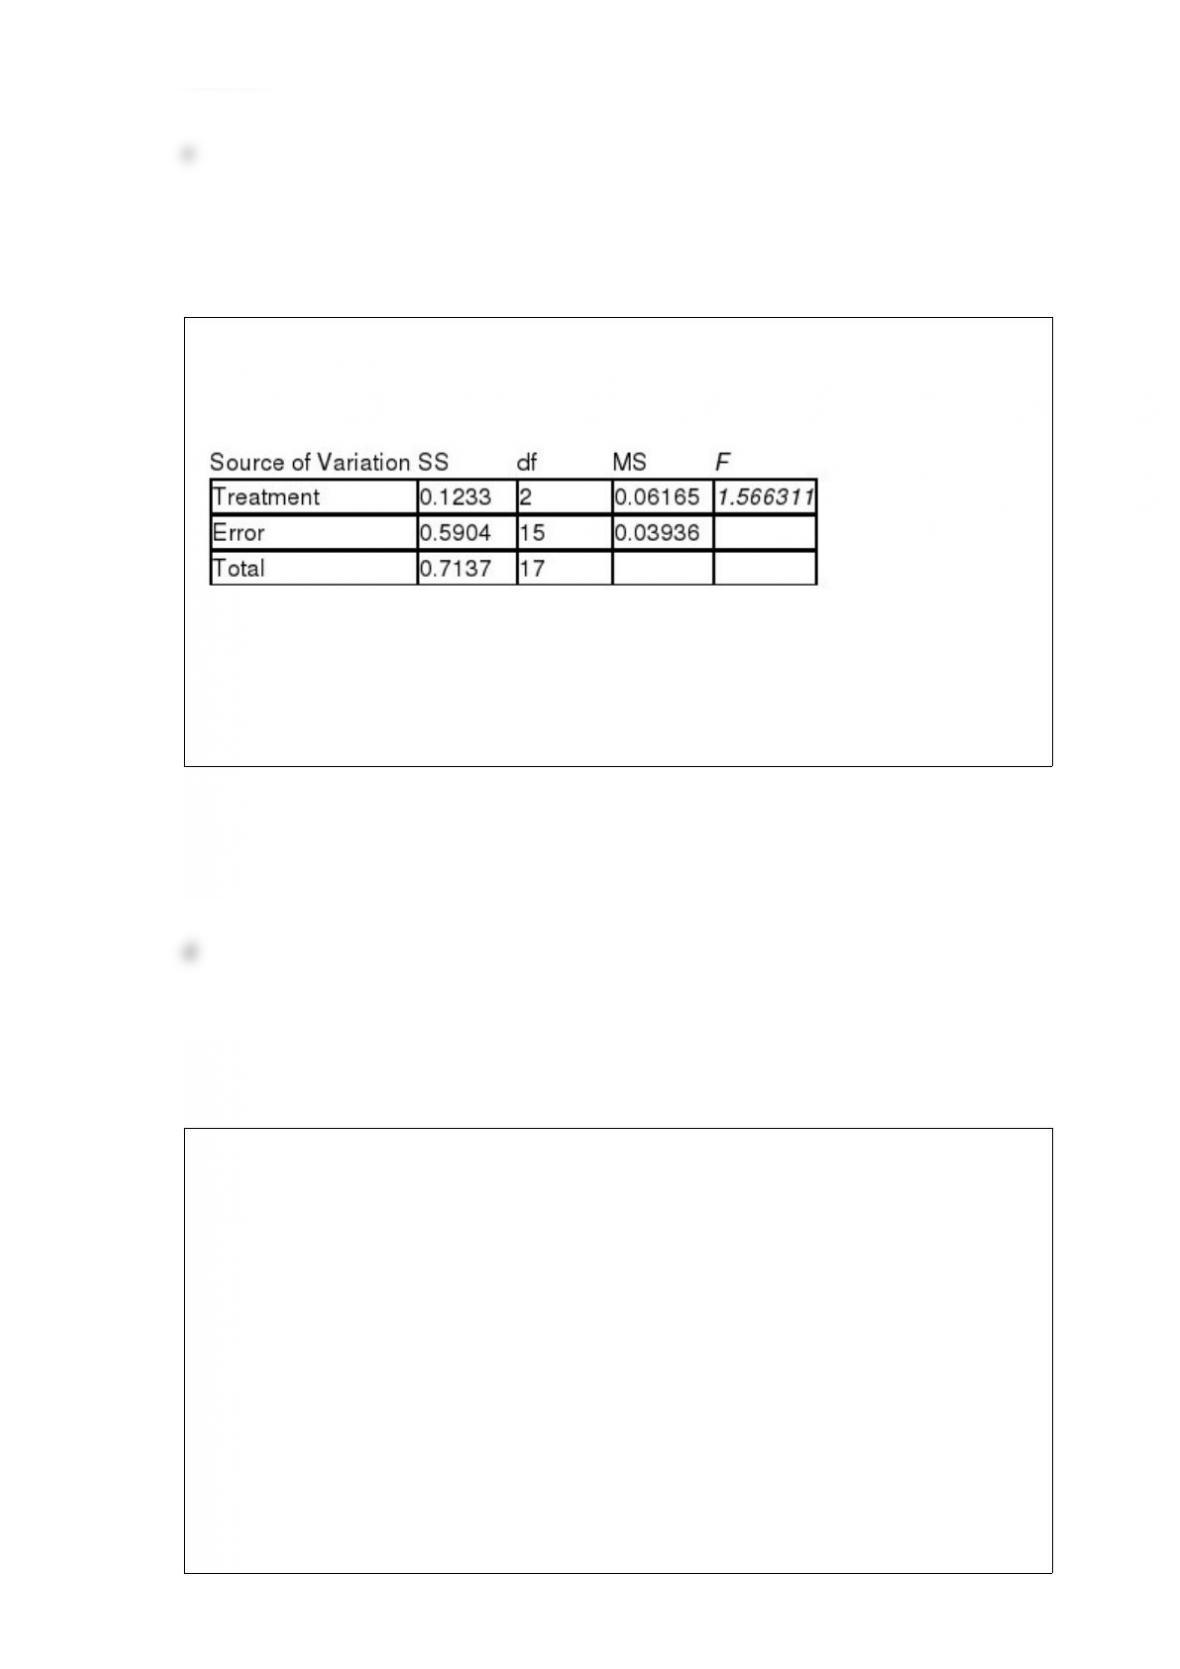
A multiple regression analysis produced the following tables.
The adjusted R2is ____________.
a) 0.2079
b) 0.0860
c) 0.5440
d) 0.7921
e) 1.0000
The methods of parametric statistics require ________________.
a) interval or ratio data
b) nominal or ordinal data
c) large samples
d) small samples
e) qualitative data
Medical Wonders is a specialized interior design company focused on healing artwork.
The CEO, Kathleen Kelledy claims that artwork has healing effects for patients staying
in a hospital, as measured by reduced length of stay. Her current client is a children’s
cancer hospital. Kathleen is interested in determining the effect of three different pieces
of healing artwork on children. She chooses three paintings (a horse photo, a bright
abstract, and a muted beach scene) and randomly assigns six hospital rooms to each
painting. Analysis of Kathleen’s data yielded the following ANOVA table.
Using
= 0.05, the critical F value is _____________.
a) 13.68
b) 19.43
c) 3.59
d) 19.45
e) 3.68
For the following ANOVA table, the critical value of the studentized range distribution
using
= 0.01 is ______
a) 3.01
b) 3.67
c) 4.17
d) 4.84
e) 5.25
A researcher believes a new diet should improve weight gain. To test his hypothesis a
random sample of 10 people on the old diet and an independent random sample of 10
people on the new diet were selected. The selected people on the old diet gain an
average of 5 pounds with a standard deviation of 2 pounds, while the average gain for
selected people on the new diet was 8 pounds with a standard deviation of 1.5 pounds.
Assume that the values are normally distributed in each population and that the
population variances are approximately equal. Using
= 0.05, the critical tvalue used
from the table for this is _______.
a) -1.96
b) -1.645
c) -2.100
d) -3.79
e) -1.734

Consider the following frequency distribution:
What is the midpoint of the first class?
a) 10
b) 20
c) 15
d) 30
e) 40
Inspection of the following table of correlation coefficients for variables in a multiple
regression analysis reveals potential multicollinearity with variables ___________.
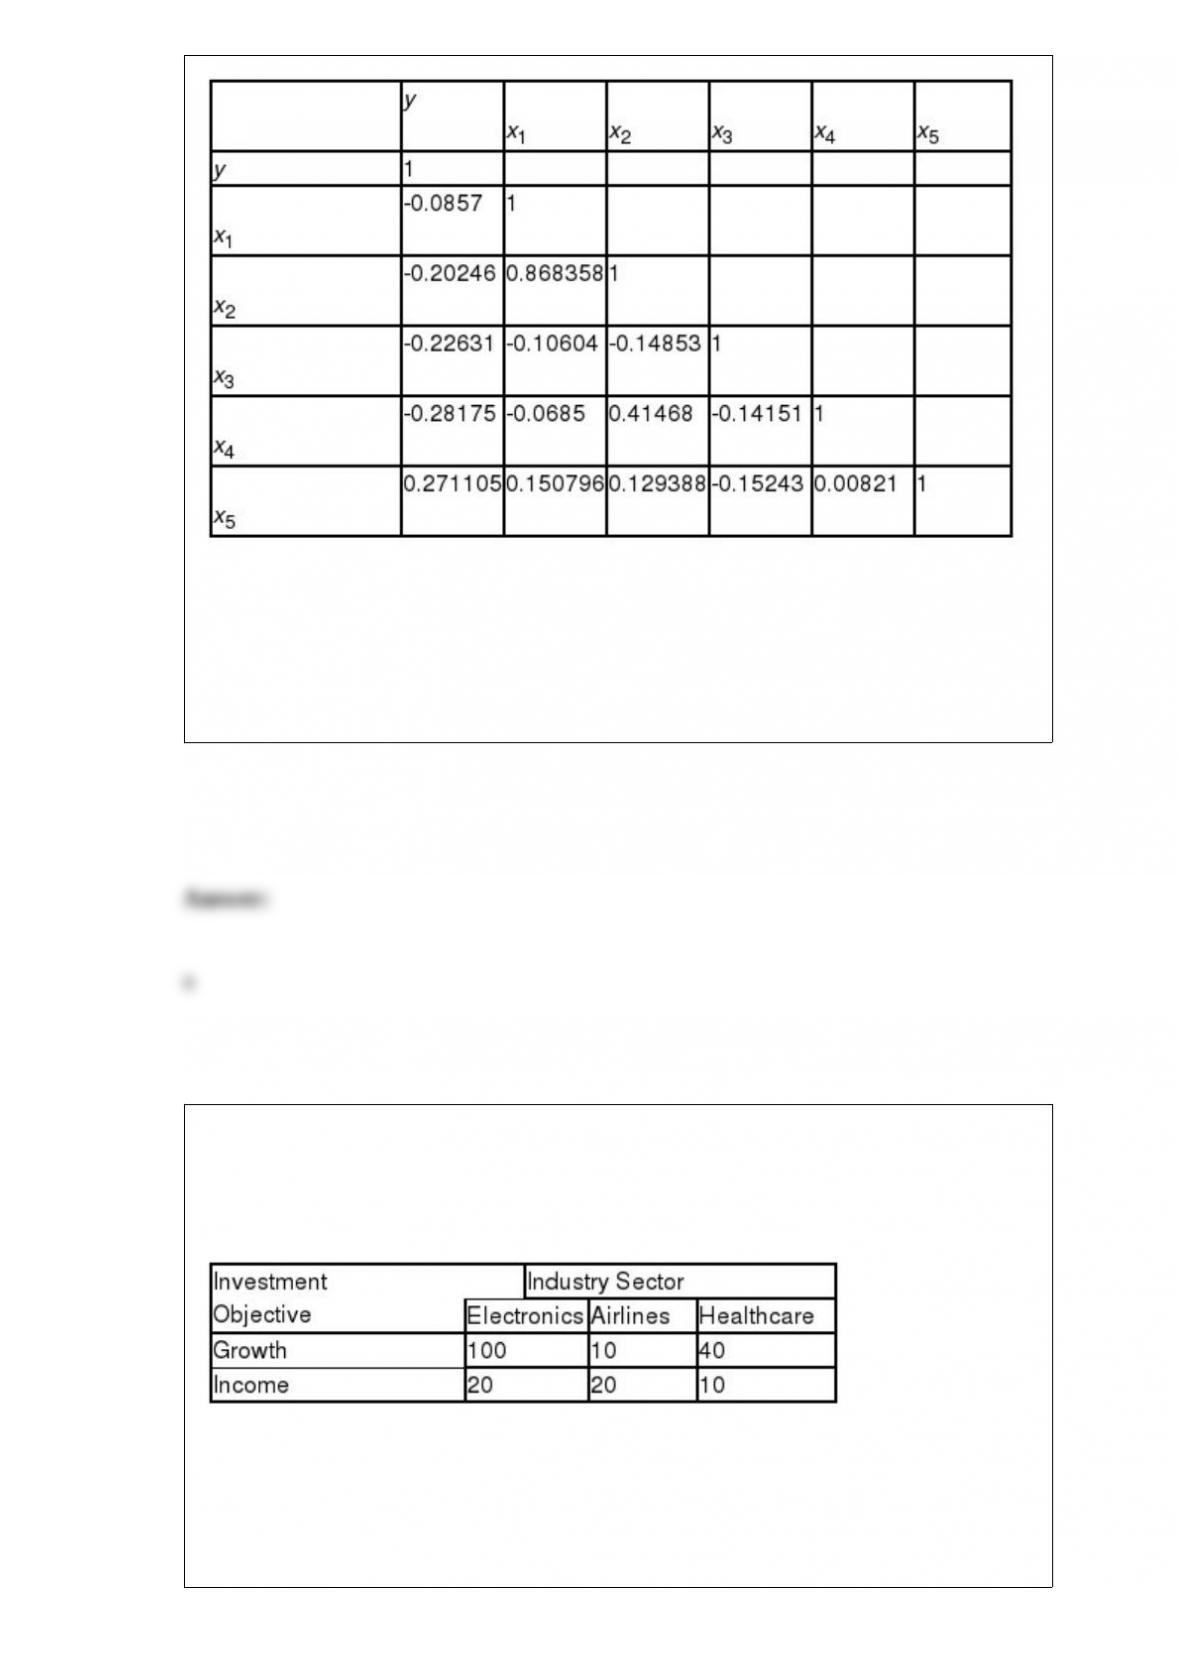
a) x1and x2
b) x1and x4
c) x4and x5
d) x4and x3
e) x5and y
Anita Cruz recently assumed responsibility for a large investment portfolio. She
wonders whether industry sector influences investment objective. Her staff prepared the
following contingency table from a random sample of 200 common stocks.
Using
= .01, appropriate decision is ______________.
a) reject the null hypothesis and conclude the two variables are not independent
b) reject the null hypothesis and conclude the two variables are independent
c) do not reject the null hypothesis and conclude the two variables are not independent
d) do not reject the null hypothesis and conclude the two variables are independent
e) do nothing
Sarah Soliz, Director of Quality Programs, is designing and R charts for the
rod shearing process at Stockton Steel. She has 26 samples of rod length, and each
sample included measurements of 5 rods. The mean of the 26 sample means is 112
inches, and mean of the 26 ranges is 0.15 inch. The centerline for her chart
is _________.
a) 5
b) 26
c) 0.15
d) 11.2
e) 112