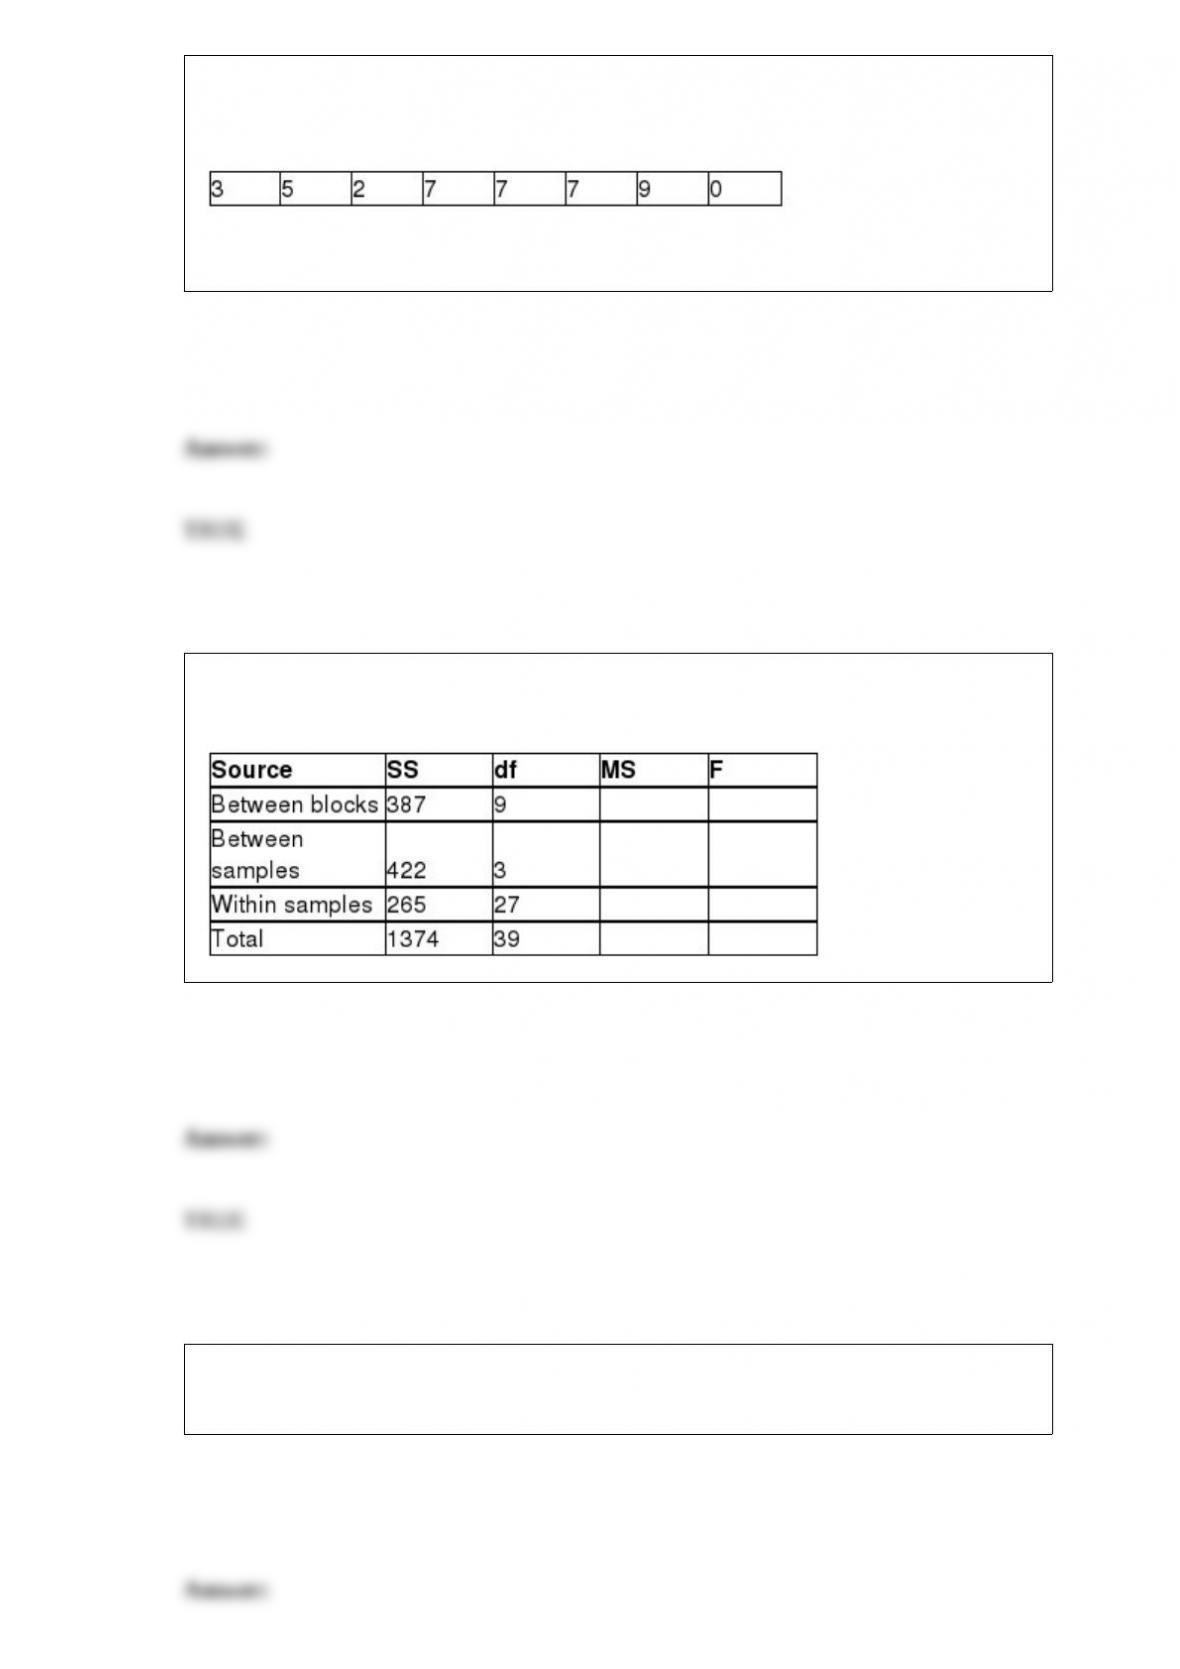
The Good-Guys Car Dealership has tracked the number of used cars sold at its
downtown dealership. Consider the following data as representing the population of
cars sold in each of the 8 weeks that the dealership has been open.
The population range is 9.
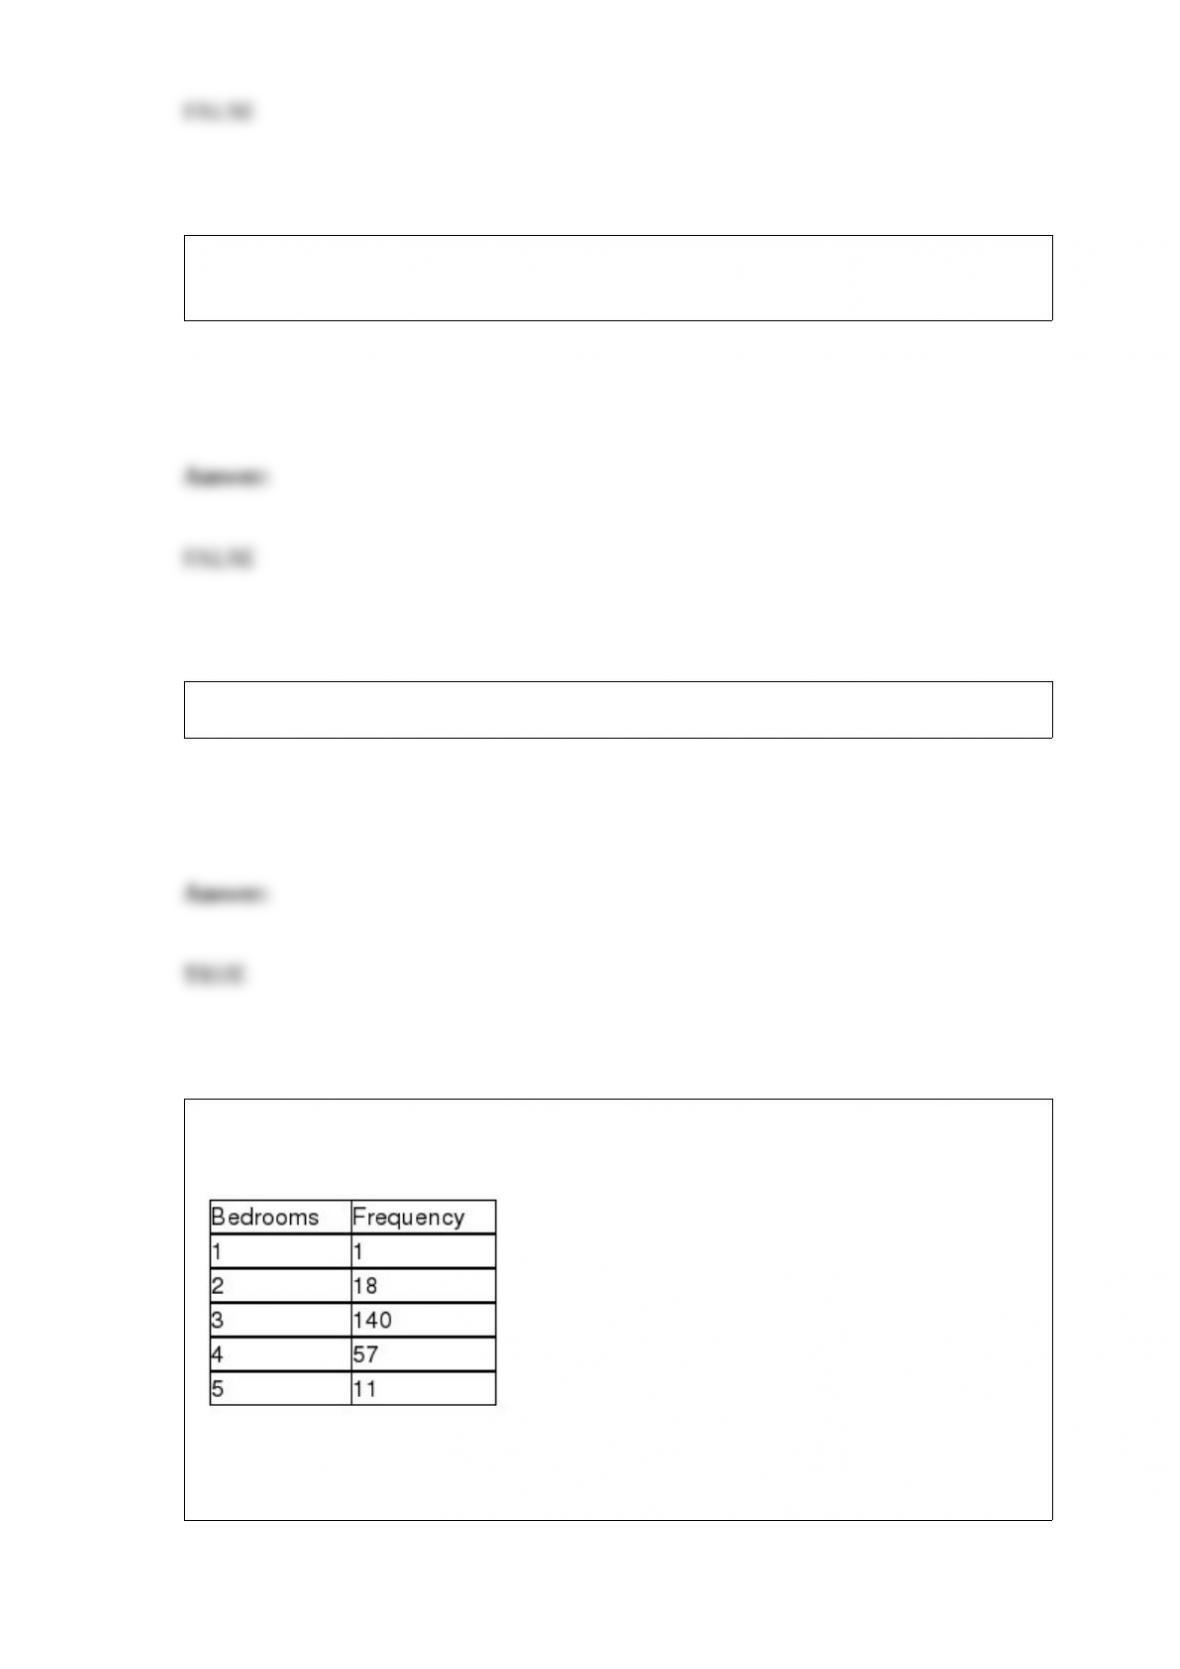
Given the partially completed ANOVA table below, the test statistic for determining if
there is any blocking effect is F = 4.38.
The second quartile for a set of data will have the same value as the 50th percentile only
when the data are symmetric.
Special cause variation is variation in the output of a process that is naturally occurring
and expected and that may be the result of random causes.
An increase in sample size will tend to result in less sampling error.
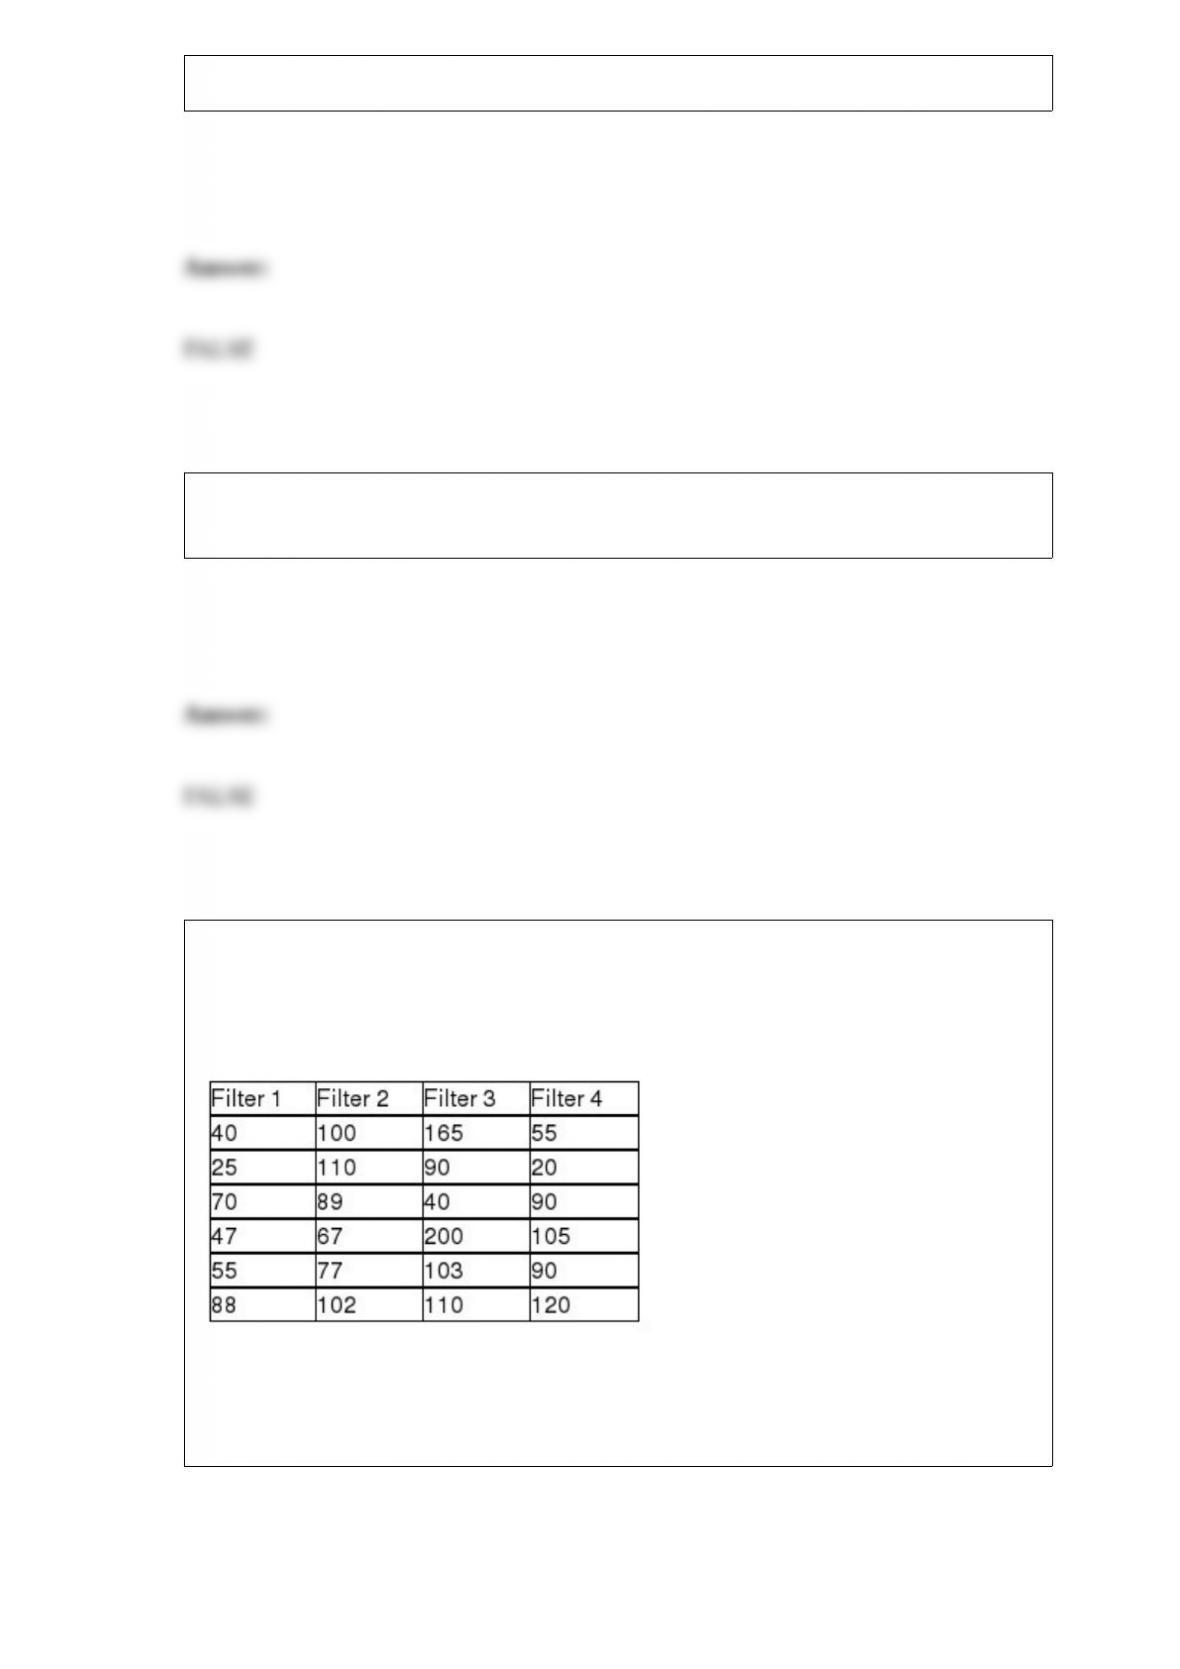
Suppose a study of houses that have sold recently in your community showed the
following frequency distribution for the number of bedrooms:
Based on this information, it is possible to determine that the distribution of bedrooms
in homes sold is right-skewed.

A positive population slope of 12 (β1 = 12) means that a 1-unit increase in x causes an
average 12-unit increase in y.
The three components of the regression model-building process are model specification,
model fitting, and model diagnosis.
A study was recently done in the United States in which car owners were asked to
indicate whether their most recent car purchase was a U.S. car, a German car, or a
Japanese car. The people in the survey were divided by geographic region in the United
States. The following data were recorded.
Given this situation, to test whether the car origin is independent of the geographical
location of the buyer, the critical value for alpha = .10 is 14.6837.
When using a 95 percent confidence interval for a mean, the area in the upper tail of the
distribution that is outside the interval is 5 percent.
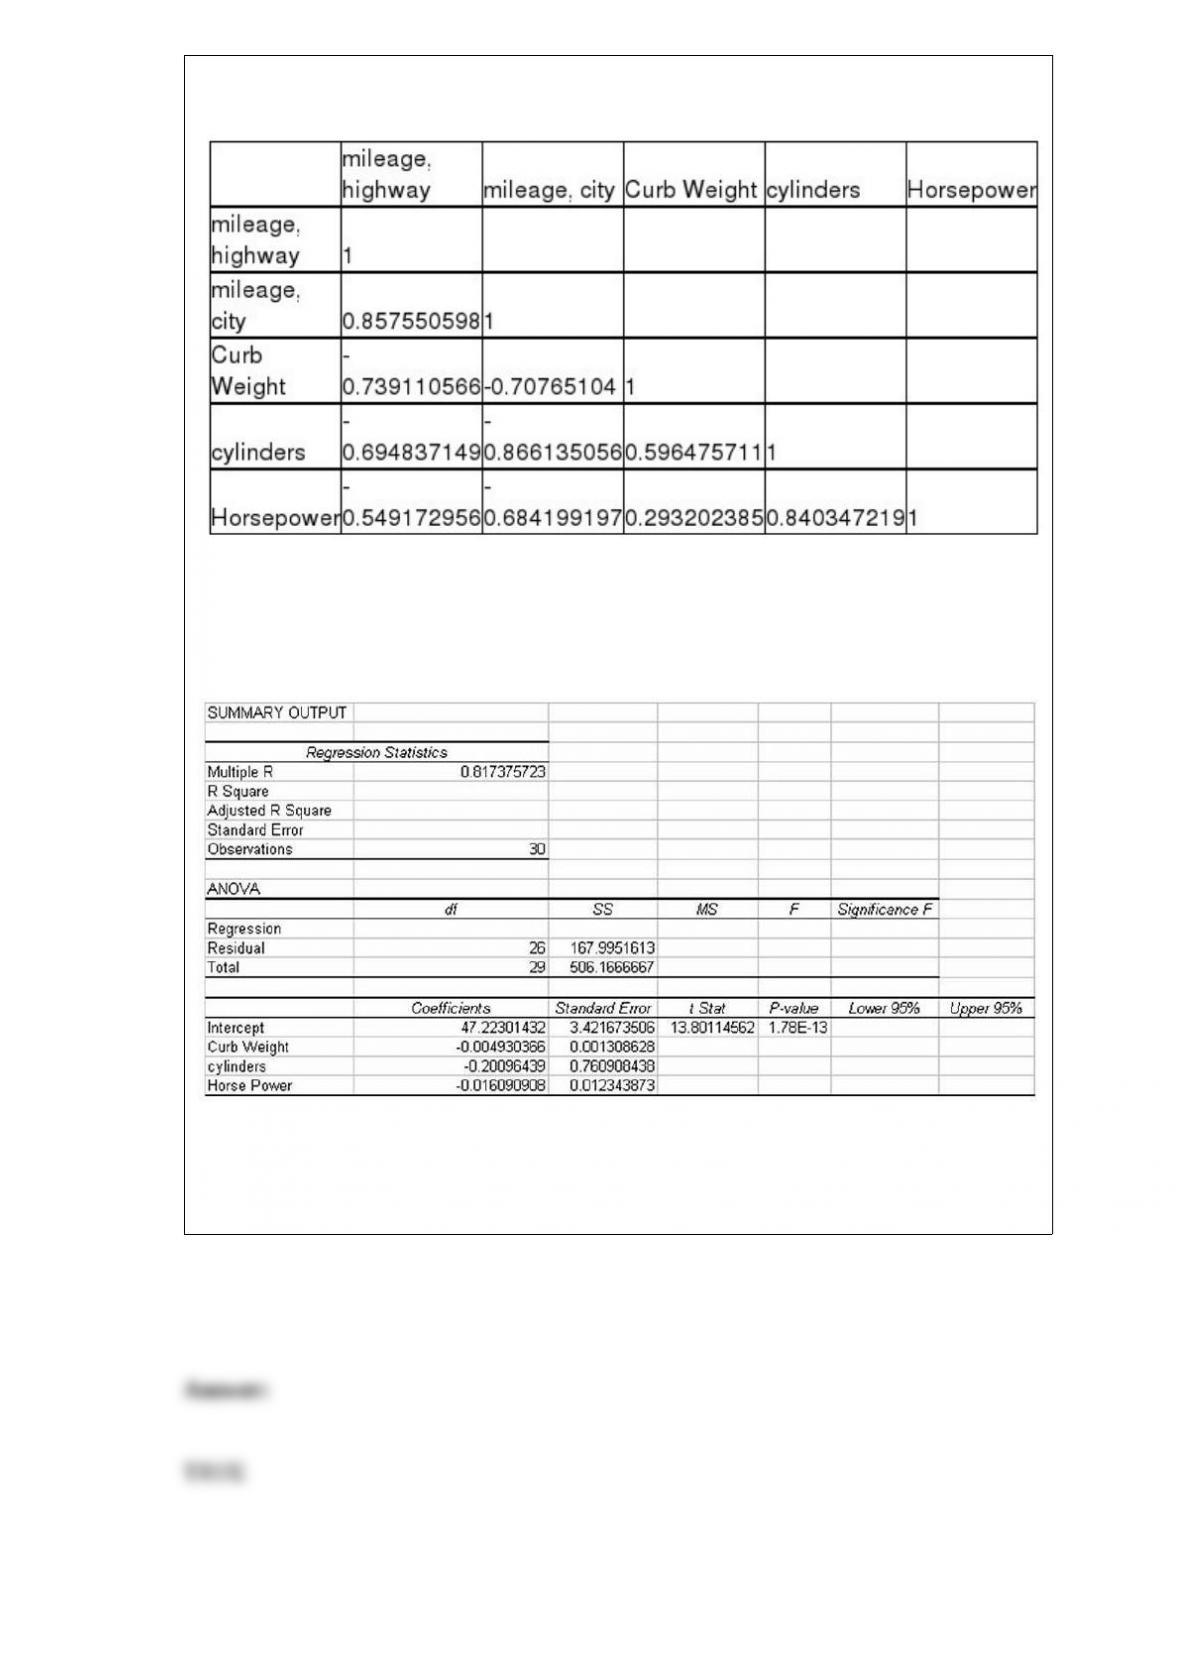
The makers of furnace filters recently conducted a test to determine whether the median
number of particulates that would pass through their four leading filters was the same. A
random sample of 6 of each type of filter was used with the following data being
recorded:
If the Kruskal-Wallis test is used with an alpha = .01, the null hypothesis should be
rejected and the managers should conclude that the four filters do not allow an equal
median number of particulates.

Generally, it is possible to appropriately test a null and alternative hypotheses using the
test statistic approach and reach a different conclusion than would be reached if the
p-value approach were used.
When news articles report on household income level they usually report the median
income, rather than the mean income. This would be because income is usually a
right-skewed distribution.
Because variations are unavoidable in a system, the output of the system is always
unpredictable.

If it is desired that sampling error be reduced, one step that tends to work is to increase
the sample size that is selected from the population.
Some of the most common methods of collecting data include experiments, telephone
surveys, mail questionnaires, direct observations, and personal interviews.
The owner of a local gasoline station has kept track of the number of gallons of regular
unleaded sold at his station every day since he purchased the station. This morning, he
computed the mean number of gallons. This value would be considered a statistic.
A major car magazine has recently collected data on 30 leading cars in the U.S. market.
It is interested in building a multiple regression model to explain the variation in
highway miles. The following correltion matrix has been computed from the data
collected:
The analysts also produced the following multiple regression output using curb weight,
cylinders, and horsepower as the three independent variables. Note, a number of the
output fields are missing, but can be determined from the information provided.
Based on the information provided, holding the other variables constant, increasing
horsepower by one unit results in an average decrease in highway mileage by 0.016
miles per gallon.

One of the basic tools for creating a trend-based forecasting model is regression
analysis.
In a recent report to the supply-chain manager in a major electronics company, the
report writer stated that with 90 percent confidence, the manufacturing lead time for a
critical part is between 3.34 hours and 4.14 hours. Based on this information, the
margin of error for this estimate is .80 hours.
One of the reasons that managers prefer statistical sampling to nonstatistical sampling is
that statistical sampling is generally easier to perform and less expensive.
There is interest at the American Savings and Loan as to whether there is a difference
between average daily balances in checking accounts that are joint accounts (two or
more members per account) versus single accounts (one member per account). To test
this, a random sample of checking accounts was selected with the following results:
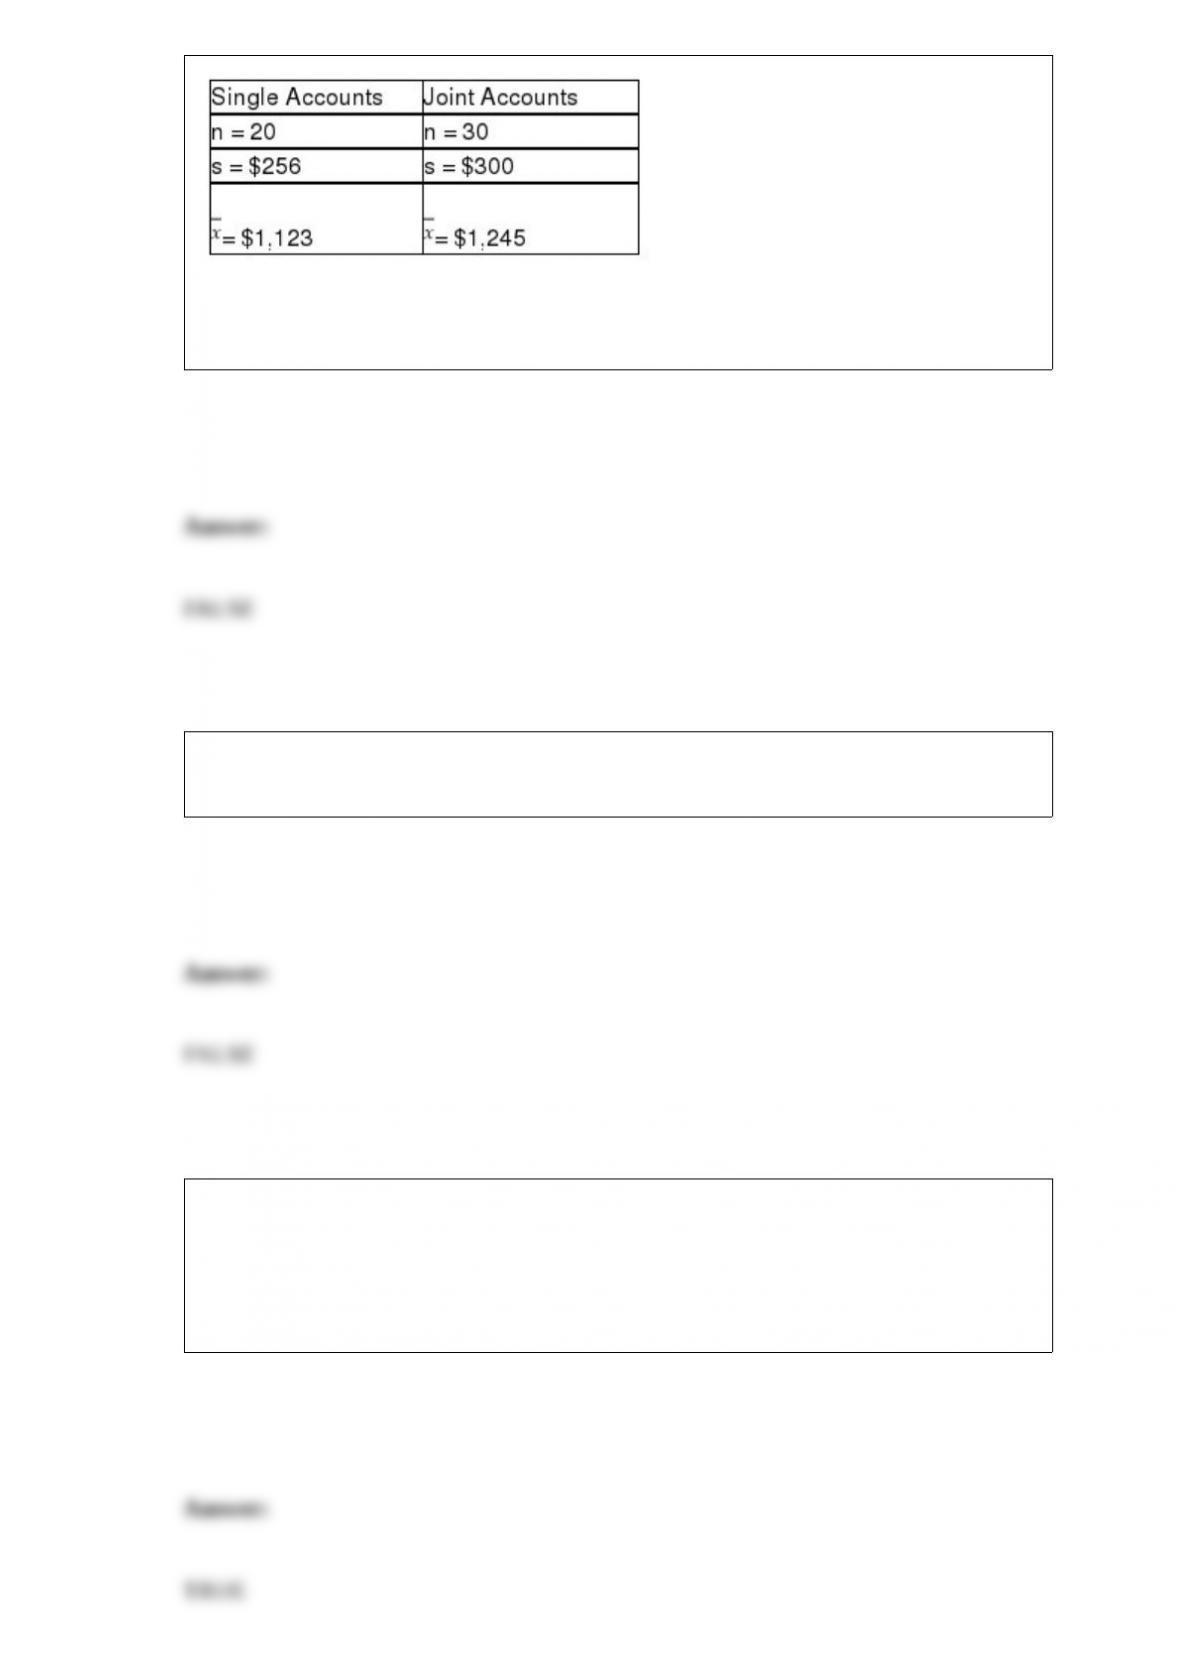
Based upon these data, if tested using a significance level equal to 0.10, the assumption
of equal population variances should be rejected.
The best subsets method will involve trying fewer different regression models than
stepwise regression.
In an effort to estimate the mean length of stay for motel guests at a major national
motel chain, the decision makers asked for a 95 percent confidence, and a margin of
error of 0.25 days. Further, it was known that the population standard deviation is 0.50
days. Given this, the required sample size to estimate the mean length of stay is about
16 customers.

The difference between interval data and ratio data is that interval data has a natural
zero.
In a two-factor ANOVA design with replications, there are three hypotheses to be
tested; test for factor A, test for factor B, and test for interaction between factors A and
B.
Some stocks are referred to as cyclical stock because they tend to be in favor for several
years and then out of favor for several years. This is a correct use of the term cyclical.
In drawing a box and whisker plot the upper limit length of the whiskers is 1.5(Q3-Q1).

One difference between the binomial distribution and Poisson distribution is that the
binomial’s upper bound is the number of trials while the Poisson has no particular upper
bound.
If a population is skewed, the point estimate will be pushed to the right or left of the
middle of the confidence interval estimate.
A store manager tracks the number of customer complaints each week. The following
data reflect a random sample of ten weeks.
The variance for these data is approximately 27.78.
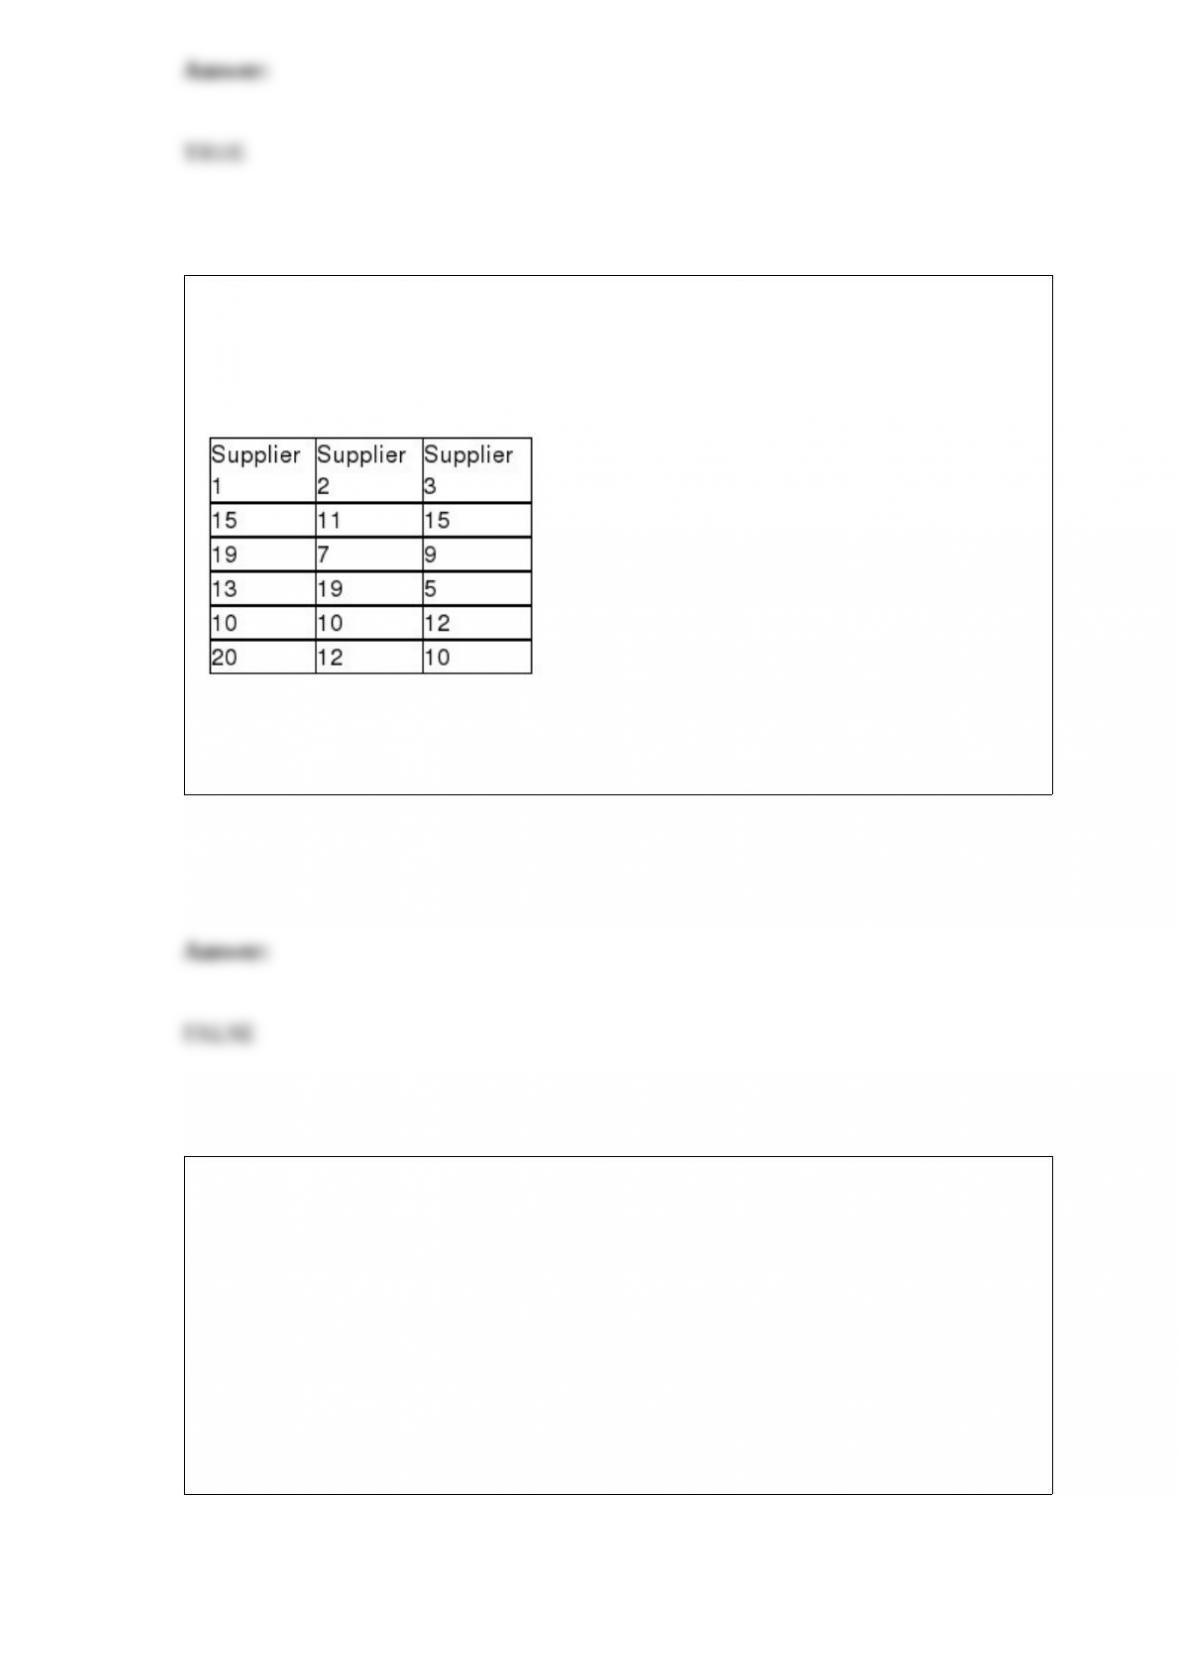
A recent study was conducted to determine if any of three suppliers of electronic
components has a different median delivery time on special orders. To test this, five
orders were given to each supplier and the delivery days were recorded. These data are
shown as follows:
If a Kruskal-Wallis test is to be performed, the critical value for a test conducted using
an alpha = .05 level is χ2 = 11.0705
Consider a goodness-of-fit test with a computed value of chi-square = 1.273 and a
critical value = 13.388, the appropriate conclusion would be to:
A) reject H0.
B) fail to reject H0.
C) take a larger sample.
D) take a smaller sample.

In an effort to estimate the mean dollars spent per visit by customers of a food store, the
manager has selected a random sample of 100 cash register receipts. The mean of these
was $45.67 with a sample standard deviation equal to $12.30. Assuming that he wants
to develop a 90 percent confidence interval estimate, which of the following is the
margin of error that will be reported?
A) About $2.02
B) Nearly $50.20
C) $1.645
D) About $1.43
The managers of a local golf course have recently conducted a study of the types of golf
balls used by golfers based on handicap. A joint frequency table for the 100 golfers
covered in the survey is shown below:
Based on these data, the probability of a golfer having a handicap less than 10 is:
A) 0.52
B) 0.10
C) 0.34

D) None of the above
When comparing data measured by substantially different scales, we must use:
A) standardized data values.
B) standardized data scales.
C) standardized data variations.
D) standardized data scores.
Incomes in a particular market area are known to be right-skewed with a mean equal to
$33,100. In a report issued recently, a manager stated that at least 89 percent of all
incomes are in the range of $26,700 to $39,500, and this was based on Tchebysheff’s
theorem. Given these facts, what is the standard deviation for the incomes in this
market area?
A) Approximately $6,400
B) Approximately $3,200
C) Approximately $2,133
D) Approximately $4266
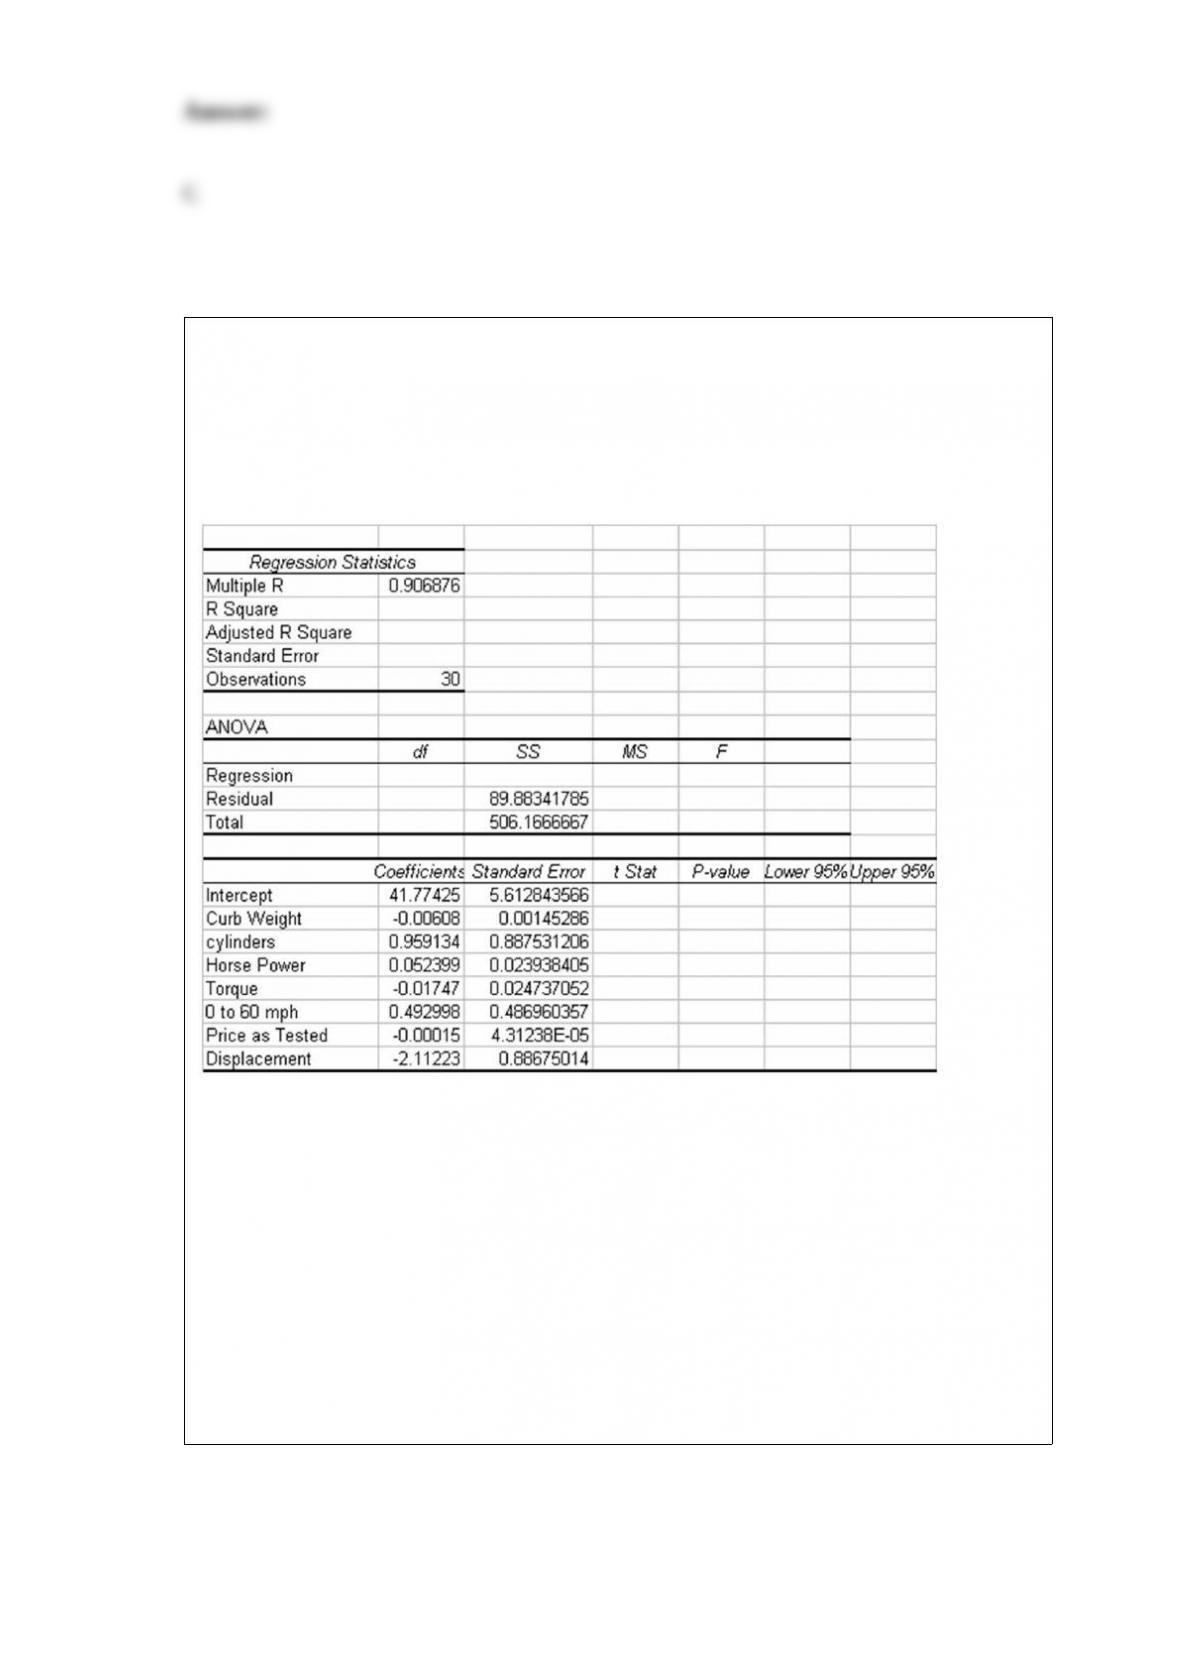
The editors of a national automotive magazine recently studied 30 different automobiles
sold in the United States with the intent of seeing whether they could develop a multiple
regression model to explain the variation in highway miles per gallon. A number of
different independent variables were collected. The following regression output (with
some values missing) was recently presented to the editors by the magazine’s analysts:
Based on this output and your understanding of multiple regression analysis, which of
the independent variables is not considered statistically significant if the test is
conducted at the 0.05 level of statistical significance?
A) All the variables in the model are statistically significant.
B) None of the variables in the model is statistically significant.
C) Torque and price as tested
D) Cylinders, torque, and 0 to 60

Damage to homes caused by burst piping can be expensive to repair. By the time the
leak is discovered, hundreds of gallons of water may have already flooded the home.
Automatic shutoff valves can prevent extensive water damage from plumbing failures.
The valves contain sensors that cut off water flow in the event of a leak, thereby
preventing flooding. One important characteristic is the time (in milliseconds) required
for the sensor to detect the water leak. Sample data obtained for four different shutoff
valves are contained in the file entitled Waterflow.
Produce the relevant ANOVA table and conduct a hypothesis test to determine if the
mean detection time differs among the four shutoff valve models. Use a significance
level of 0.05.
A) The ANOVA produces a p-value of 0.033 < alpha = 0.05. Therefore, the null
hypothesis is not rejected. There is not sufficient evidence to indicate that the mean
detection time differs among the four shutoff valve models
B) The ANOVA produces a p-value of 0.033 < alpha = 0.05. Therefore, the null
hypothesis is rejected. There is sufficient evidence to indicate that the mean detection
time differs among the four shutoff valve models
C) The ANOVA produces a p-value of 0.000 < alpha = 0.05. Therefore, the null
hypothesis is not rejected. There is not sufficient evidence to indicate that the mean
detection time differs among the four shutoff valve models
D) The ANOVA produces a p-value of 0.000 < alpha = 0.05. Therefore, the null
hypothesis is rejected. There is sufficient evidence to indicate that the mean detection
time differs among the four shutoff valve models
If the population variances are assumed to be known in an application where a manager
wishes to estimate the difference between two population means, the 95 percent
confidence interval estimate can be developed using which of the following critical
values?

A) z = 1.645
B) z = 1.96
C) t value that depends on the sample sizes from the two populations
D) z = 2.575
Which of the following statements is true?
A) If the confidence interval estimate for the regression slope coefficient, based on the
sample information, crosses over zero, the true population regression slope coefficient
could be zero.
B) R-square will tend to be smaller than the adjusted R-squared values when
insignificant independent variables are included in the model.
C) The y-intercept will usually be negative in a multiple regression model when the
regression slope coefficients are predominately positive.
D) None of the above
A company conducted a survey of its employees to determine their level of satisfaction
with various company policies. The data collected from this survey are:
A) primary data.

B) secondary data.
C) experimental data.
D) census data.
For a given sample size n, if the level of significance (α) is decreased, the power of the
test:
A) will increase.
B) will decrease.
C) will remain the same.
D) cannot be determined.
For a standardized normal distribution, calculate P(0.00 < z < 2.33).
A) 0.7181
B) 0.5099
C) 0.4901
D) 0.2819

Recently, an automobile insurance company performed a study of a random sample of
15 of its customers to determine if there is a positive relationship between the number
of miles driven and the age of the driver. The sample correlation coefficient is r = .38.
Given this information, which of the following is appropriate critical value for testing
the null hypothesis at an alpha = .05 level?
A) t = 2.6104
B) t = 1.7613
C) t = 1.7531
D) t = 1.7709
It is possible for the same survey questionnaire to yield both quantitative and qualitative
data.

Descent, Inc., produces a variety of climbing and mountaineering equipment. One of its
products is a traditional three-strand climbing rope. An important characteristic of any
climbing rope is its tensile strength. Descent produces the three-strand rope on two
separate production lines: one in Bozeman and the other in Challis. The Bozeman line
has recently installed new production equipment. Descent regularly tests the tensile
strength of its ropes by randomly selecting ropes from production and subjecting them
to various tests. The most recent random sample of ropes, taken after the new
equipment was installed at the Bozeman plant, revealed the following:
Descent’s production managers are willing to assume that the population of tensile
strengths for each plant is approximately normally distributed with equal variances.
Based on the sample results, can Descent’s managers conclude that there is a difference
between the mean tensile strengths of ropes produced in Bozeman and Challis?
Conduct the appropriate hypothesis test at the 0.05 level of significance.
A) Because the calculated value of t = 0.896 is neither less than the lower tail critical
value of t = -2.0167, nor greater than the upper tail critical value of t = 2.0167, do not
reject the null hypothesis. Based on these sample data, at the α = 0.05 level of
significance there is not sufficient evidence to conclude that the average tensile strength
of ropes produced at the two plants is different.
B) Because the calculated value of t = 0.451 is neither less than the lower tail critical
value of t = -2.0167, nor greater than the upper tail critical value of t = 2.0167, do not
reject the null hypothesis. Based on these sample data, at the α = 0.05 level of
significance there is not sufficient evidence to conclude that the average tensile strength
of ropes produced at the two plants is different.
C) Because the calculated value of t = -2.8126 is less than the lower tail critical value of
t = -2.0167, reject the null hypothesis. Based on these sample data, at the α = 0.05 level
of significance there is sufficient evidence to conclude that the average tensile strength
of ropes produced at the two plants is different.
D) Because the calculated value of t = 2.8126 is greater than the lower tail critical value
of t = -2.0167, reject the null hypothesis. Based on these sample data, at the α = 0.05
level of significance there is sufficient evidence to conclude that the average tensile
strength of ropes produced at the two plants is different.

In this course, the term business statistics refers to the set of tools and techniques that
are used to convert information into meaningful data.
The Bradfield Container Company makes “cardboard” boxes for commercial use (i.e.,
pizza boxes). One of the big issues for the company is the set-up time required to
change over from one order to the next. At one particular machine, the set-up time is
thought to be uniformly distributed between 10 and 21 minutes. To test whether this is
true or not, a random sample of 180 set-ups on this machine was selected with set-up
time rounded to the nearest two-minute intervals. The following results occurred:
Set-up Time Frequency
10-11 minutes 13
12-13 minutes 23
14-15 minutes 40
16-17 minutes 44
18-19 minutes 40
20-21 minutes 20
a. What are the appropriate null and alternative hypothesis to be tested?
b. Based on the null and alternative hypotheses stated in part a, determine the expected
frequencies for each set-up time category.
c. Assuming that we wish to conduct the hypothesis test at the .05 level, what is the
critical value that should be used?
d. Compute the test statistic and carry out the hypothesis test.
Consider the following:
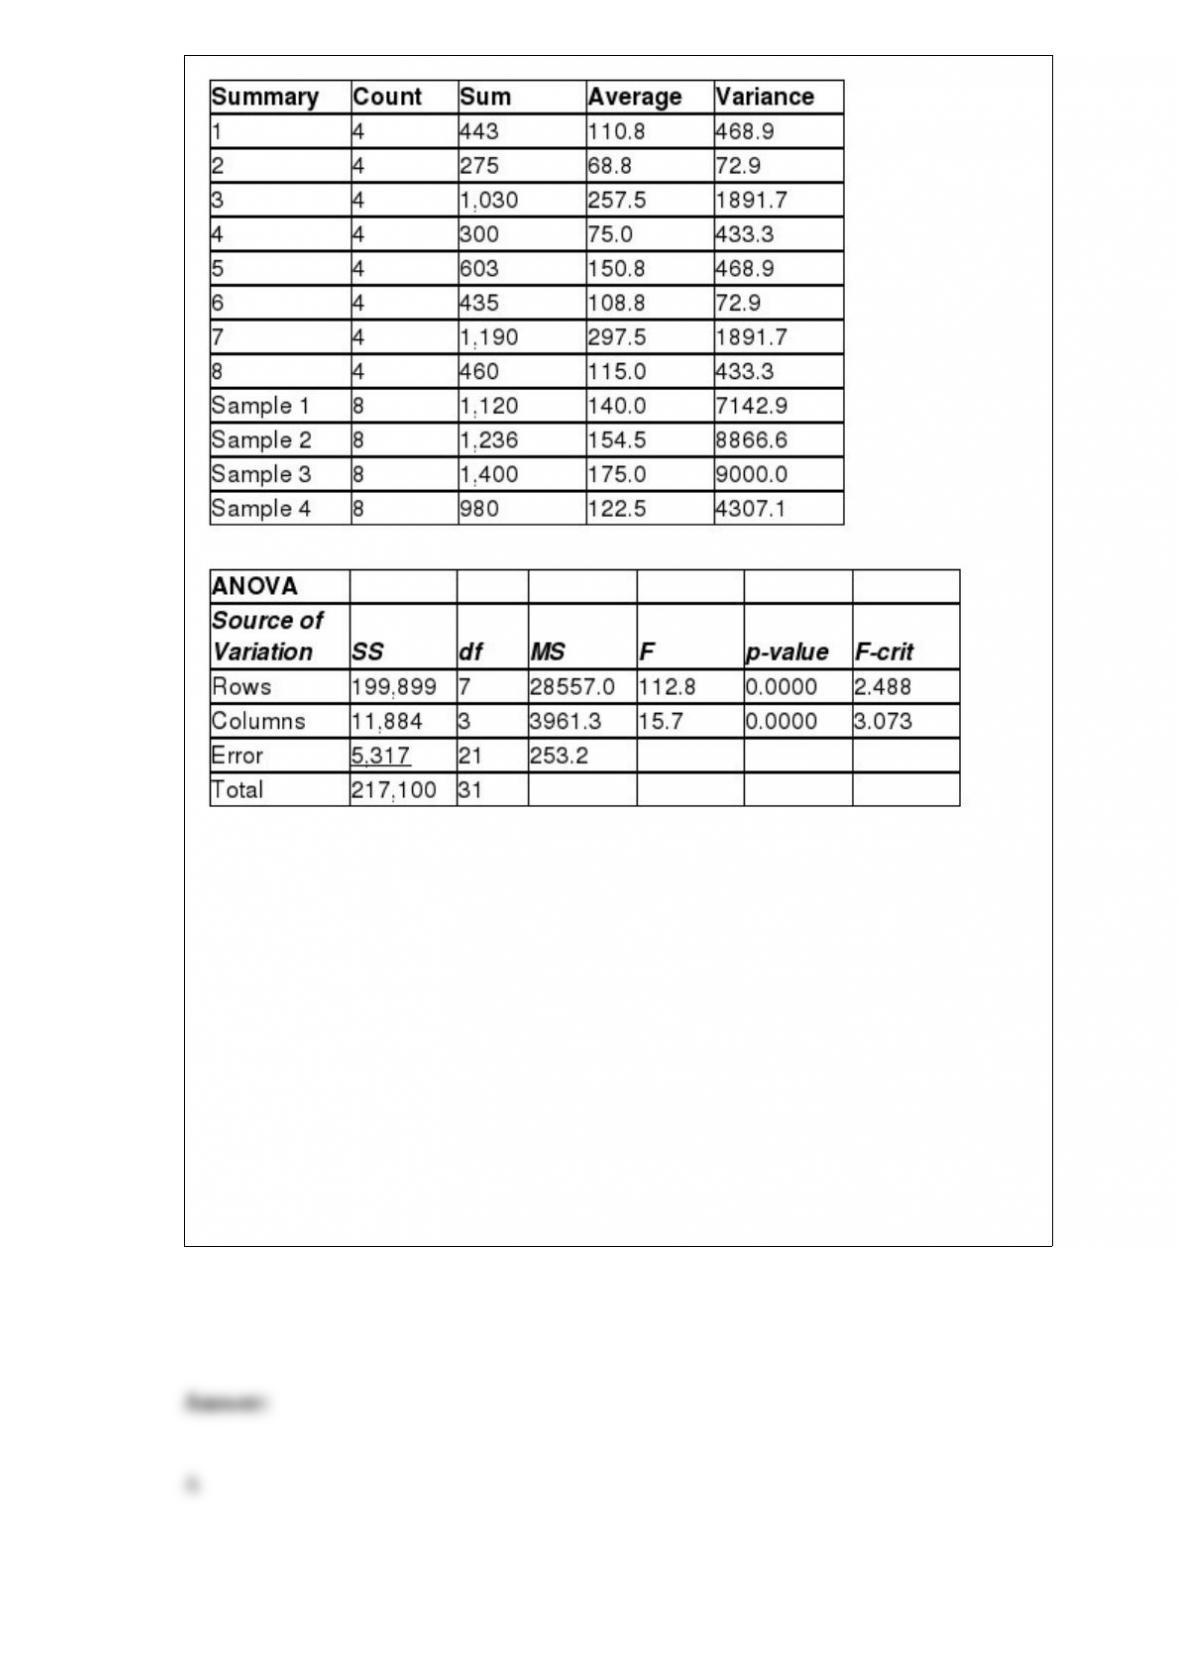
Test the main hypothesis of interest using α = 0.05
A) Because F = 15.65 > critical F = 3.0, we reject the null hypothesis and conclude that
the four populations do not have the same mean.
B) Because F = 15.65 > critical F = 3.0, we do not reject the null hypothesis and
conclude that the four populations have the same mean.
C) Because F = 125.82 > critical F = 3.0, we reject the null hypothesis and conclude
that the four populations do not have the same mean.
D) Because F = 125.82 > critical F = 3.0, we do not reject the null hypothesis and
conclude that the four populations have the same mean.

A distribution has a coefficient of variation of 65 percent and mean of 74. What is the
value of the standard deviation?
A) 0.65
B) 4810
C) 113.8
D) 48.1
Suppose that it is believed that investor returns on equity investments at a particular
brokerage house are normally distributed with a mean of 9 percent and a standard
deviation equal to 3.2 percent. What percent of investors at this brokerage house earned
at least 5 percent?
A) 89.44 percent
B) 10.56 percent
C) 39.44 percent
D) 100 percent
Weekly stock closing prices for IBM would be classified as which of the following?
A) Cross-sectional data

B) Time-series data
C) Nominal data
D) Ordinal data
A scatter diagram can be used to do which of the following?
A) Determine the trend in a variable
B) Analyze the relationship between two variables
C) Describe the basic distribution for a quantitative variable
D) Show the percentage of a variable that is associated with each category into which
that variable has been divided
The chamber of commerce in a beach resort town wants to estimate the proportion of
visitors who are repeat visitors. From previous experience they believe the portion is
not larger than 20 percent. They want to estimate the proportion to within 0.04
percentage points with 95 percent confidence. The sample size they should use is:
A) n = 601
B) n = 97

C) n = 10
D) n = 385
It is assumed that the time failures for an electronic component are exponentially
distributed with a mean of 50 hours between consecutive failures. If one extra
component is installed as a backup, what is the probability of at least one of the two
components working for at least 60 hours?
A) About 0.51
B) About 0.09
C) About 0.06
D) About 0.70
The Anderson Lumber Company has three sawmills that produce boards of different
lengths. The following table is a joint frequency distribution based on a random sample
of 1000 boards selected from the lumber inventory.
Based on these data, if three boards are selected at random, the probability that all three

were made at sawmill A is:
A) 0.037
B) 0.334
C) 1.00
D) 0.556
Scatter diagrams can be used for either quantitative or qualitative data.
A major retail store has studied customer behavior and found that the distribution of
time customers spend in a store per visit is symmetric with a mean equal to 17.3
minutes. Based on this information, which of the following is true?
A) The distribution is right-skewed.
B) The median is to the right of the mean.
C) The median is approximately 17.3 minutes.
D) The median is to the left of the mean.
If the sample value of the intercept turns out to be an illogical value, this is acceptable
as long as x = 0 is not within the range of the data.
It is believed that the SAT scores for students entering two state universities may have
different standard deviations. Specifically, it is believed that the standard deviation at
University A is greater than the standard deviation at University B. To test this using an
alpha = 0.05 level, a sample of 14 student SAT scores from University A was selected
and a sample of 8 SAT scores from University B was selected. The following sample
results were observed:
Based on this information, what is the value of the test statistic?
A) 1.2407
B) 0.6496
C) 1.5394
D) None of the above.

In performing a one-tailed test for the difference between two population variances,
which of the following statements is true?
A) The level of alpha needs to be doubled before finding the F-critical value in the
table.
B) The sample variance that is predicted to be larger in the alternative hypothesis goes
in the numerator when forming the F-test statistic.
C) You always place the larger of the two sample variances in the numerator.
D) The alternative hypothesis must contain the equality.
For ordinal data, ________ is the preferred measure of central location.
A) the mean
B) the median
C) the percentile
D) the quartile

A decision maker has five potential independent variables with which to build a
regression model to explain the variation in the dependent variable. At step 1, variable
x3 enters the regression model. Which of the following indicates which of the four
remaining independent variables will be next to enter the model?
A) The variable that has the next highest correlation with the dependent variable
B) The variable that will provide the next largest value for the slope coefficient
C) The variable with the highest coefficient of partial determination
D) Can’t be determined without seeing the correlation matrix.
Which of the following statements applies to a point estimate?
A) The point estimate is a parameter.
B) The point estimate will tend to be accurate if the sample size exceeds 30 for
non-normal populations.
C) The point estimate is subject to sampling error and will almost always be different
from the population value.
D) The point estimate is needed to determine the required sample size when estimating
the population mean.
A regional hardware chain is interested in estimating the proportion of their customers

who own their own homes. There is some evidence to suggest that the proportion might
be around 0.70. Given this, what sample size is required if they wish a 90 percent
confidence level with a margin of error of .025?
A) About 355
B) Approximately 910
C) Almost 1,300
D) 100
Which of the following in not an out of control signal for an x-bar chart?
A) One or more points outside the control limits
B) Seven or more consecutive points that all fall on the same side of the center line
C) Six or more consecutive points moving in the same direction (an upward or
downward trend)
D) Fourteen points in a row, alternating up and down