1) the three most important sources of federal tax revenue in order of descending
importance are:
a.sales, payroll, and personal income taxes.
b.personal income, corporate income, and sales taxes.
c.personal income, corporate income, and payroll taxes.
d.personal income, payroll, and corporate income taxes.
2) which type of goods is most adversely affected by recessions?
a.goods for which the income elasticity coefficient is relatively low or negative.
b.goods for which the income elasticity coefficient is relatively high and positive.
c.goods for which the cross-price elasticity coefficient is positive.
d.goods for which the cross-price elasticity coefficient is negative.
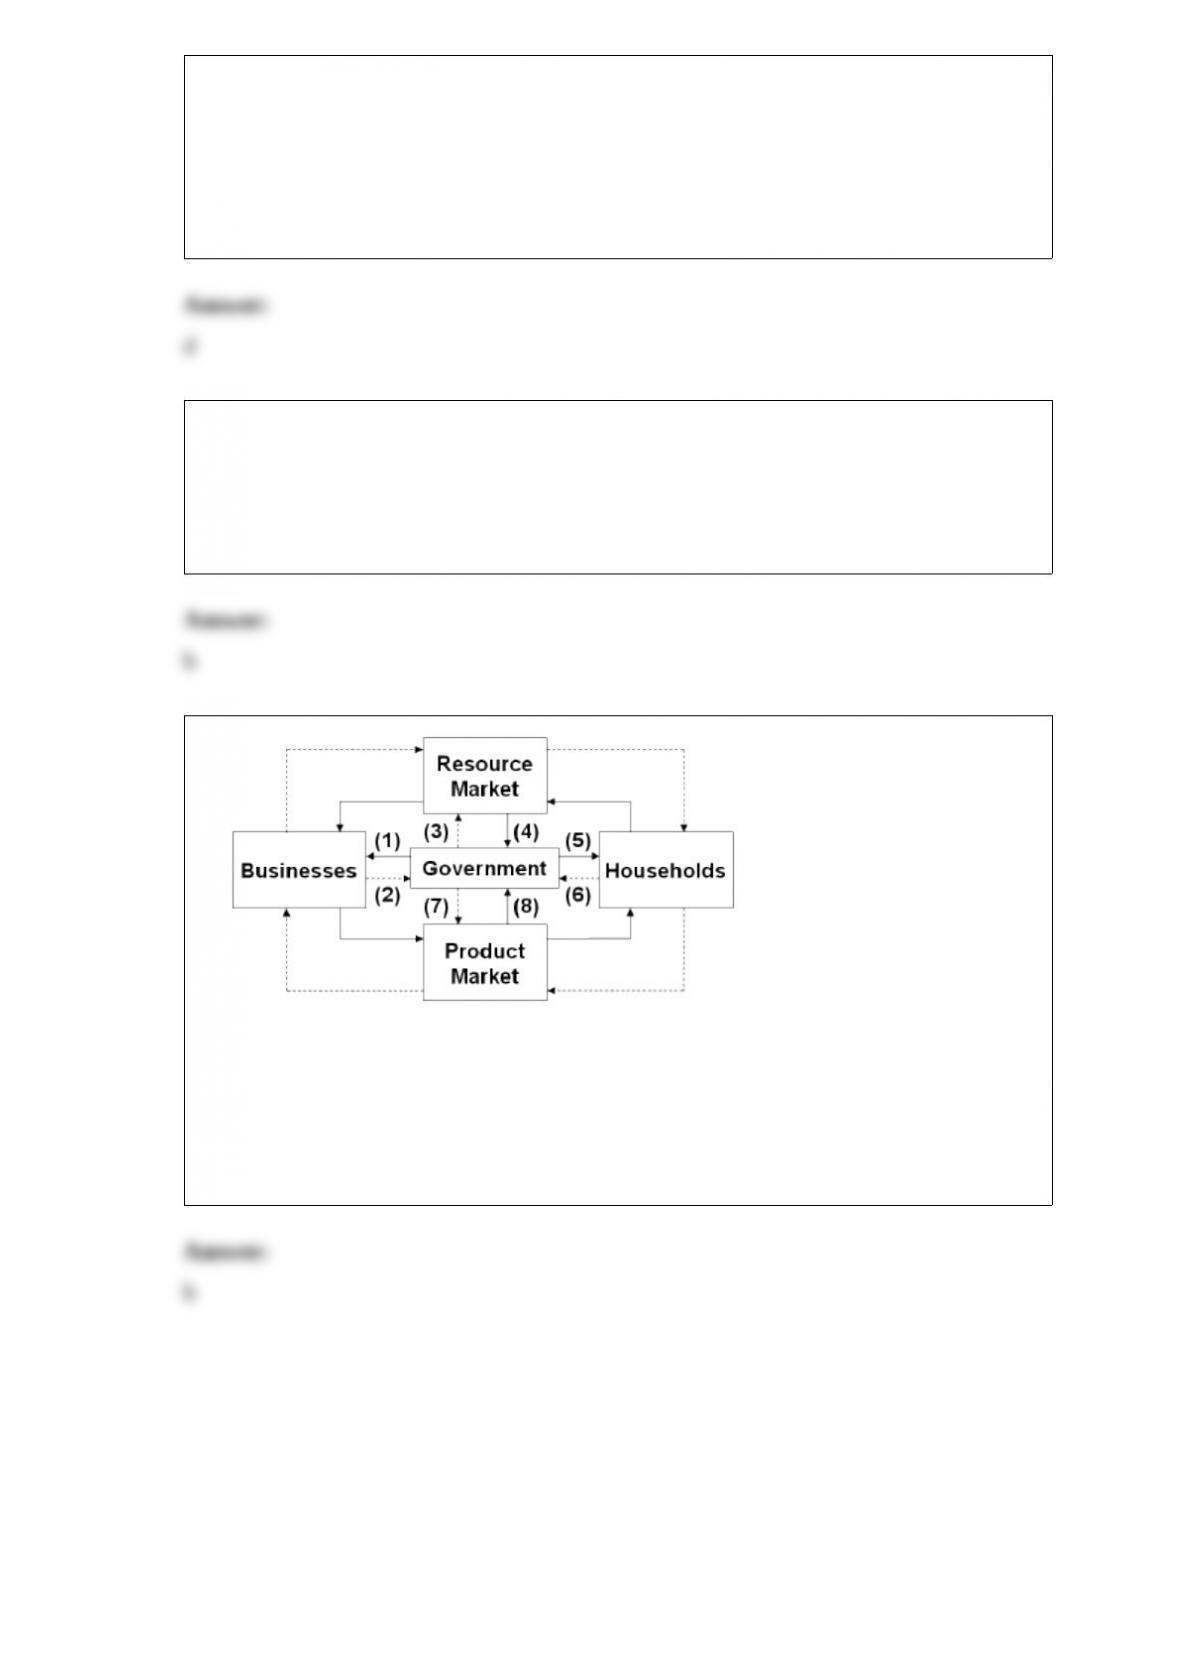
3)
refer to the above diagram, in which solid arrows reflect real flows; broken arrows are
monetary flows. flow (5) might represent:
a.personal income tax revenues.
b.the provision of public schools by local governments.
c.the purchase of laptop computers by the state of iowa.
d.transfer payments to unemployed workers.
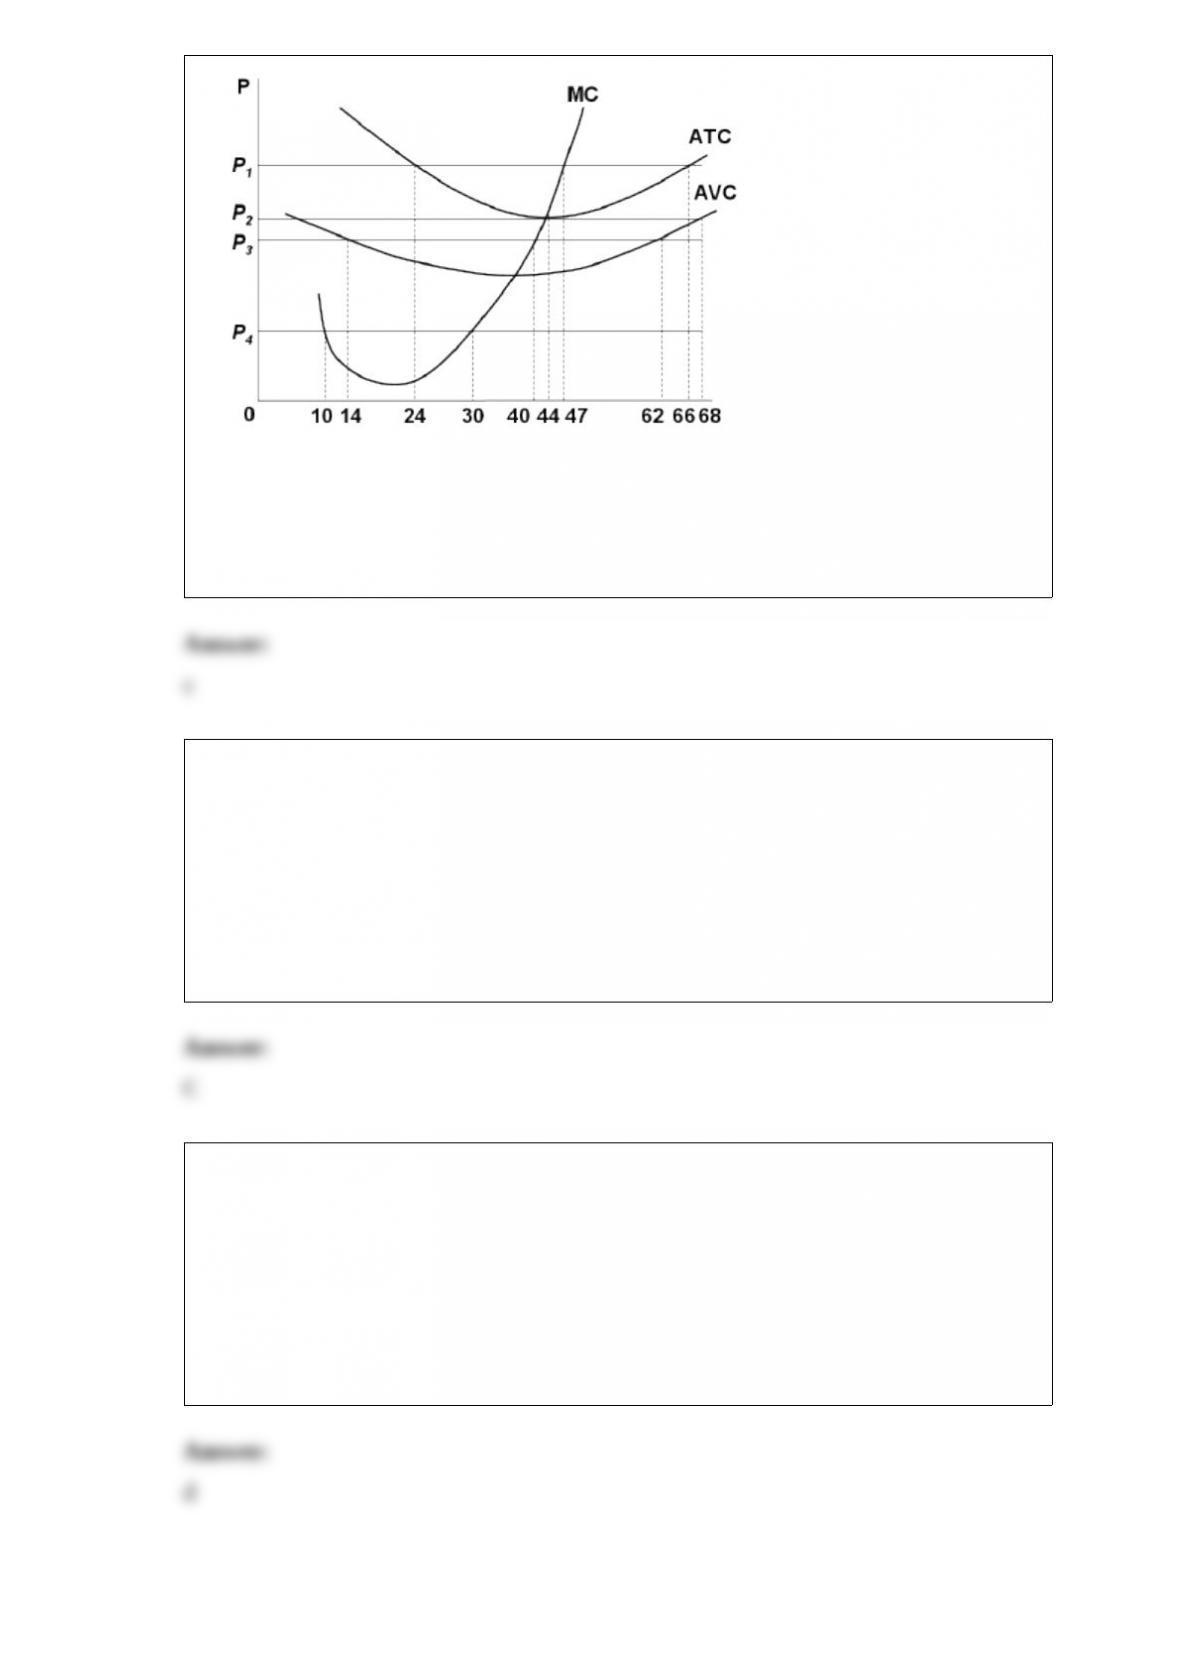
4)
refer to the above diagram. at p3, this firm will:
a.produce 14 units and realize an economic profit.
b.produce 62 units and earn only a normal profit.
c.produce 40 units and incur a loss.
d.shut down in the short run.
5) Which of the following statements is correct?
A.The price support program hastened the exodus of resources from agriculture.
B.The main beneficiaries of government price support assistance were the very
low-income farmers.
C.If the demand for agricultural products is inelastic, a relatively small decrease in
supply will increase gross farm incomes.
D.There is a misallocation of resources in rural America because of absolute and
relative increases in the size of the farm population.
6) which of the following statements is correct?
a.average total cost is the difference between average variable cost and average fixed
cost.
b.marginal cost measures the cost per unit of output associated with any level of
production.
c.when marginal product rises, marginal cost must also rise.
d.marginal cost is the price or cost of an extra variable input (for example, an additional
worker) divided by its marginal product.
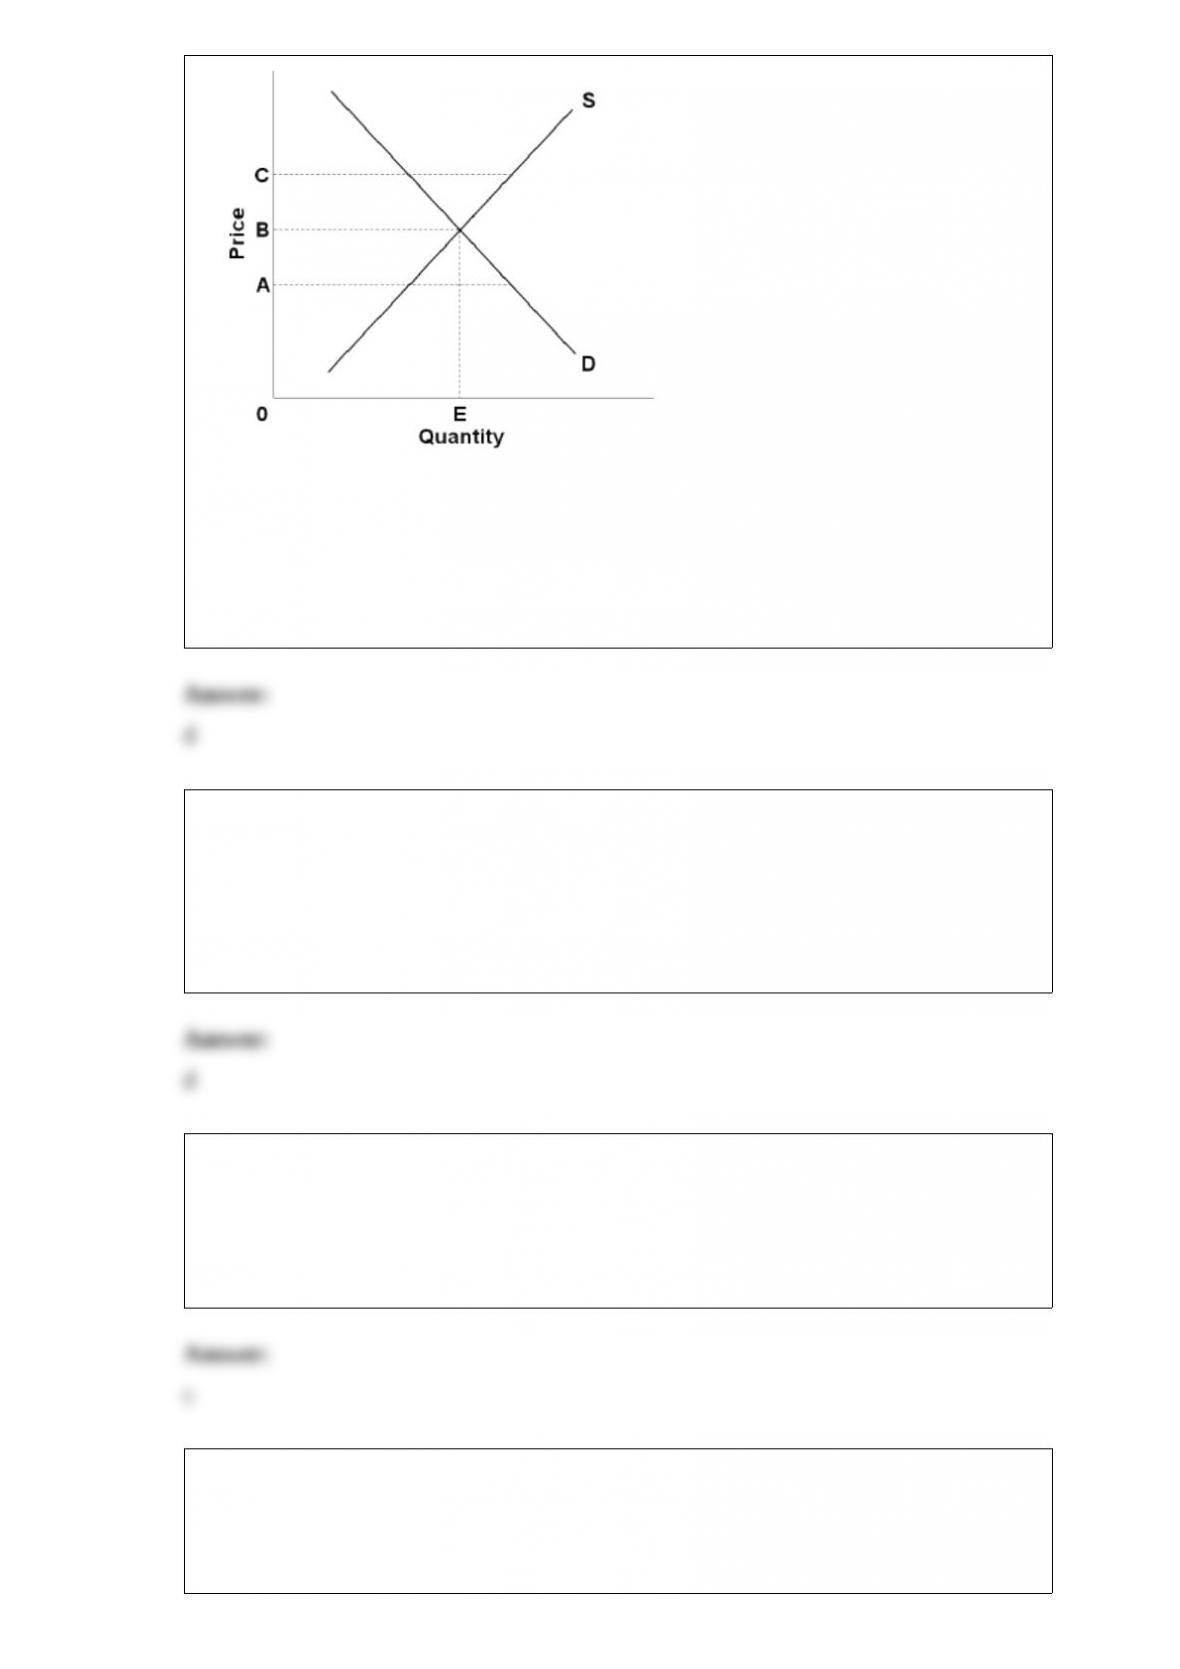
7)
refer to the above diagram. a government-set maximum permissible interest rate is best
illustrated by:
a.price b.
b.quantity e.
c.price c.
d.price a.
8) if the secular trend of labor productivity is 3 percent per year, the number of years
that it will take for the standard of living to double will be about:
a.15 years.
b.17 years.
c.20 years.
d.23 years.
9) when a firm is on the inelastic segment of its demand curve, it can:
a.increase total revenue by reducing price.
b.decrease total costs by decreasing price.
c.increase profits by increasing price.
d.increase total revenue by more than the increase in total cost by increasing price.
10) refer to the above diagram. if this industry is comprised of only one seller, the
profit-maximizing price and quantity will be:
a.p3 and q3
b.p1 and q1
c.p2 and q2
d.indeterminate on the basis of the information given
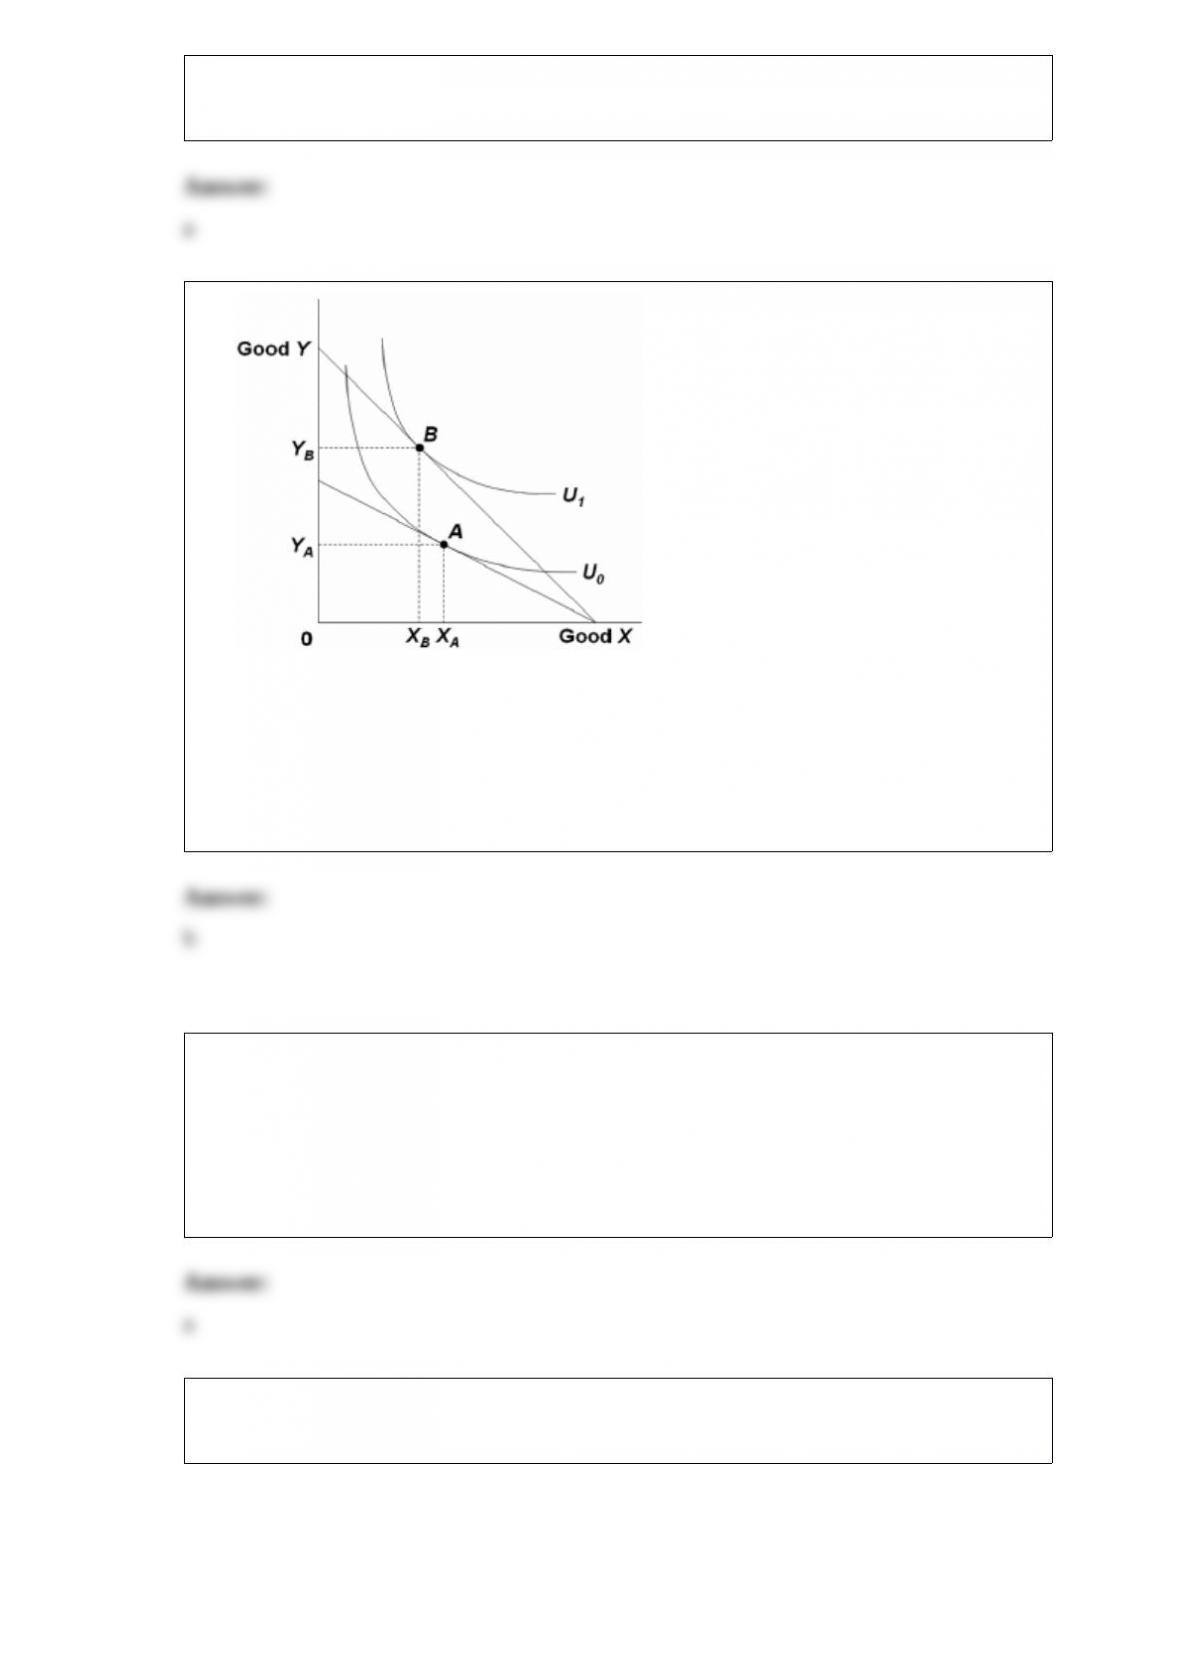
11)
refer to the above diagram. suppose the budget line shifts so that the consumer’s
equilibrium changes from point a to point b. this means that the:
a.price of y has increased.
b.price of y has decreased.
c.price of x has increased.
d.consumer’s money income has increased.
12) if the dollar price of one yen is $.04, a japanese good priced at 560 yen would cost
an american:
a.$22.40.
b.$2240.
c.$14,000.
d.$2.40.
13) the following data confronting a firm:
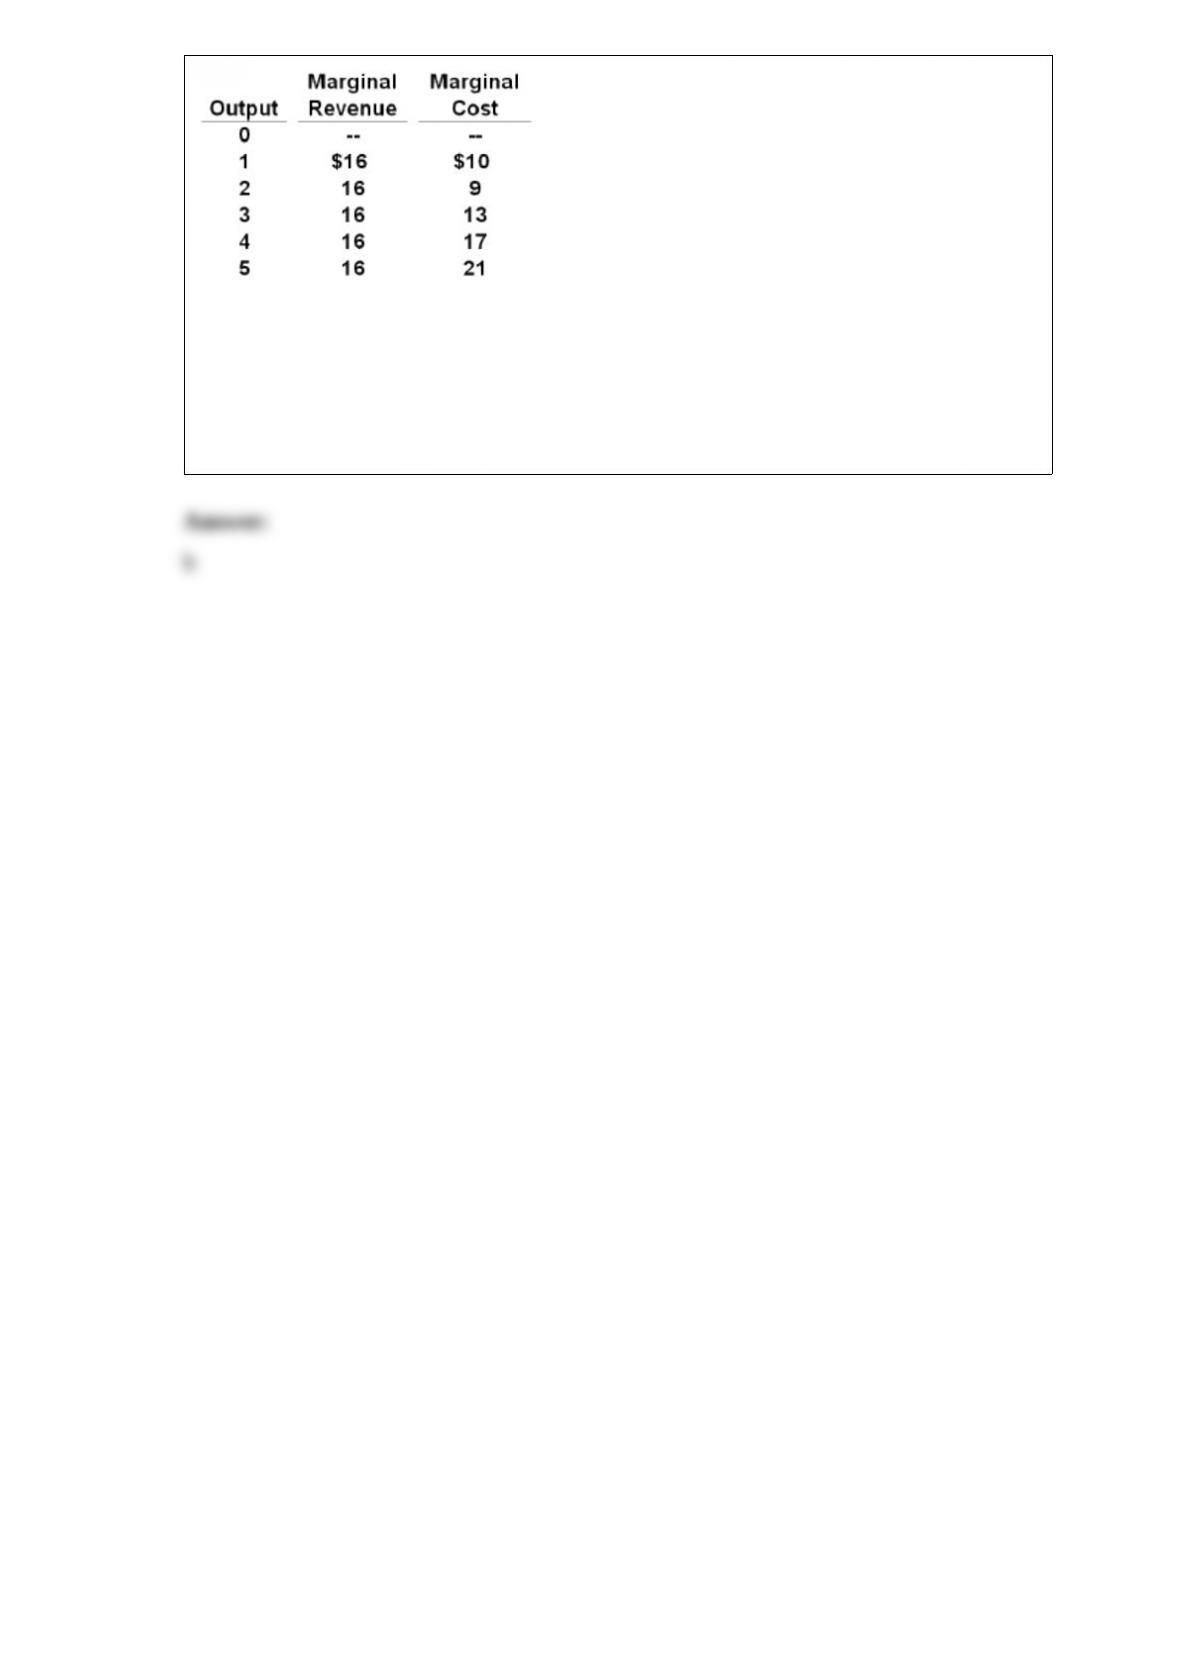
refer to the above data. if the firm’s minimum average variable cost is $10, the firm’s
profit-maximizing level of output would be:
a.2.
b.3.
c.4.
d.5.