
If events A and B are mutually exclusive, then P(A|B) is always equal to zero.
The binomial experiment consists of n independent, identical trials, each of which
results in either success or failure and is such that the probability of success on any trial
is the same.
The level of significance, α, indicates the probability of rejecting a false null
hypothesis.
Bayes’ Theorem uses prior probabilities with additional information to compute
posterior probabilities.

Sampling error can occur because of incomplete information.
A sample size of 500 is sufficiently large to conclude that the sampling distribution of
is a normal distribution, when the estimate of the population proportion is .995.
Chebyshev’s Theorem is only of practical use when analyzing a non-mound-shaped
population that is not very skewed.

We are testing H0: μ ≥ 22; versus HA: μ < 22. Given α = .01, n = 100, = 21.431, and σ
= 1.295, we should not reject H0.
A recording error is an error of observation.
We are testing H0: μ ≤ 8; versus HA: μ > 8. Given α = .01, n = 25, = 8.112, and s = .16,
we should reject the H0. (Assume the sample is selected from a normally distributed
population.)
The number of defective pencils in a lot of 1000 is an example of a continuous random
variable.

Neural network modeling represents the response variable as a linear function of the
predictor variables.
Stratification can at times be combined with multistage cluster sampling to develop an
appropriate sample.
The maximin criterion finds the best possible payoff for each alternative and then
chooses the alternative that yields the maximum payoff.

The correlation coefficient is the ratio of explained variation to total variation.
The mean and median are the same for a normal distribution.
A uniform distribution f(x) is a continuous probability distribution, which says the
probability that x is in any 2 intervals of equal length is the same.
When using simple regression analysis, if there is a strong correlation between the

independent and dependent variables, then we can conclude that an increase in the
value of the independent variable causes an increase in the value of the dependent
variable.
In a regression model, at any given combination of values of the independent variables,
the population of potential error terms is assumed to have an F distribution.
In simple regression analysis, r2 is a percentage measure and measures the proportion
of the variation explained by the simple linear regression model.

The pth percentile is a value such that (100−p) percent of the measurements fall at or
below the value.
A tolerance interval is always longer than a corresponding confidence interval.
The notation Ŷ refers to the average value of the dependent variable Y.

If there are seven classes in a frequency distribution, then the fourth class will always
contain the median.
A single-layer perceptron neural network model consists of one layer called the hidden
layer.
Based on a random sample of 25 units of product X, the average weight is 102 lb and
the sample standard deviation is 10 lb. We would like to decide whether there is enough
evidence to establish that the average weight for the population of product X is greater
than 100 lb. Assume the population is normally distributed. Therefore, one way of
expressing the null hypothesis is H0: μ = 100.

In a 2-way ANOVA, treatment is considered to be a combination of a level of factor 1
and a level of factor 2.
Processes produce outputs over time.
If the sample size n is infinitely large, then s2 is an unbiased estimator of σ2.
When the level of confidence and the sample size remain the same, a confidence
interval for a population mean μ will be wider when the sample standard deviation s is
small than when s is large.

The internal auditing staff of a local lawn-service company performs a sample audit
each quarter to estimate the proportion of accounts that are current (between 0 and 60
days after billing). The historical records show that over the past 8 years 70 percent of
the accounts have been current. Determine the sample size needed in order to be 99
percent confident that the sample proportion of the current customer accounts is within .
03 of the true proportion of all current accounts for this company.
A. 1842
B. 1549
C. 897
D. 632
E. 1267
As standard deviation increases, sample size _____________ to achieve a specified
level of confidence.
A. increases
B. decreases
C. remains the same

The point estimate of the _______________ is the positive square root of the sample
variance.
A. sample mean
B. sample standard deviation
C. range
D. median
E. population standard deviation
A very insignificant independent variable (an independent variable that has a very weak
relationship with the dependent variable) is added to a multiple regression equation. As
a result of this change, the value of the explained variation (SSR) will _________, the
value of the multiple coefficient of determination ( ) will _________, and the
calculated value of the F statistic will most likely _________.
A. decrease, increase, decrease
B. increase, decrease, decrease
C. increase, increase, increase
D. increase, increase, decrease
E. decrease, decrease, decrease

At a college, 70 percent of the students are women, and 50 percent of the students
receive a grade of C. 25 percent of the students are neither female nor C students. Use
this contingency table.
What is the probability that a student is female and a C student?
A. .45
B. .50
C. .70
D. .25
E. .05
A sample of 100 items has a population standard deviation of 5.1 and a mean of 21.6.
Construct a 95 percent confidence interval for μ.
A. [11.60, 31.60]
B. [21.16, 22.04]
C. [20.60, 22.60]
D. [20.76, 22.43]

Recently an advertising company called 200 people and asked them to identify the
company that was in an ad running nationwide. The following results were obtained.
What percentage of those surveyed were female and could not recall the company?
A. 40.0
B. 22.0
C. 52.4
D. 66.7
E. 37.9
The ____________________criterion for choosing among alternative actions assumes
that the state of nature with the worst payoff will be experienced.
A. maximin
B. certainty
C. maximax
D. decision

If successive values of the residuals are close together, then there is a ___________
autocorrelation and the value of the Durbin-Watson statistic is _________.
A. negative, large
B. positive, small
C. negative, small
D. positive, large
In a simple linear regression analysis, the correlation coefficient (a) and the slope (b)
___________ have the same sign.
A. always
B. sometimes
C. never
The requirement that the probability of success remains constant from trial to trial is a
property of the _______________ distribution.

A. binomial
B. Poisson
C. hypergeometric
D. continuous
Assumptions of a regression model can be evaluated by plotting and analyzing the
____________.
A. independent variables
B. dependent variables
C. error terms
D. beta values
The local amusement park was interested in the average wait time at their most popular
roller coaster at the peak park time (2 p.m.). They selected 13 patrons and had them get
in line between 2 and 3 p.m. Each was given a stopwatch to record the time they spent
in line. The times recorded were as follows (in minutes).
118, 124, 108, 116, 99, 120, 148, 118, 119, 121, 45, 130, 118
What is the first quartile?
A. 100.8

B. 118
C. 130
D. 116
E. 45
If the random variable of x is normally distributed, _____ percent of all possible
observed values of x will be within two standard deviations of the mean.
A. 99.73
B. 68.26
C. 95.00
D. 95.44
A batch of 50 parts contains 6 defects. If two parts are drawn randomly, one at a time,
and tested, what is the probability that both parts are defective?
A. 0.014
B. 0.012
C. 0.120
D. 0.102

E. 0.222
The term big data was derived from the use of survey data.
Data collected for a particular study are referred to as a data ____________.
A. variable
B. measurement
C. set
D. element

If the Durbin-Watson statistic is greater than (4 − dL), then we conclude that
A. there is significant positive autocorrelation.
B. there is significant negative autocorrelation.
C. there is significant autocorrelation, but we cannot identify whether it is positive or
negative.
D. the test result is inconclusive.
An experiment was conducted to determine the effectiveness of a method designed to
remove oil wastes found in soil. Three contaminated soil samples were treated. After 95
days, the percentage of contamination removed from each soil sample was measured,
with a mean of 49.3 percent and a standard deviation of 1.5 percent. Estimate the mean
percentage of contamination removed at a 98 percent confidence level.
A. [48.36, 50.24]
B. [43.27, 55.33]
C. [47.29, 51.31]
D. [47.88, 50.72]
E. [46.47, 52.13]

A manufacturer of windows produces one type that has a plastic coating. The
specification limits for the plastic coating are 30 and 70. From time to time the plastic
coating can become uneven. Therefore, in order to keep the coating as even as possible,
thickness measurements are periodically taken at four different locations on the
window. 15 subgroups were observed, each consisting of four thickness measurements,
with the following results: mean of the means = = 50.05, and average range = 8.85.
Calculate the control limits for the X-bar chart.
A. [41.2, 58.9]
B. [48.1, 52.0]
C. [43.6, 56.5]
D. [29.9, 70.2]
The weight of a product is measured in pounds. A sample of 50 units is taken from a
recent production. The sample yielded = 75 lb, and we know that σ2 = 100 lb.
Calculate a 90 percent confidence interval for μ.
A. [73.19, 76.81]
B. [51.74, 98.26]
C. [72.67, 77.33]
D. [67.50, 82.50]

College entrance exam scores, such as SAT scores, are an example of a(n)
_____________ variable.
A. ordinal
B. ratio
C. nominative
D. interval
Suppose that the times required for a cable company to fix cable problems in the homes
of its customers are uniformly distributed between 40 minutes and 65 minutes. What is
the probability that a randomly selected cable repair visit will take at least 50 minutes?
A. .77
B. .40
C. .60
D. .23

According to Chebyshev’s Theorem, at least what proportion of the data will be within
μ kσ for k = 1.6?
A. 39%
B. 58%
C. 68%
D. 61%
E. 92%
If P(A) > 0 and P(B) > 0 and events A and B are independent, then ____________.
A. P(A) = P(B)
B. P(A|B) = P(A)
C. P(A∩B) = 0
D. P(A∩B) = P(A) P(BυA)
If x is a binomial random variable, then the standard deviation of x is given by
A. np.
B. (npq)2.
C. √npq.

D. npq.
It has been reported that the average time to download the home page from a
government website was 0.9 seconds. Suppose that the download times were normally
distributed with a standard deviation of 0.3 seconds. If random samples of 36 download
times are selected, calculate the mean of the sampling distribution of the sampling
mean.
A. 0.3
B. 0.15
C. 0.9
D. 0.05
All of the following are measures of central tendency except the ____________.
A. range
B. mode
C. mean
D. median

A coin is tossed 6 times. What is the probability that at least one head occurs?
A. 63/64
B. 1/64
C. 1/36
D. 5/6
E. 1/2
The binomial distribution is characterized by situations that are analogous to
A. drawing balls from an urn.
B. coin tossing.
C. counting defects on an item.
D. measuring the length of an item.

Consider the following partial computer output from a simple linear regression analysis.
Calculate the correlation coefficient.
Five years ago, the average starting salary of a new college graduate with a major in
marketing was $34,000. A random sample of 10 graduates from this year’s graduating
class of a local university yielded the following starting salaries in thousands of dollars:
28, 36, 25, 37, 35, 24, 38, 45, 39, 36. The local university wants to determine if the
median starting salary for marketing graduates has increased in the last five years.
Assume that the population of starting salaries in marketing is not normally distributed.
Using α = .05, can we conclude that the starting salaries increased in the last five years?
A. Reject the null hypothesis.
B. Do not reject the null hypothesis.
The AAA Co. is interested in the level of satisfaction of their employees with the

benefit package that they offer compared to their major competitors. A consultant hired
to conduct the satisfaction survey told AAA Co. that the distribution of level of
satisfaction at other companies is displayed below.
Very Satisfied 5%
Satisfied 30%
Neutral 20%
Dissatisfied 40%
Very Dissatisfied 5%
A survey of 125 AAA employees gave the following results.
Very Satisfied 15
Satisfied 52
Neutral 20
Dissatisfied 30
Very Dissatisfied 8
Total 125
What is the null hypothesis to test if the distribution of satisfaction is the same at AAA
as at their competitors?
Consider a two-way analysis of variance experiment with treatment factors A and B.
The results are summarized below.
Source of Variation df SS
Factor A 4 86

Factor B 5 75
Interaction 20 75
Error 90 300
Total 119 536
If there are an equal number of observations in each cell, what is the number of
observations in each cell? (number of cells = level of factor A level of factor B)
Consider the following partial analysis of variance table from a randomized block
design with 6 blocks and 4 treatments.
Source Sum of Squares
Treatments 15.93
Blocks 42.09
Error 23.84
Total 81.86
Calculate the degrees of freedom for blocks.
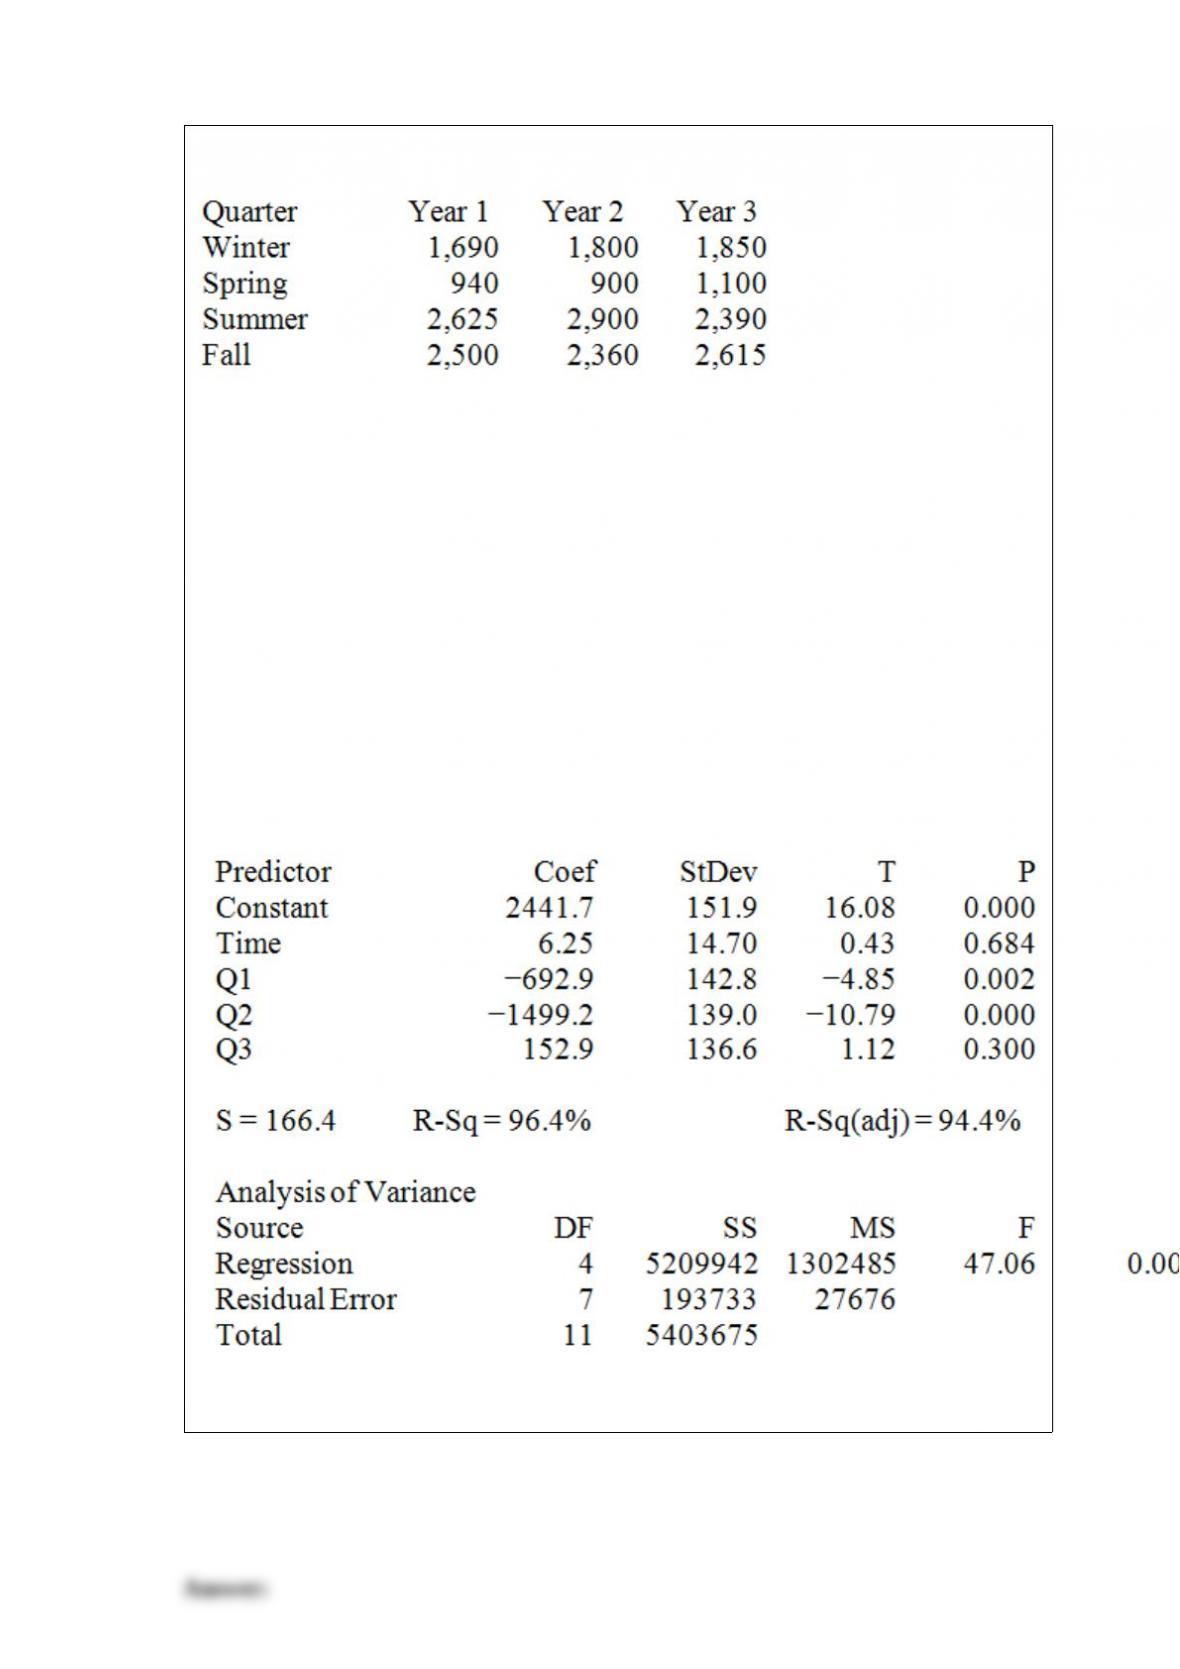
Consider the following set of quarterly sales data, given in thousands of dollars.
The following dummy variable model that incorporates a linear trend and constant
seasonal variation was used: y(t) = B0 + B1t + BQ1(Q1) + BQ2(Q2) + BQ3(Q3) + Et. In
this model, there are 3 binary seasonal variables (Q1, Q2, and Q3), where Qi is a binary
(0,1) variable defined as:
Qi = 1, if the time series data is associated with quarter i;
Qi = 0, if the time series data is not associated with quarter i.
The results associated with this data and model are given in the following Minitab
computer output.
The regression equation is
Sales = 2442 + 6.2 Time − 693 Q1 − 1499 Q2 + 153 Q3
Provide a managerial interpretation of the regression coefficient for the variable “time.”

An experiment was performed on a certain metal to determine if the strength is a
function of heating time. Results based on 10 metal sheets are given below. Use the
simple linear regression model.
Calculate the coefficient of determination.

The price and quantity of several food items are listed below for the years 1990 and
2000.
Compute the Laspeyres index, using 1990 as the base year.

Consider a two-way analysis of variance experiment with treatment factors A and B,
with factor A having four levels and factor B having three levels. The results are
summarized below.
Source of Variation df SS
Factor A 71
Factor B 63
Interaction 50
Error 280
Total 71 446
Calculate the degrees of freedom for factor A and factor B.
Block
Treatment 1 2 3 4 Treatment Mean
Tr1 2 1 2 3 2
Tr2 4 4 1 1 2.5
Tr3 3 4 3 2 3
Block Mean 2 3 3 2 overall mean = 2.5
Consider the randomized block design with 4 blocks and 3 treatments given above.
What is the block sum of squares?

Consider a two-way analysis of variance experiment with treatment factors A and B,
with factor A having four levels and factor B having three levels. The results are
summarized below.
Source of Variation df SS
Factor A 71
Factor B 63
Interaction 50
Error 280
Total 71 446
Calculate the degrees of freedom for the error term.
Consider the 3 x 2 contingency table below.
Compute the expected frequencies in row 2.
A major airline company is concerned that its proportion of late arrivals has
substantially increased in the past month. Historical data shows that on average 18
percent of the company airplanes have arrived late. In a random sample of 1,240
airplanes, 310 airplanes have arrived late. If we are conducting a hypothesis test using
the critical value rule to determine if the proportion of late arrivals has increased, what
is the value of the calculated test statistic?
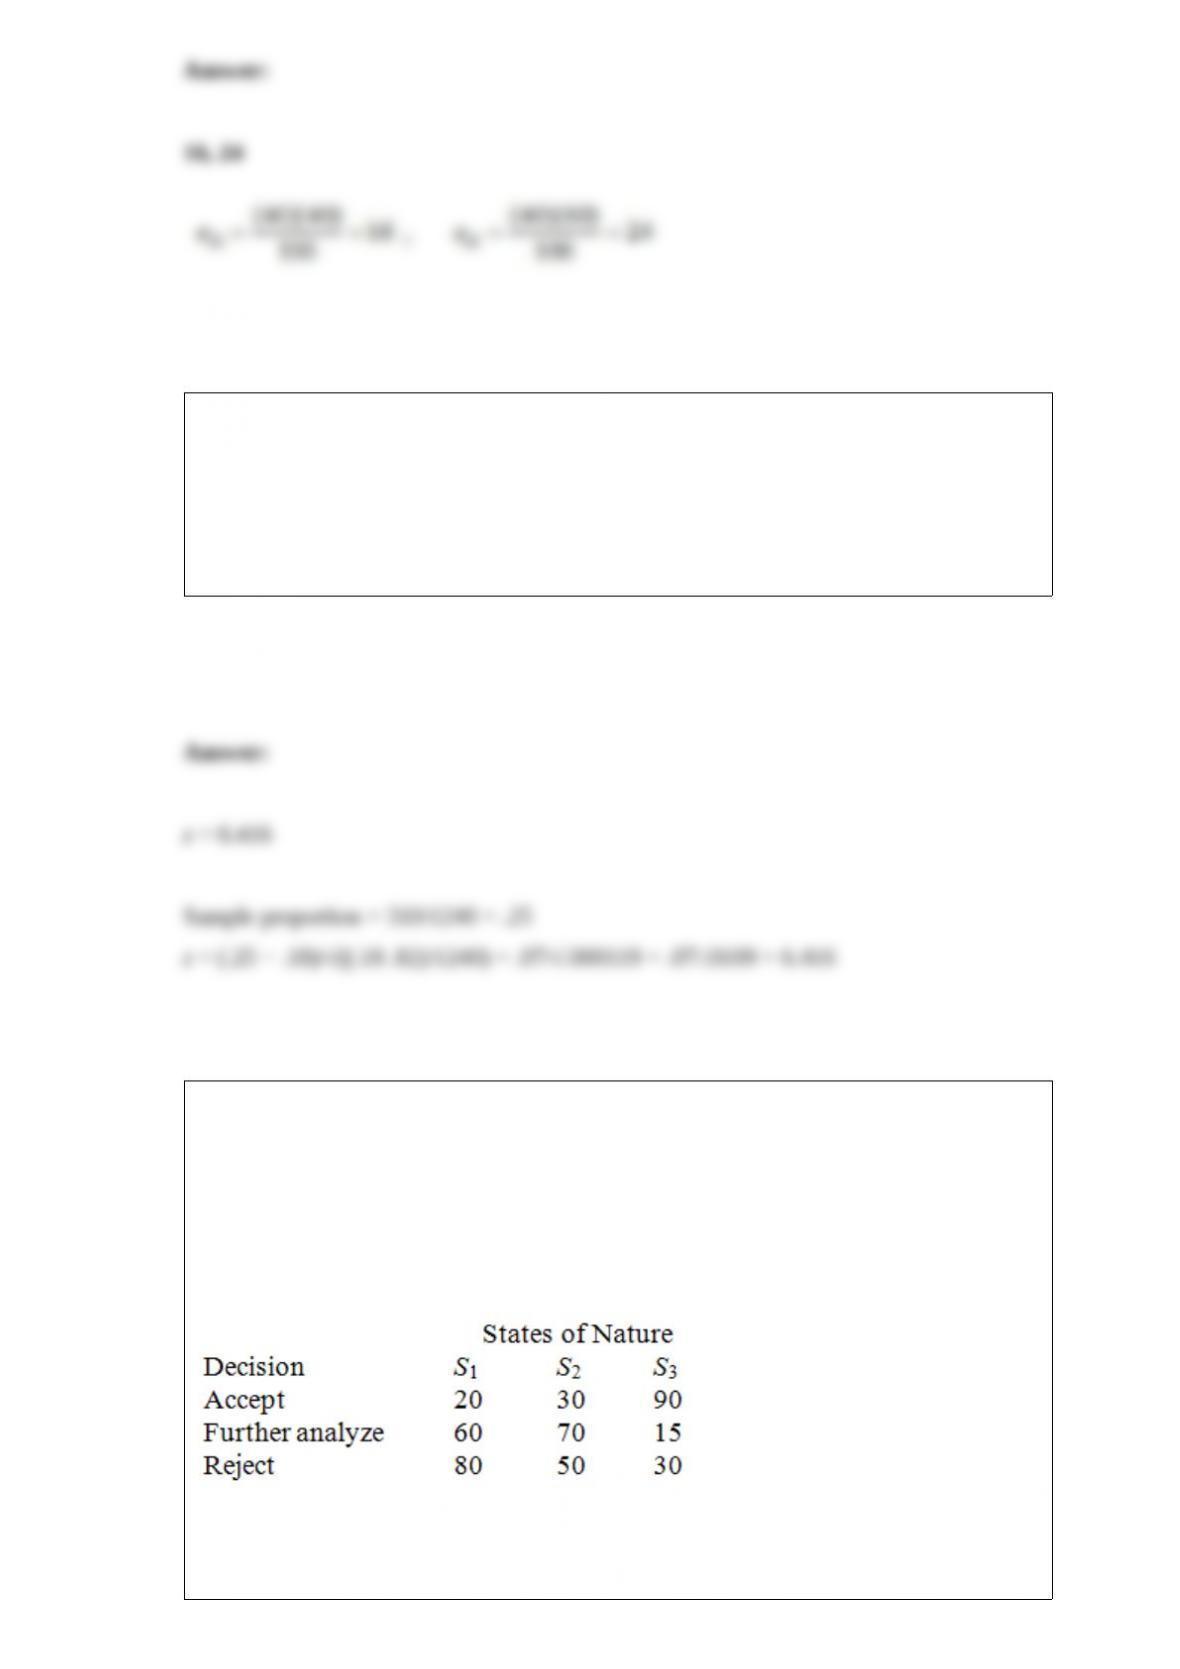
The quality control manager for NKA Inc. must decide whether to accept (alternative
1), further analyze (alternative 2), or reject (alternative 3) an incoming shipment (lot) of
microchips. The historical data indicate that there is a 30 percent chance that the lot is
poor quality (S1), 50 percent chance that the lot is fair quality (S2), and 20 percent
chance that the lot is good quality (S3). Assume the following payoff table is available.
The values in the payoff table are in thousands of dollars.
Based on historical data, if the lot is poor quality, 40 percent of the items are defective.
If the lot is fair quality, 22 percent of the items are defective. If the lot is good quality,
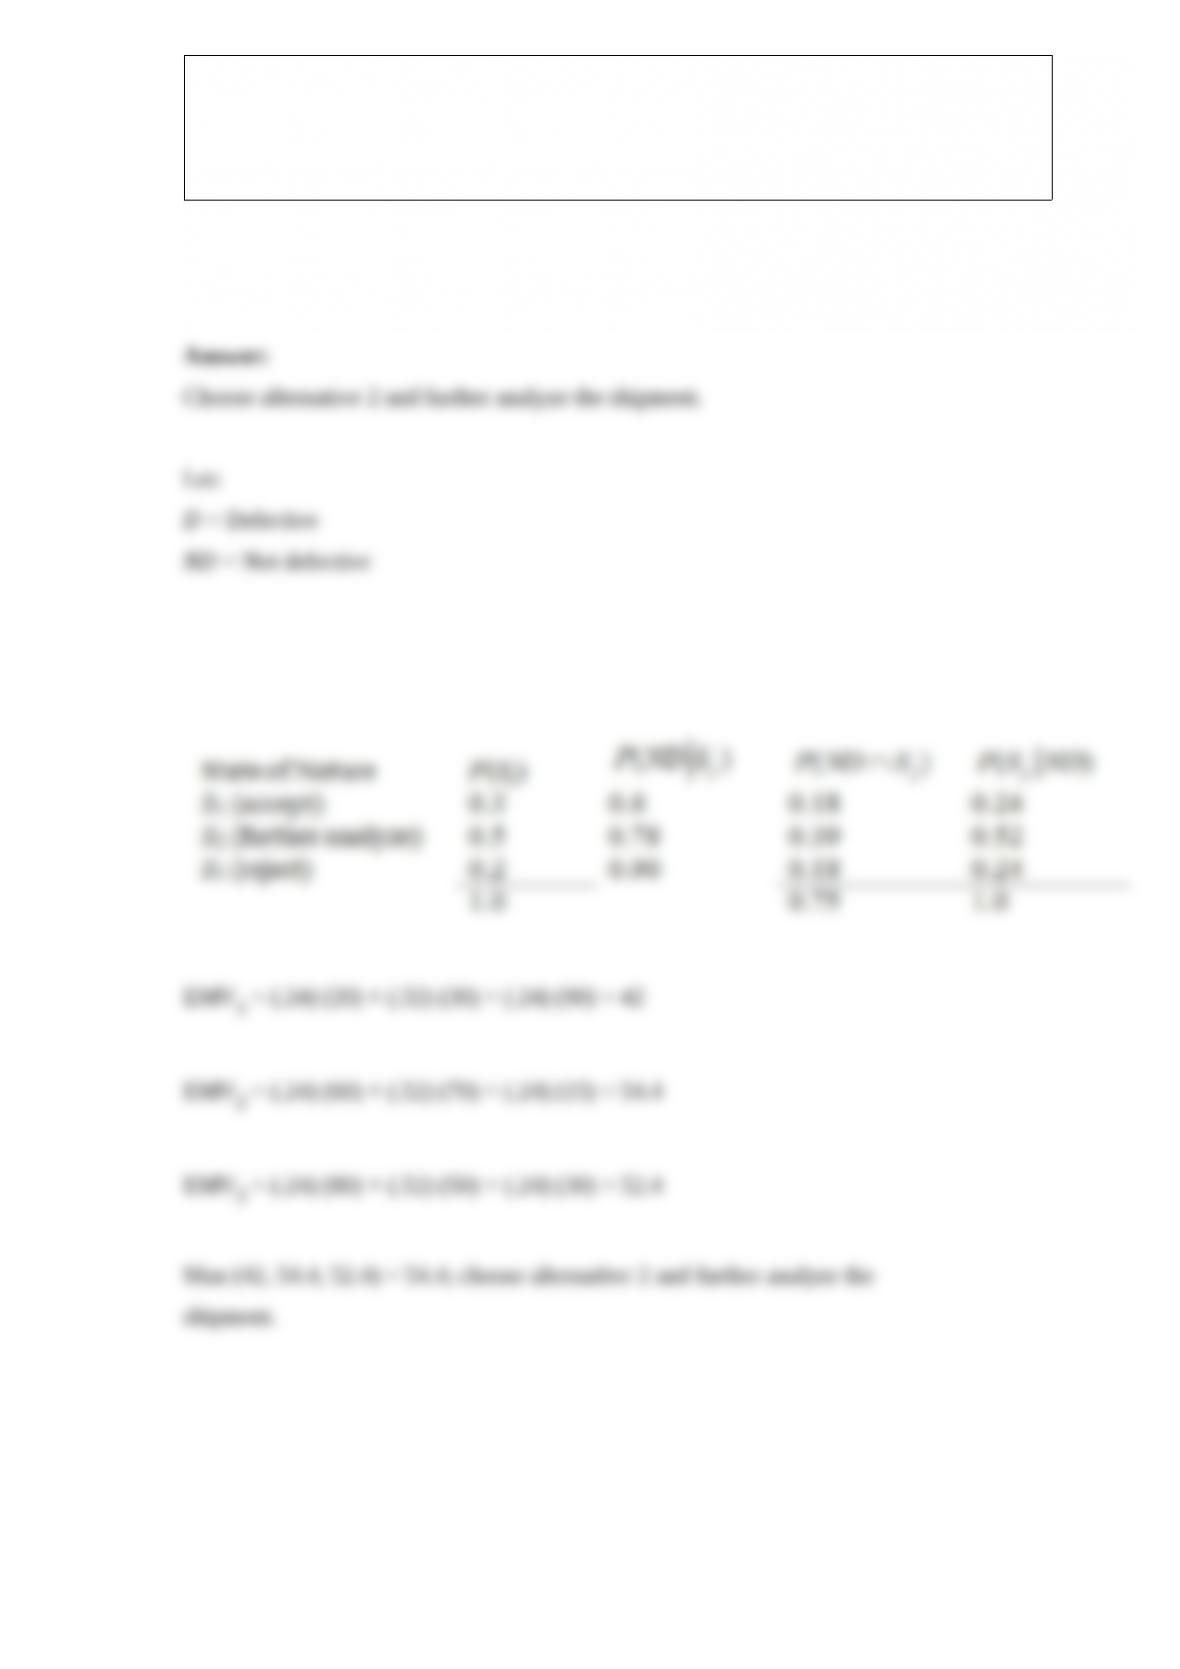
10 percent of the items are defective. The quality control manager inspects one unit
from a recent shipment. After inspecting it, he determines that the unit is not defective.
Given that the inspected item is not defective, determine which alternative action the
quality control manager should choose.