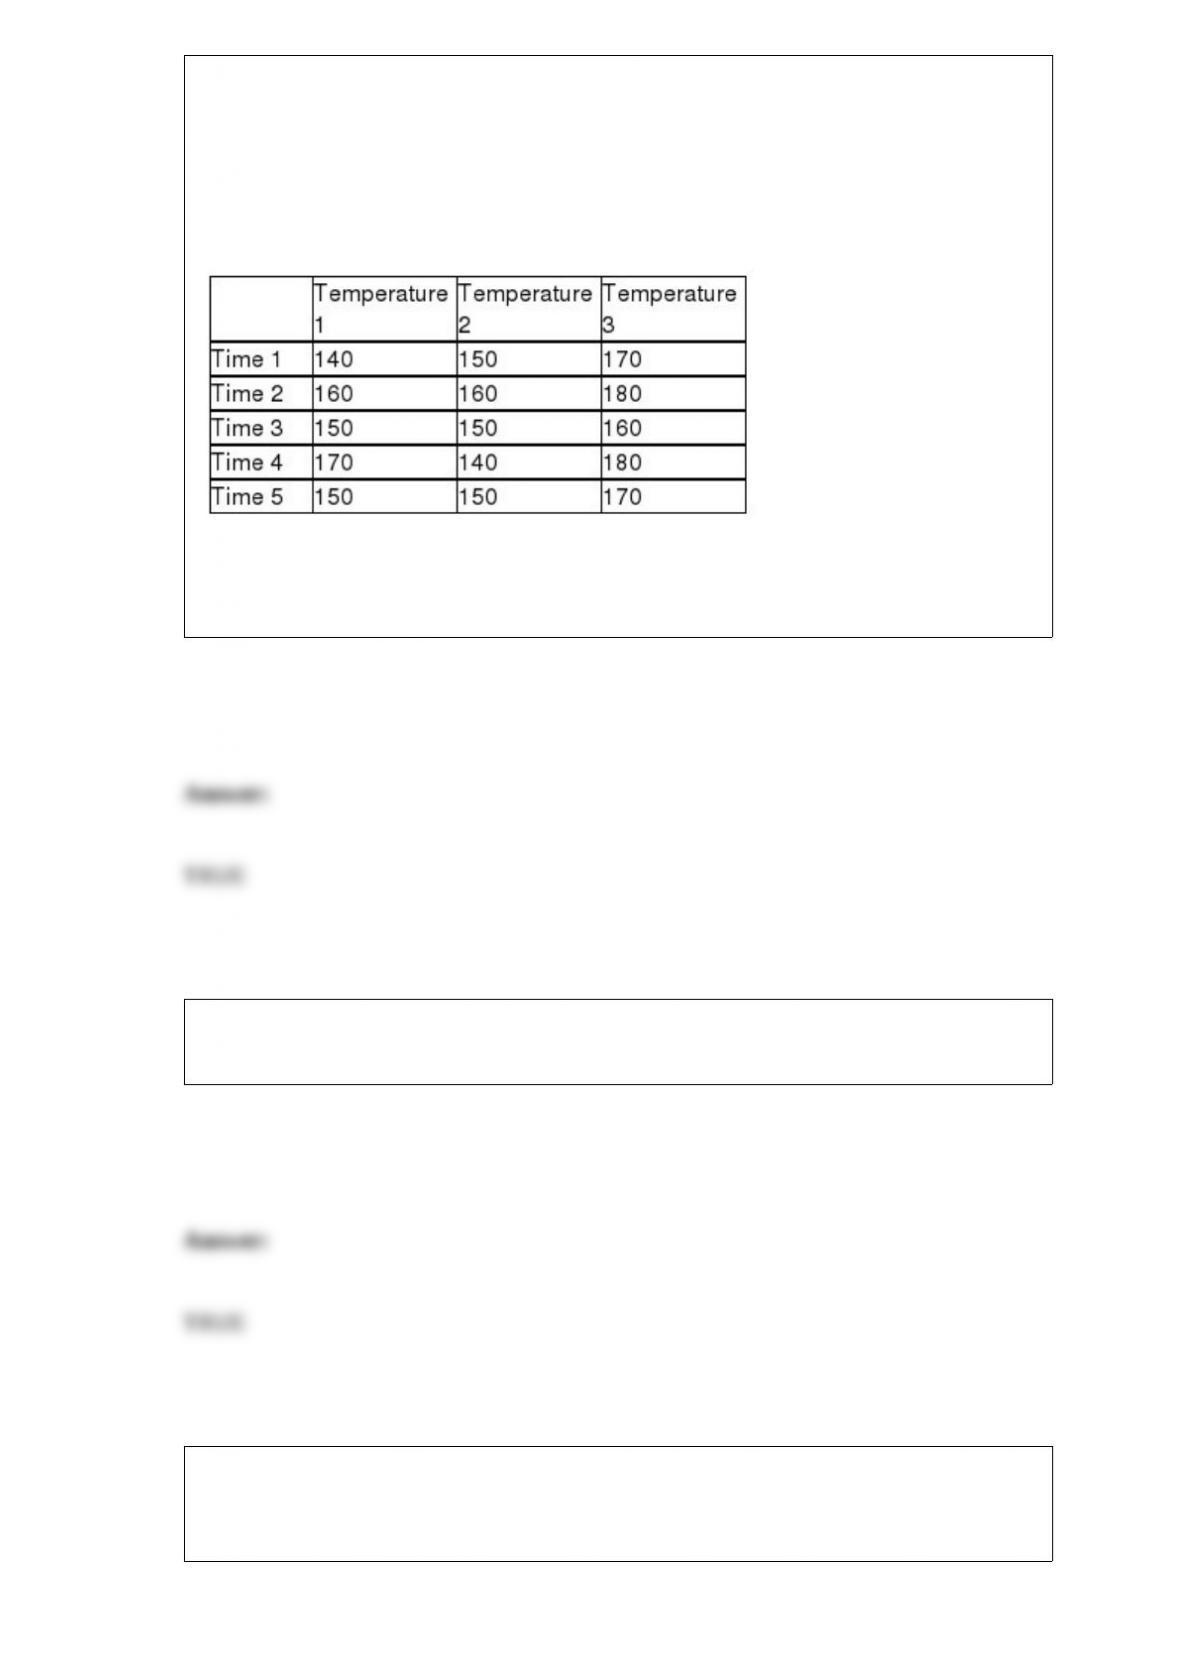
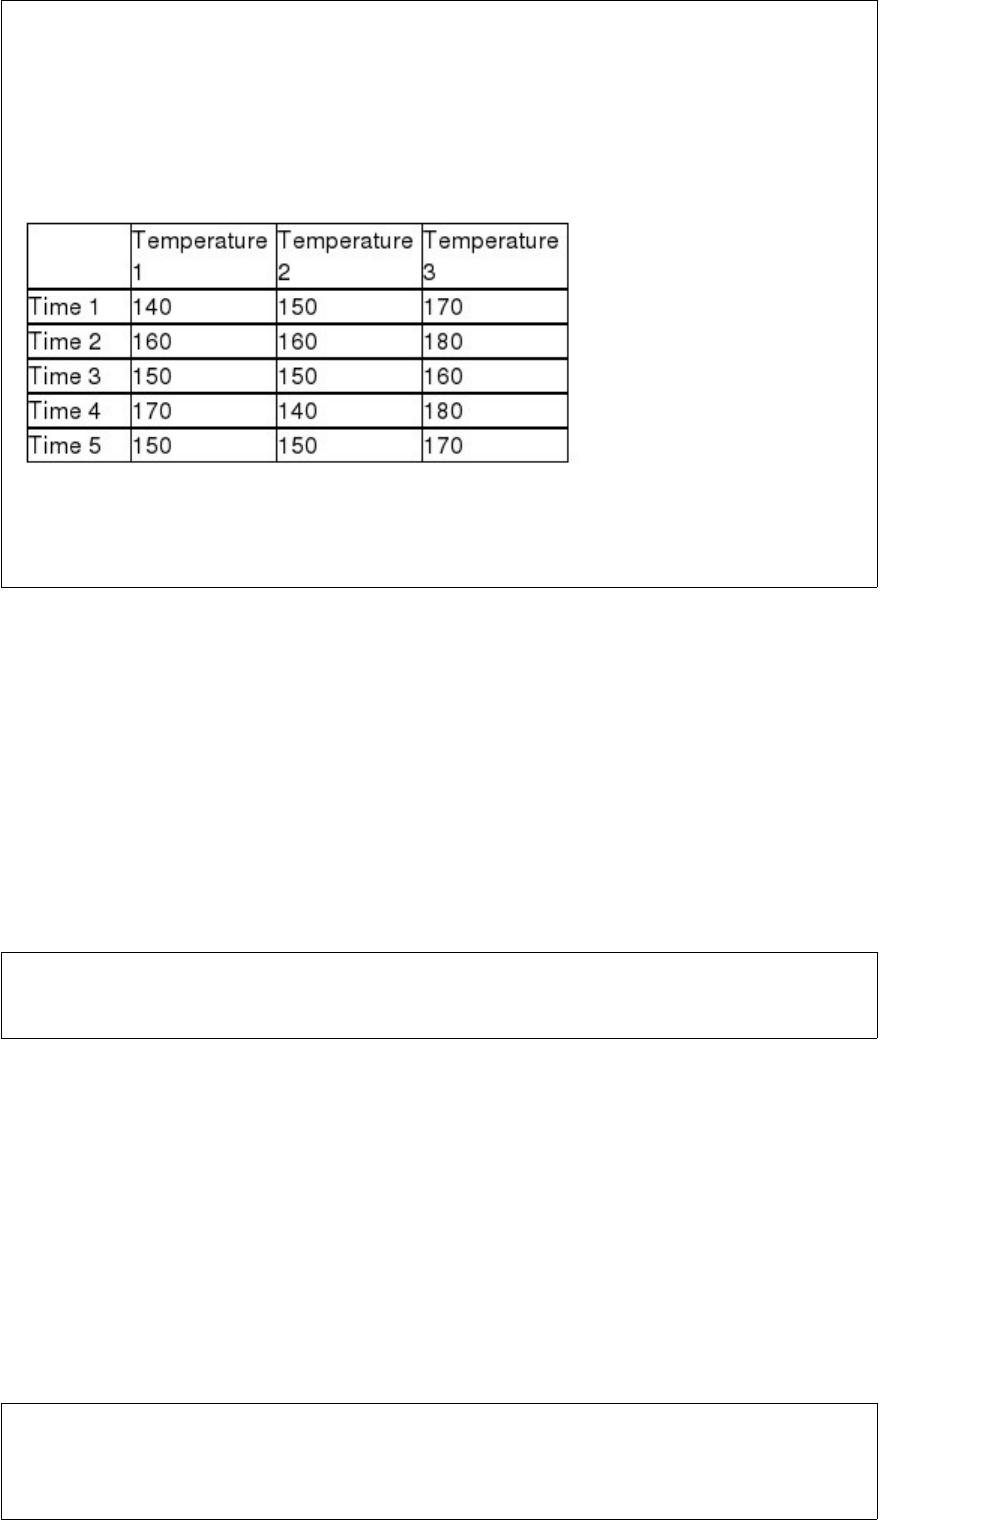
A company has established an experiment with its production process in which three
temperature settings are used and five elapsed times are used for each setting. The
company then produces one product under each and measures the resulting strength of
the product. The managers are mainly interested in determining whether the mean
strength is the same at all temperature settings, but they know that controlling for
process time is important. The following data were observed from the experiment:
Based on these data and experimental design, the primary null hypothesis to be tested is
H0 : μ1 = μ2 = μ3.
The primary application for the hypergeometric probability distribution is in situations
where the sampling is done without replacement from a finite population.
The number of customers who arrive at a fast food business during a one-hour period is
known to be Poisson distributed with a mean equal to 8.60. The probability that more
than 4 customers will arrive in a 30-minute period is 0.1933.


The upper and lower limits of each class in a frequency distribution are also referred to
as the data array.
The main purpose of a pilot sample in an application involving an estimate for a
population mean is to determine what the margin of error will likely be.
A seafood shop sells salmon fillets where the weight of each fillet is normally
distributed with a mean of 1.6 pounds and a standard deviation of 0.3 pounds. They
want to classify the largest fillets as extra large and charge a higher price for them. If
they want the largest 15 percent of the fillets to be classified as extra large, the
minimum weight for an extra large fillet should be 1.91 pounds.

Six food critics each visited and rated four different restaurants. Each critic visited each
restaurant on three separate occasions and recorded a score for each visit. The total
number of degrees of freedom is 71.
When a small sample is used, a stratified random sample is more likely to provide the
desired information than a simple random sample.
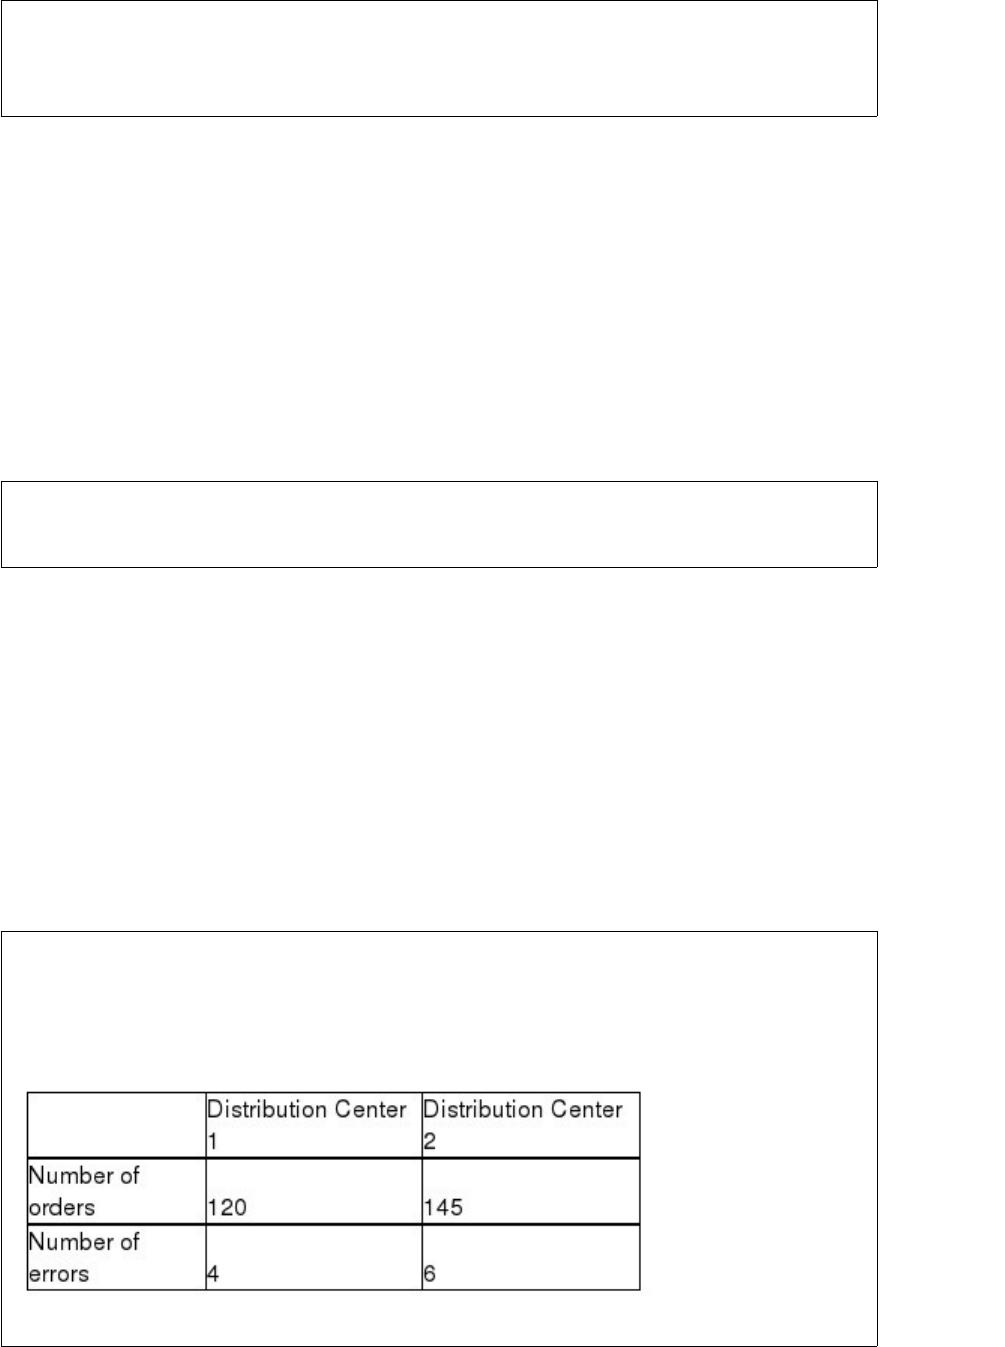
A direct retailer that sells clothing on the Internet has two distribution centers and wants
to determine if there is a difference between the proportion of customer order shipments
that contain errors (wrong color, wrong size, etc.). It takes a sample of orders from each
distribution center and obtain the following results:


Based on these data it can proceed with assuming the normal distribution for each of the
proportion sampling distributions.
An open-end question requires respondents to choose from a short list of choices
A local pizza company is interested in estimating the percentage of customers who
would take advantage of a coupon offer. To do this, they give the coupon out to a
random sample of 100 customers. Of these, 45 actually use the coupon. Based on a 95
percent confidence level, the upper and lower confidence interval limits are
approximately 0.3525 to 0.5475.
The population of soft drink cans filled by a particular machine is known to be normally
distributed with a mean equal to 12 ounces and a standard deviation equal to .25 ounce.
Given this information, the sampling distribution for a random sample of n = 25 cans
will also be normally distributed with a mean equal to 12 ounces and a standard


deviation equal to .05 ounce.
Acme Taxi has two taxi cabs. The manager tracks the daily revenue for each cab. Over
the past 20 days, Cab A has averaged $76.00 per night with a standard deviation equal
to $11.00. Cab B has averaged $200.00 per night with a standard deviation of $18.00.
Based on this information, the coefficient of variation for Cab B is 9 percent.
Suppose a coin is flipped twice. The event of getting heads on the first toss and the
event of getting heads on the second toss could be said to be mutually exclusive.
Six food critics each visited and rated four different restaurants. Each critic visited each
restaurant on three separate occasions and recorded a score for each visit. The number
of degrees of freedom in the interaction row of the ANOVA table is 15.


If a hypothesis test is conducted for a population mean, a null and alternative hypothesis
of the form:
H0 : μ = 100
HA : μ ≠ 100
will result in a one-tailed hypothesis test since the sample result can fall in only one tail.
A city newspaper has stated that the average time required to sell a used car advertised
in the paper is less than 5 days. Assuming that the population standard deviation is 2.1
days, if the “true” population mean is 4.1 days and a sample size of n = 49 is used with
an alpha equal to 0.05, the probability that the hypothesis test will lead to a Type II
error is approximately .0869.
In conducing one-way analysis of variance, the population distributions are assumed
normally distributed.
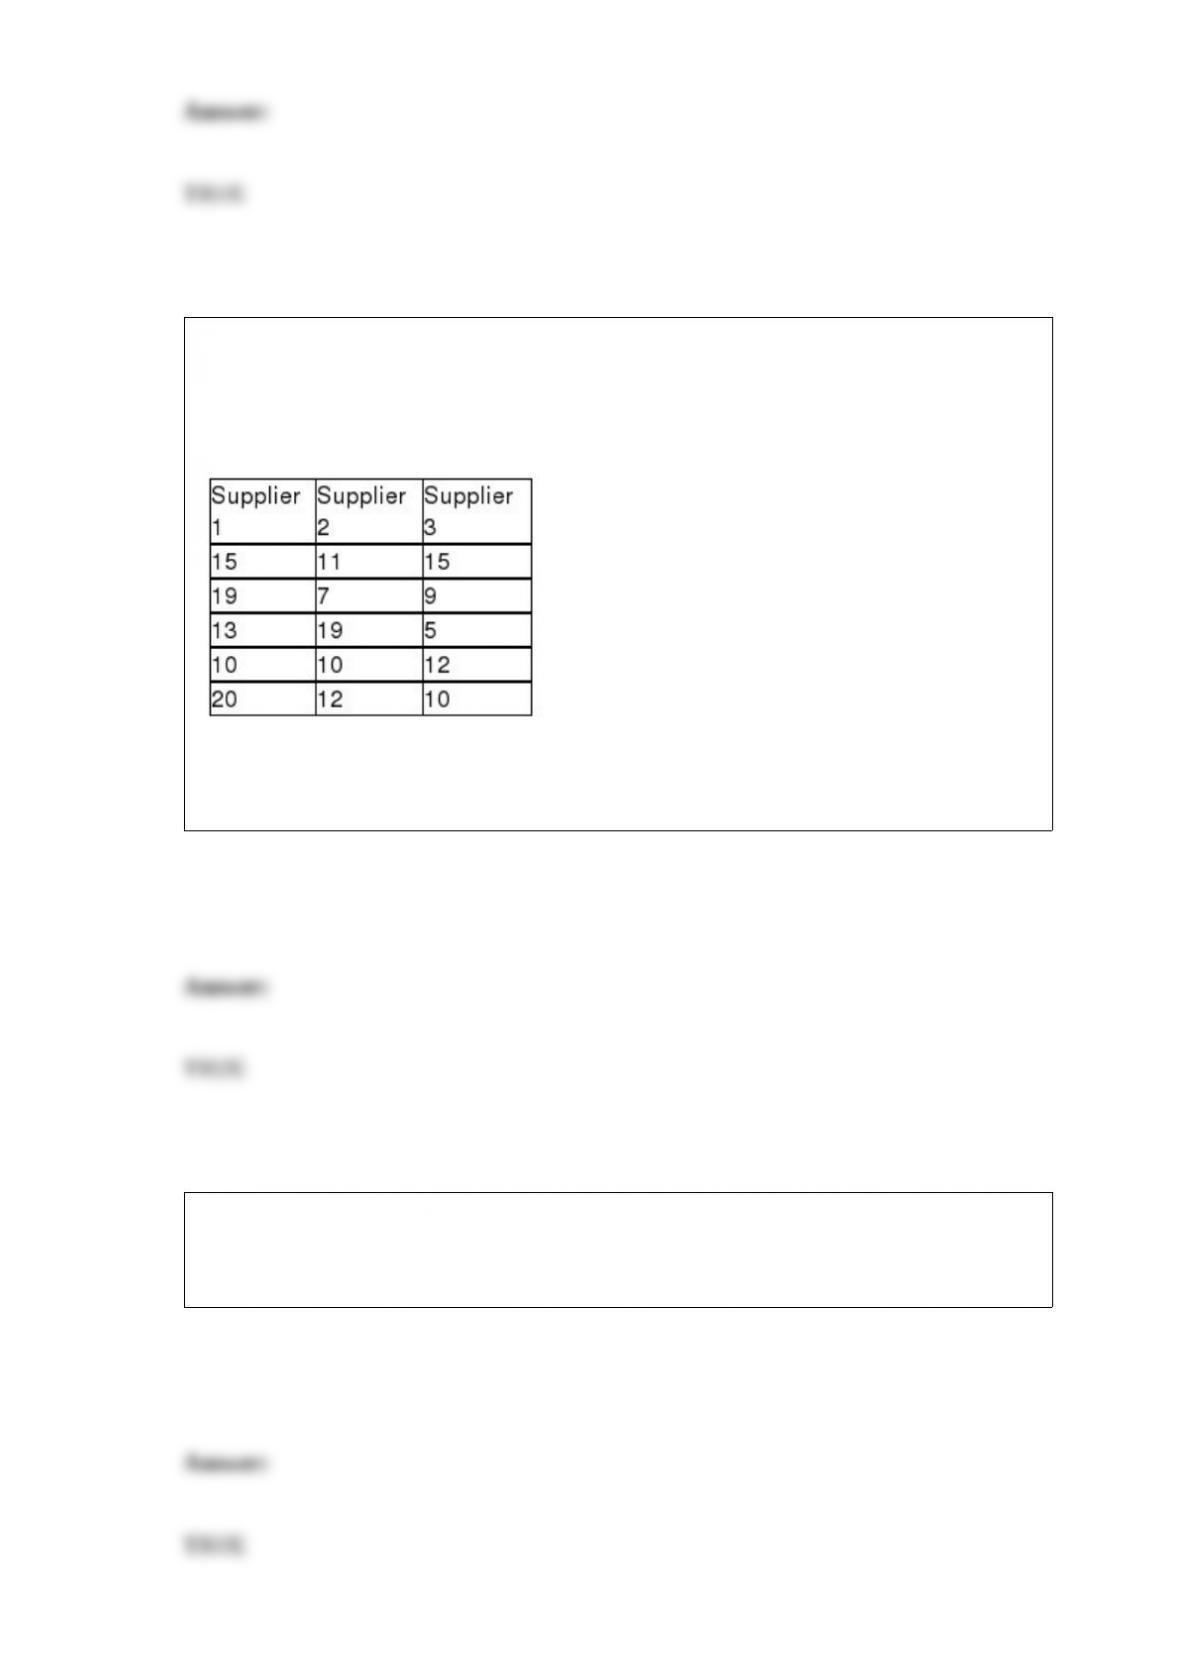
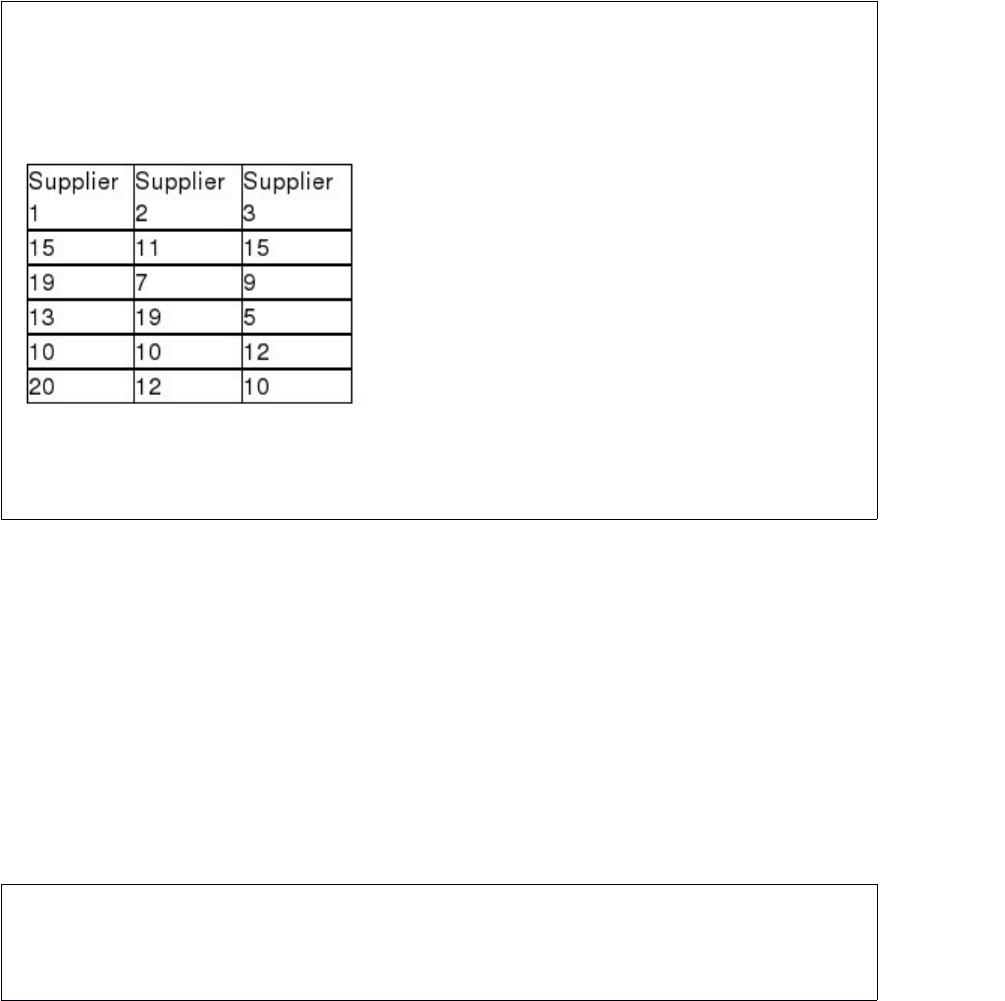
A recent study was conducted to determine if any of three suppliers of electronic
components has a different median delivery time on special orders. To test this, five
orders were given to each supplier and the delivery days were recorded. These data are
shown as follows:
If a Kruskal-Wallis test is to be performed, the number of degrees of freedom for
determining the critical value is 2.
The Kruskal-Wallis test is used to test whether the centers of 3 or more populations are
equal so long as that is the only possible difference between the population
distributions.
When someone has been accused of a crime the null hypothesis is:
H0 : innocent.
In this case, a Type I error would be convicting an innocent person.
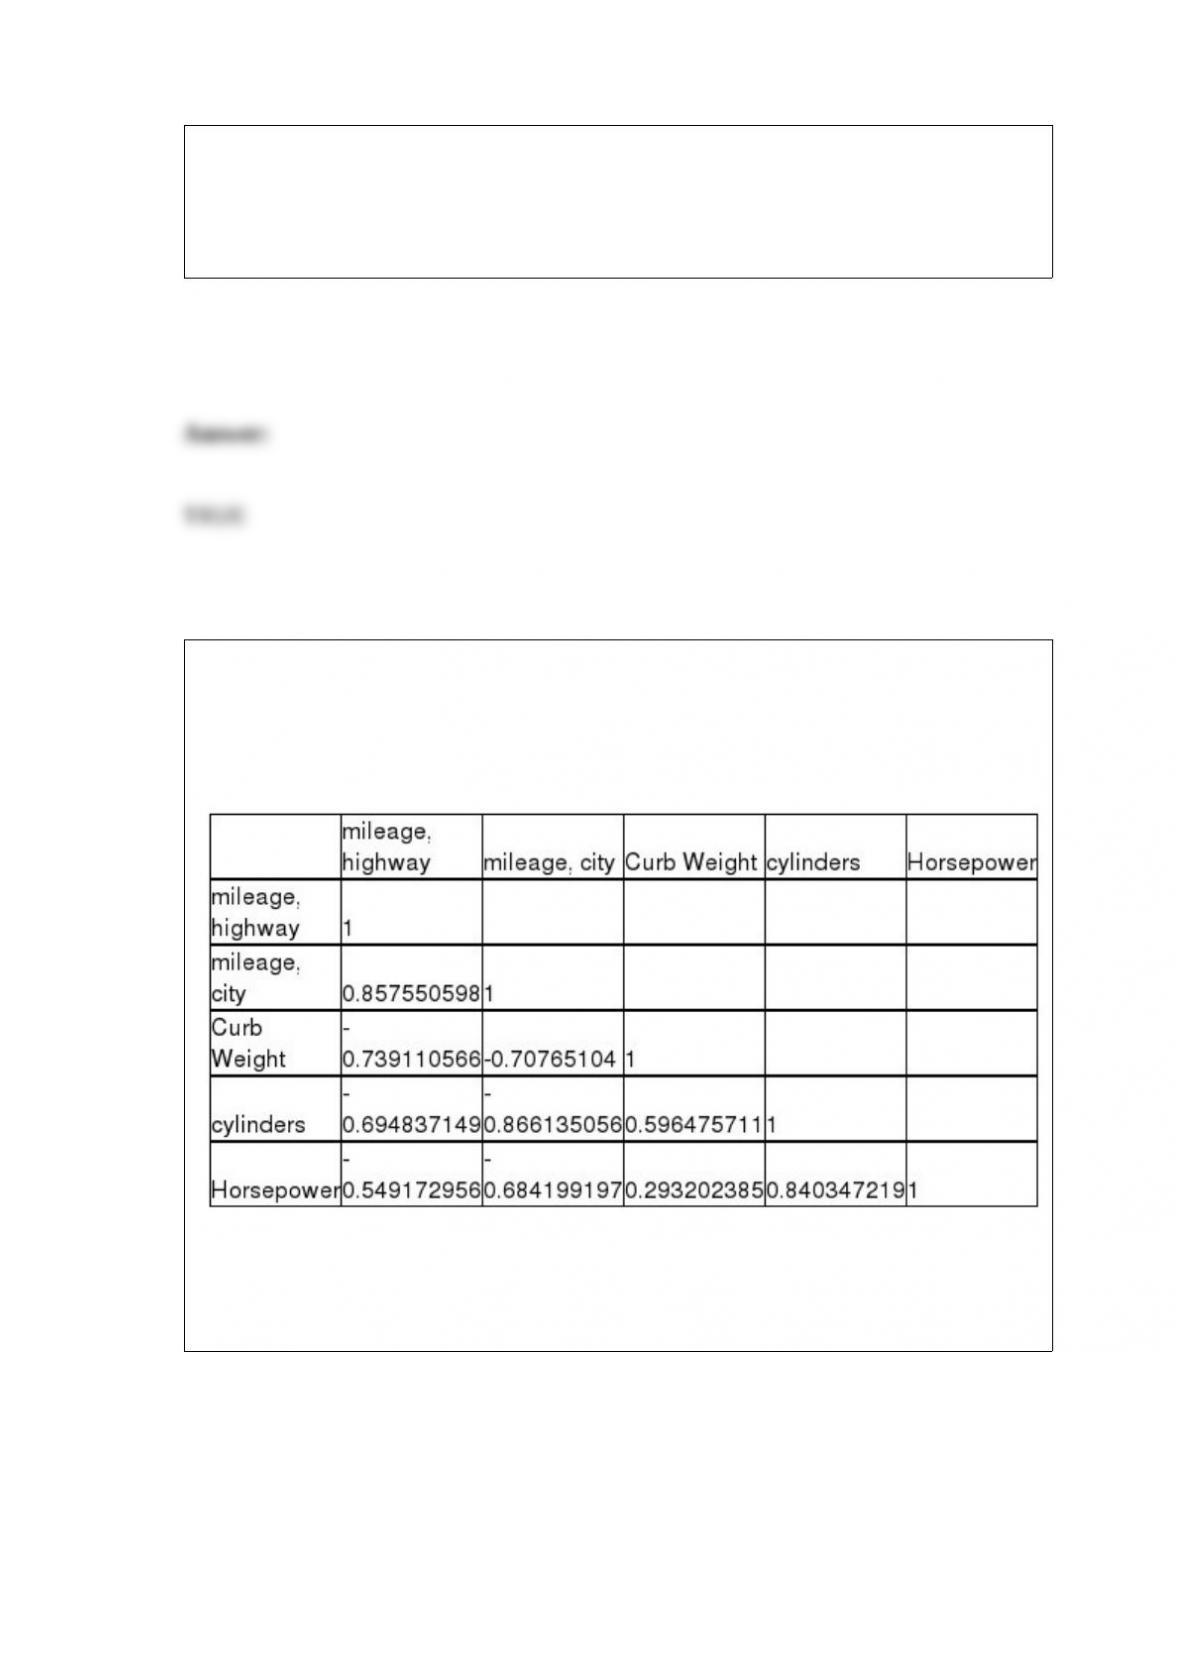
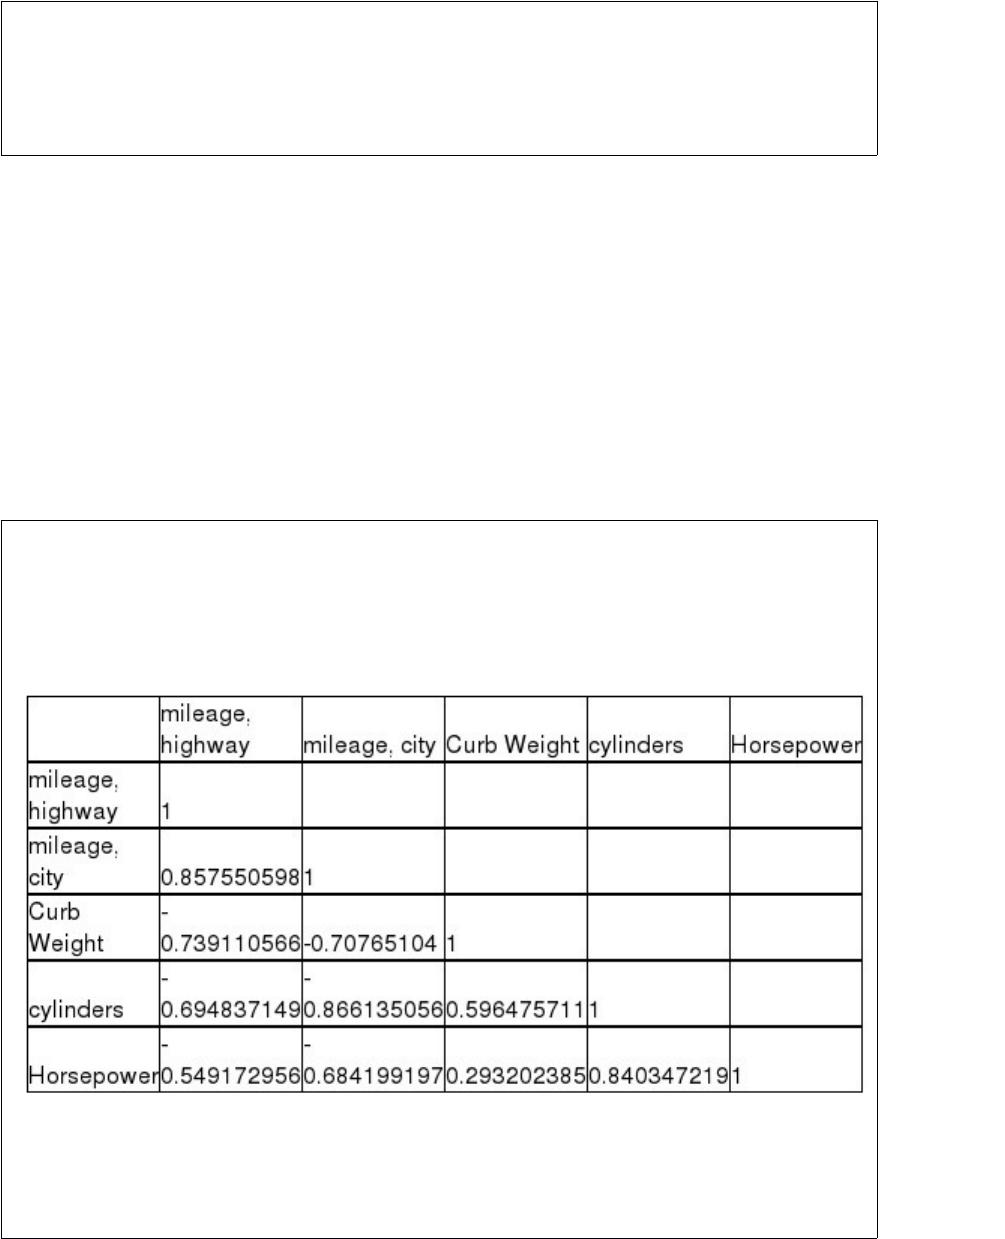
A major car magazine has recently collected data on 30 leading cars in the U.S. market.
It is interested in building a multiple regression model to explain the variation in
highway miles. The following correlation matrix has been computed from the data
collected:
The analysts also produced the following multiple regression output using curb weight,
cylinders, and horsepower as the three independent variables. Note that a number of the
output fields are missing, but can be determined from the information provided.
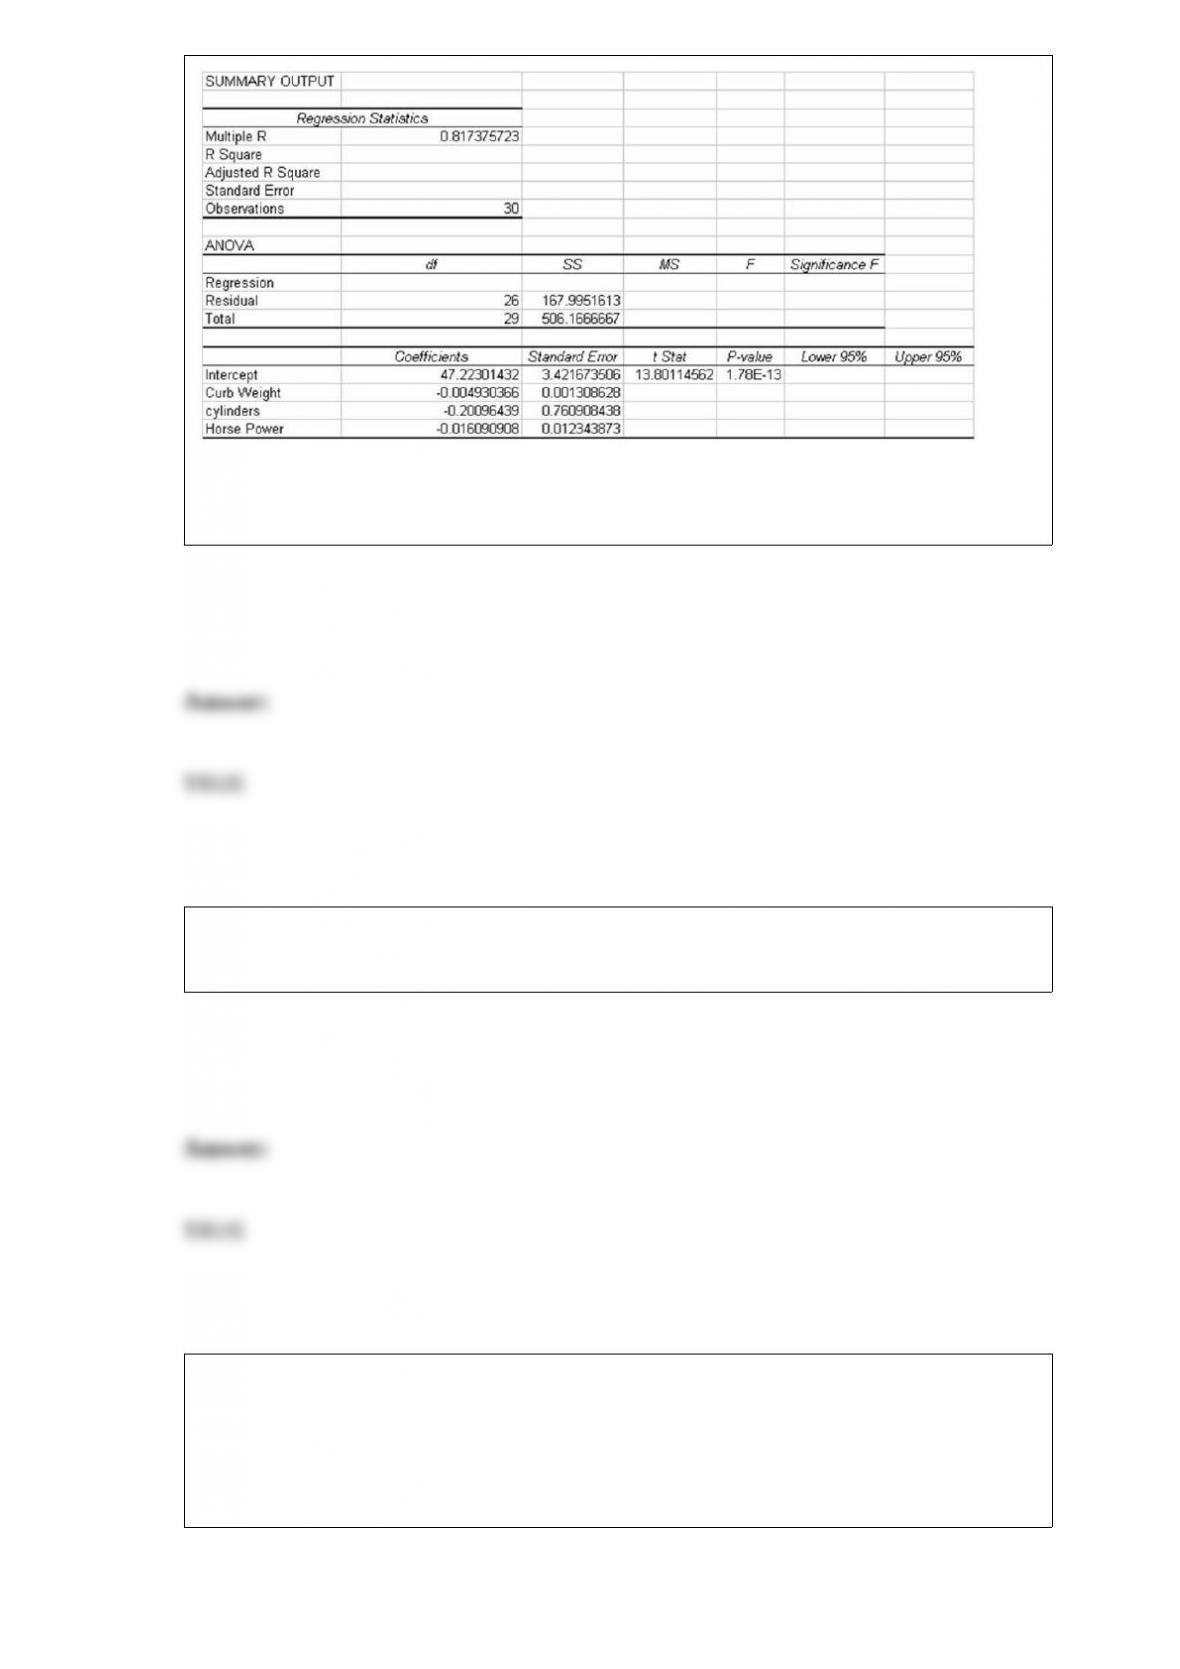

Based on the information provided, the three independent variables explain
approximately 67 percent of the variation in the highway mileage among these 30 cars.
In a contingency analysis the expected values are based on the assumption that the two
variables are independent of each other.
The Brockingham Carpet Company prides itself on high quality carpets. At the end of
each day, the company quality managers select 3 square yards for inspection. The
quality standard requires an average of no more than 2.3 defects per square yard. Last
night, the inspector found 8 defects in the sample of 3 square yards. The chance of
finding 8 or more defects in the sample is 0.9975.


A statistic is just another name for a parameter.
The following null and alternative hypotheses are appropriate when using a Wilcoxon
signed rank test.
H0 : Population Median equals 14.5
HA: Population Median is not equal to 14.5
The executive director of the United Way believes that more than 24 percent of the
employees in the high-tech industry have made voluntary contributions to the United
Way. In order to test this statistically, the appropriate null and alternative hypotheses
are:
H0 : ≤ .24
HA : > .24


A large sample Mann-Whitney U test should be used when the sample sizes exceed 20.
The F test statistic for testing whether the variances of two populations are the same is
always positive.
In a Mann-Whitney U test, if the sample sizes are large then the test statistic can be
approximated by the student’s t-distribution.


The NCAA is interested in estimating the difference in mean number of daily training
hours for men and women athletes on college campuses. They want 95 percent
confidence and will select a sample of 10 men and 10 women for the study. If the
NCAA assumes that the population standard deviations are known, the critical value for
the confidence interval is t = 2.1009.
The makers of Crustfree Bread in Boston have a quality standard that allows for no
more than 3 burned loaves per batch on average. Assuming that the average of 3 per
batch is being met, the standard deviation for the number of burned loaves in 4 batches
is approximately 1.73 loaves.
A stable process is typically defined as one in which all output is operating within 3
standard deviations of the process center.
For the same data, a graph of a relative frequency distribution will look exactly the


same as a graph of the frequency distribution.
Watersports Rental at Flathead Lake rents jet skis and power boats for day use. Each
piece of equipment has a clock that records the time that it was actually in use while
rented. The company has observed over time that the distribution of time used is
normally distributed with a mean of 3.6 hours and a standard deviation equal to 1.2
hours. Watersports management has decided to give a rebate to customers who use the
equipment for only a short amount of time. They wish to grant a rebate to no more than
10 percent of all customers. Based on the information provided, the amount of time that
should be set as the cut-off between getting the rebate and not getting the rebate is
approximately 2.06 hours.
The appropriate number of classes should generally be between 5 and 20.
The standard error of the estimate for a simple linear regression model measures the


variation in the slope coefficient from sample to sample.
A process control chart can be used to determine whether the process average has
shifted up or down, but is not useful for determining whether the process is just drifting
in an upward or downward direction.
Descriptive statistical tools include graphs, charts, and numerical measures.
The national sales manager for a textbook publishing company wishes to estimate the
mean number of books sold per college. She wishes to have her estimate be within 30
copies and wants a 95 percent confidence interval estimate. If a pilot sample of 30
schools gave a sample standard deviation equal to 60 books, the required total sample
size is less than the pilot sample already taken.


Which of the following is not a condition of the binomial distribution?
A) Two possible outcomes for each trial
B) The trials are independent.
C) The standard deviation is equal to the square root of the mean.
D) The probability of a success remains constant from trial to trial.
Assume that you are testing the difference in the means of two independent populations
at the 0.05 level of significance. The null hypothesis is: H0 : μA – μβ ≥ 0 and you have
found the test statistic is What should you conclude?
A) The mean of pop. A is greater than the mean of pop. B because p-value < α.
B) The mean of pop. A is greater than the mean of pop. B because p-value > α.
C) There is no significant difference in the two means because p-value > α.
D) The mean of pop. B is greater than the mean of pop. A because p-value < α.

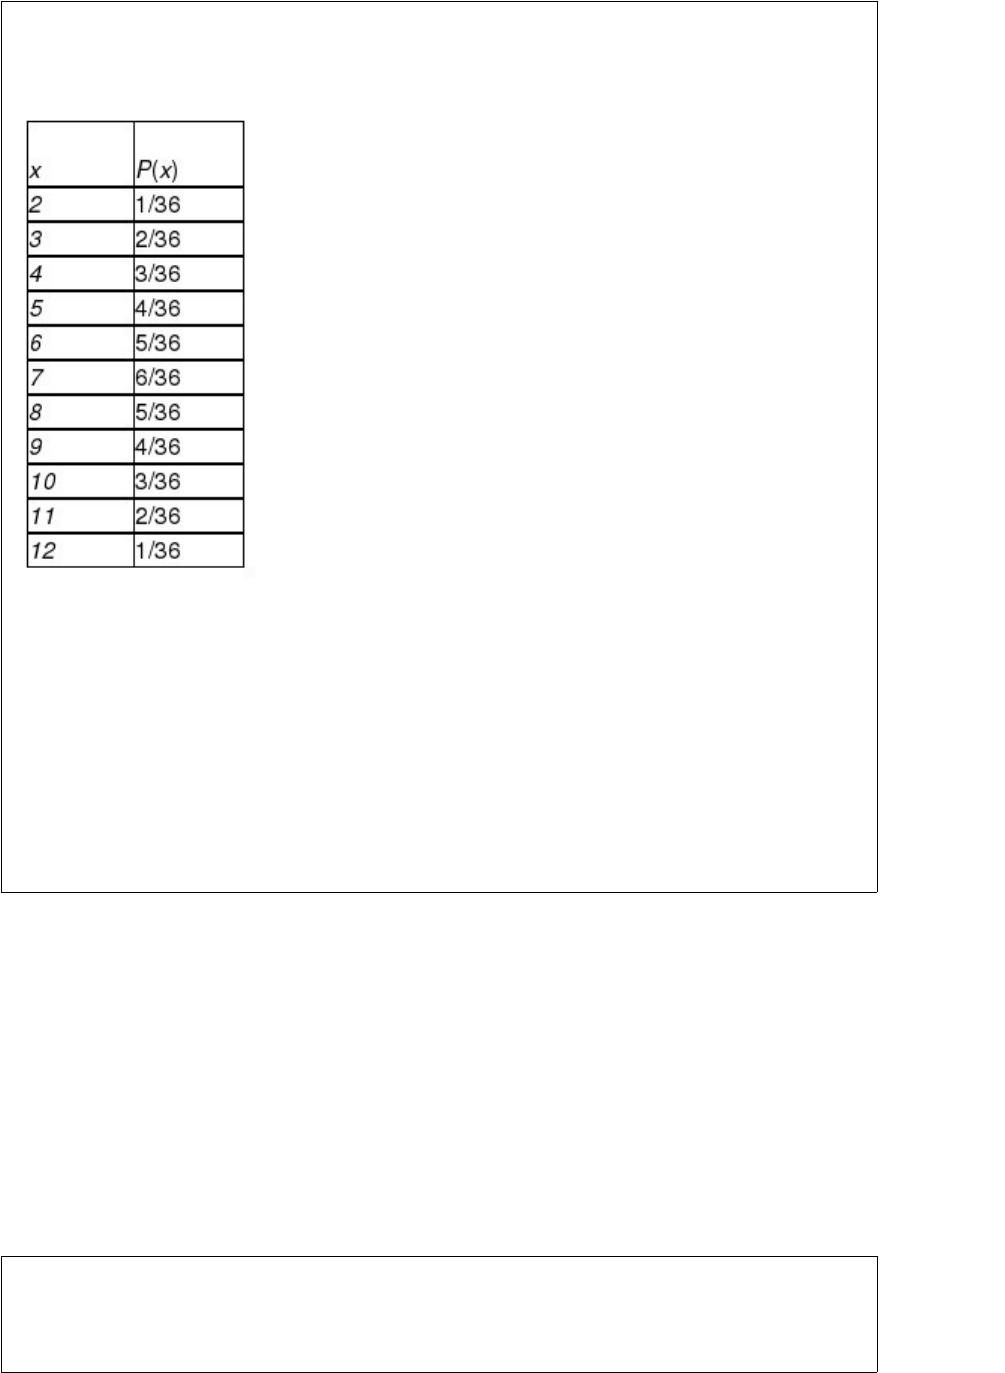
The roll of a pair of dice has the following probability distribution, where the random
variable is the sum of the values produced by each die:
Calculate the variance of x.
A) 5.833
B) 6.122
C) 5.666
D) 5.122
A multiple regression was conducted to predict the price of yachts in thousands of
dollars. A dummy variable was included to indicate whether or not the yacht has a
flying bridge, where 0 means “no” and 1 means “yes.”
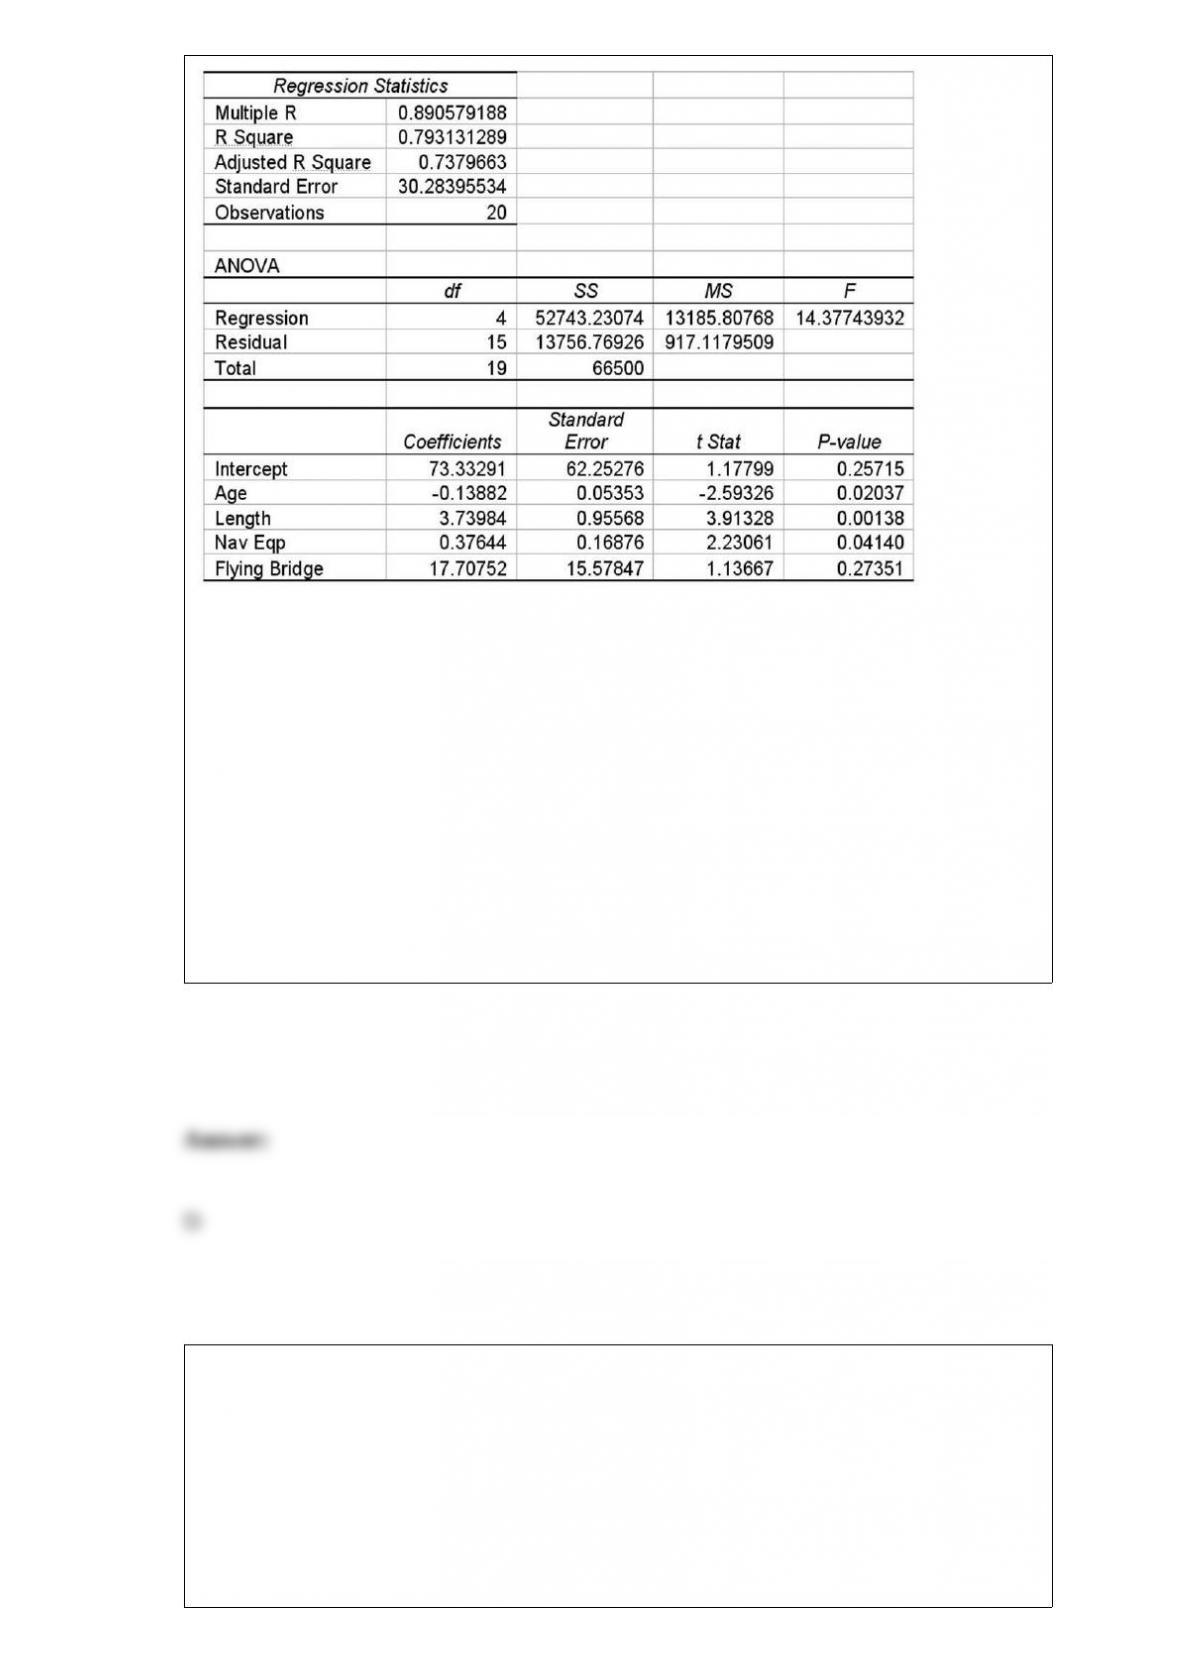
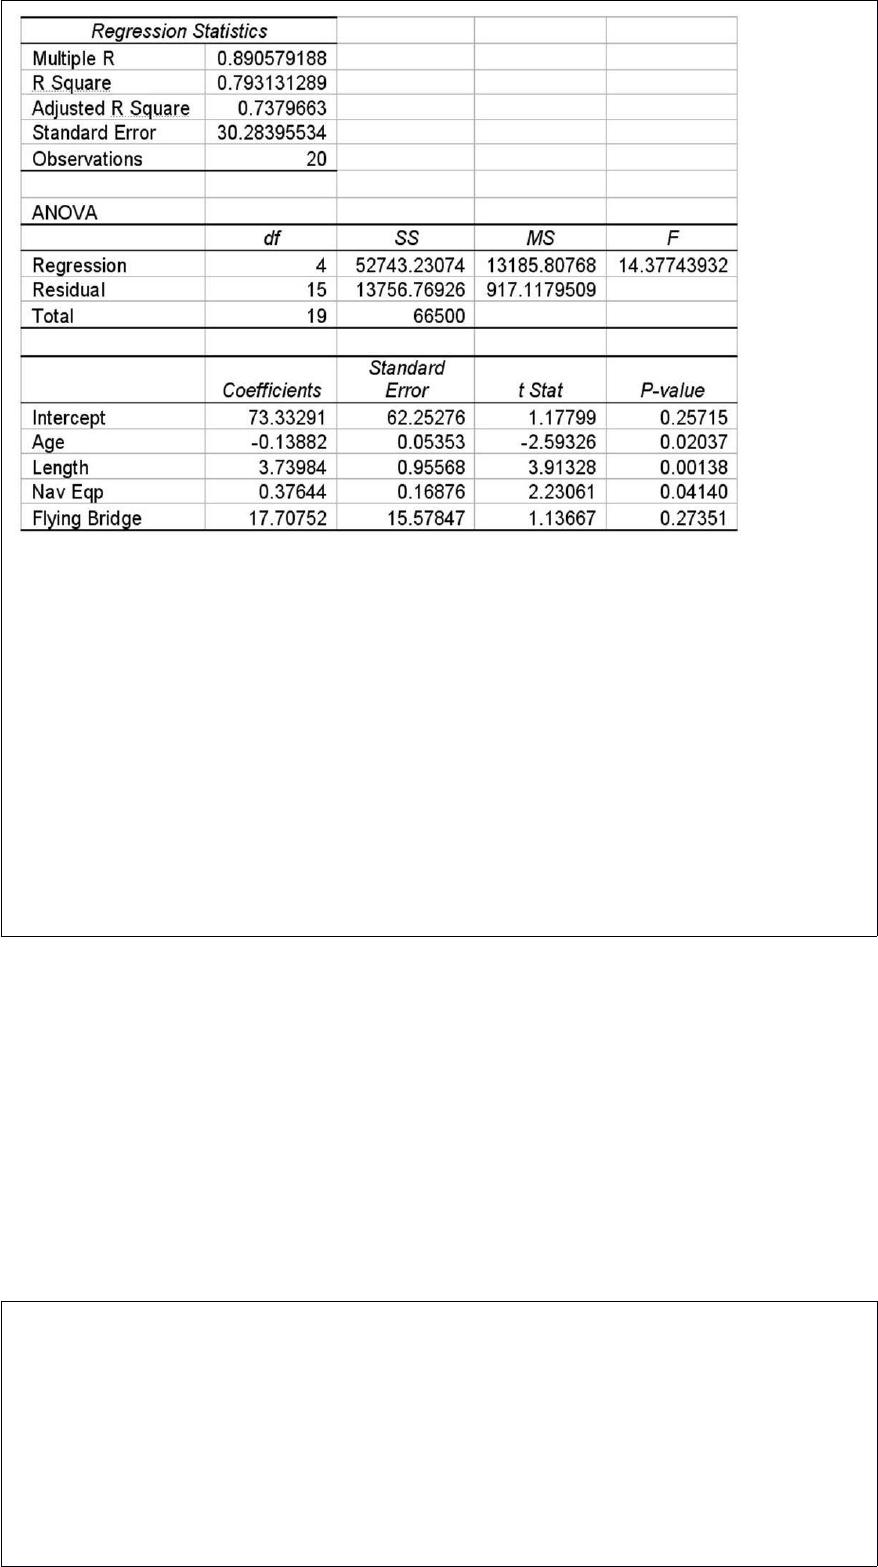
Which of the following statements is correct using the 0.10 level of significance?
A) Having a flying bridge significantly increases the price of a yacht by an average of
$17.7, given the other variables present.
B) Having a flying bridge significantly increases the price of a yacht by an average of
$17,708, given the other variables present.
C) We can tell that 17 out of 20 yachts have a flying bridge.
D) Whether or not the yacht has a flying bridge does not significantly affect the price of
a yacht, given the other variables present.
What sample size is needed to estimate a population mean within 50 of the true mean
value using a confidence level of 95%, if the true population variance is known to be
122,500?
A) 211
B) 155


C) 214
D) 189
Recording vehicle type as sedan, minivan, pick-up truck, etc. is an example of
qualitative data.
For the following z-test statistic, compute the p-value assuming that the hypothesis test
is a one-tailed test: z = -1.55.
A) 0.0606
B) 0.1512
C) 0.0901
D) 0.0172


The following values represent the population of home mortgage interest rates (in
percents) being charged by the banks in a particular city:
Given this information, what would the sampling error be if a sample including the
seven values in the top row were used to compute the sample mean?
A) Approximately 6.93
B) About 0.56
C) Approximately -0.07
D) About 0.07
Hono Golf is a manufacturer of golf products in Taiwan and China. One of the golf
accessories it produces at its plant in Tainan Hsing, Taiwan, is plastic golf tees. The
injector molder produces golf tees that are designed to have an average height of 66
mm. To determine if this specification is met, random samples are taken from the
production floor. One sample is contained in the file labeled THeight. If the hypothesis
test determines the specification is not being met, the production process will be shut
down while causes and remedies are determined. At times this occurs even though the
process is functioning to specification. What type of statistical error would this be?
A) The null hypothesis, the specification not being met, was not rejected when in fact it
was not being met, this is a Type II error.
B) The null hypothesis, the specification not being met, was not rejected when in fact it
was not being met, this is a Type I error.
C) The null hypothesis, the specification is being met, was rejected when in fact it was
being met, this is a Type II error.
D) The null hypothesis, the specification is being met, was rejected when in fact it was
being met, this is a Type I error.
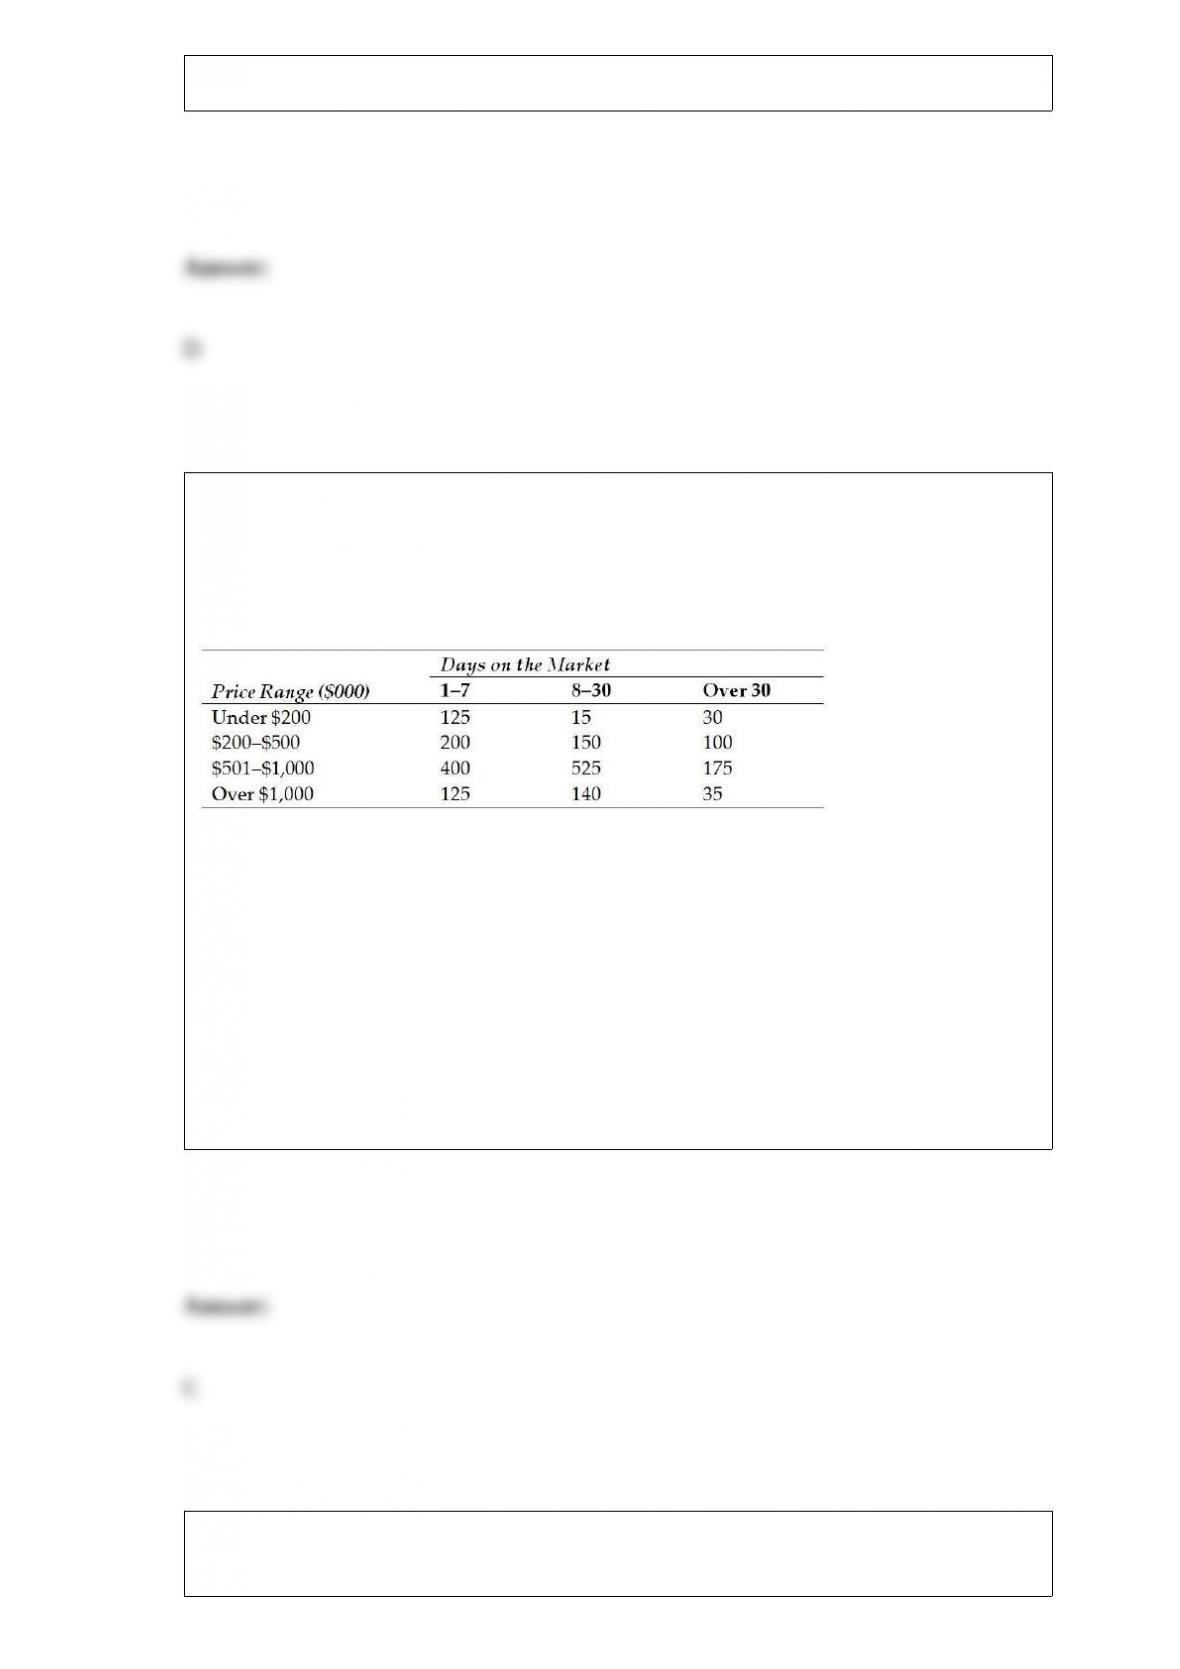
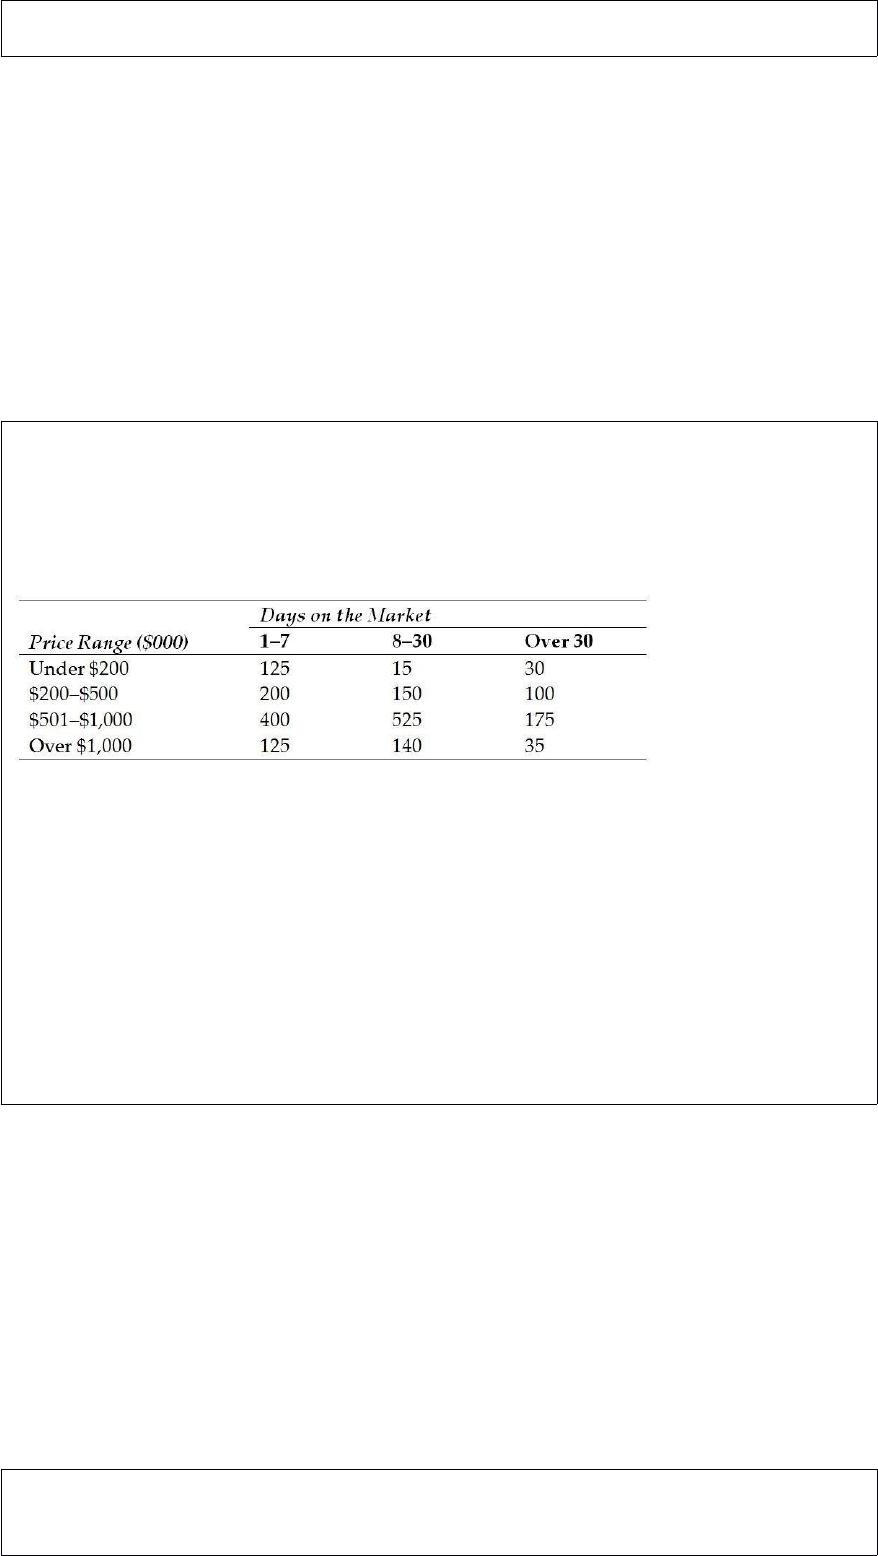
Until the summer of 2006, the real estate market in Fresno, California, had been
booming, with prices skyrocketing. Recently, a study showed the sales patterns in
Fresno for single-family homes. One chart presented in the commission’s report is
reproduced here. It shows the number of homes sold by price range and number of days
the home was on the market.
Using the relative frequency approach to probability assessment, what is the probability
that a house will be on the market more than 7 days?
A) 0.31
B) 0.099
C) 0.58
D) 0.48
A local paint store carries 4 brands of paint (W, X, Y, and Z). The store has 5 cans of W,
3 cans of X, 6 cans of Y, and 15 cans of Z, all in white. It is thought that customers have


no preference for one of these brands over another. If this is the case, what is the
probability that the next 5 customers will select 1 can of W, X, Y and 2 cans of brand Z?
A) About .23
B) Approximately .08
C) Over .30
D) 0.25
The administrator at Sacred Heart Hospital is interested in estimating the proportion of
patients who are satisfied with the meals at the hospital. A random sample of 250
patients was selected and the patients were surveyed. Of these, 203 indicated that they
were satisfied. Based on this, what is the estimate of the standard error of the sampling
distribution?
A) 0.8120
B) 0.0247
C) 0.0006
D) Can’t be determined without knowing σ.
Even before the record gas prices during the summer of 2008, an article written by Will
Lester of the Associated Press reported on a poll in which 80% of those surveyed say


that Americans who currently own a SUV (sport utility vehicle) should switch to a more
fuel-efficient vehicle to ease America’s dependency on foreign oil. This study was
conducted by the Pew Research Center for the People & the Press. As a follow-up to
this report, a consumer group conducted a study of SUV owners to estimate the mean
mileage for their vehicles. A simple random sample of 91 SUV owners was selected,
and the owners were asked to report their highway mileage. The following results were
summarized from the sample data:
= 18.2 mpg
s = 6.3 mpg
Based on these sample data, compute and interpret a 90% confidence interval estimate
for the mean highway mileage for SUVs.
A) (15.4, 21.0)
B) (12.4, 24.0)
C) (17.6, 18.8)
D) (17.1, 19.3)
Dell Computers receives large shipments of microprocessors from Intel Corp. It must
try to ensure the proportion of microprocessors that are defective is small. Suppose Dell
decides to test five microprocessors out of a shipment of thousands of these
microprocessors. Suppose that if at least one of the microprocessors is defective, the
shipment is returned.
If Intel and Dell agree that Intel will not provide more than 5% defective chips,
calculate the probability that the entire shipment will be returned even though only 5%
are defective.
A) 0.2262
B) 0.3478
C) 0.4564
D) 0.1812


A large Midwestern university is interested in estimating the mean time that students
spend at the student recreation center per week. A previous study indicated that the
standard deviation in time is about 40 minutes per week. If the officials wish to estimate
the mean time within 10 minutes with a 90 percent confidence, what should the sample
size be?
A) 44
B) 62
C) 302
D) Can’t be determined without knowing how many students there are at the university.
If a pair of variables have a strong curvilinear relationship, which of the following is
true?
A) The correlation coefficient will be able to indicate that curvature is present.
B) A scatter plot will not be needed to indicate that curvature is present.
C) The correlation coefficient will not be able to indicate the relationship is curved.
D) The correlation coefficient will be equal to zero.

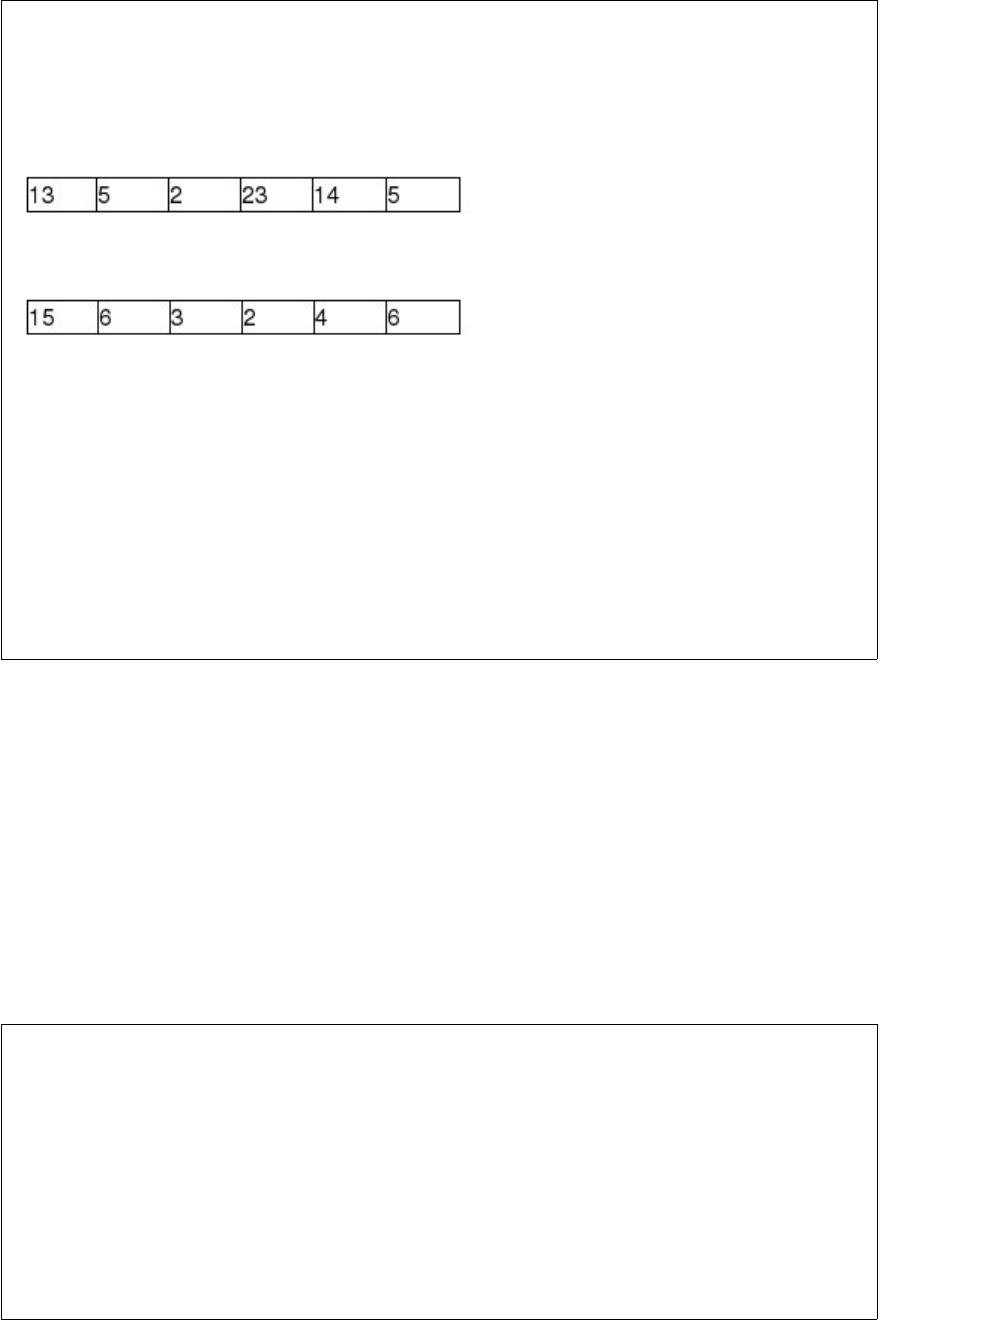
Consider the following data, which represent the number of miles that employees
commute from home to work each day. There are two samples: one for males and one
for females.
Males:
Females:
The coefficient of variation of commute miles for the males is:
A) approximately 76 percent.
B) about 7.8.
C) approximately 61.5.
D) about 67 percent.
The manager for State Bank and Trust has recently examined the credit card account
balances for the customers of her bank and found that 20% have an outstanding balance
at the credit card limit. Suppose the manager randomly selects 15 customers and finds 4
that have balances at the limit. Assume that the properties of the binomial distribution
apply.
What is the probability that 4 or fewer customers in the sample will have balances at the
limit of the credit card?


A) 0.1876
B) 0.8358
C) 0.6482
D) 0.3832
Which of the following is not considered to be a stepwise regression technique?
A) Forward selection regression
B) Optimal variable entry and removal regression
C) Backward elimination
D) Standard stepwise regression
The following data reflect the number of customers who test drove new cars each day
for a sample of 20 days at the Redfield Ford Dealership.


Given these data, what is the interquartile range?
A) 3
B) 7
C) 4
D) 14
If a business manager selected a sample of customers and computed the mean income
for this sample of customers, she has computed:
A) a statistic.
B) an ordinal value.
C) a nominal value.
D) a parameter.
A major retail clothing store is interested in estimating the difference in mean monthly
purchases by customers who use the store’s in-house credit card versus using a Visa,
Mastercard, or one of the other major credit cards. To do this, it has randomly selected a
sample of customers who have made one or more purchases with each of the types of
credit cards. The following represents the results of the sampling:


Given this information, which of the following statements is true?
A) If either of the sample sizes is increased, the resulting confidence interval will have
a smaller margin of error.
B) If the confidence level were changed from 95 percent to 90 percent, the margin of
error in the estimate would be reduced.
C) Neither A nor B are true.
D) Both A and B are true.
Men have a reputation for not wanting to ask for directions. A Harris study conducted
for Lincoln Mercury indicated that 42% of men and 61% of women would stop and ask
for directions. The U.S. Census Bureau’s 2012 population estimate was that for
individuals 18 or over, 48.2% were men and 51.8% were women. This exercise
addresses this age group.
A randomly chosen driver gets lost on a road trip. Determine the probability that the
driver is a woman and stops to ask for directions.
A) 0.518
B) 0.420
C) 0.316
D) 0.390

When the California Highway Patrol states that a study of drivers on a rural highway
shows that the average speed is between 62.5 mph and 64.5 mph, they are most likely
basing this statement on:
A) descriptive statistics.
B) estimation.
C) hypothesis testing.
D) graphical analysis.
You are given the following null and alternative hypotheses:
Calculate the probability of committing a Type II error when the population mean is
505, the sample size is 64, and the population standard deviation is known to be 36
A) 0.1562
B) 0.5997
C) 0.3426
D) 0.8888


The number of weeds that remain living after a specific chemical has been applied
averages 1.3 per square yard and follows a Poisson distribution. Based on this, what is
the probability that a 3-square yard section will contain less than 4 weeds?
A) 0.4532
B) 0.2001
C) 0.6482
D) 0.1951
Assume that you have calculated a prediction of = 110 where the specific value for x
is equal to the average value of x. Also assume that n = 201 and that the standard error
of the estimate is sε = 4.5. Find the approximate 95 percent prediction interval.
A) About 101 —– 119
B) About 109.4 —– 110.6
C) About 105.5 —– 104.5
D) About 98.4 —– 121.6


If two events are independent, then
A) they must be mutually exclusive.
B) the sum of their probabilities must be equal to one.
C) their intersection must be zero.
D) None of the above
The control limits in a control chart can be interpreted to mean:
A) any value falling outside the limits is a defect and the product should be discarded.
B) the range of virtually all special cause variation.
C) any value falling within the limits means the product is high quality.
D) the range of virtually all common cause variation.
Cramer’s Bar and Grille in Dallas can seat 130 people at a time. The manager has been
gathering data on the number of minutes a party of four spends in the restaurant from

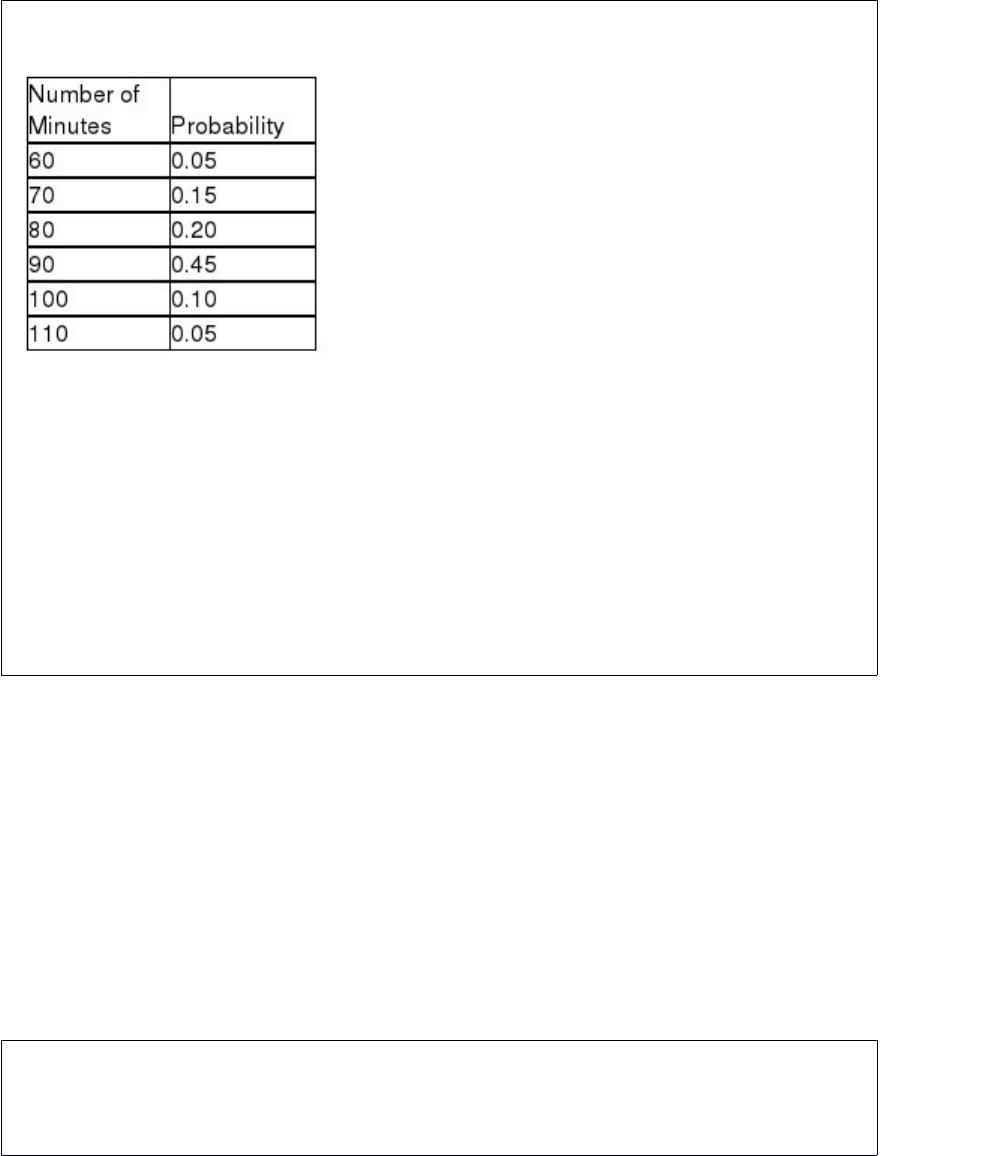
the moment they are seated to when they pay the check.
What is the mean number of minutes for a dinner party of four?
A) 65.5
B) 67.5
C) 85.5
D) 75.5
Consider the following partially completed computer printout for a regression analysis
where the dependent variable is the price of a personal computer and the independent
variable is the size of the hard drive.


Based on the information provided, what percentage of the variation in the price of the
personal computers is accounted for by the regression model using hard drive capacity
as the independent variable?
A) About 82 percent
B) About 67 percent
C) 217.75
D) About 66 percent
Employees at a large computer company earn sick leave in one-minute increments
depending on how many hours per month they work. They can then use the sick leave
time any time throughout the year. Any unused time goes into a sick bank account that
they or other employees can use in the case of emergencies. The human resources
department has determined that the amount of unused sick time for individual
employees is uniformly distributed between 0 and 480 minutes. Based on this
information, what is the probability that three randomly chosen employees have over
400 unused sick minutes at the end of the year?
A) 0.1667
B) 0.0046


C) 0.5001
D) 0.0300