A survey of the wine market has shown that the preferred wine for 17 percent of
Americans is merlot. A wine producer in California, where merlot is produced, believes
the figure is higher in California. She contacts a random sample of 550 California
residents and asks which wine they purchase most often. Suppose 115 reply that merlot
is the primary wine. Using the p-value rule, calculate the p-value associated with the
test statistic, and test the claim at α = .01.
When a forecaster uses the _________________ method, she or he assumes that the
time series components are changing quickly over time.
A. time series regression
B. simple exponential smoothing
C. Box-Jenkins
D. multiplicative decomposition
The distribution whose mean is equal to its variance is the _________ distribution.
A. binomial
B. Poisson

C. hypergeometric
D. continuous
As the sample size n increases, the width of the confidence interval _______________.
A. stays the same
B. decreases
C. increases
Consider a Poisson distribution with an average of 3 customers per minute at the local
grocery store. If X = the number of arrivals per minute, find the variance of X.
A. 3
B. 9
C. 1.5
D. 1.7

An example of manipulating a graphical display to distort reality is ___________.
A. starting the axes at zero
B. making the bars in a histogram equal widths
C. stretching the axes
D. starting the axes at zero and stretching the axes
A histogram that tails out toward larger values is ___________.
A. skewed to the left
B. normal
C. a scatter plot
D. skewed to the right
The number of sick days per month taken by employees for the last 10 years at Apex
Co. is an example of time series data.
In testing the difference between two independent population means, it is assumed that
the level of measurement is at least ______________.
A. a ratio variable
B. a qualitative variable
C. an interval variable
D. a categorical variable
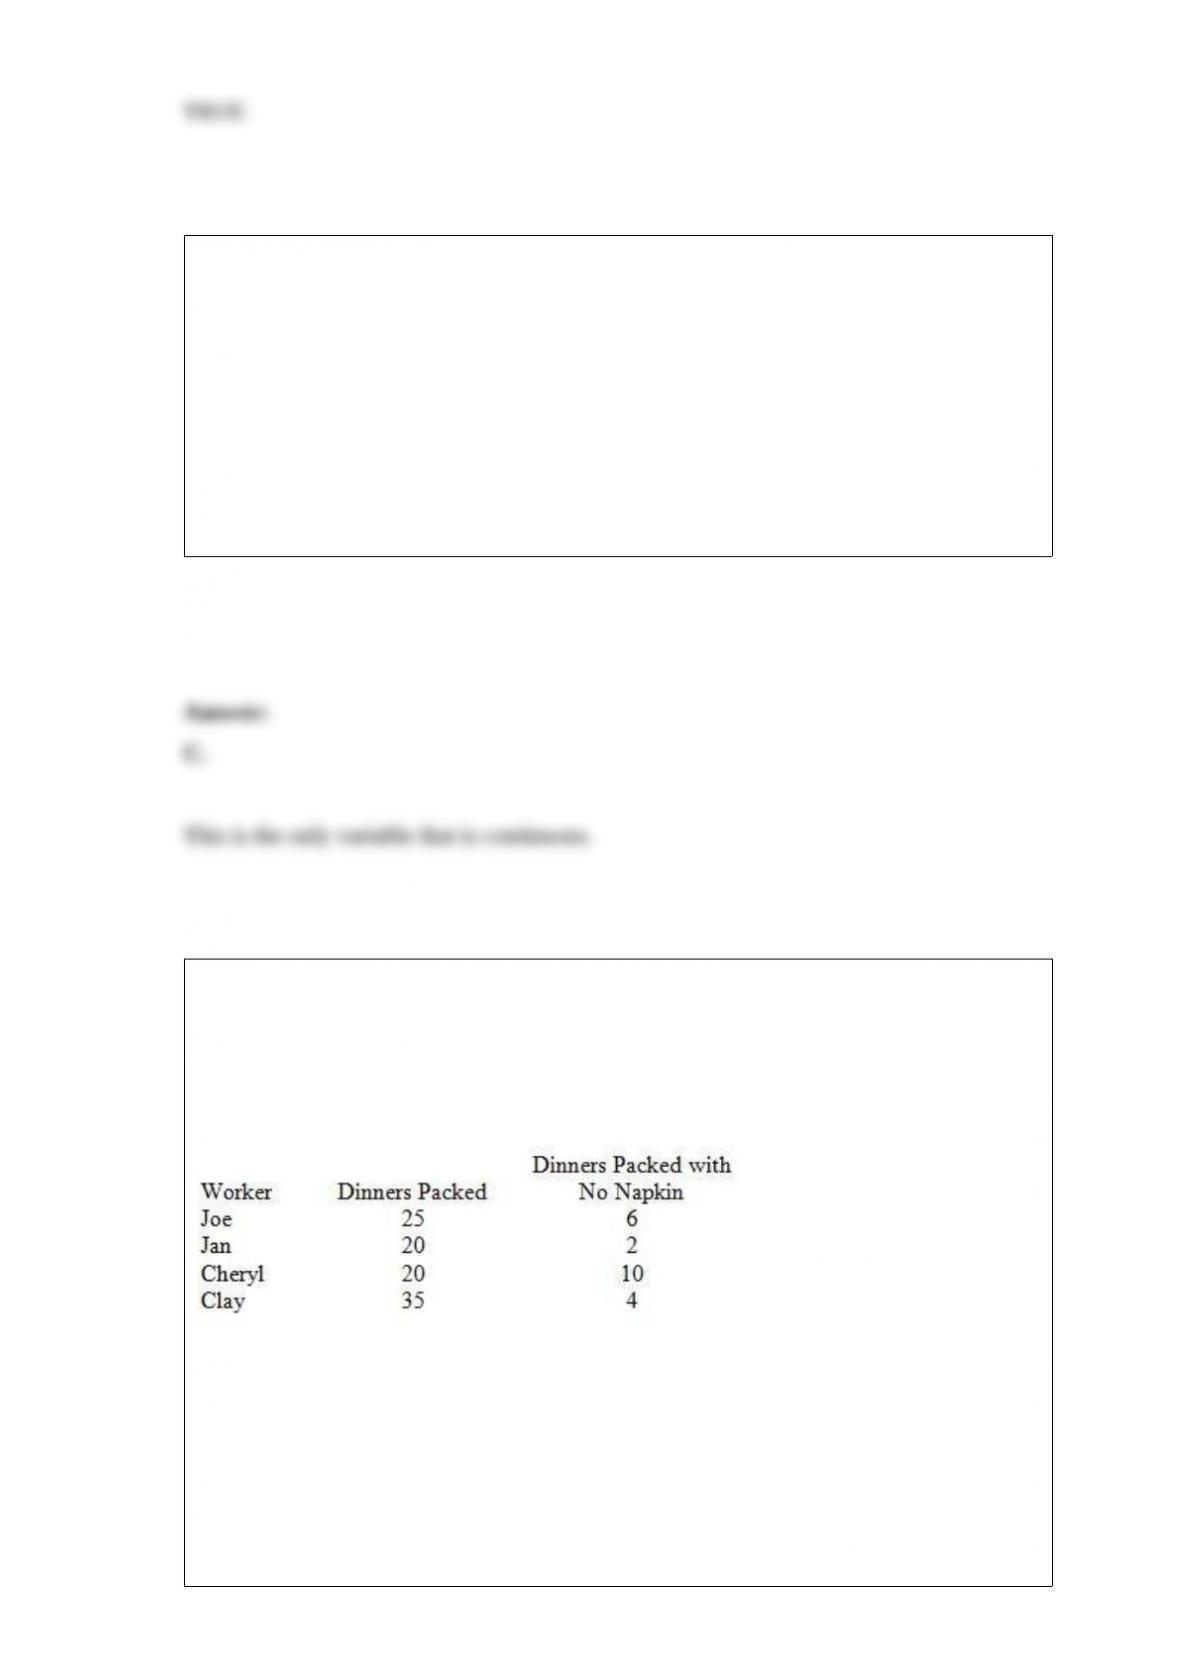
Four employees who work as drive-through attendants at a local fast-food restaurant are
being evaluated. As part of a quality improvement initiative and employee evaluation,
these workers were observed over three days. One of the statistics collected was the
proportion of time the employee forgot to include a napkin in the bag. Related
information is given in the table.
What is the probability that Cheryl prepared your dinner and forgot to include a napkin?
A. 0.20
B. 0.10
C. 0.45

D. 0.02
E. 0.30
Assume that 25 samples of 50 each are taken and the total number of defectives is 34.
Calculate .
A. .680
B. .453
C. .816
D. .0272
Suppose the distribution of personal daily water usage in New York City is normally
distributed with a mean of 15 gallons and a variance of 25 gallons. Because of a current
problem with the distribution of water to its citizens, the mayor wants to give a city tax
rebate to the 15 percent of the population who use the least amount of water. What
should he use as the water limit for a person to qualify for a city tax rebate?
A. 9.825
B. 15.00
C. 12.20
D. 10.25

An insurance company will insure a $75,000 particular make and model of car for its
full value against theft at a premium of $1500 per year. Suppose that the probability that
this particular automobile make and model will be stolen is 0.0075. Calculate the
expected net profit for the insurance company.
A. $937.50
B. $551.25
C. $1488.75
D. $562.50
Consider a normal population with a mean of 10 and a variance of 4. Find P(X ≥ 10).
A. 1.00
B. 0.00
C. 0.50
D. −0.50

Quality control is an important issue at ACME Company, which manufactures light
bulbs. To test the life-hours of their light bulbs, they randomly sampled nine light bulbs
and measured how many hours they lasted (mean = 346.6).
378, 361, 350, 375, 200, 391, 375, 368, 321
What is the standard deviation?
A. 342.43
B. 3424.3
C. 58.5
D. 191
E. 10,609
Given the following test scores, find a 95 percent confidence interval for the population
mean: 148, 154, 158, 160, 161, 162, 166, 170, 182, 195, 236. Assume population
normality.
A. [155.24, 188.76]
B. [168.64, 175.36]
C. [157.25, 186.75]
D. [116.41, 227.59]

A forecasting method that weights recent observations more heavily is called
_____________.
A. time series analysis
B. first-order autocorrelation
C. multiplicative decomposition
D. exponential smoothing
A random variable that is defined to be the total number of successes in n trials is a
__________ random variable.
A. binomial
B. Poisson
C. hypergeometric
D. continuous

A manufacturer of cell phone batteries claims that the median life of a battery is more
than 40 hours. Suppose a random sample of 75 batteries finds that 32 have a life of
more than 40 hours. State the null hypothesis to test the claim. Assume that the
population of all battery lives is not normally distributed.
A. H0: Md ≥ 40
B. H0: Md ≠ 40
C. H0: Md > 40
D. H0: Md ≤ 40
An unbiased estimate of σ2 is _____.
A. s
B. s2
C.
D. σ
The manager of the local grocery store has determined that, on average, 4 customers
use the service desk every half-hour. Assume that the number of customers using the
service desk has a Poisson distribution. What is the probability that during a randomly
selected half-hour period, exactly 2 customers use the service desk?

A. .0183
B. .0733
C. .1465
D. .9084
E. .7619
An experiment was conducted to determine the effectiveness of a method designed to
remove oil wastes found in soil. Three contaminated soil samples were treated. After 95
days, the percentage of contamination removed from each soil sample was measured,
with a mean of 49.3 percent and a standard deviation of 1.5 percent. If we wished to
narrow the boundary around μ for a 98 percent confidence interval to within 0.5
percent, how many soil samples should be in our experiment.
A. 437
B. 33
C. 9
D. 6
E. 3

When the level of confidence and sample size remain the same, a confidence interval
for a population proportion, p, will be ______________ when is larger than
when is smaller.
A. wider
B. narrower
C. neither wider nor narrower (they will be the same)
A motorcycle manufacturer produces the parts for its vehicles in different locations and
transports them to its plant for assembly. To keep the assembly operations running
efficiently, it is vital that all parts be within specification limits. One important part used
in the assembly is the engine camshaft, and one important quality characteristic is the
case hardness depth. Specifications state that the hardness depth must be between 3.0
mm and 6.0 mm. To investigate the process, the quality control engineer selected 25
daily subgroups of n = 5 and measured the hardness depth. The process yielded a mean
of the means = 4.50 and an average range = 1.01. How many standard deviations of
leeway exist between x and the specification closest to x?
A. 1.76
B. 1.51
C. 2.55
D. 0.45

A bar chart is a graphic that can be used to depict qualitative data.
Which one of the following statements is not an assumption of the binomial
distribution?
A. Sampling is with replacement.
B. The experiment consists of n identical trials.
C. The probability of success remains constant from trial to trial.
D. Trials are independent of each other.
E. Each trial results in one of two mutually exclusive outcomes.
Quality control is an important issue at ACME Company, which manufactures light
bulbs. To test the life-hours of their light bulbs, they randomly sampled nine light bulbs
and measured how many hours they lasted (mean = 346.6).
378, 361, 350, 375, 200, 391, 375, 368, 321
What is the range?
A. 342.43
B. 3424.3
C. 58.5

D. 191
E. 10,609
The demand for a product for the last six years has been 15, 15, 17, 18, 20, and 19. The
manager wants to predict the demand for this time series using the following simple
linear trend equation: trt = 12 + 2t. What are the forecast errors for the 5th and 6th
years?
A. 0, −3
B. 0, +3
C. +2, +5
D. −2, −5
E. −1, −4
A study of car accidents and drivers who use cell phones collects the following sample
data.

Determine the expected frequencies of those who had accidents in the last year to use
for the chi-square test of independence.
The weight of a product is normally distributed with a mean of four ounces and a
variance of .25 squared ounces. What is the probability that a randomly selected unit
from a recently manufactured batch weighs no more than 3.5 ounces?
A. .8413
B. .9772
C. .1587
D. .0228
Compute the population variance of these data:

16,18,23,21,17,16,24,23,9,17,11,16,22,10,15,14.
A. 21.9
B. 3.87
C. 20.5
D. 17.0
E. 3.625
In a hearing test, subjects estimate the loudness (in decibels) of a sound, and the results
are (mean = 70): 68, 67, 70, 71, 68, 75, 68, 62, 80, 73, 68.
What is the variance?
A. 18
B. 4.73
C. 22.40
D. 324
E. 6.76
If a regression model with k independent variables has a C statistic less than _______,
then the model is considered to be desirable.
A. k + 1
B. k
C. k − 1
D. 1/k
E. k − 2
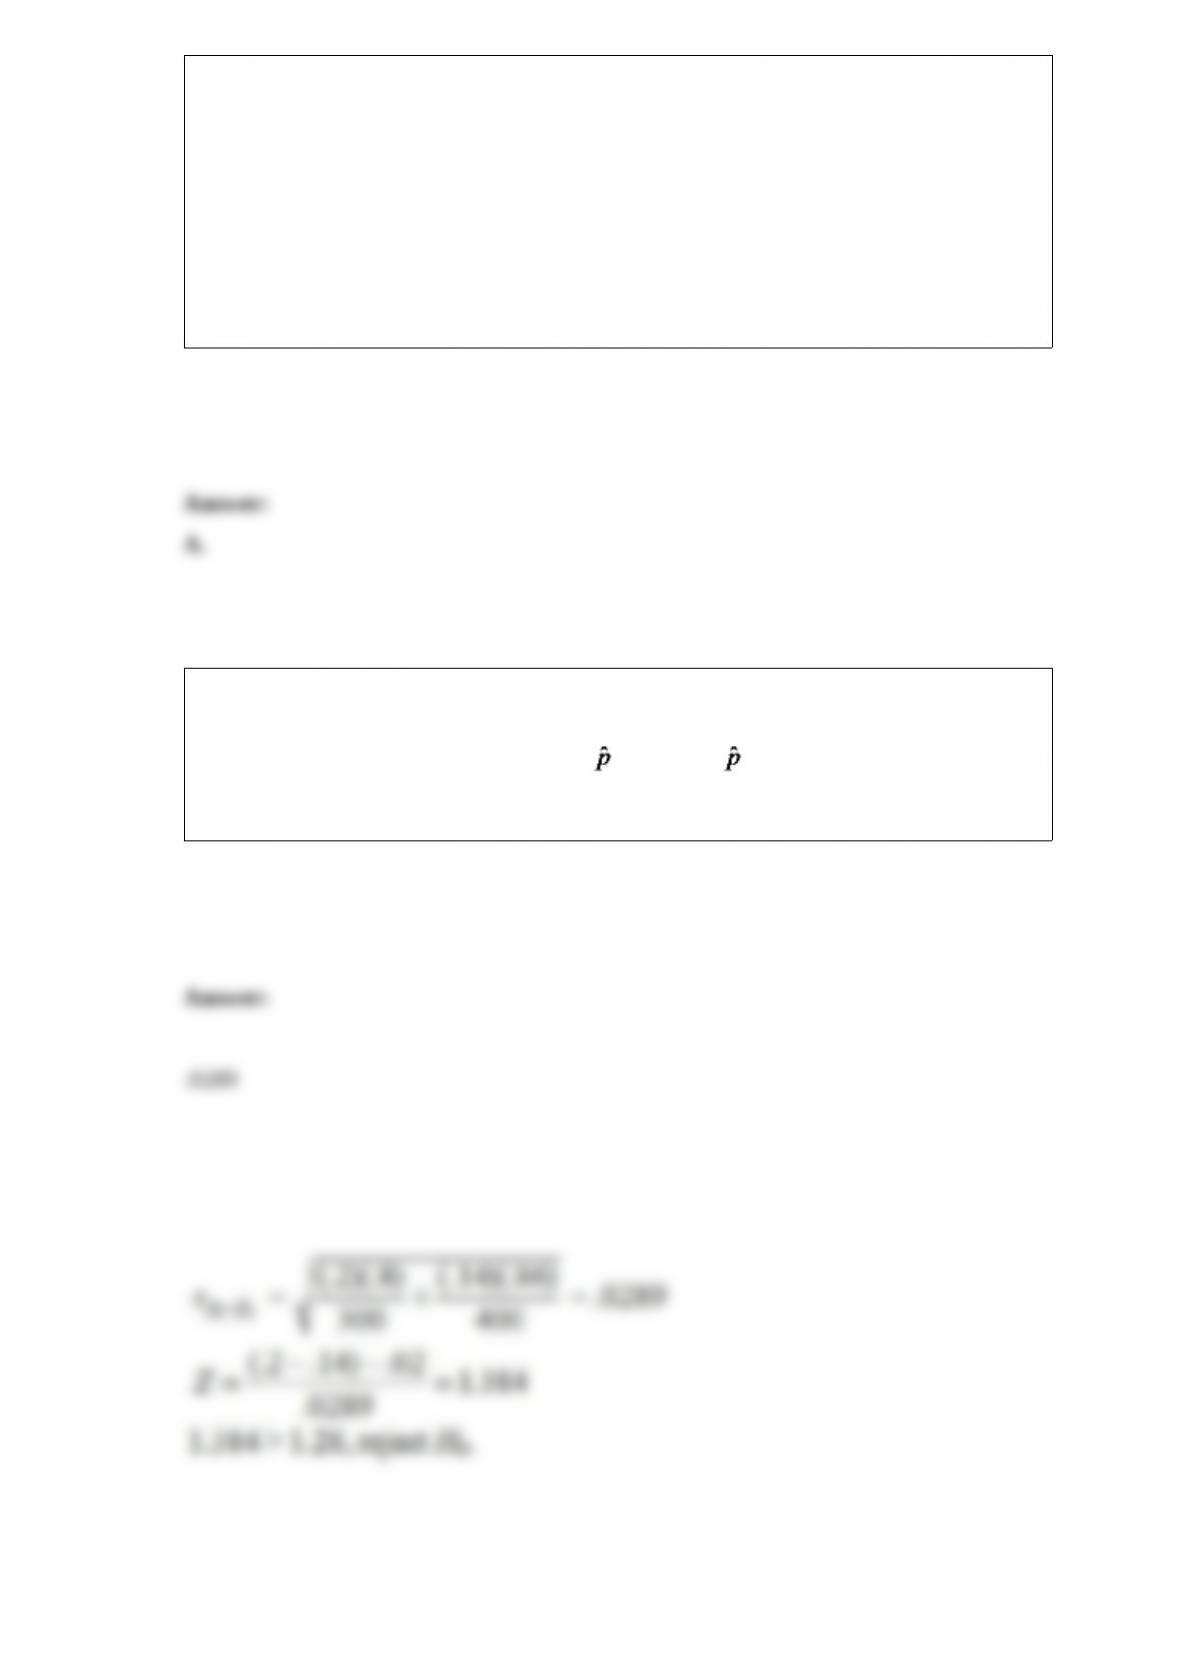
We are testing the hypothesis that the proportion of winter-quarter profit growth is more
than 2 percent greater for consumer industry companies (CON) than for banking
companies (BKG). At α = .10, given that CON = .20, BKG = .14, nCON = 300, and
nBKG = 400, calculate the estimated standard deviation for the model.

When sample size is 20, find t.10.
Consider the following partial analysis of variance table from a randomized block
design with 6 blocks and 4 treatments.
Source Sum of Squares
Treatments 15.93
Blocks 42.09
Error 23.84
Total 81.86

The linear regression trend model was applied to a time series sales data set based on
the last 24 months’ sales. The following partial computer output was obtained.
Test the significance of the time term at α =.05. State the critical t value and make your
decision using a two-sided alternative.
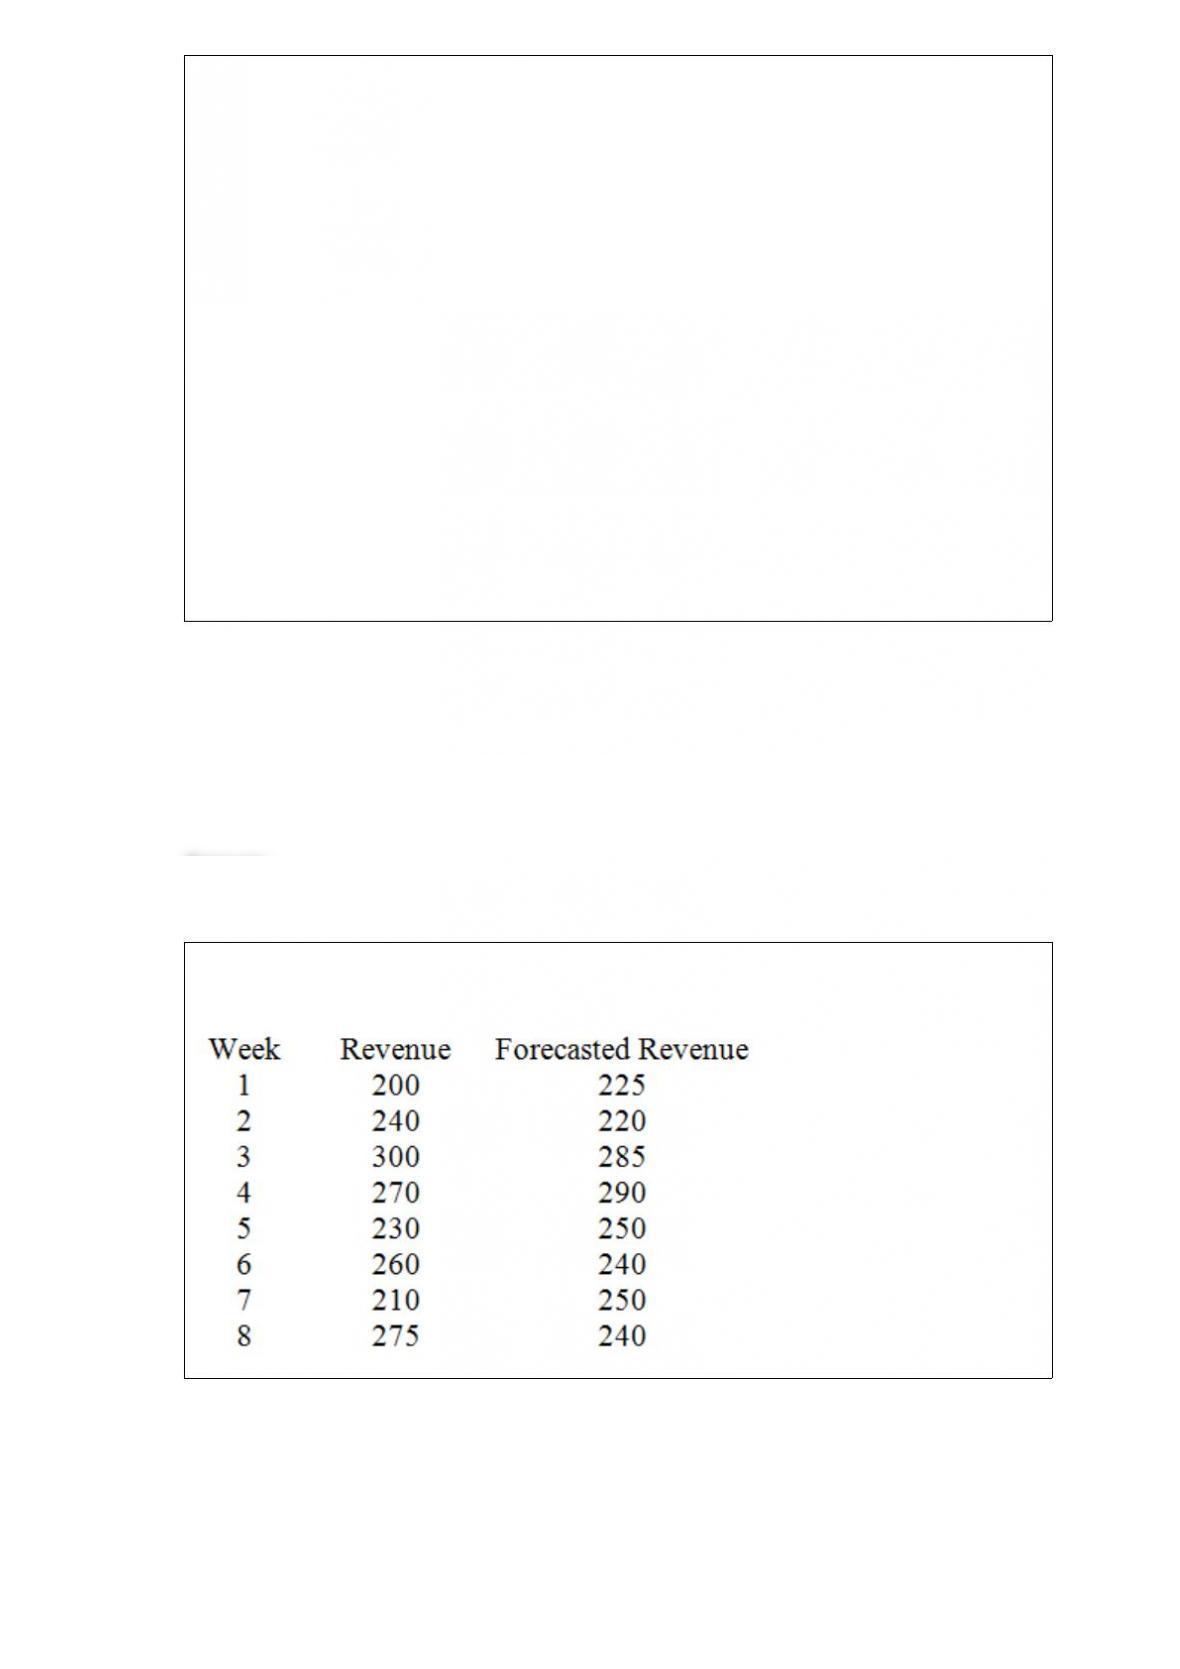
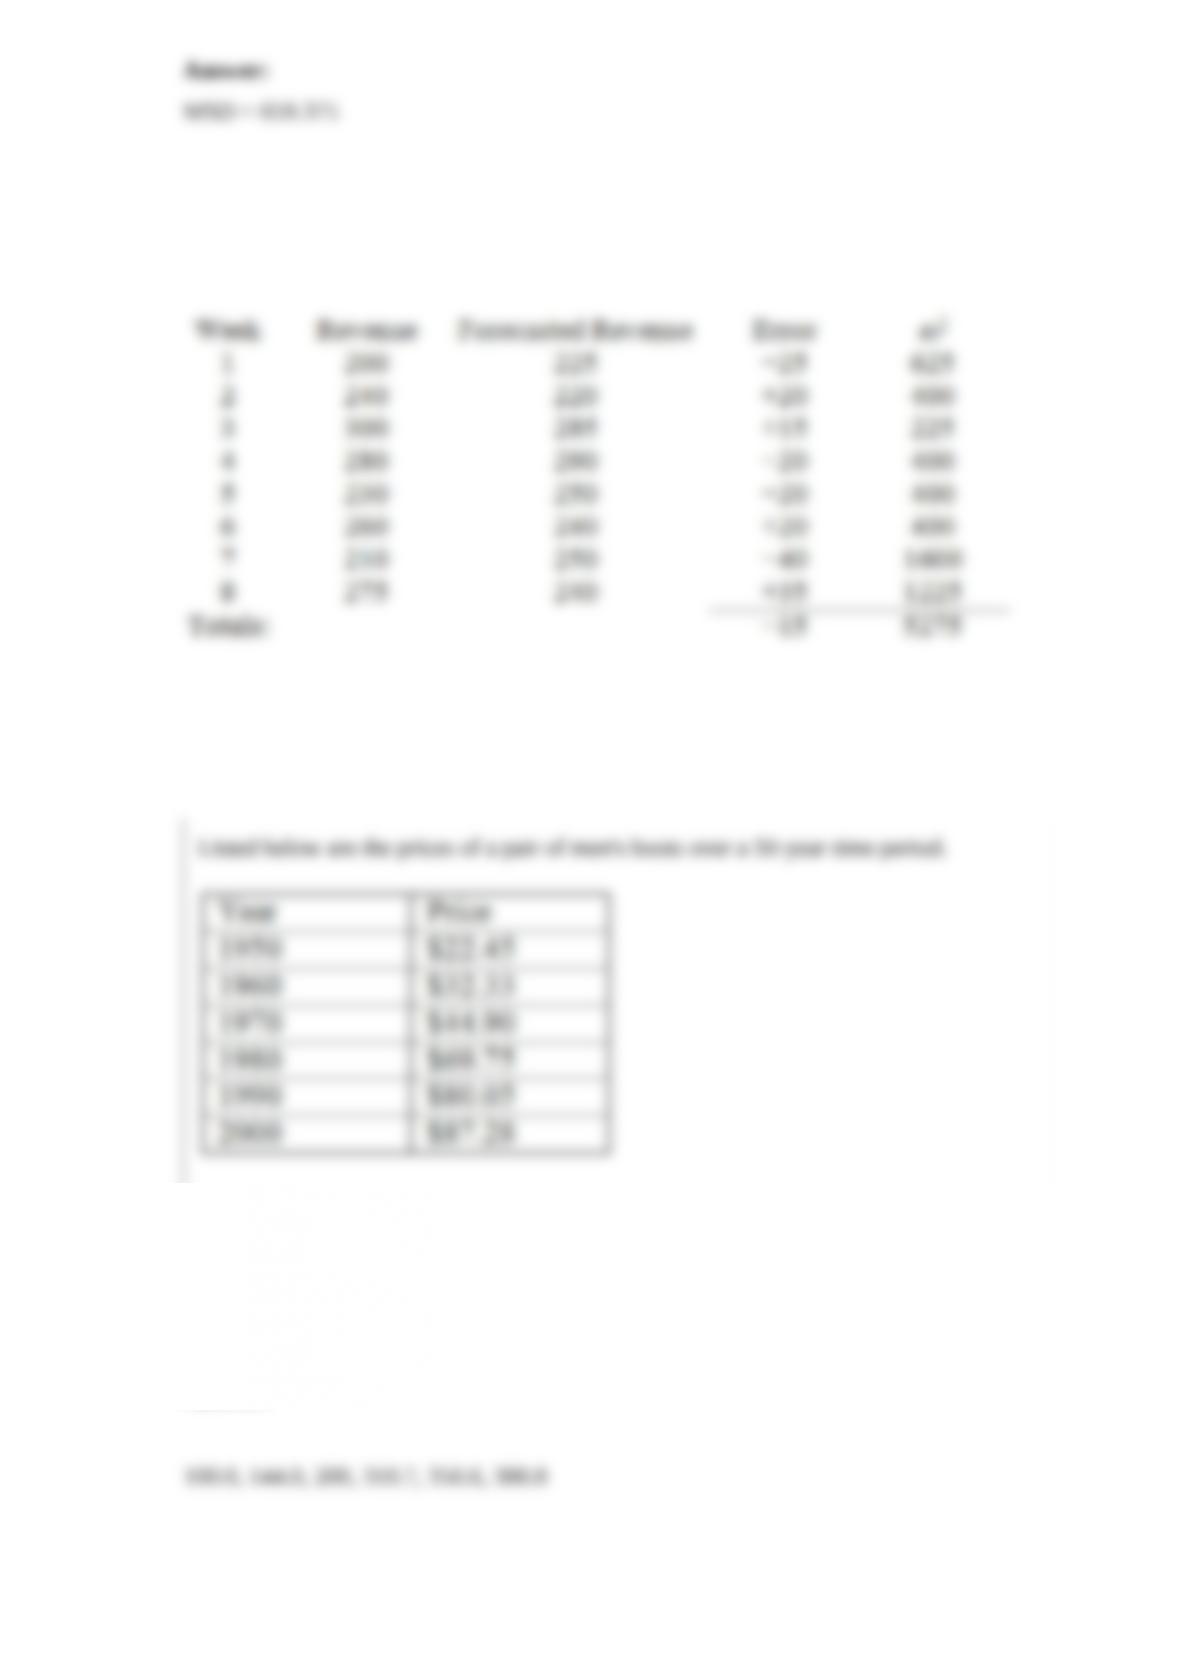
Given the following data, compute the mean squared deviation (error).
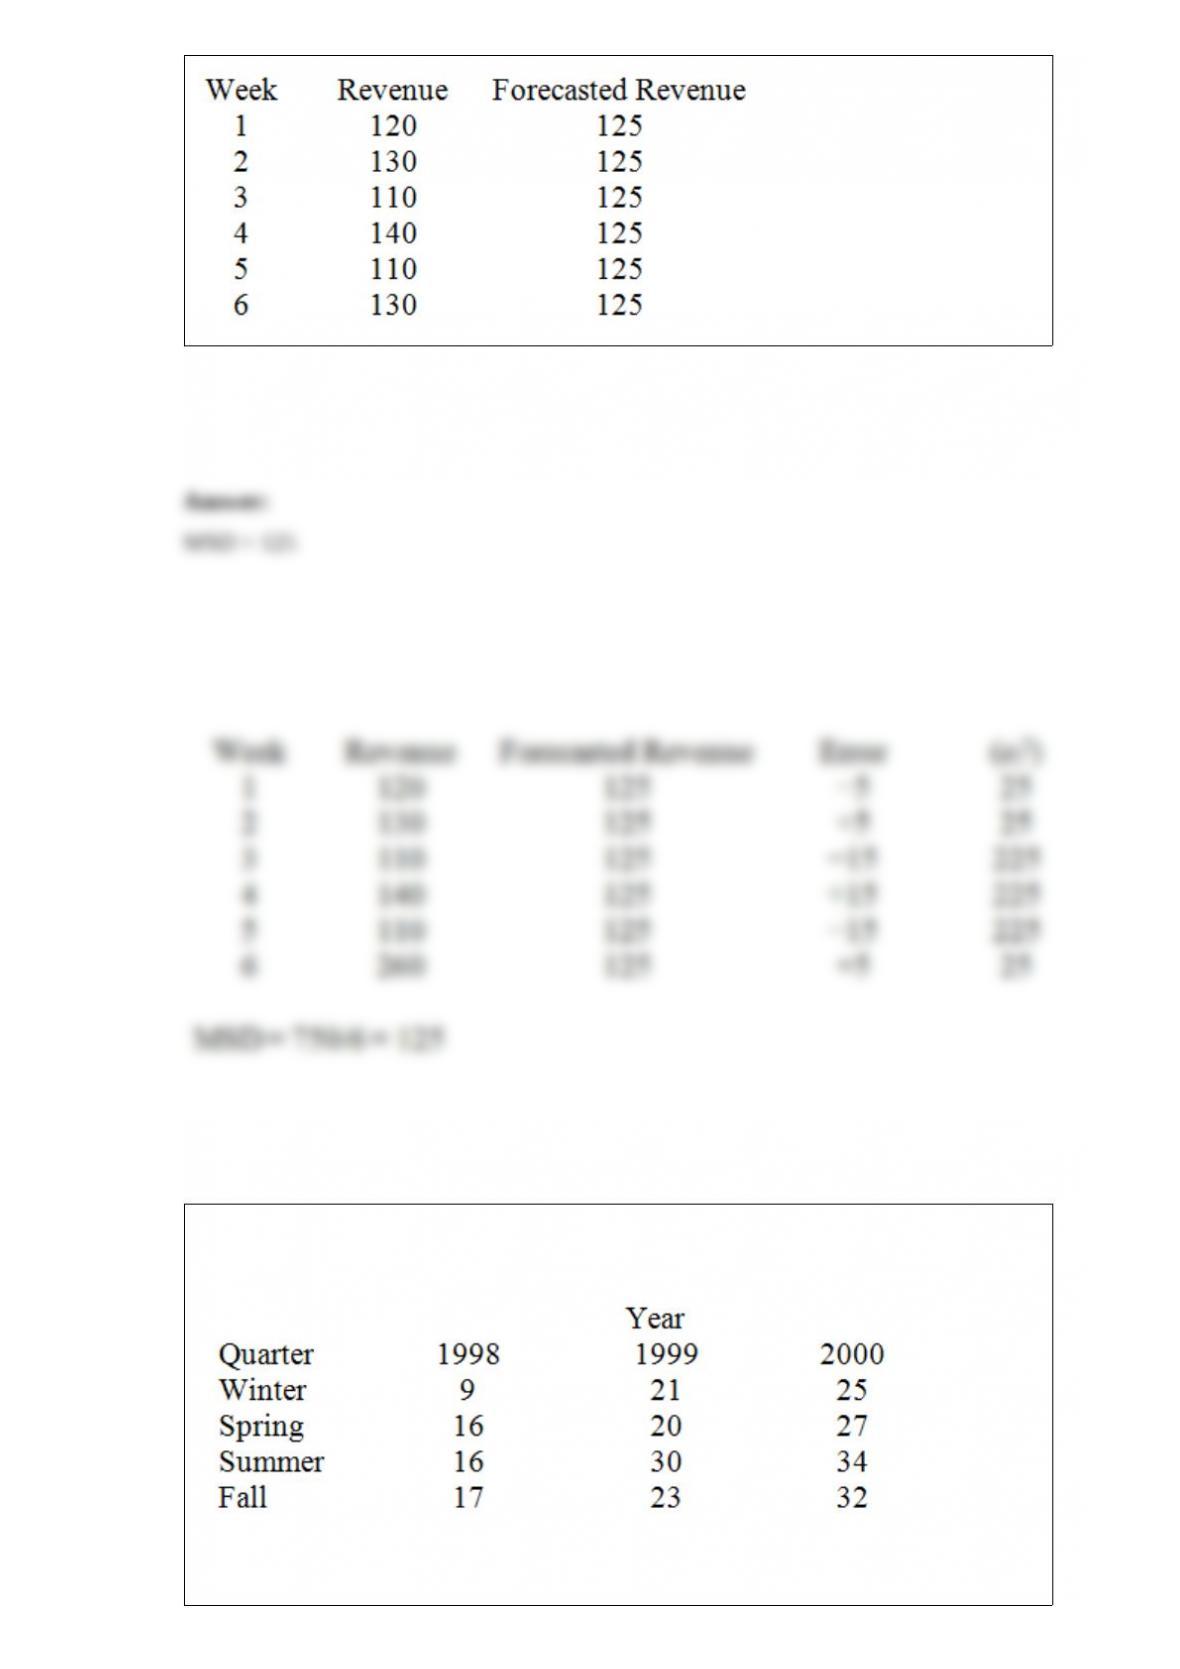
Consider the quarterly production data (in thousands of units) for the XYZ
manufacturing company below.
Calculate the 4-period (quarter) moving average for the entire time series.
A test of mathematical ability is given to a random sample of 10 eighth-grade students
before and after they complete a semester-long basic mathematics course. The mean
score before the course was 119.60, and after the course the mean score was 130.80.
The standard deviation of the difference is 16.061. Test the hypothesis at α = .05 using a
t test.
An owner of two cats is trying to decide if it is cheaper to order cat food over the
Internet or to buy the food locally. Listed below are the prices (in dollars) quoted for
two bags of cat food from various manufacturers.
Internet Local Stores
26.00 33.98
27.99 37.75
31.50 38.99
32.75 35.79
27.00 33.99
27.98 34.79
24.75 29.98
28.15 33.00
29.99 32.00
29.99
Calculate the value of TI and TE.
A. 60, 130
B. 130, 60
C. 55, 135
D. 135, 55
Given the following data, compute the mean squared error (deviation).
The following results were obtained from a simple regression analysis.
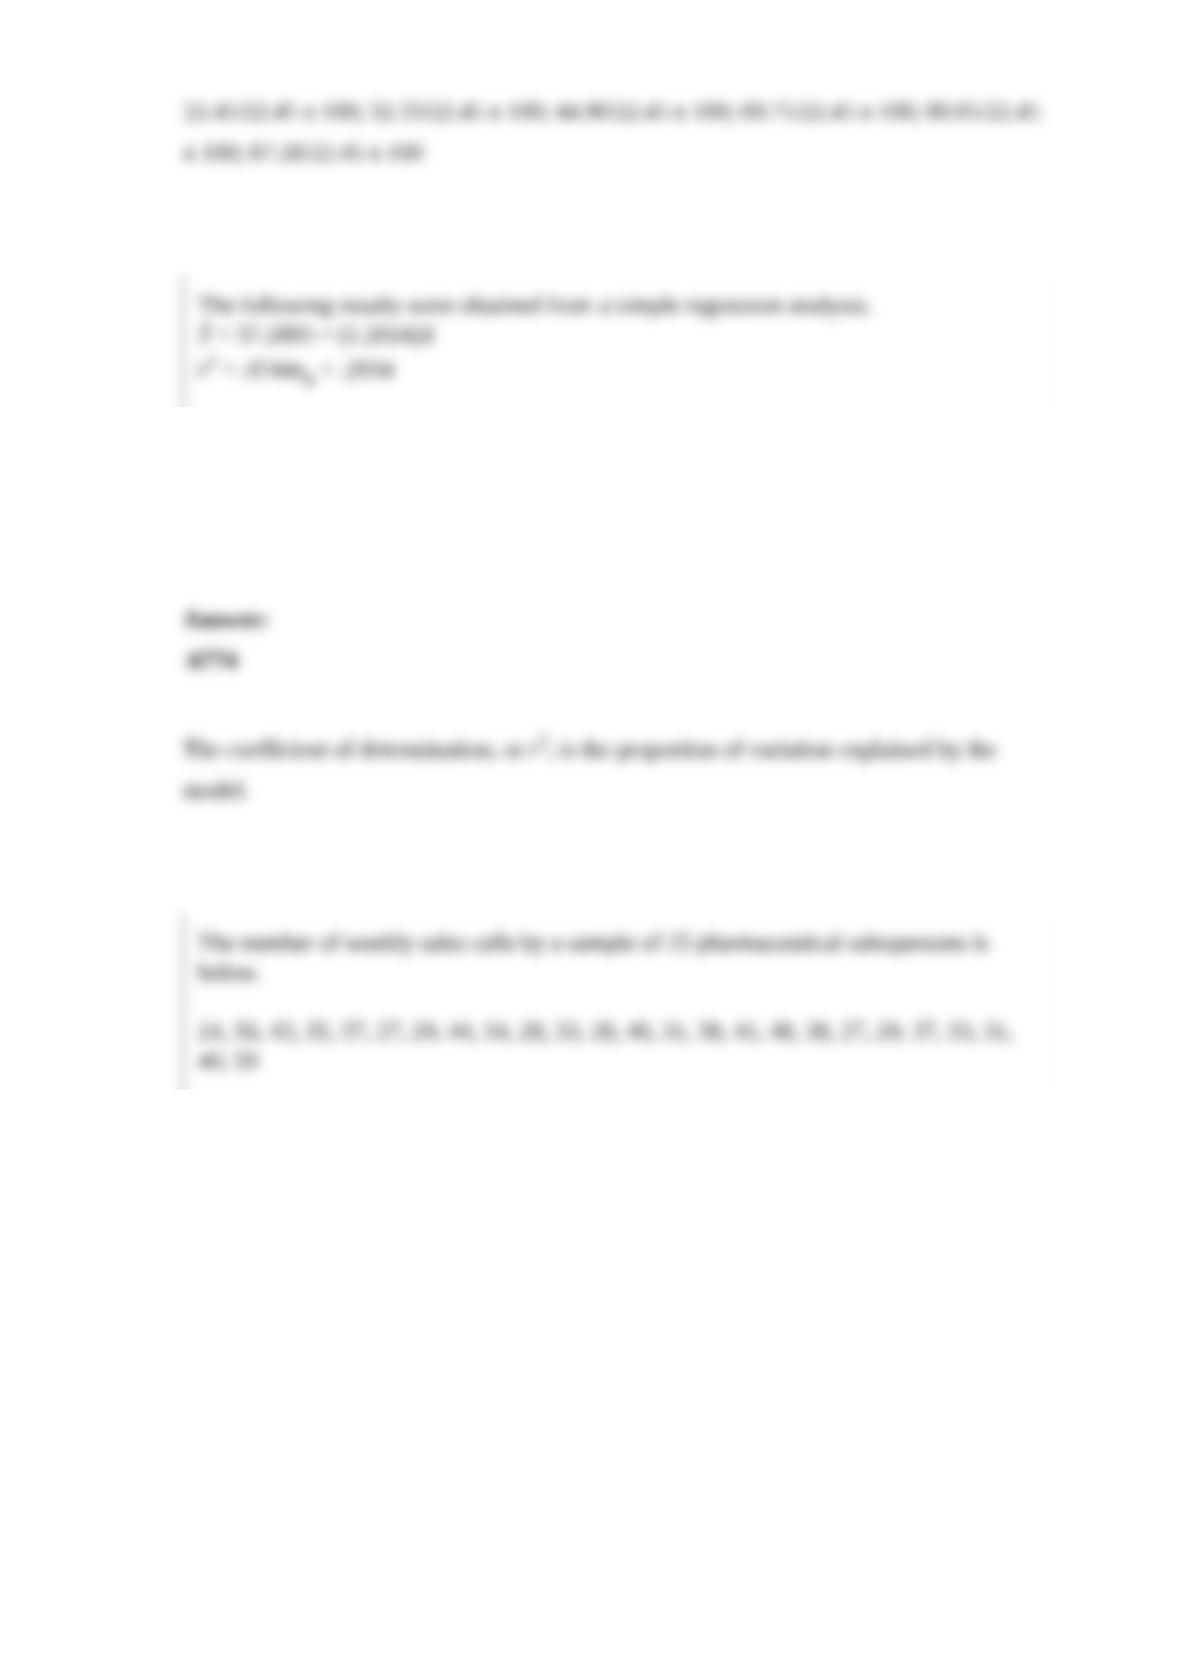
Ŷ = 37.2895 − (1.2024)X
r2 = .6744sb = .2934
What is the proportion of the variation explained by the simple linear regression model?
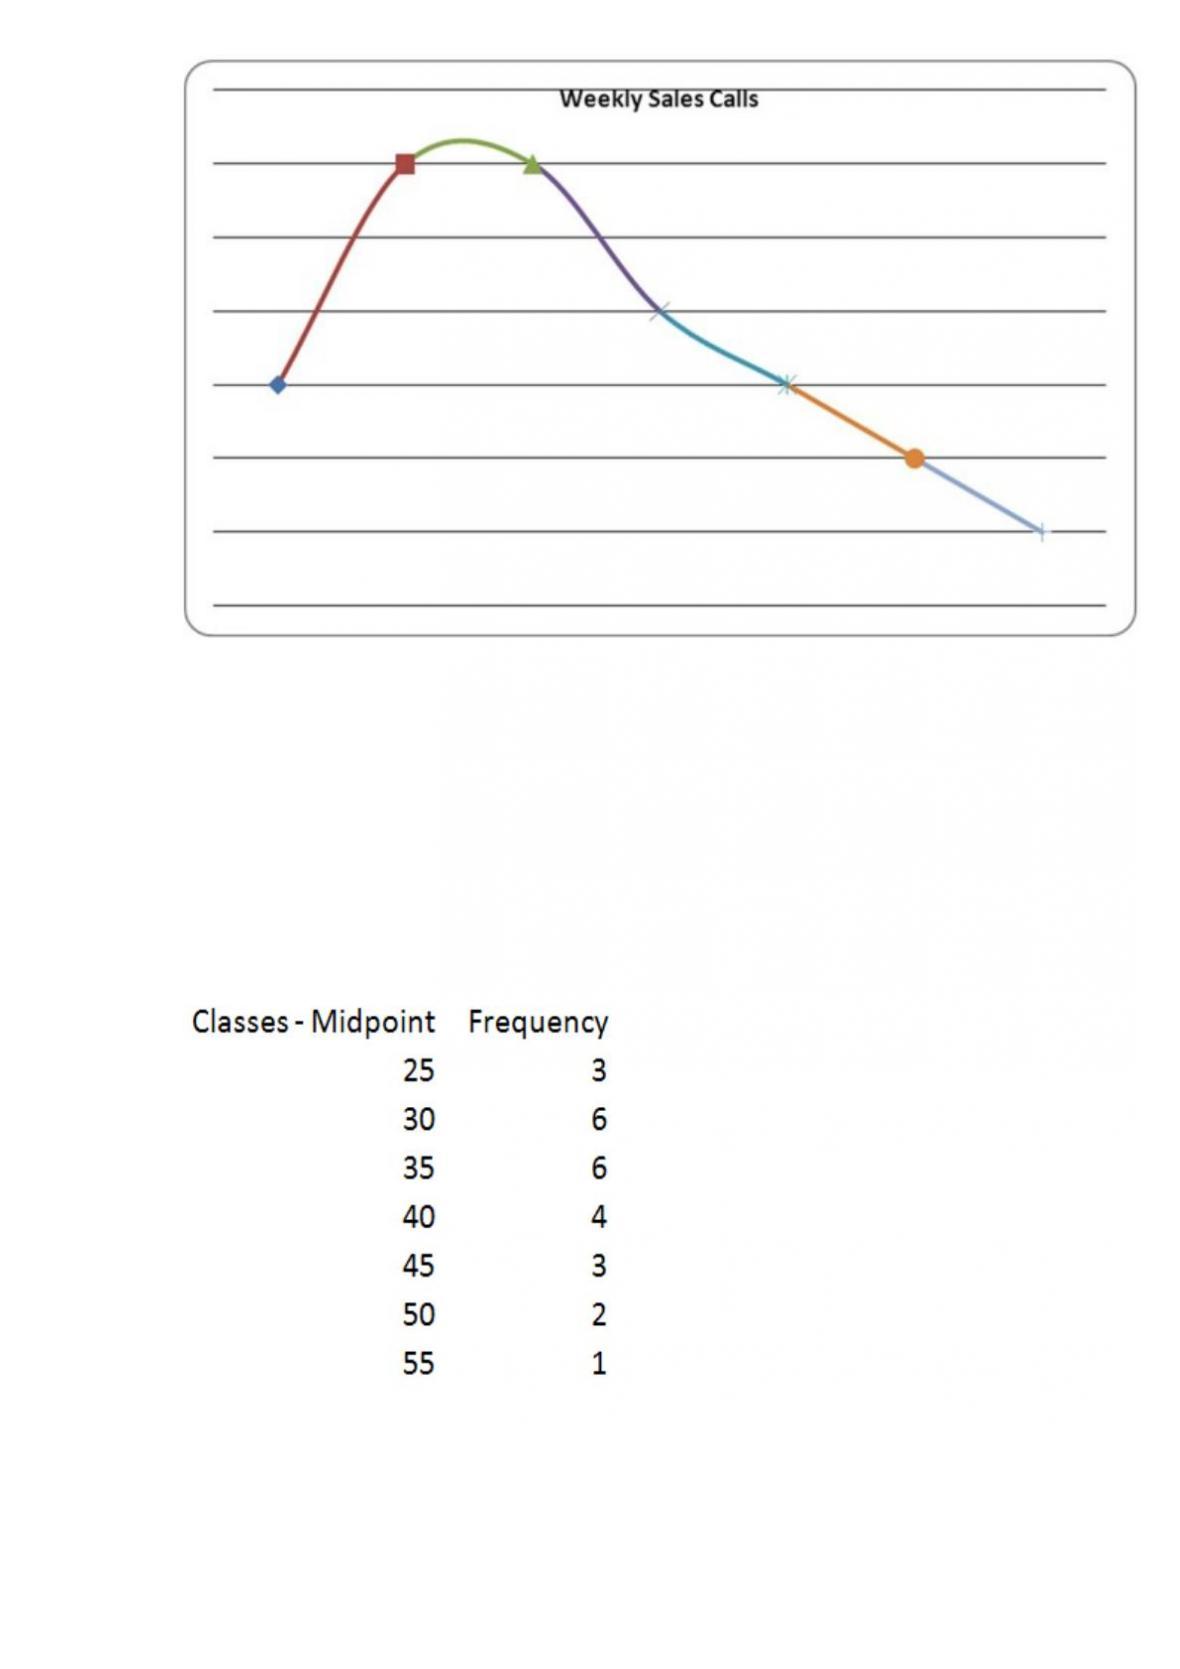
The number of weekly sales calls by a sample of 25 pharmaceutical salespersons is
below.
24, 56, 43, 35, 37, 27, 29, 44, 34, 28, 33, 28, 46, 31, 38, 41, 48, 38, 27, 29, 37, 33, 31,
40, 50
Construct a frequency polygon.
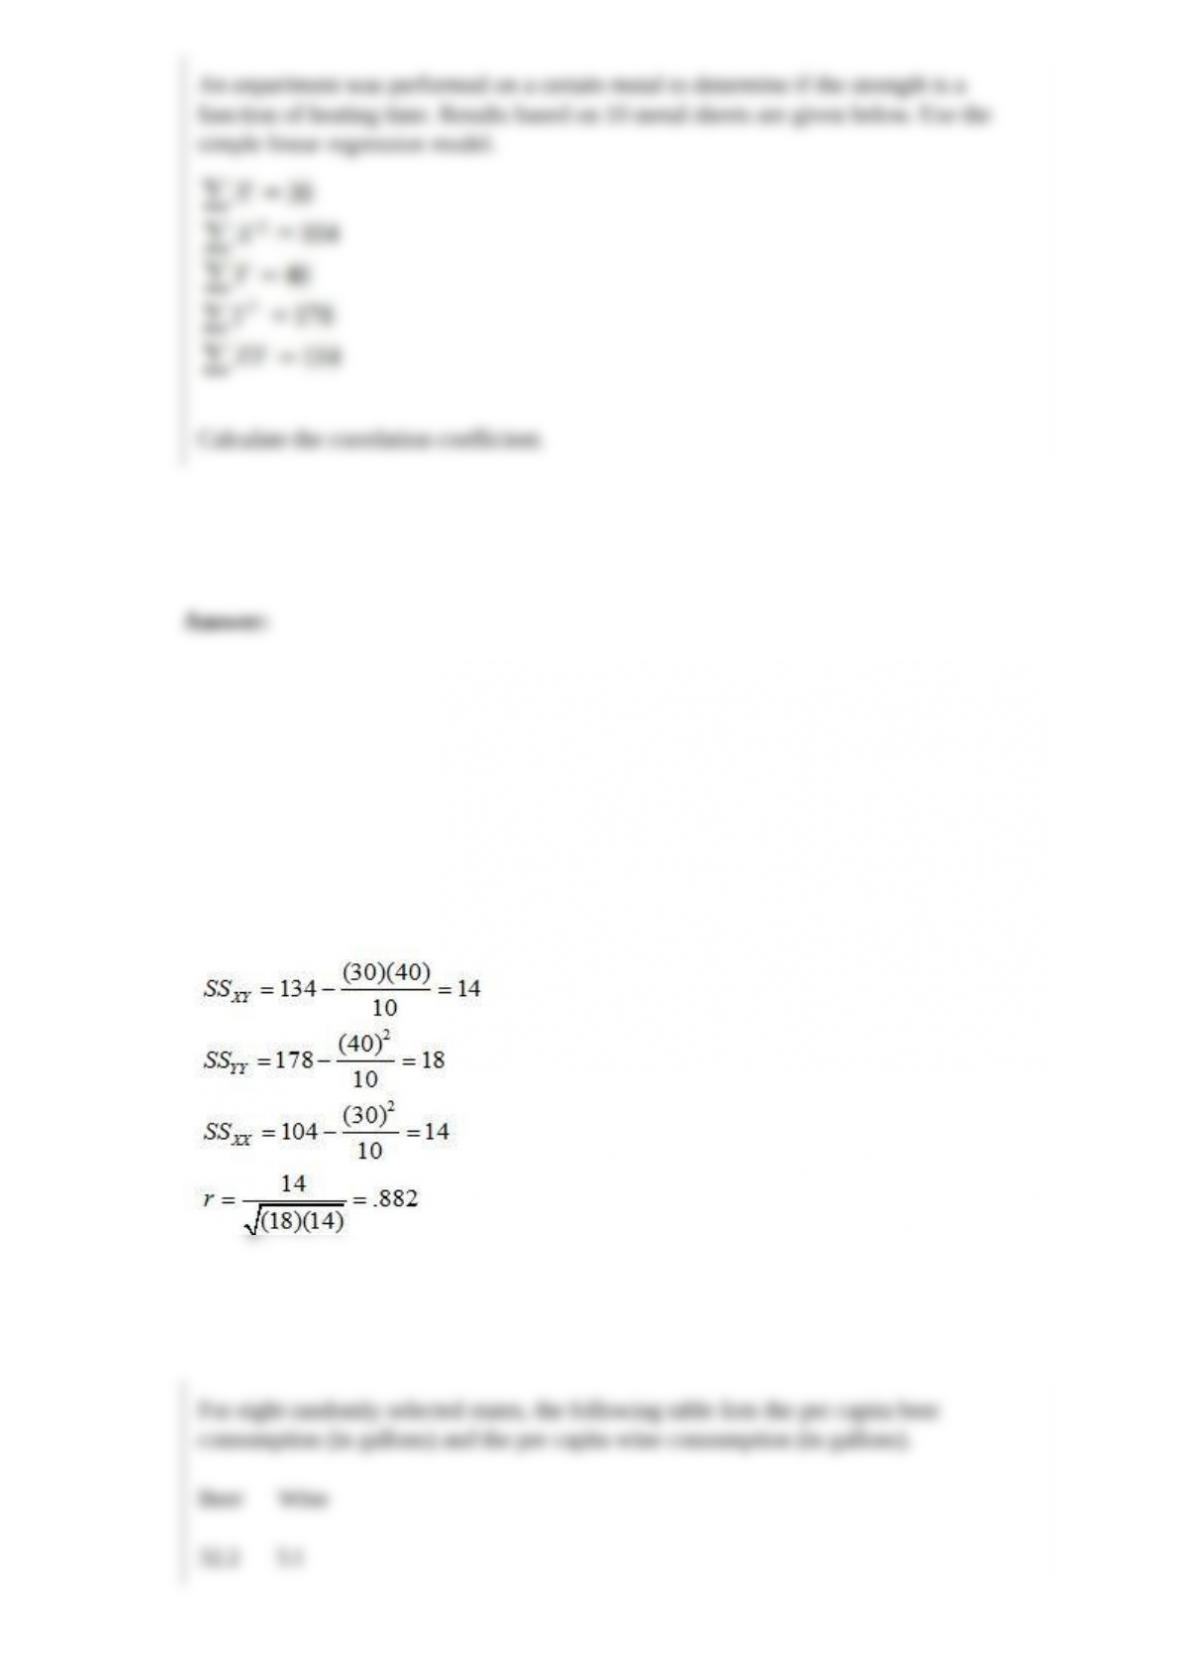
An experiment was performed on a certain metal to determine if the strength is a
function of heating time. Results based on 10 metal sheets are given below. Use the
simple linear regression model.
Calculate the correlation coefficient.
For eight randomly selected states, the following table lists the per capita beer
consumption (in gallons) and the per capita wine consumption (in gallons).
Beer Wine
32.2 3.1
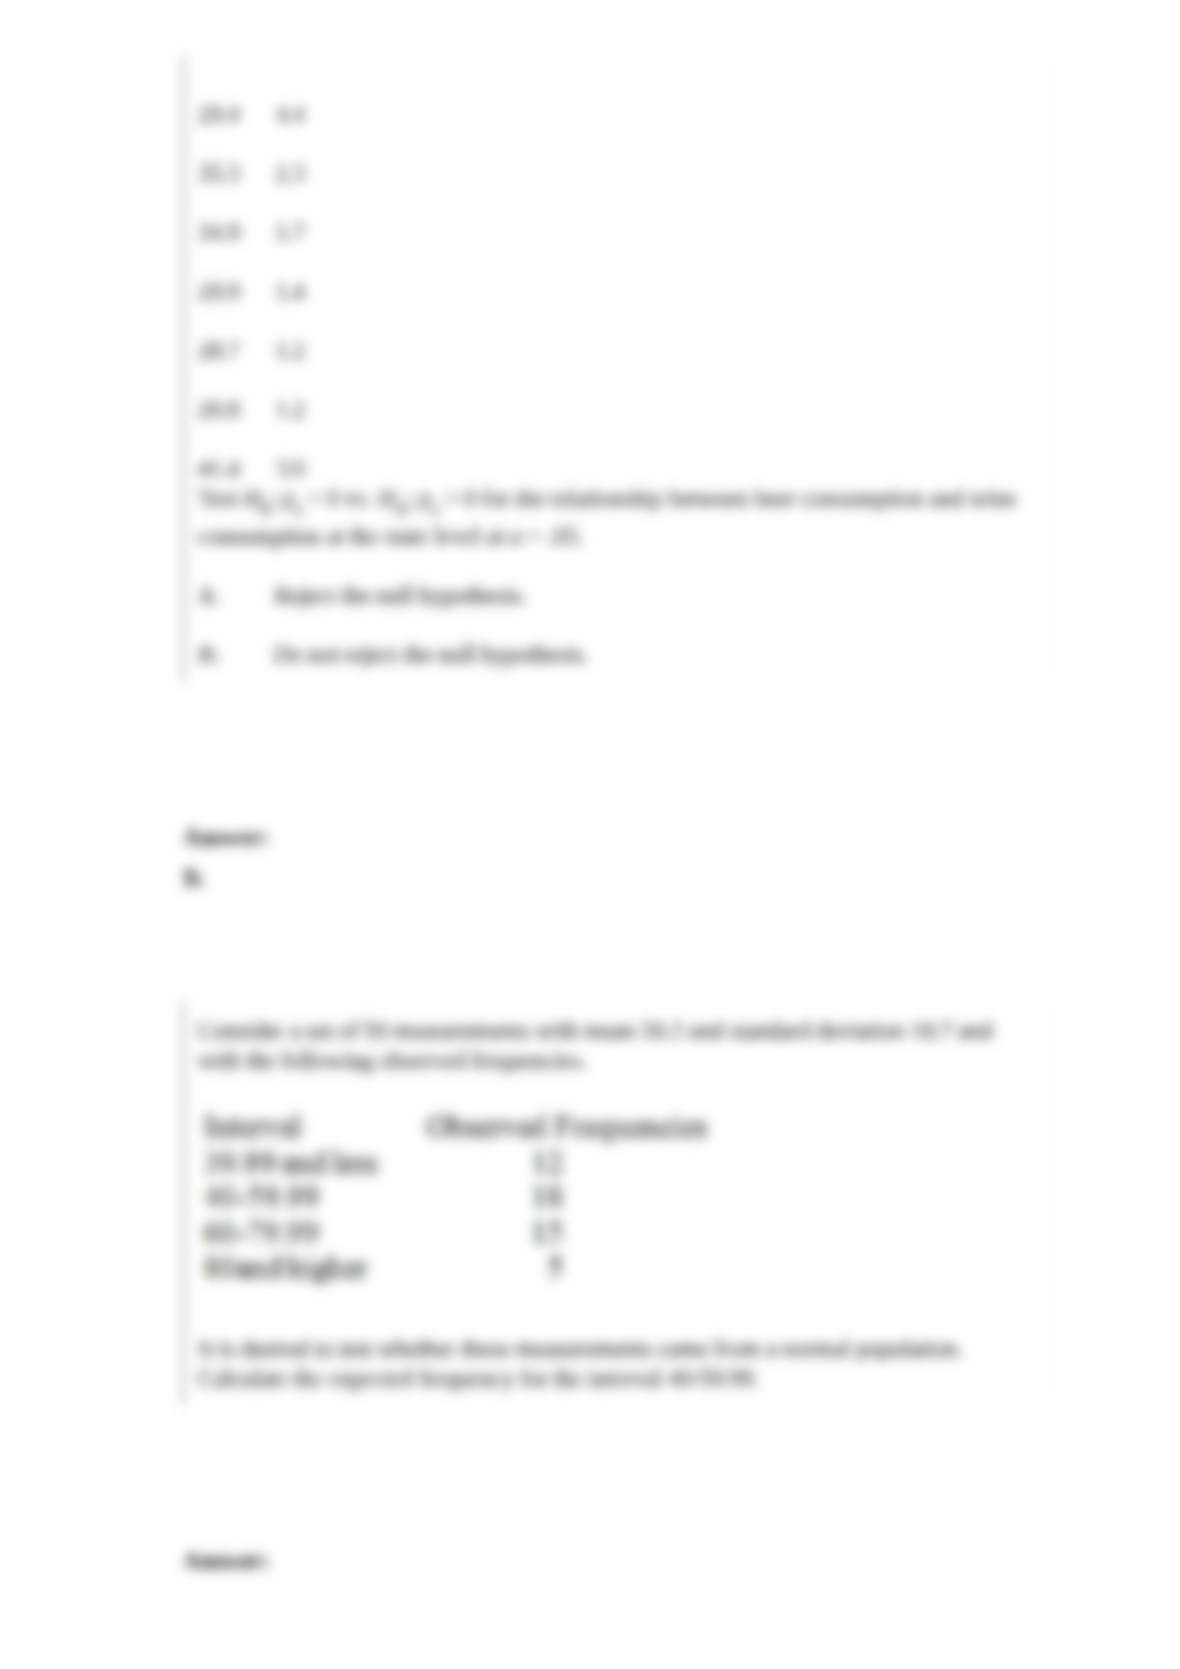
29.4 4.4
35.3 2.3
34.9 1.7
29.9 1.4
28.7 1.2
26.8 1.2
41.4 3.0
Test H0: ps = 0 vs. HA: ps > 0 for the relationship between beer consumption and wine
consumption at the state level at α = .05.
A. Reject the null hypothesis.
B. Do not reject the null hypothesis.
Consider a set of 50 measurements with mean 50.2 and standard deviation 18.7 and
with the following observed frequencies.
It is desired to test whether these measurements came from a normal population.
Calculate the expected frequency for the interval 40-59.99.
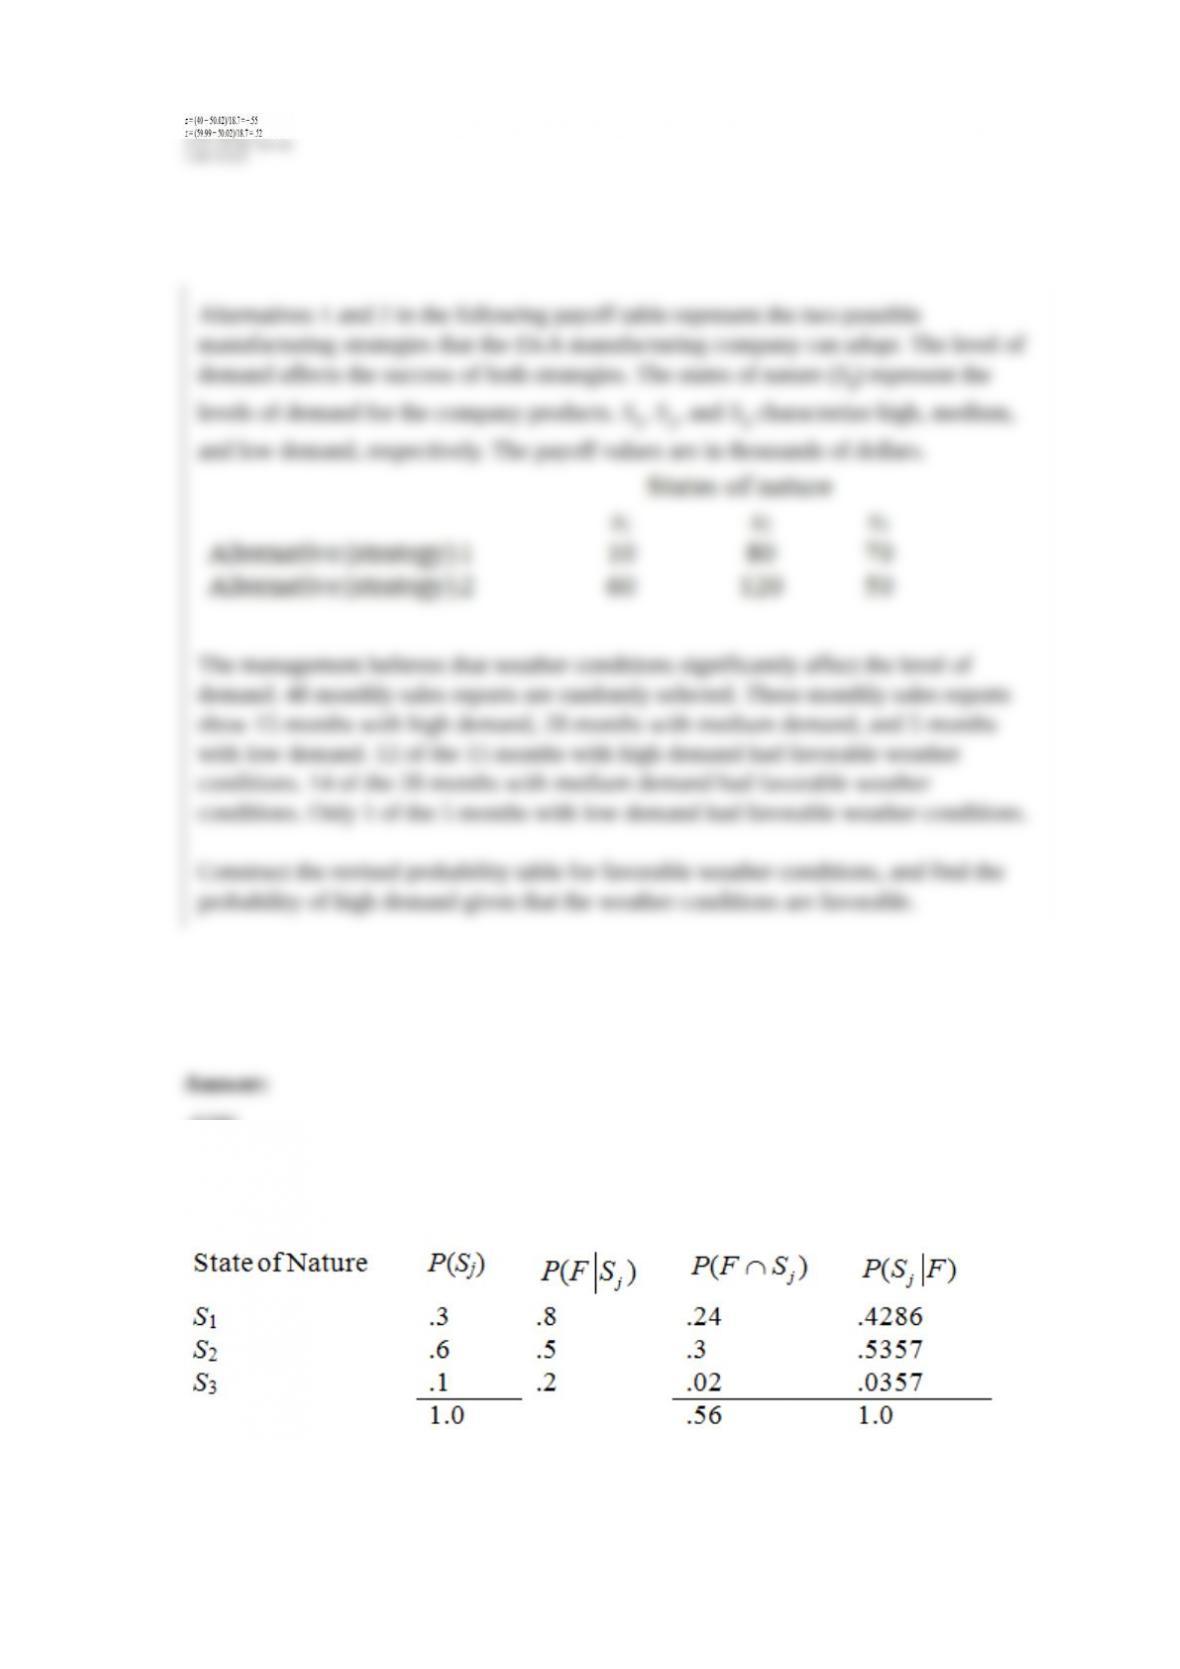
Alternatives 1 and 2 in the following payoff table represent the two possible
manufacturing strategies that the EKA manufacturing company can adopt. The level of
demand affects the success of both strategies. The states of nature (SI) represent the
levels of demand for the company products. S1, S2, and S3 characterize high, medium,
and low demand, respectively. The payoff values are in thousands of dollars.
The management believes that weather conditions significantly affect the level of
demand. 48 monthly sales reports are randomly selected. These monthly sales reports
show 15 months with high demand, 28 months with medium demand, and 5 months
with low demand. 12 of the 15 months with high demand had favorable weather
conditions. 14 of the 28 months with medium demand had favorable weather
conditions. Only 1 of the 5 months with low demand had favorable weather conditions.
Construct the revised probability table for favorable weather conditions, and find the
probability of high demand given that the weather conditions are favorable.