
For which of the following products is social influence likely to have the greatest
impact?
A) toothpaste
B) restaurants
C) high-blood pressure medication
D) school textbook
In 1930, the U.S. government attempted to help domestic firms that were harmed by the
Great Depression by
A) establishing the General Agreement on Tariffs and Trade (GATT).
B) passing the Smoot-Hawley Tariff.
C) establishing the World Trade Organization (WTO).
D) passing the North American Free Trade Agreement (NAFTA).
Most people buy salt infrequently and in small quantities. Even a doubling of the price
of salt is likely to result in a small decline in the quantity of salt demanded. Therefore,
A) the demand for salt will be perfectly inelastic.

B) salt is a normal good.
C) the demand for salt is relatively inelastic.
D) the price elasticity of demand for salt is greater than 1 (in absolute value).
If, for a product, the quantity supplied exceeds the quantity demanded, the market price
will fall until
A) the quantity demanded exceeds the quantity supplied. The market will then be in
equilibrium.
B) quantity demanded equals quantity supplied. The equilibrium price will then be
lower than the market price.
C) all consumers will be able to afford the product.
D) quantity demanded equals quantity supplied. The market price will then equal the
equilibrium price.
If more insurance companies decide to cover part of the price of voluntary laser eye
surgery and more doctors decide to enter the field of laser eye surgery, what will happen
in the market for laser eye surgery as a result of these two factors?
A) Demand will increase, but these two factors will not shift the supply curve.
B) Supply will increase, but these two factors will not shift the demand curve.

C) Demand and supply will both increase.
D) Demand will increase and supply will decrease.
A franchise is
A) a firm that buys and operates a brand name business in a new market.
B) a firm with the legal right to sell a good or service in a particular area.
C) a firm with no competitors.
D) a branch of a national company.
Figure 5-7
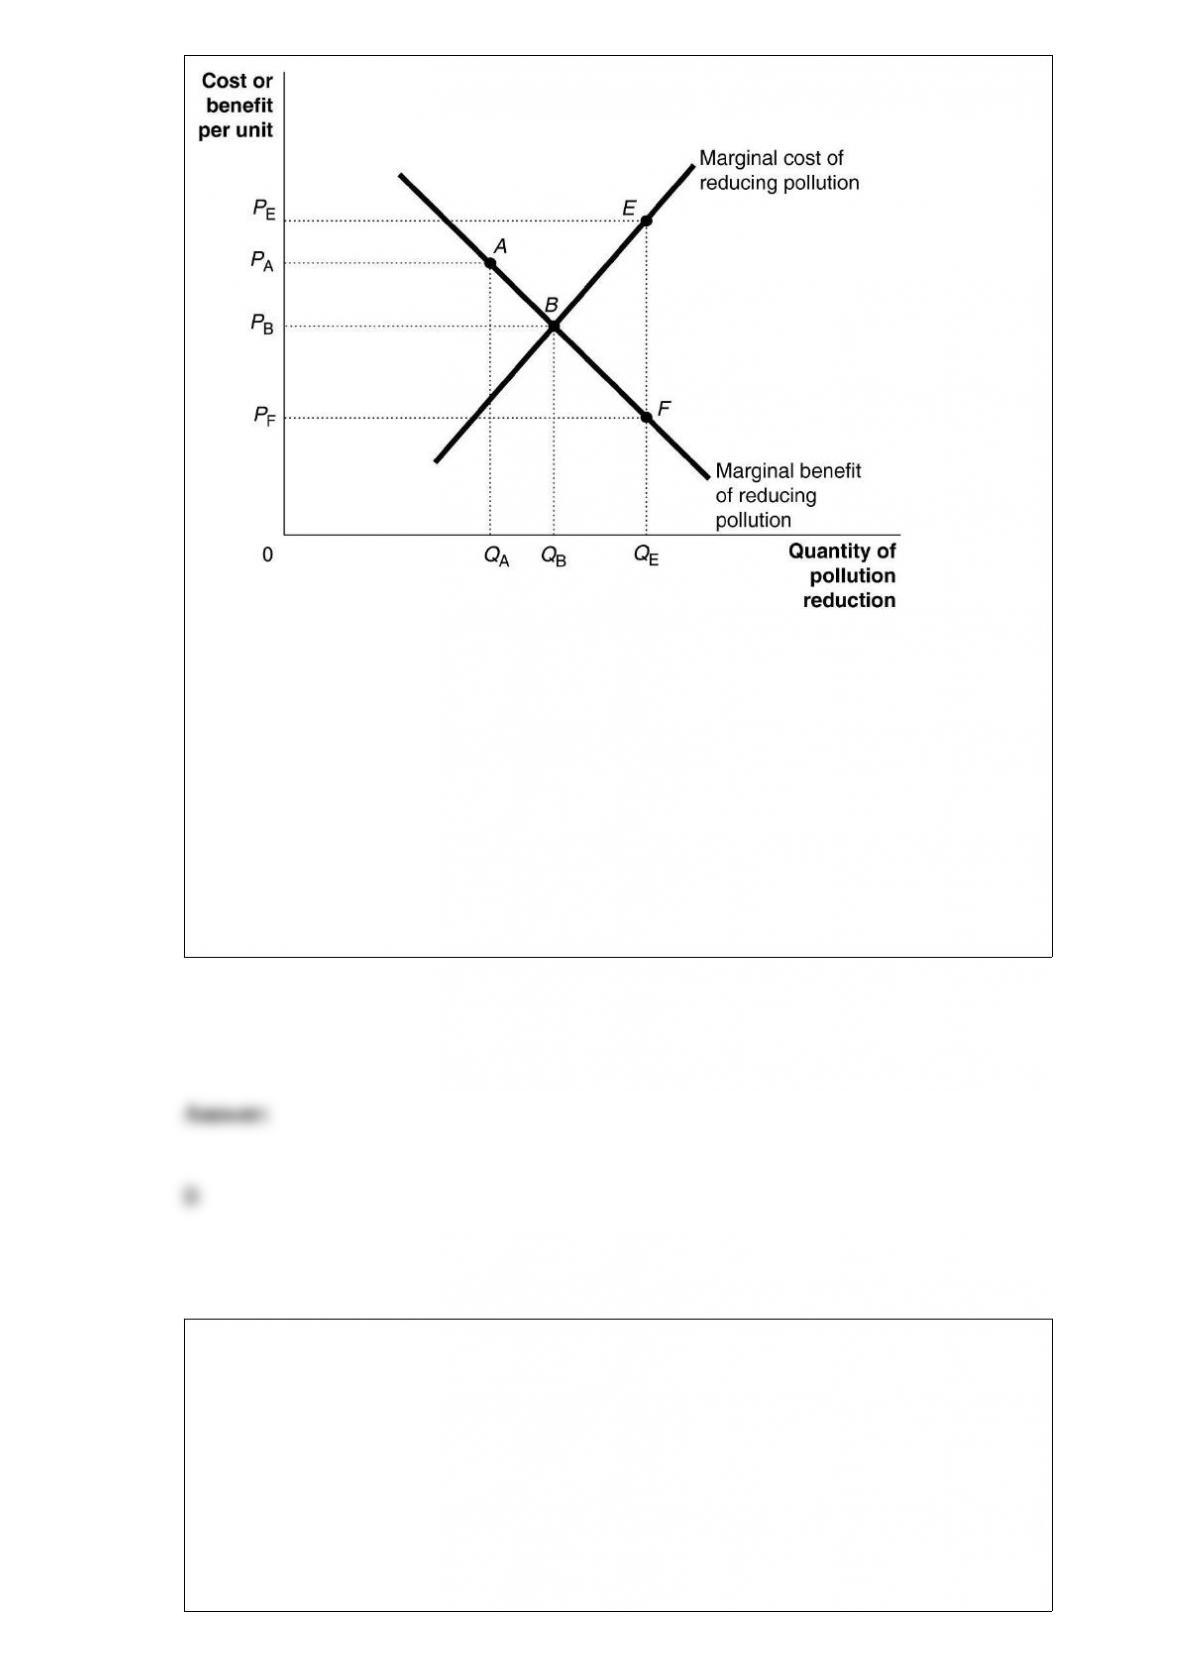
Refer to Figure 5-7. What is the incremental cost of increasing the quantity of pollution
reduction from QB to QE units?
A) PE
B) the value of the area QBBEQE
C) PE×QE
D) the value of the area BEF
In a subgame-perfect equilibrium
A) the first mover has an advantage over other players.
B) the last mover has an advantage over other players.
C) each player’s strategy constitutes a Nash equilibrium at every subgame of the
original game.

D) each player has the same response as the others at every subgame of the tree.
A profit maximizing monopoly’s price is
A) the same as the price that would prevail if the industry was perfectly competitive.
B) less than the price that would prevail if the industry was perfectly competitive.
C) greater than the price that would prevail if the industry was perfectly competitive.
D) not consistently related to price that would prevail if the market was perfectly
competitive.
Figure 10-2
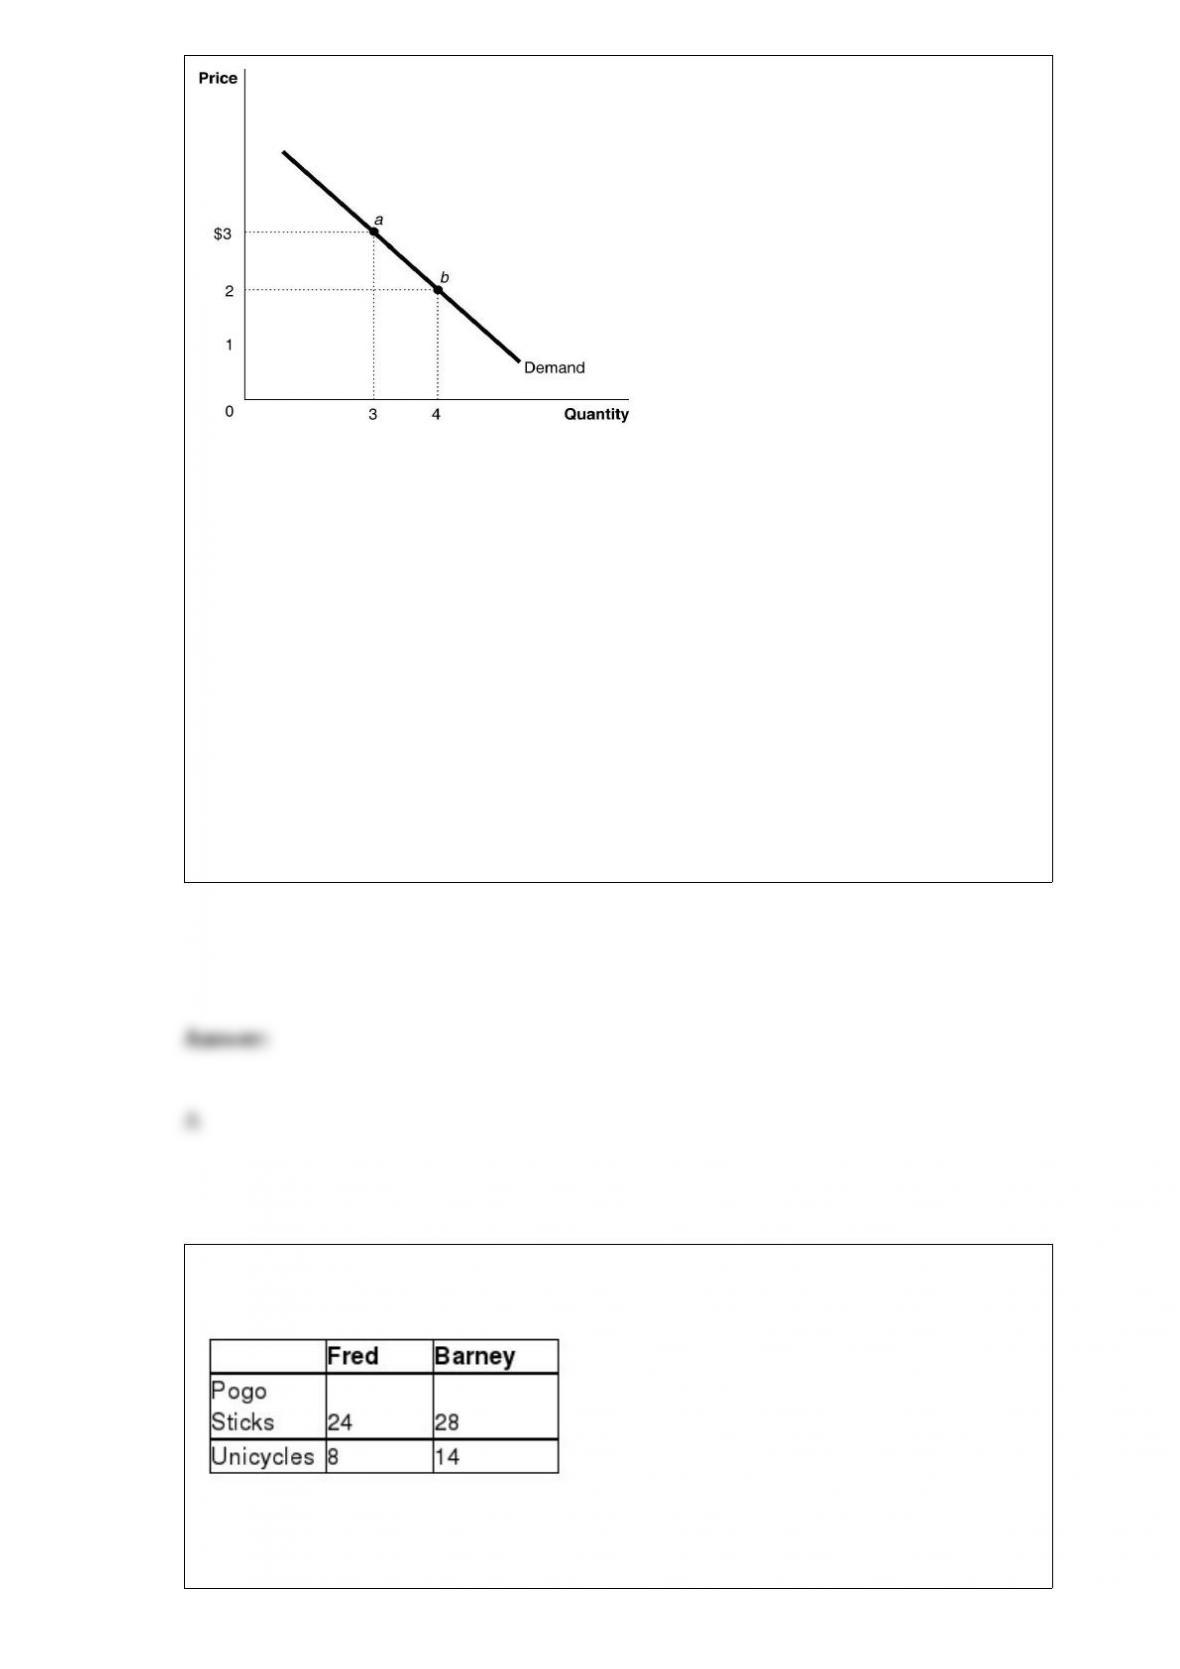
Figure 10-2 represents the demand for ice cream cones.
Refer to Figure 10-2. Which of the following statements is true?
A) Points a and b are the utility-maximizing quantities of ice cream cones at two
different prices of ice cream.
B) Points a and b may not necessarily be the utility-maximizing quantities of ice cream
cones at two different prices because we have no information on the consumer’s budget
or the price of other goods.
C) Point a could be a utility-maximizing choice if the price is $3 but point b may not be
because we have no information on the marginal utility per dollar when price changes.
D) Points a and b are derived independently of the utility-maximizing model.
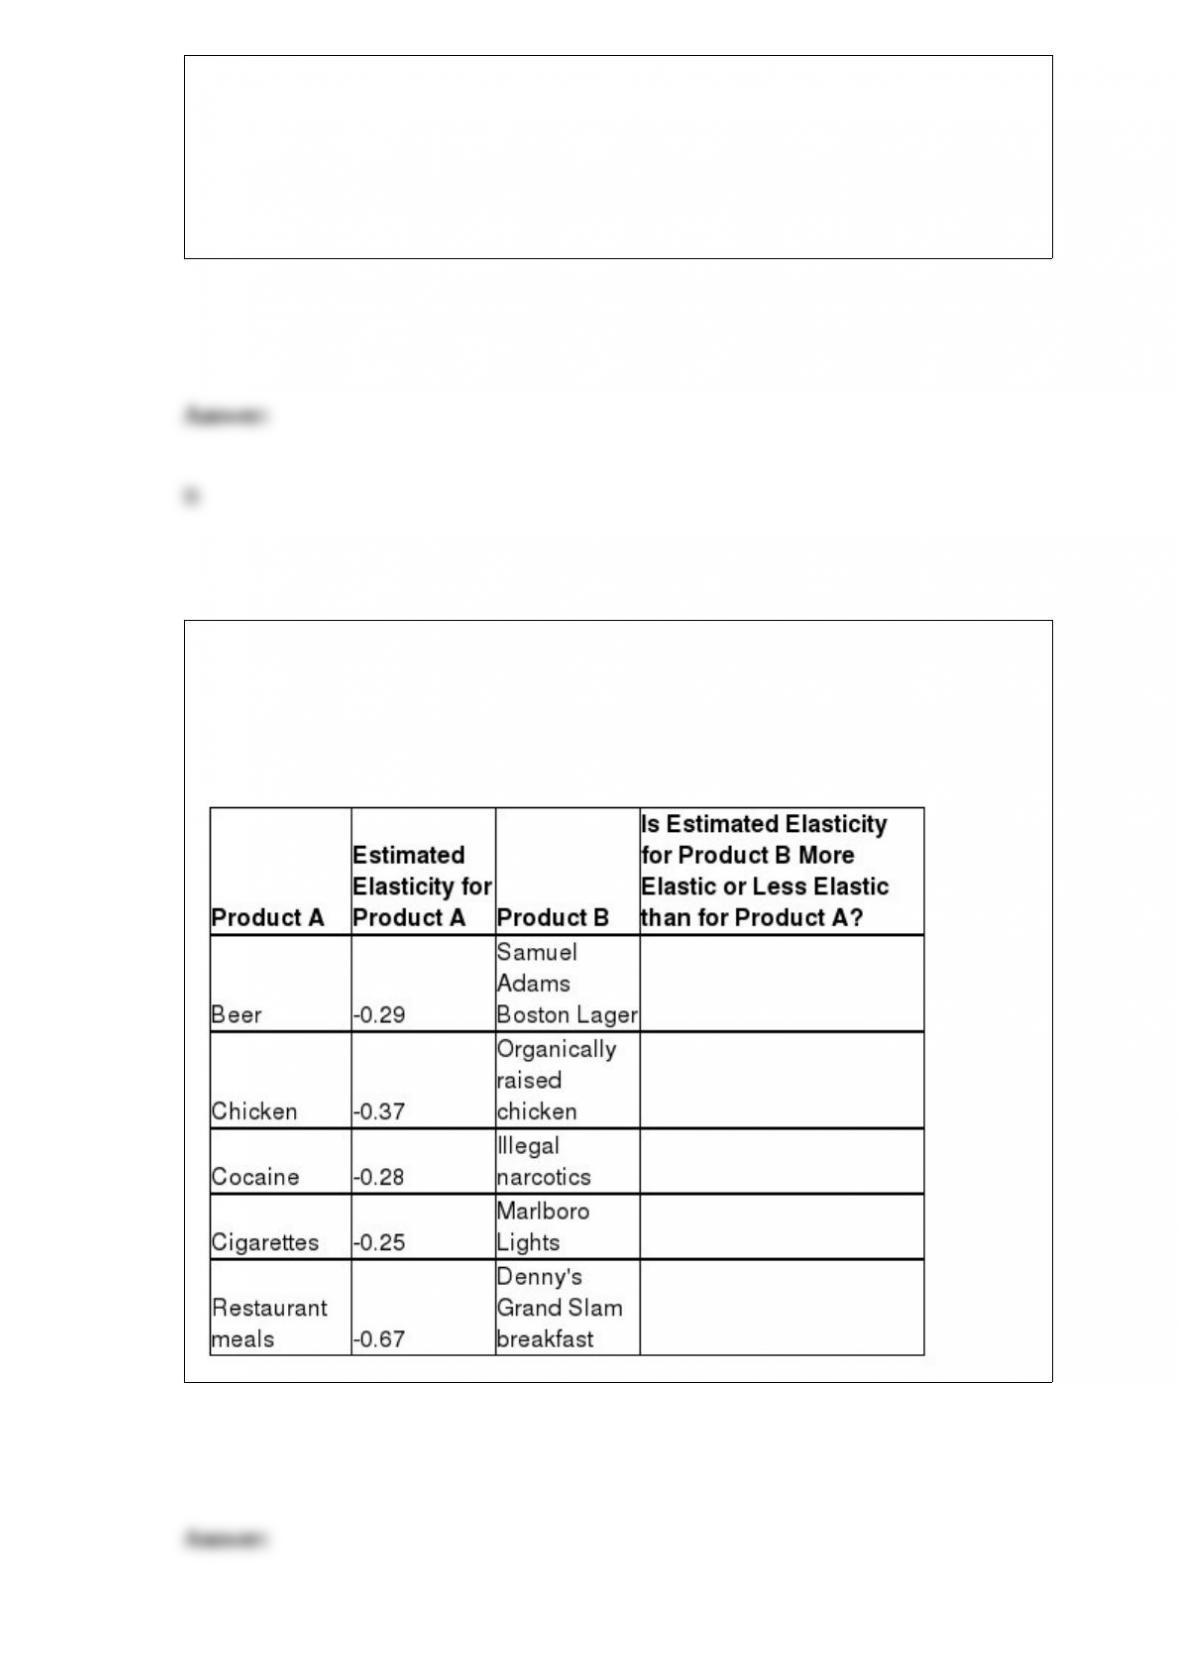
Table 2-7
Table 2-7 shows the output per month of two people, Fred and Barney. They can either
devote their time to making pogo sticks or making unicycles.

Refer to Table 2-7. What is Barney’s opportunity cost of making a unicycle?
A) 1/2 of a pogo stick
B) 2 pogo sticks
C) 75 unicycles
D) 8 pogo sticks
A network externality occurs when
A) there is production cost savings from being networked with suppliers.
B) there is production cost savings from being networked with buyers.
C) the usefulness of a good is affected by how many others use the good.
D) the usefulness of a good is affected by celebrities who use the good.
Political candidates often hold fundraisers by charging “per plate” for dinner. Wendy
purchased four tickets to a $1,000 per plate dinner for a local city council candidate. Is
this transaction economically efficient?
A) No, political candidates should never be allowed to overcharge for a fundraising
dinner.
B) Yes, it was a voluntary exchange that benefited both parties.
C) No, Wendy paid too much for four dinners.
D) Yes, but it is efficient only from the perspective of the candidate and not from the
perspective of Wendy.
The estimated price elasticities of demand for the products listed in the table as
“Product A” are from Table 6-2 in the text. Indicate whether the products listed as
“Product B” will have a more elastic or less elastic demand than the corresponding
Product A.

Suppose Jason owns a small pastry shop. Jason wants to maximize his profit, and
thinking back to the microeconomics class he took in college, he decides he needs to
produce a quantity of pastries which will minimize his average total cost. Will Jason’s
strategy necessarily maximize profits for his pastry shop?
A) Yes; Since Jason’s pastry shop is in a perfectly competitive market, the only way to
maximize profit is to produce the quantity where average total cost is minimized.
B) Not necessarily; This strategy will only maximize Jason’s profit in the long run, but
not in the short run.
C) No; In order to maximize profit, Jason would never want to produce the quantity
where average total cost is minimized.
D) Not necessarily; Depending on demand, Jason may maximize profit by producing a
quantity other than that where average total cost is at a minimum.
Which of the following statements best represents the opinion of many economists
regarding the impact that changes in tax laws have had on recent changes in income
inequality in the United States?
A) Reductions in income tax rates have favored high-income individuals more than
low-income individuals. As a result, reductions in federal income tax rates have led to
more income inequality.
B) Reductions in income tax rates have created greater incentives for low-income
individuals to work, save, and invest. As a result, reductions in federal income tax rates
have led to less income inequality.
C) Reductions in income tax rates probably have had little impact on the distribution of
income.
D) Reductions in income tax rates have been offset by increases in corporate income tax
rates and payroll taxes. As a result, greater income inequality in the 1990s has been
followed by a more equal distribution of income since 2001.
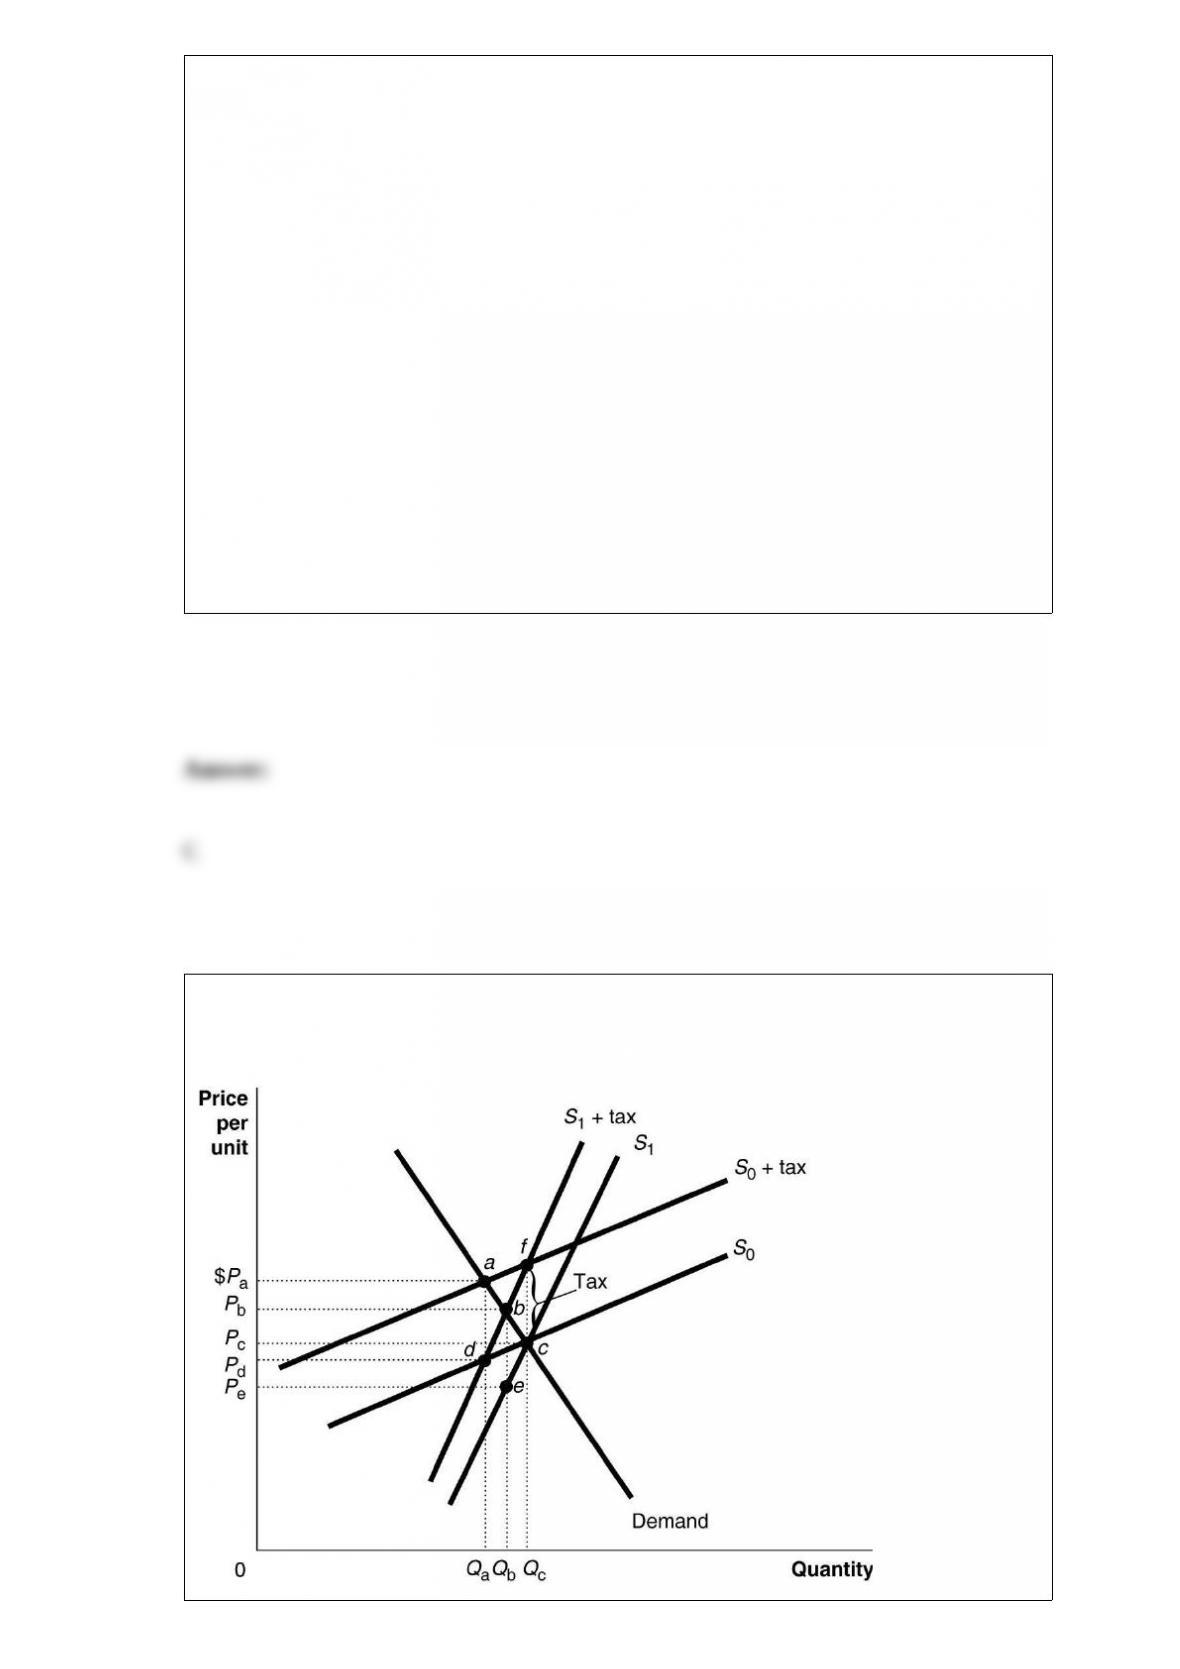
Figure 18-2

Figure 18-2 shows a demand curve and two sets of supply curves, one set more elastic
than the other.
Refer to Figure 18-2. If the government imposes an excise tax of $1.00 on every unit
sold, the government’s revenue from the tax is represented by the area
A) (PaPc × Qa) if the supply curve is S0 and (PbPc × Qb) if the supply curve is S1.
B) (PaPd × Qa) if the supply curve is S0 and (PbPe × Qb) if the supply curve is S1.
C) (PaPe × Qa) under either supply curve.
D) (PbPe × Qb) under either supply curve.
Economists caution that conventional statistics used to estimate the extent of poverty in
the United States fail to account for benefits people receive that, if considered, would
reduce the amount of poverty. Which of the following is an example of these benefits?
A) Individuals can use tax credits and the personal exemption to reduce their taxable
incomes. This reduces what they owe the government and increases their disposable
incomes.
B) The federal income tax system is progressive. As a result, the poor have higher
after-tax incomes than they would have if the income tax system was proportional or
regressive.
C) Individuals with low incomes receive non-cash benefits such as free school lunches
and food stamps.
D) The federal minimum wage forces employers to pay workers with low skills an
efficiency wage.
The marginal revenue curve for a perfectly competitive firm
A) is downward-sloping.
B) is the same as its demand curve.
C) is perfectly inelastic.
D) is the same as its marginal cost curve.
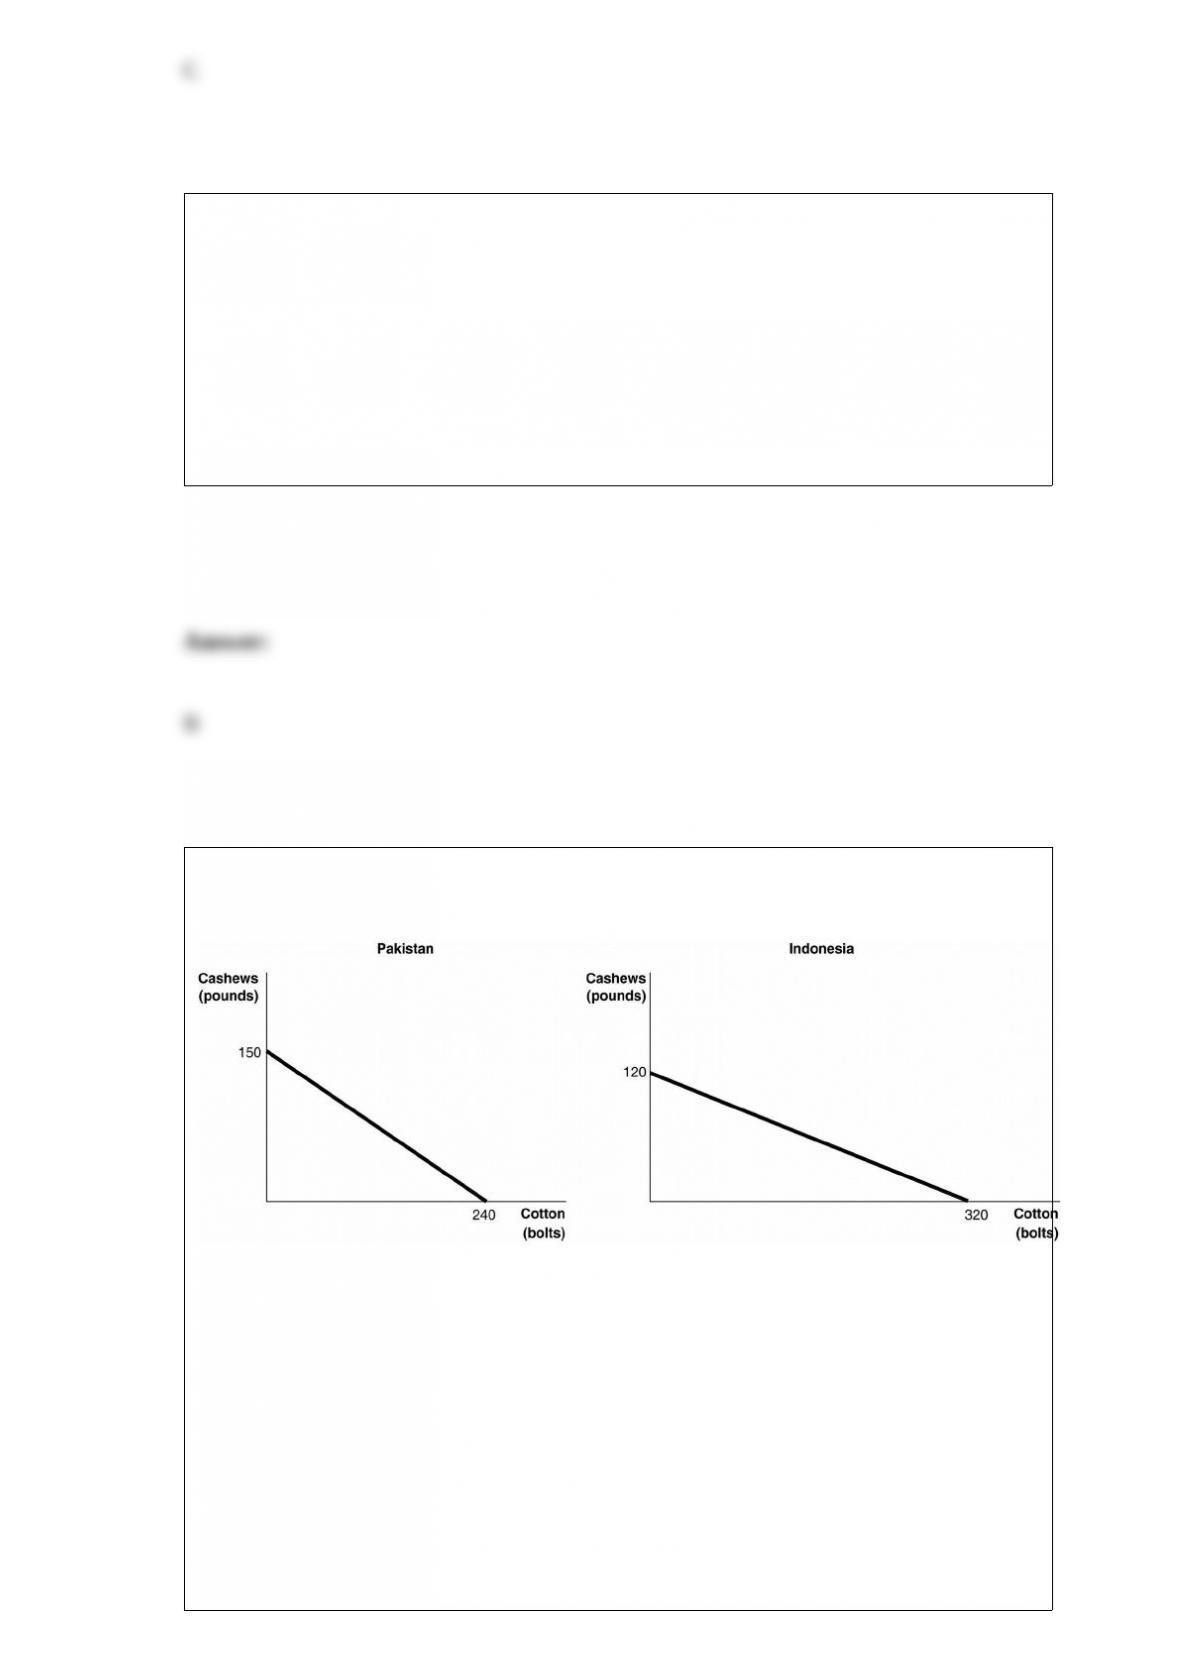
Figure 2-9
Figure 2-9 shows the production possibilities frontiers for Pakistan and Indonesia. Each
country produces two goods, cotton and cashews.
Refer to Figure 2-9. What is the opportunity cost of producing 1 bolt of cotton in
Indonesia?
A) 3/8 of a pound of cashews
B) 5/8 of a pound of cashews
C) 2 2/3 pounds of cashews

D) 120 pounds of cashews
Automobile manufacturers produce a range of automobiles such as sports utility
vehicles, luxury sedans, pickup trucks, and compact cars. What fundamental economic
question are they addressing by making this range of products?
A) How to produce goods that consumers want?
B) Why produce a variety of automobiles?
C) What to produce?
D) Who to produce automobiles for?
Assume that Bulgaria has a comparative advantage in producing sandals and Finland
imports sandals from Bulgaria. We can conclude that
A) Bulgaria also has an absolute advantage in producing sandals relative to Finland.
B) Bulgaria has a lower opportunity cost of producing sandals relative to Finland.
C) Finland has an absolute disadvantage in producing sandals relative to Bulgaria.
D) Labor costs are higher for sandal producers in Finland than in Bulgaria.

Let D = demand, S = supply, P = equilibrium price, and Q = equilibrium quantity. What
happens in the market for walnuts if the Centers for Disease Control and Prevention
announces that consuming a half cup of walnuts each week helps to lower bad levels of
cholesterol?
A) D increases, S no change, P and Q increase
B) S increases, D no change, P decreases, Q increases
C) D and S increase, P and Q decrease
D) D no change, S increases, P decreases, Q decreases
A consequence of the quota that has been imposed on the importation of sugar into the
United States is
A) consumers are protected from eating unsafe products made from cheap imported
sugar.
B) competition in the U.S. sugar market is reduced.
C) the cost of producing cereal, chocolate, and candy products in the United States is
reduced.
D) the market for sugar in the United States has become monopolistically competitive
rather than oligopolistic.
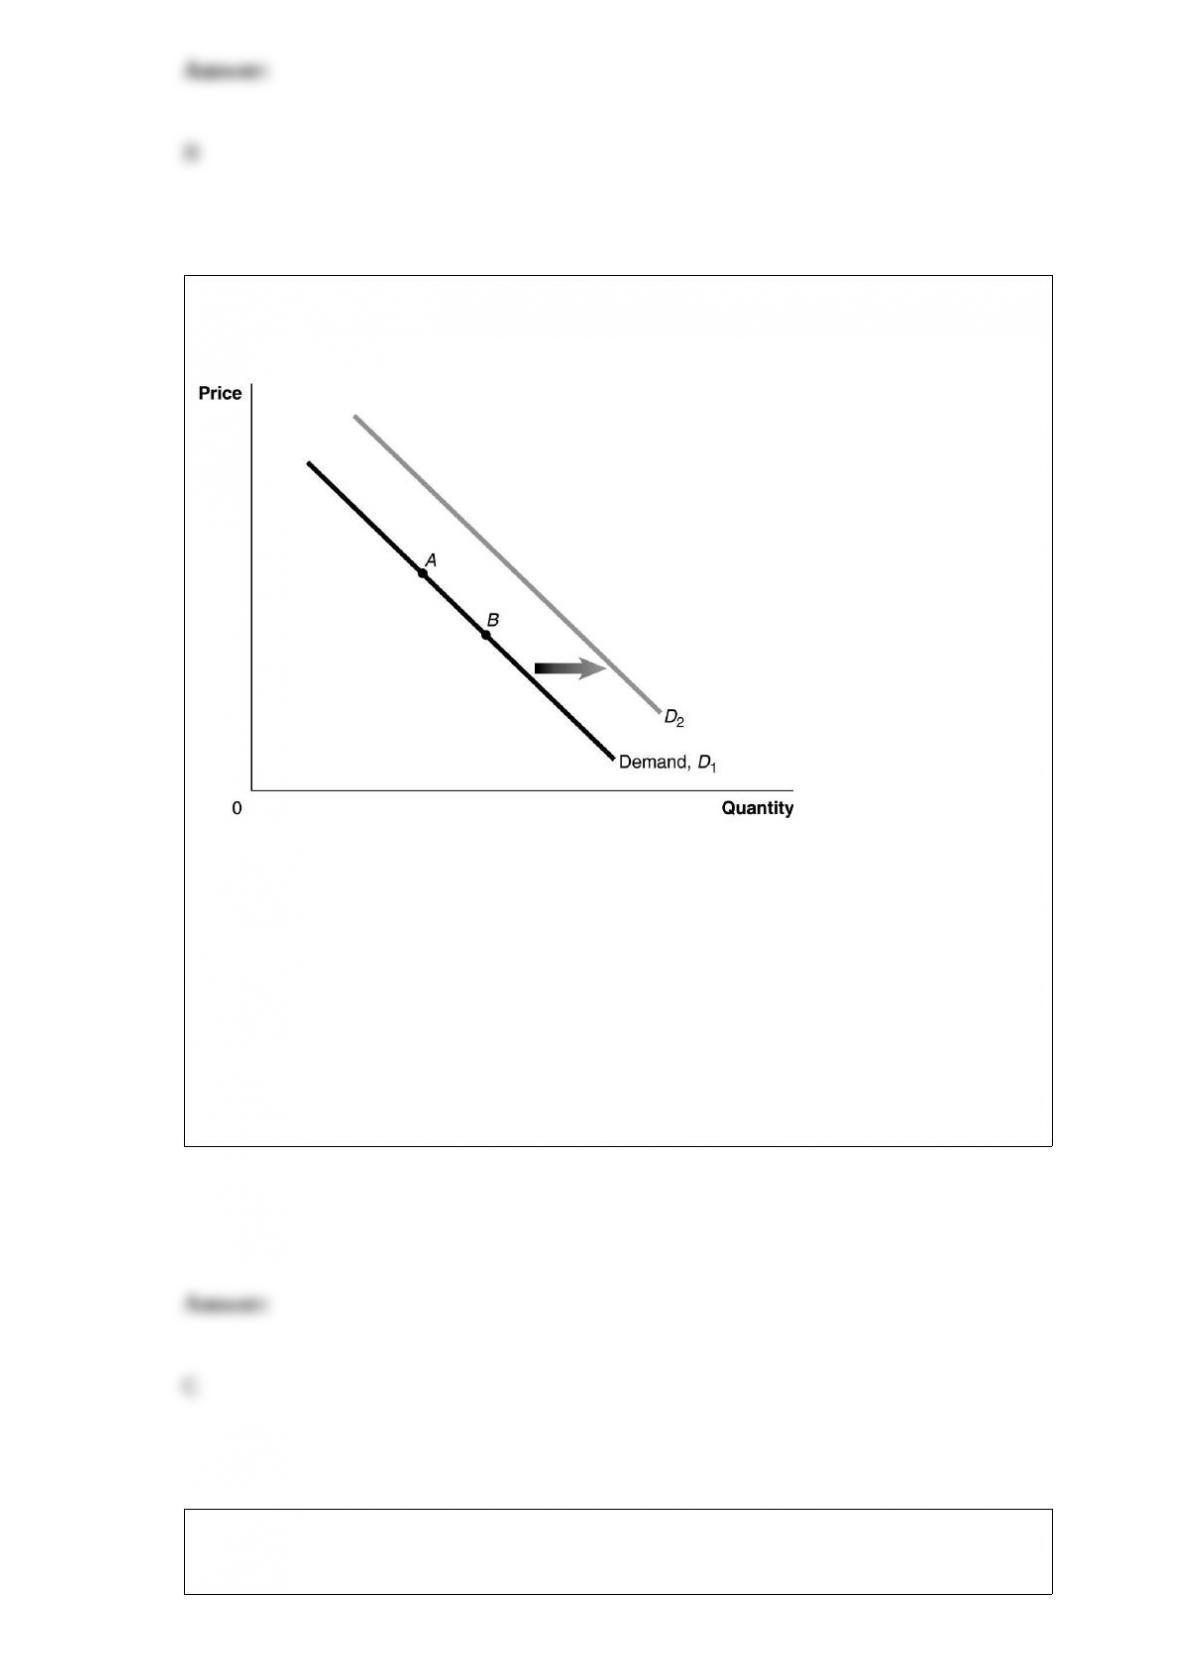
Figure 3-1
Refer to Figure 3-1. An increase in population would be represented by a movement
from
A) A to B.
B) B to A.
C) D1 to D2.
D) D2 to D1.
The demand curve for canned peas is downward sloping. If the price of canned peas, an
inferior good, rises

A) the income effect which causes you to reduce your canned peas purchases is smaller
than the substitution effect which causes you to increase your purchases, resulting in a
net increase in quantity demanded.
B) the income effect which causes you to increase your canned peas purchases is
smaller than the substitution effect which causes you to reduce your purchases,
resulting in a net decrease in quantity demanded.
C) both the income and substitution effects reinforce each other to decrease the quantity
demanded.
D) the income and substitution effects offset each other but the price effect of an
inferior good leads you to buy more canned peas.
Which of the following statements about positive economic analysis is false?
A) Positive analysis uses an economic model to estimate the costs and benefits of
different course of actions.
B) There is much more disagreement among economists over normative economic
analysis than over positive economic analysis.
C) There is much more disagreement among economists over positive economic
analysis than over normative economic analysis.
D) Unlike normative economic analysis, positive economic analysis can be tested.
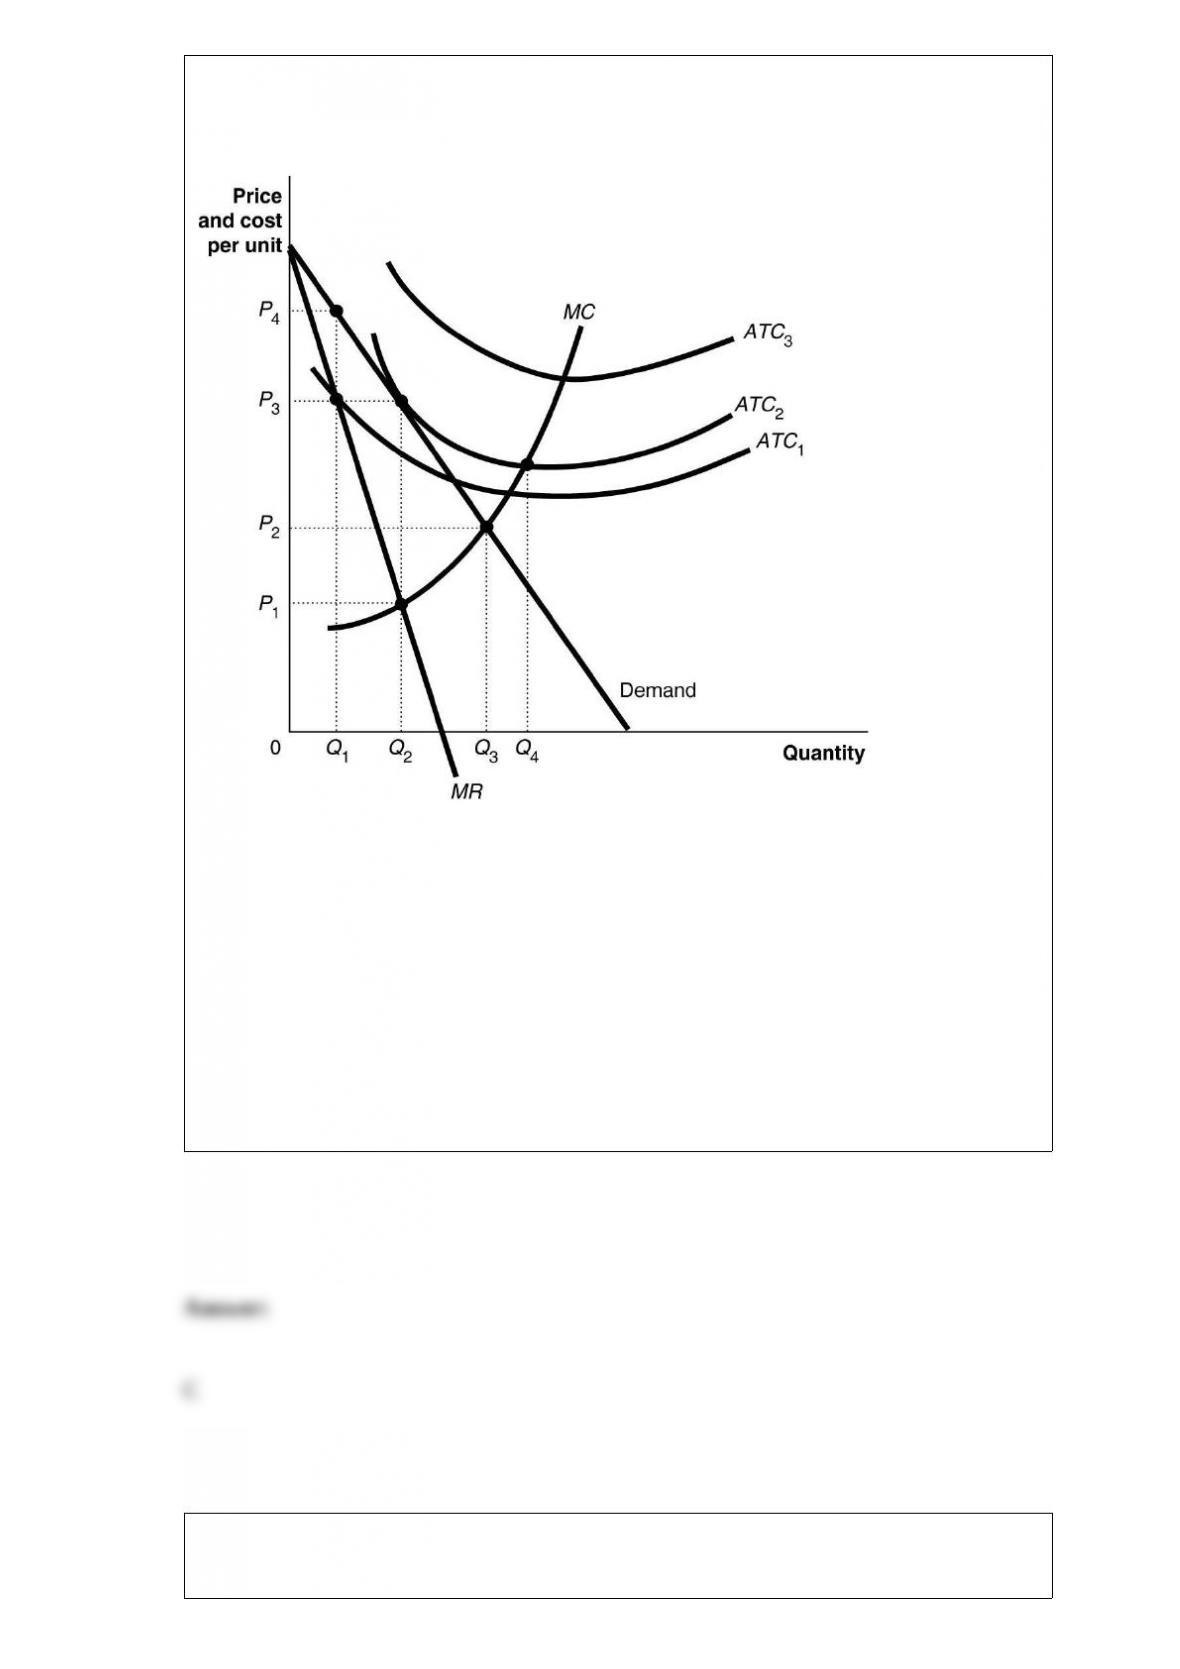
Figure 15-2
Figure 15-2 above shows the demand and cost curves facing a monopolist.
Refer to Figure 15-2. If the firm’s average total cost curve is ATC1, the firm will
A) suffer a loss.
B) break even.
C) make a profit.
D) face competition.
Which of the following is a normative economic statement?

A) The price of wheat is too low.
B) The current low price of wheat is the result of increased worldwide supply.
C) When the price of wheat falls, the quantity of wheat purchased rises.
D) When the price of wheat falls, the cost of wheat-based products falls.
At the minimum efficient scale
A) all possible economies of scale have not been exhausted.
B) the firm has achieved the lowest possible average cost of production.
C) any increases in the scale of operation will encounter further economies of scale.
D) marginal cost is at its minimum.
Figure 11-5

Refer to Figure 11-5. Identify the curves in the diagram.
A) E = average fixed cost curve; F = variable cost curve; G = total cost curve, H =
marginal cost curve
B) E = marginal cost curve; F = total cost curve; G = variable cost curve, H = average
fixed cost curve
C) E = average fixed cost curve; F = average total cost curve; G = average variable cost
curve, H = marginal cost curve
D) E = marginal cost curve; F = average total cost curve; G = average variable cost
curve; H = average fixed cost curve.