A New York newspaper reported the average gasoline prices in four metropolitan areas
and used a bar chart to illustrate the differences. What type of statistics was shown?
What activities did the newspaper use to make the report?
In a study of protein breakfast bars, five bars from each of three brands were tested to
see if the mean amount of protein per bar differs among the brands. If the brand sum of
squares is 0.07 and the error sum of squares is 0.09, the calculated value of F is _____.
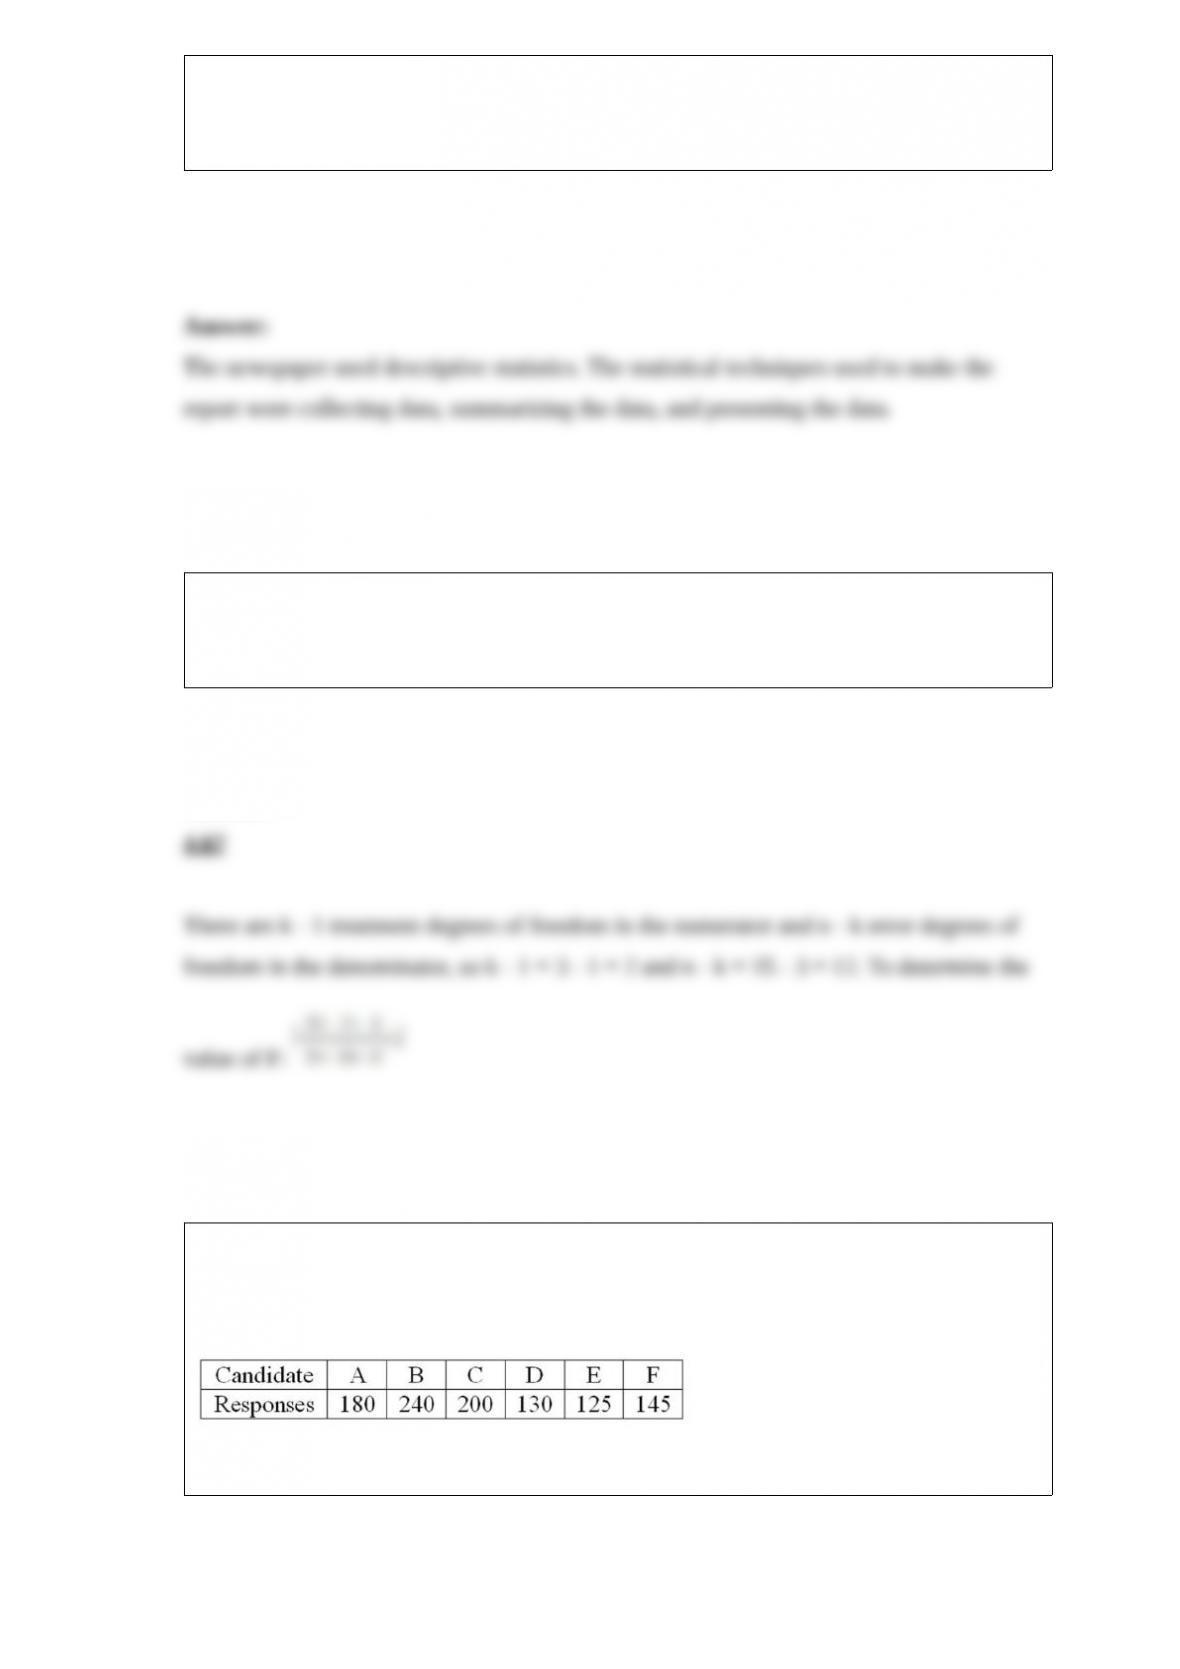
Six people have declared their intentions to run for a seat on the school board in the
next local election. A poll is conducted during the campaign among 1,020 randomly
sampled voters to determine if there is any clear preference among the voters. The
responses are shown next.
How many degrees of freedom are there?
To decide if a null hypothesis should be rejected, a ____________ is compared to the
critical value.
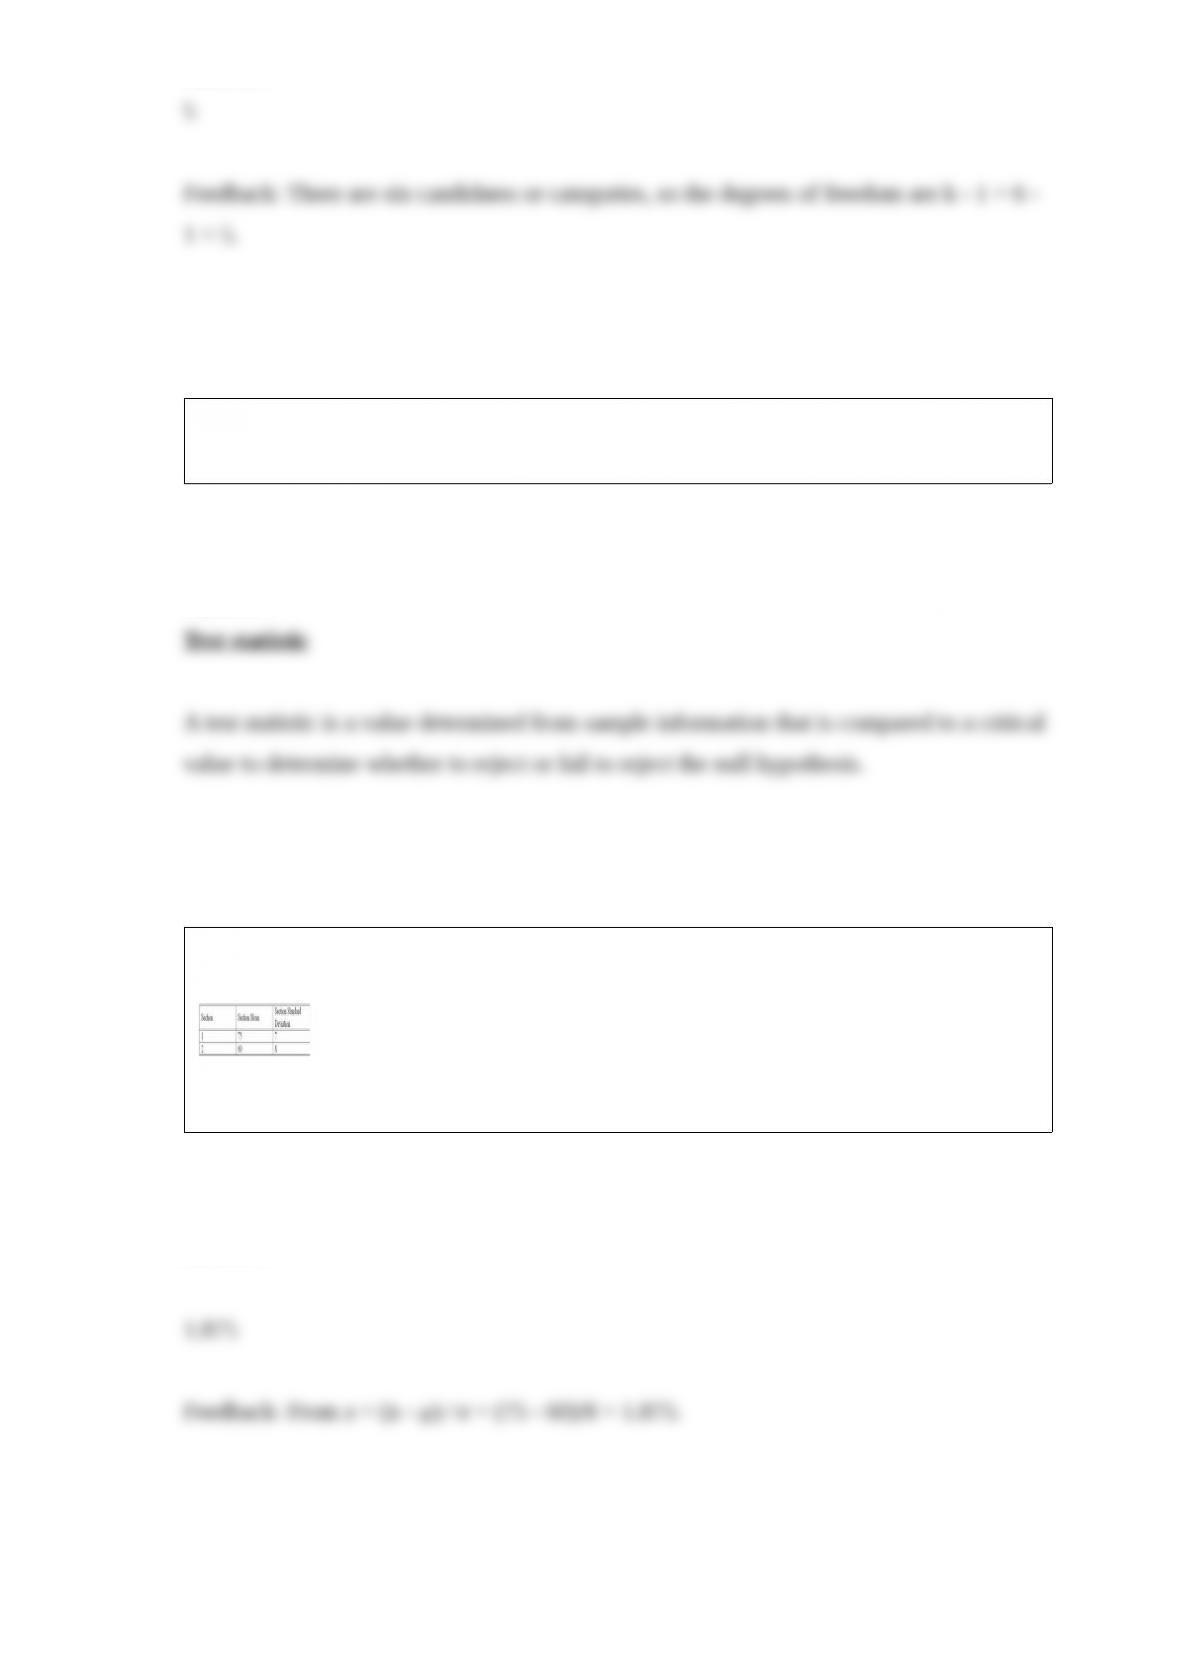
Two business major students, in two different sections of an economics class, were
comparing test scores. The following shows the sections’ mean and standard deviation.
The student in section 2 scored 75. The student’s z score would be _____.
The proportion of the area under a normal curve that is to the left of z = 1.40 is
_______.
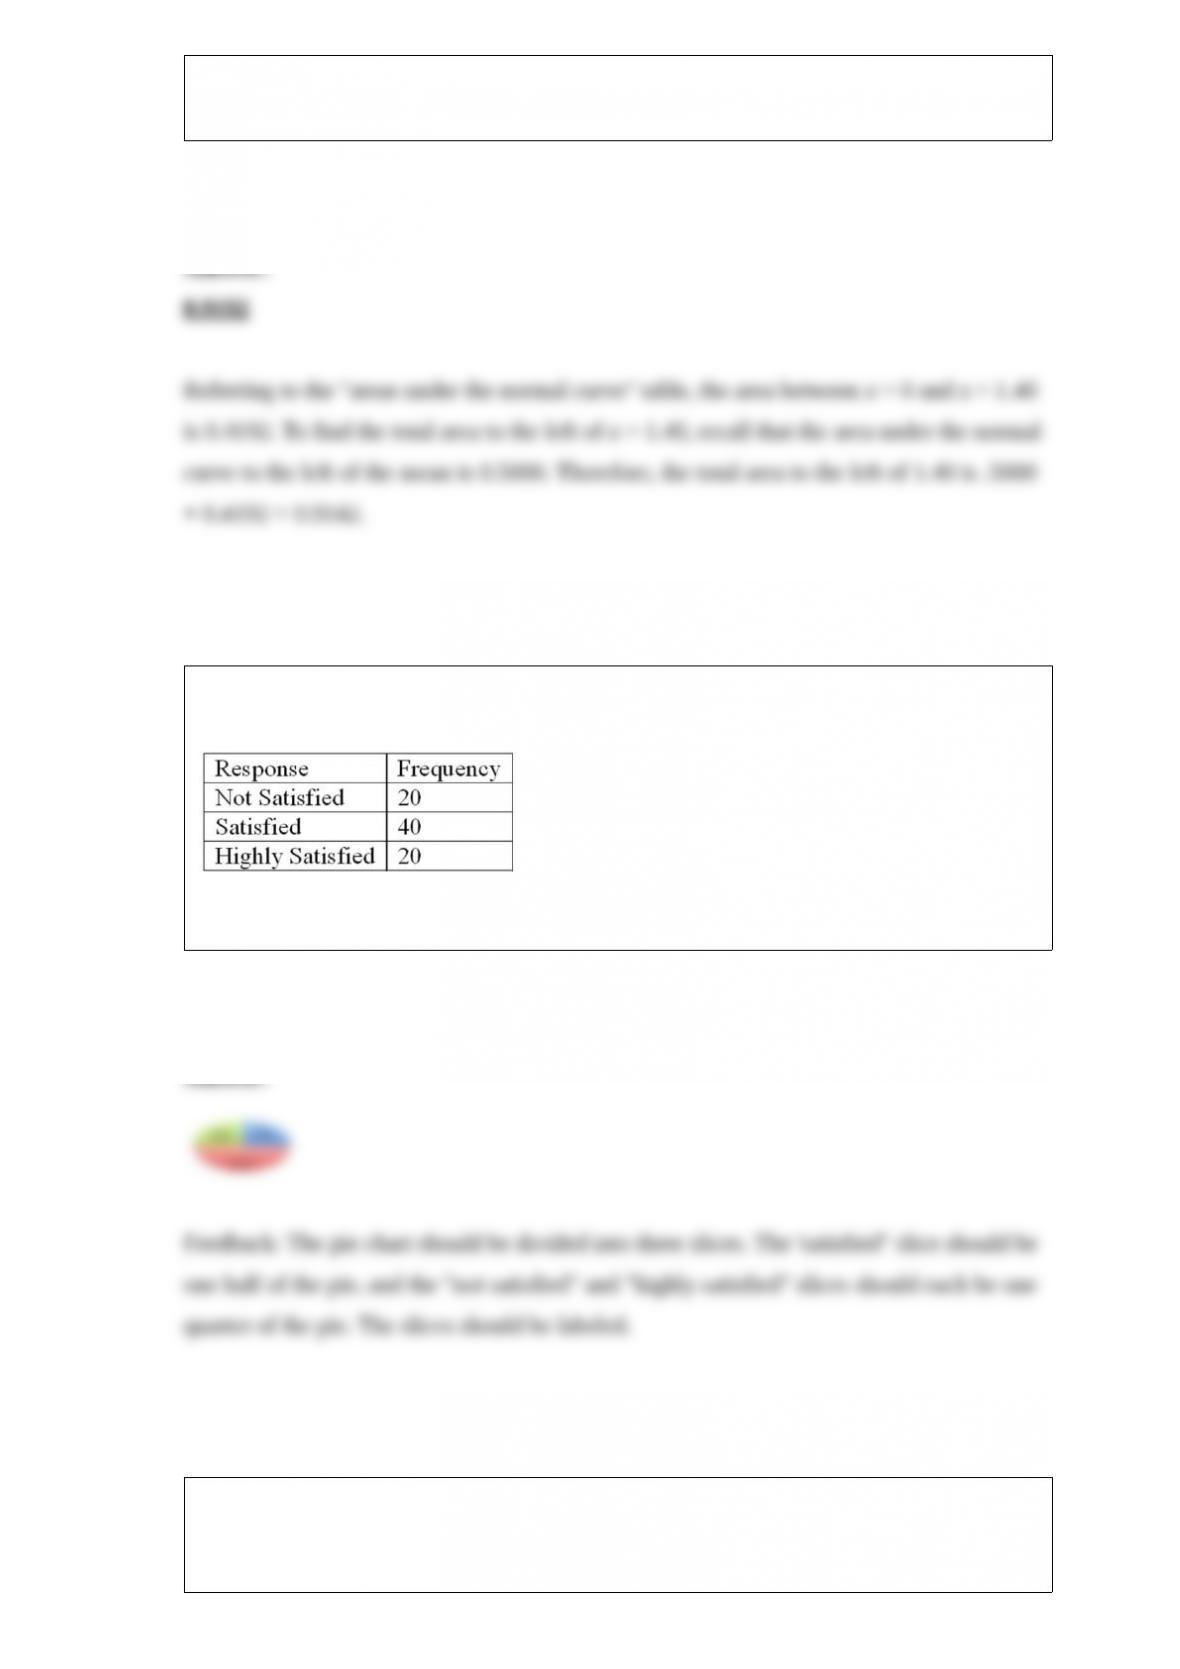
Refer to the following breakdown of responses to a survey of room cleanliness in a
hotel.
Draw a pie chart that illustrates the relative frequencies.
To compare the effect of weather on sales of soft drinks, a distributor surveyed people
in two regions of the country and asked if they purchased soft drinks in the last month.
The following are the results. The distributor would like to know if there is a difference
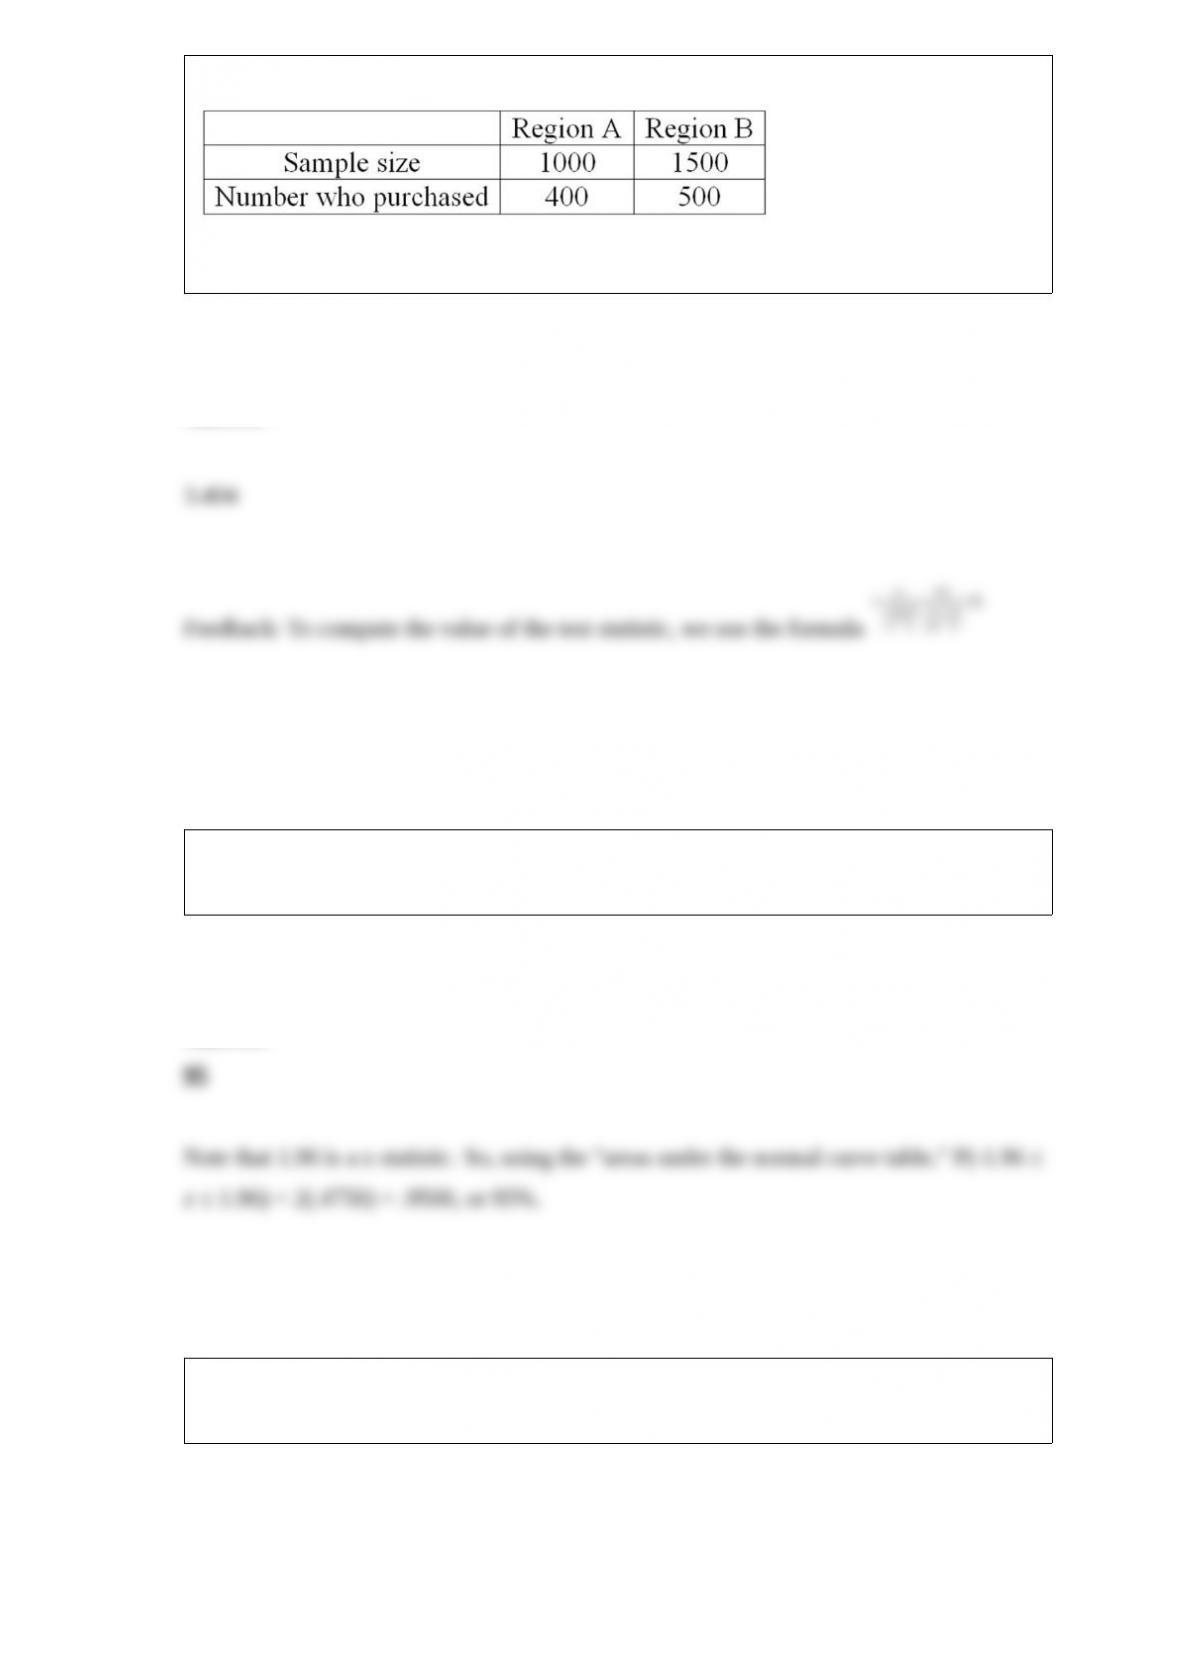
in sales between the two regions.
What is the value of the test statistic?
For a sampling distribution of the means, about ________% of the means would be
between 1.96 standard deviations.
A company set up a kiosk in the Mall of America for several hours and asked randomly
selected people which color cell phone was their favorite. The results follow:
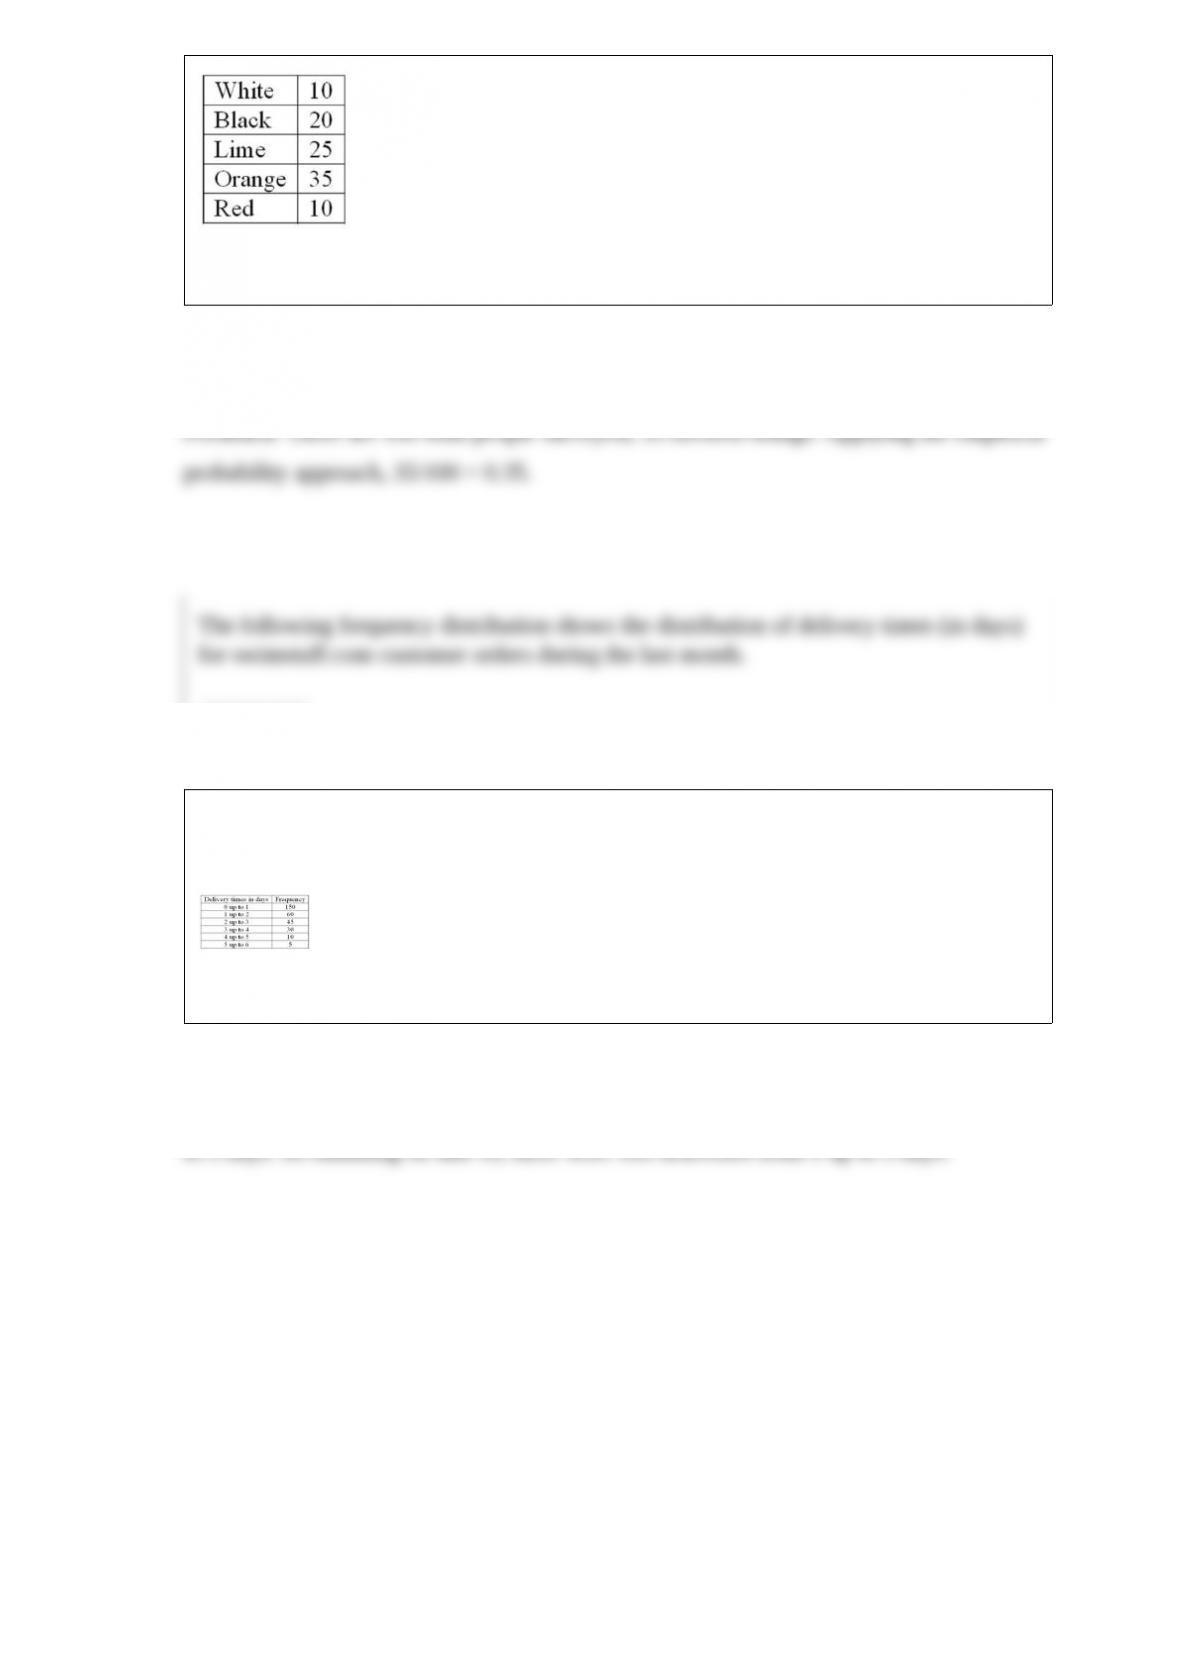
What is the probability that a person would select orange as their favorite color?
The following frequency distribution shows the distribution of delivery times (in days)
for swimstuff.com customer orders during the last month.
How many orders were delivered from 1 day up to 3 days?