In a situation where we know the population standard deviation but wish to estimate the
population mean using a 90 percent confidence interval, the critical value is z = 1.645.
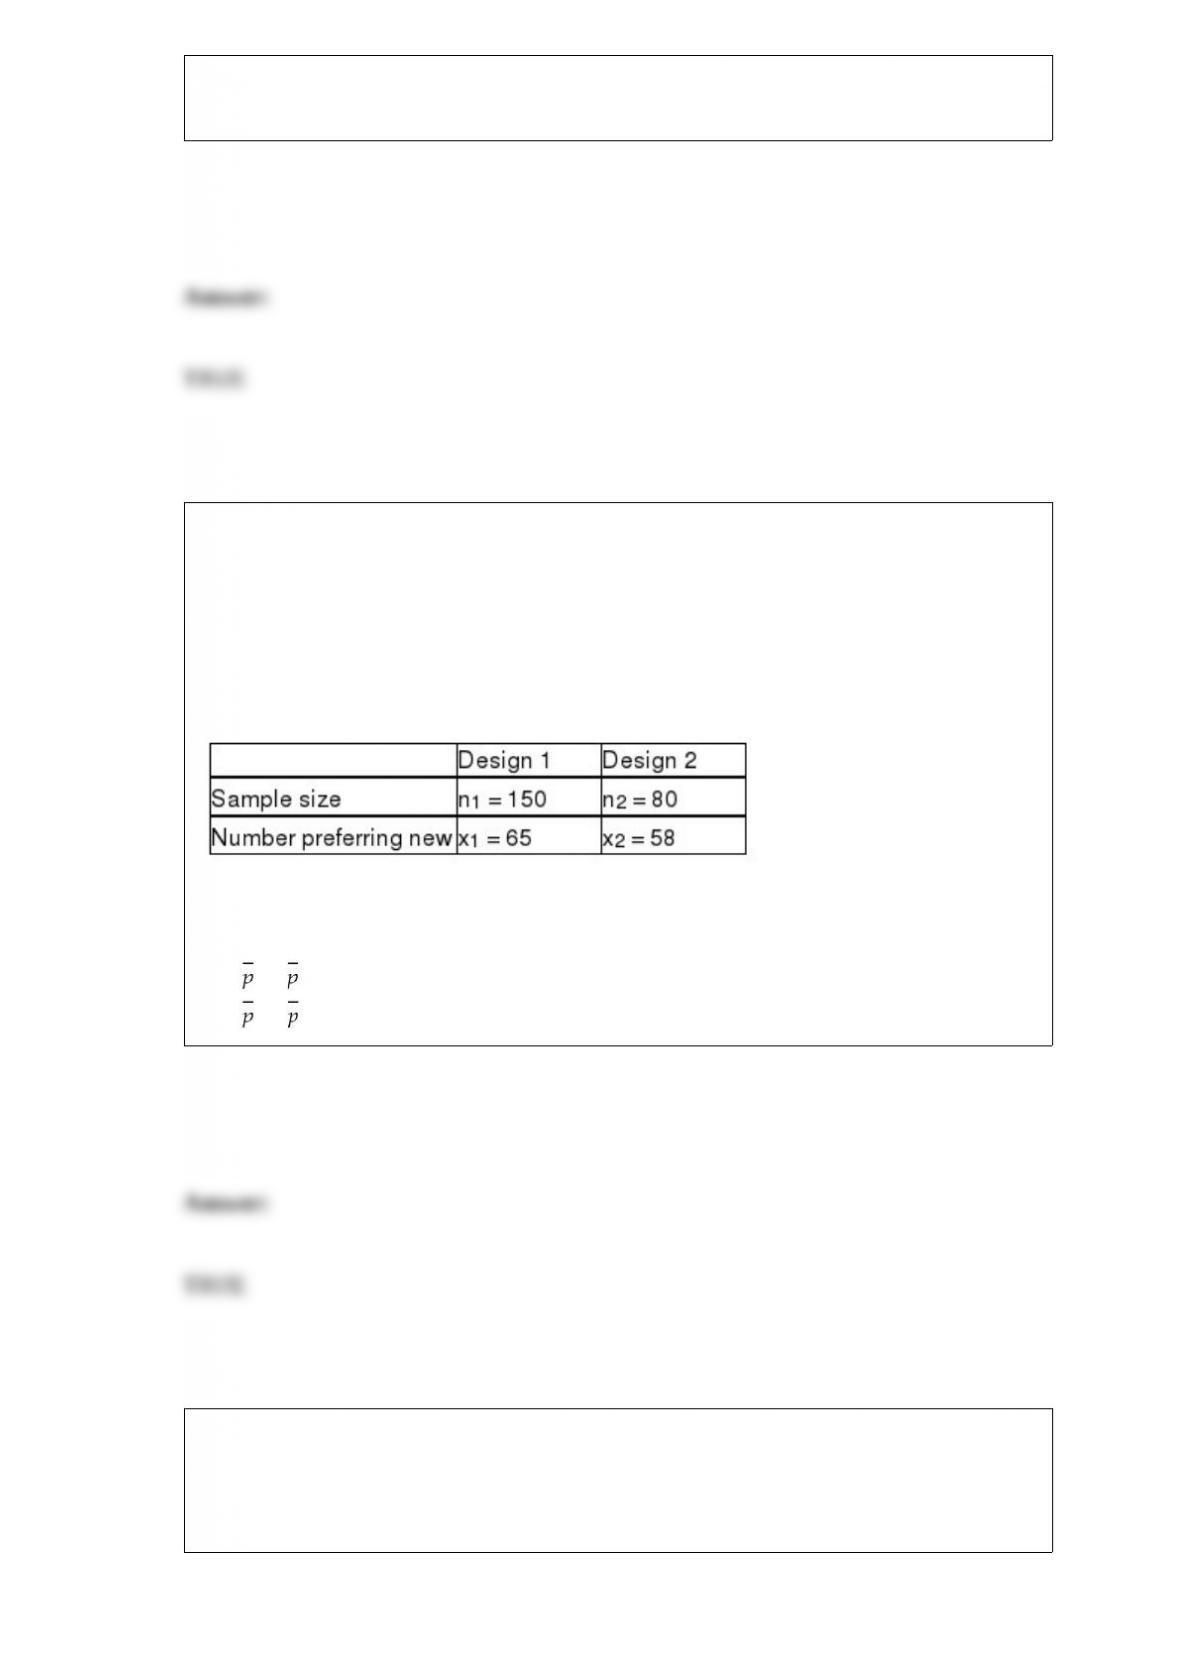
A major manufacturer of home electronics is interested in determining whether
customers have a preference between two new speaker designs for their home
entertainment centers. To test this, the design department manager has selected a
random sample of customers and shown them the first design. A second sample of
customers is shown design 2. The manager then asks each customer whether they prefer
the new design they were shown over the one they currently own. The following results
were observed:
Based on these data and a significance level equal to 0.05, the appropriate null and
alternative hypotheses are:
H0 : 1 ≥ 2
Ha : 1 < 2
A frozen food company that makes burritos currently has employees making burritos by
hand. It is considering purchasing equipment to automate the process and wants to
determine if the automated process would result in lower variability of burrito weights.
It takes a random sample from each process as shown below.
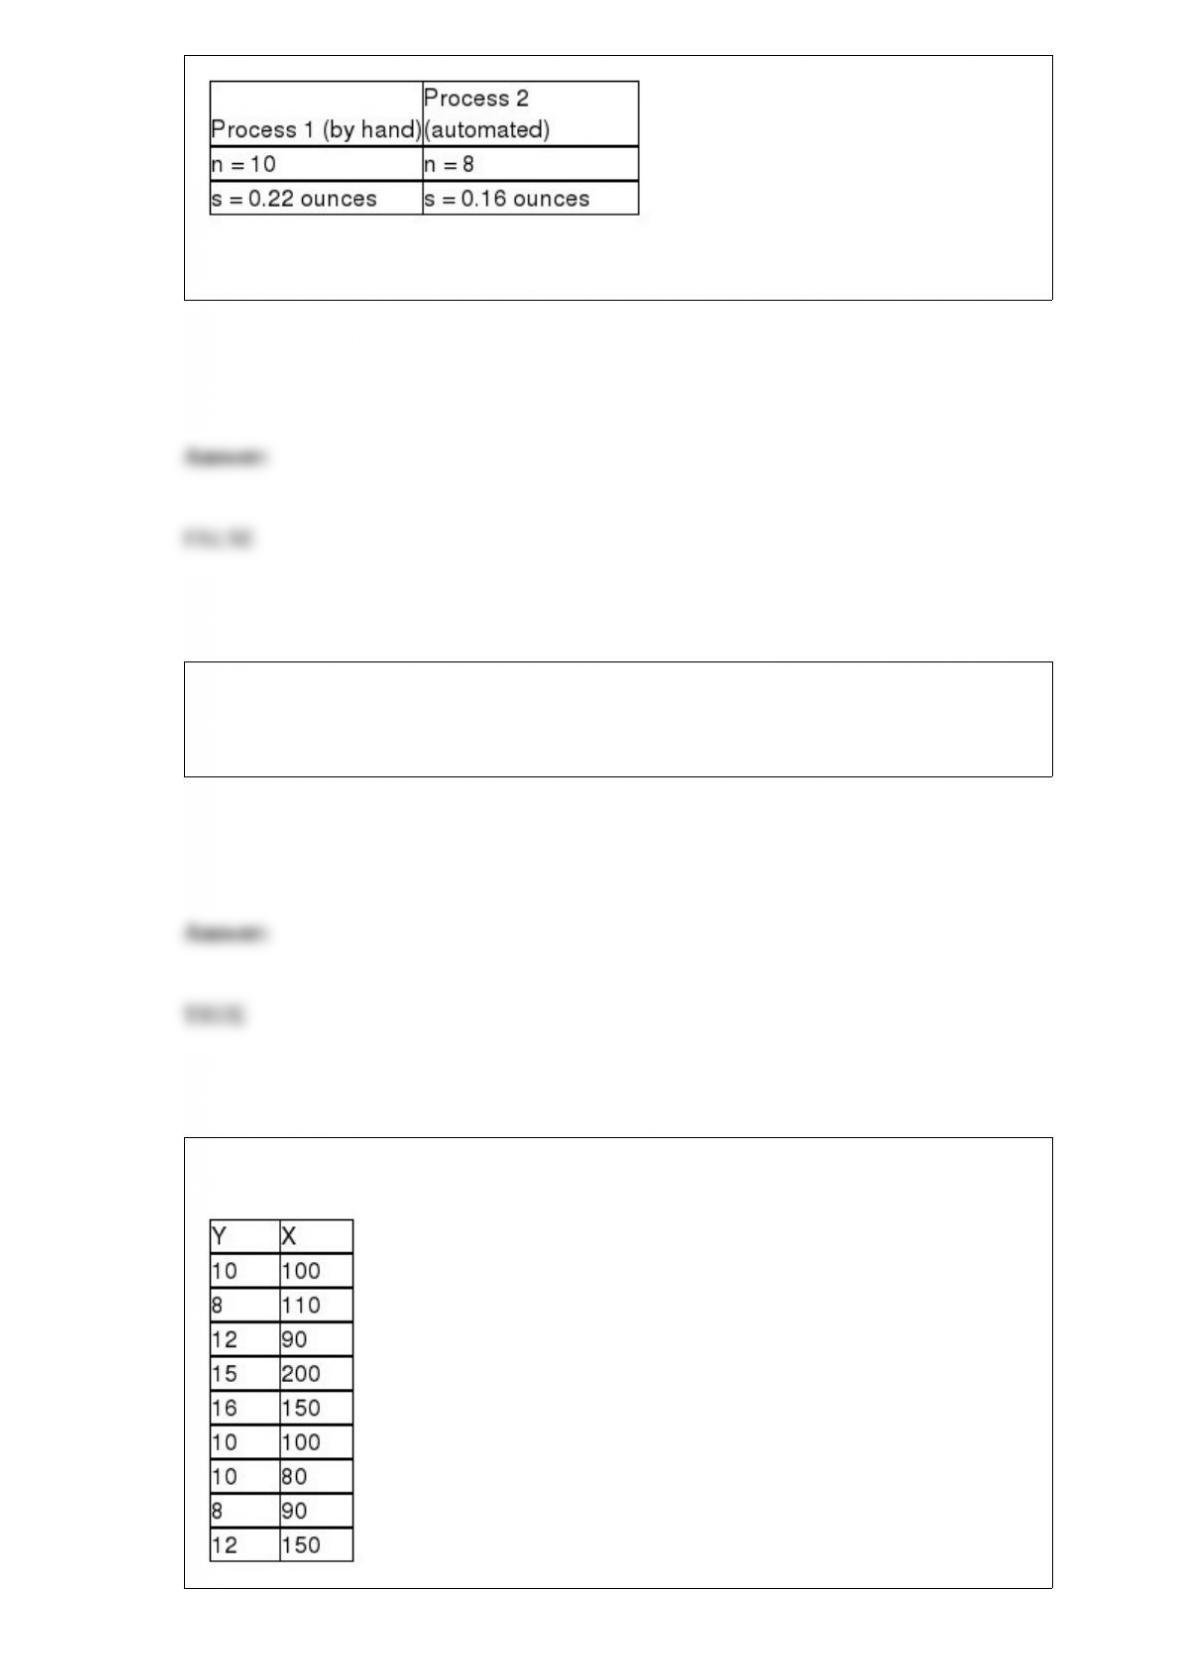
In conducting the hypothesis test, the test statistic is F = 1.375.
When a market research manager records the number of potential customers who were
surveyed indicating that they like the product design, the random variable, number who
like the design, is a discrete random variable.
You are given the following sample data for two variables:

The regression model based on these sample data explains approximately 75 percent of
the variation in the dependent variable.
The interquartile range is the difference between the mean and the median.
In order to analyze any potential interactions between factors in an analysis of variance
study, it is necessary to have at least two measurements at each level of each factor.
The following null and alternative hypotheses are appropriate when using a Wilcoxon
signed rank test.
H0 : Population Median equals 14.5
HA: Population Median is not equal to 14.5

The one sure thing that can be said about a point estimate is that it will most likely be
subject to sampling error and not equal the parameter.
Sampling error is the difference between the sample statistic and the population
parameter.
A cell phone company wants to determine if the use of text messaging is independent of
age. The following data has been collected from a random sample of customers.

Using this data, if we wish to test whether the preferred news source is independent of
age using a 0.05 level of significance, the critical value is 5.9915.
When the United States conducts a census that counts all people in the country, this is
an example of using a sample.
One of the reasons that the standard deviation is preferred as a measure of variation
over the variance is that the standard deviation is measured in the original units.
The Conrad Real Estate Company recently conducted a statistical test to determine
whether the number of days that homes are on the market prior to selling is normally
distributed with a mean equal to 50 days and a standard deviation equal to 10 days. The
sample of 200 homes was divided into 8 groups to form a grouped data frequency
distribution. If a chi-square goodness-of-fit test is to be conducted using an alpha = .05,

the critical value is 14.0671.
In conducting a Mann-Whitney U test when the sample size is greater than 20, the U
test statistic can be assumed normally distributed.
The marketing manager for Voice-talk, a cell phone company, has taken a sample of
300 customers from the list of 4,356 total customers. The mean monthly bill for the last
October based on the sample data is $45.62. The manager should realize that the mean
bill for all 4,356 customers will actually be higher than $45.62.
A company has 20 copy machines and every day there is a 5 percent chance for each
machine that it will not be working that day. If the company wants to calculate the
probability of, say, 2 machines not working, it should use the Poisson distribution.

The following class limits would be acceptable for developing a frequency distribution
on income:
$0 < $5,000
$5001 < $10,000
$10,001 < $20,000
Over $20,000
If any of the observed frequencies are smaller than 5, then categories should be
combined until all observed frequencies are at least 5.
When surveyed, a sample of 1,250 patients at a regional hospital provided interviewers
with the following summary statistics pertaining to the hospital charges:
Minimum = $278.00 Q1 = $1,245 Q2 = $3,567 Q3= $4,702.
Based on these data, the distribution is seen to be symmetric.
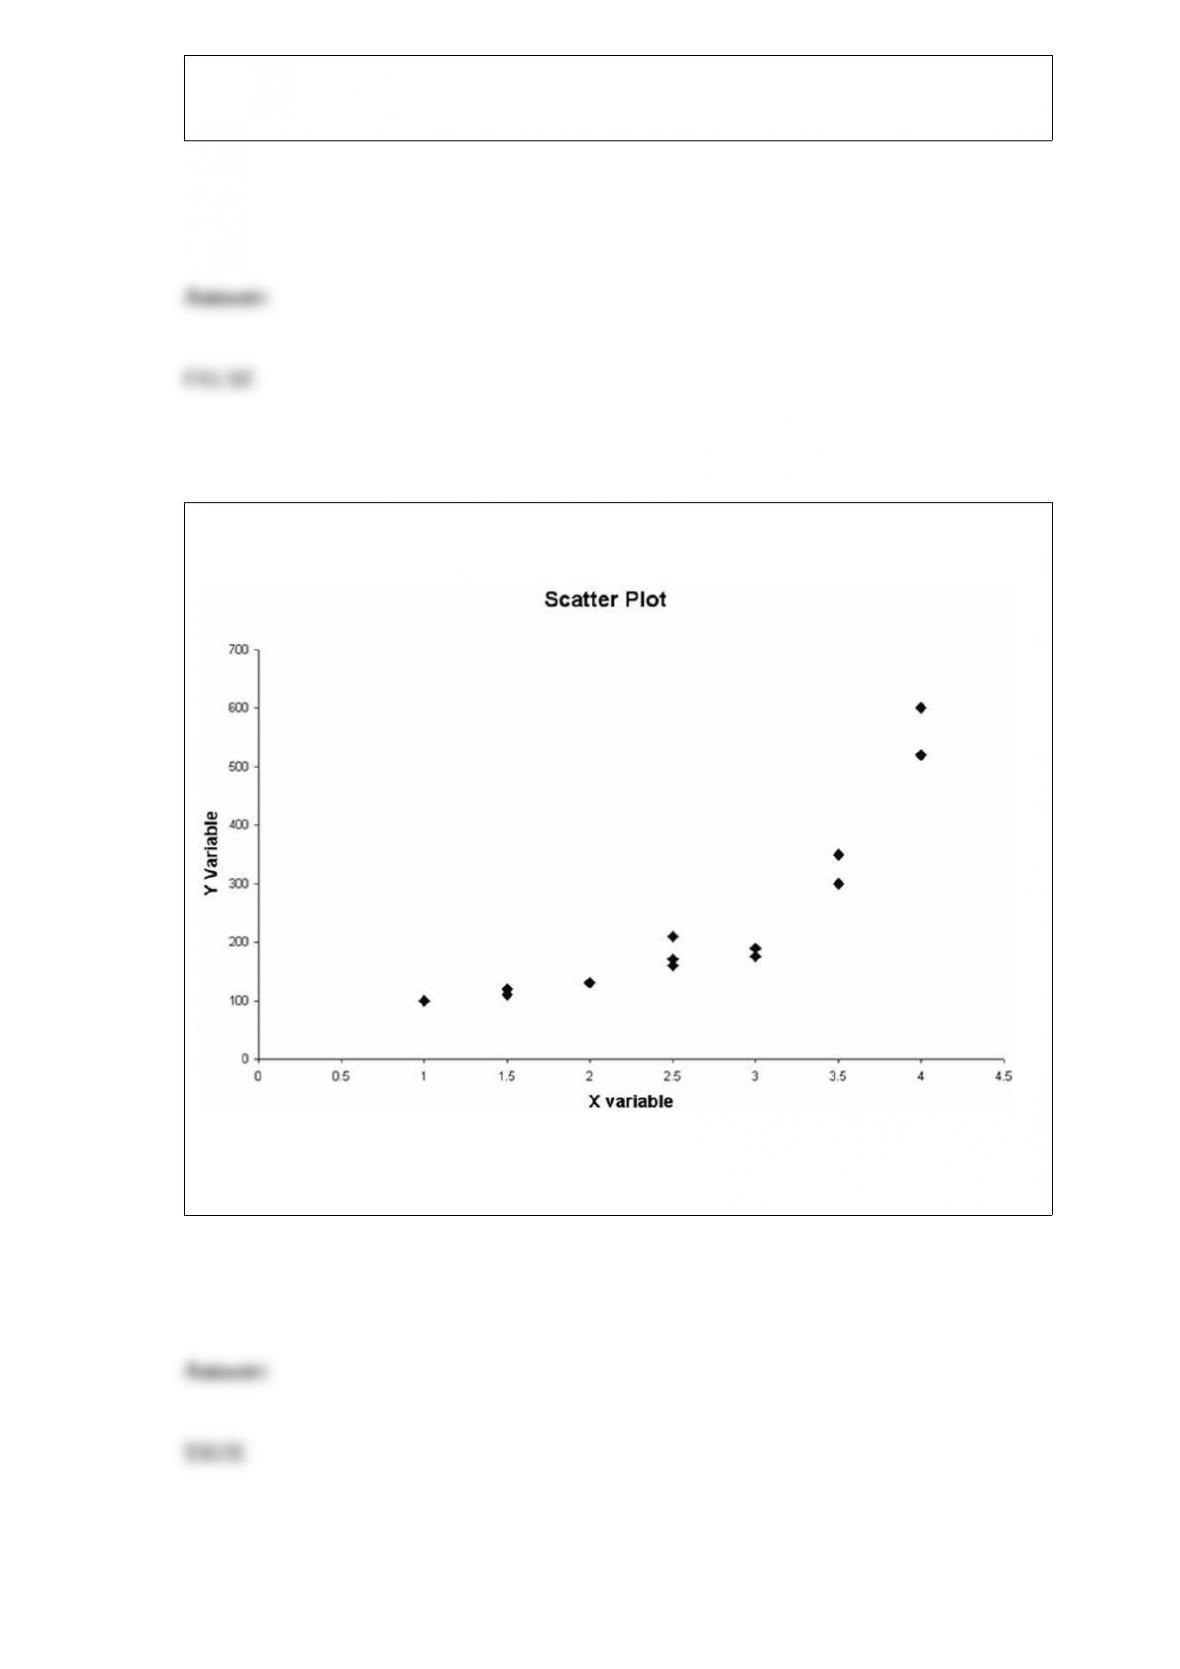
Consider the following scatter plot:
Given the apparent relationship between the x and y variable, a possible curvilinear
regression model to consider would be a second-order polynomial model.

An accounting firm has been hired by a large computer company to determine whether
the proportion of accounts receivables with errors in one division (Division 1) exceeds
that of the second division (Division 2). The managers believe that such a difference
may exist because of the lax standards employed by the first division. To conduct the
test, the accounting firm has selected random samples of accounts from each division
with the following results.
Based on this information, and using a significance level equal to 0.05, the pooled
estimator for the overall proportion is = .1050.
A pharmaceutical company conducts a study where 50 patients are given a drug. They
find that 10 percent of patients experience nausea as a side effect. This 10 percent is an
example of a parameter.
A p-chart would potentially be used to monitor the diameters of bolts made by a bolt
manufacturing plant.

Two variables have a correlation coefficient that is very close to zero. This means that
there is no relationship between the two variables.
The number of calls to an Internet service provider during the hour between 6:00 and
7:00 p.m. is described by a Poisson distribution with mean equal to 15. Given this
information, the standard deviation for the call distribution is about 3.87 calls.
If the sample data lead the decision maker to reject the null hypothesis, the alpha level
is the maximum probability of committing a Type II error.

The time it takes a parent to assemble a children’s bicycle has been shown to be
normally distributed with a mean equal to 295 minutes with a standard deviation equal
to 45 minutes. Given this information, the probability that it will take a randomly
selected parent more than 220 minutes is about 0.0475.
The scatter plot is a two dimensional graph that is used to graphically represent the
relationship between two variables.
The variance in the diameter of a bolt should not exceed 0.500 mm. A random sample
of n = 12 bolts showed a sample variance of 0.505 mm. The test statistic is χ2 = 11.11.
You are given the following data:
Assuming that these data are a sample selected from a larger population, the median
value for these sample data is 25.5.
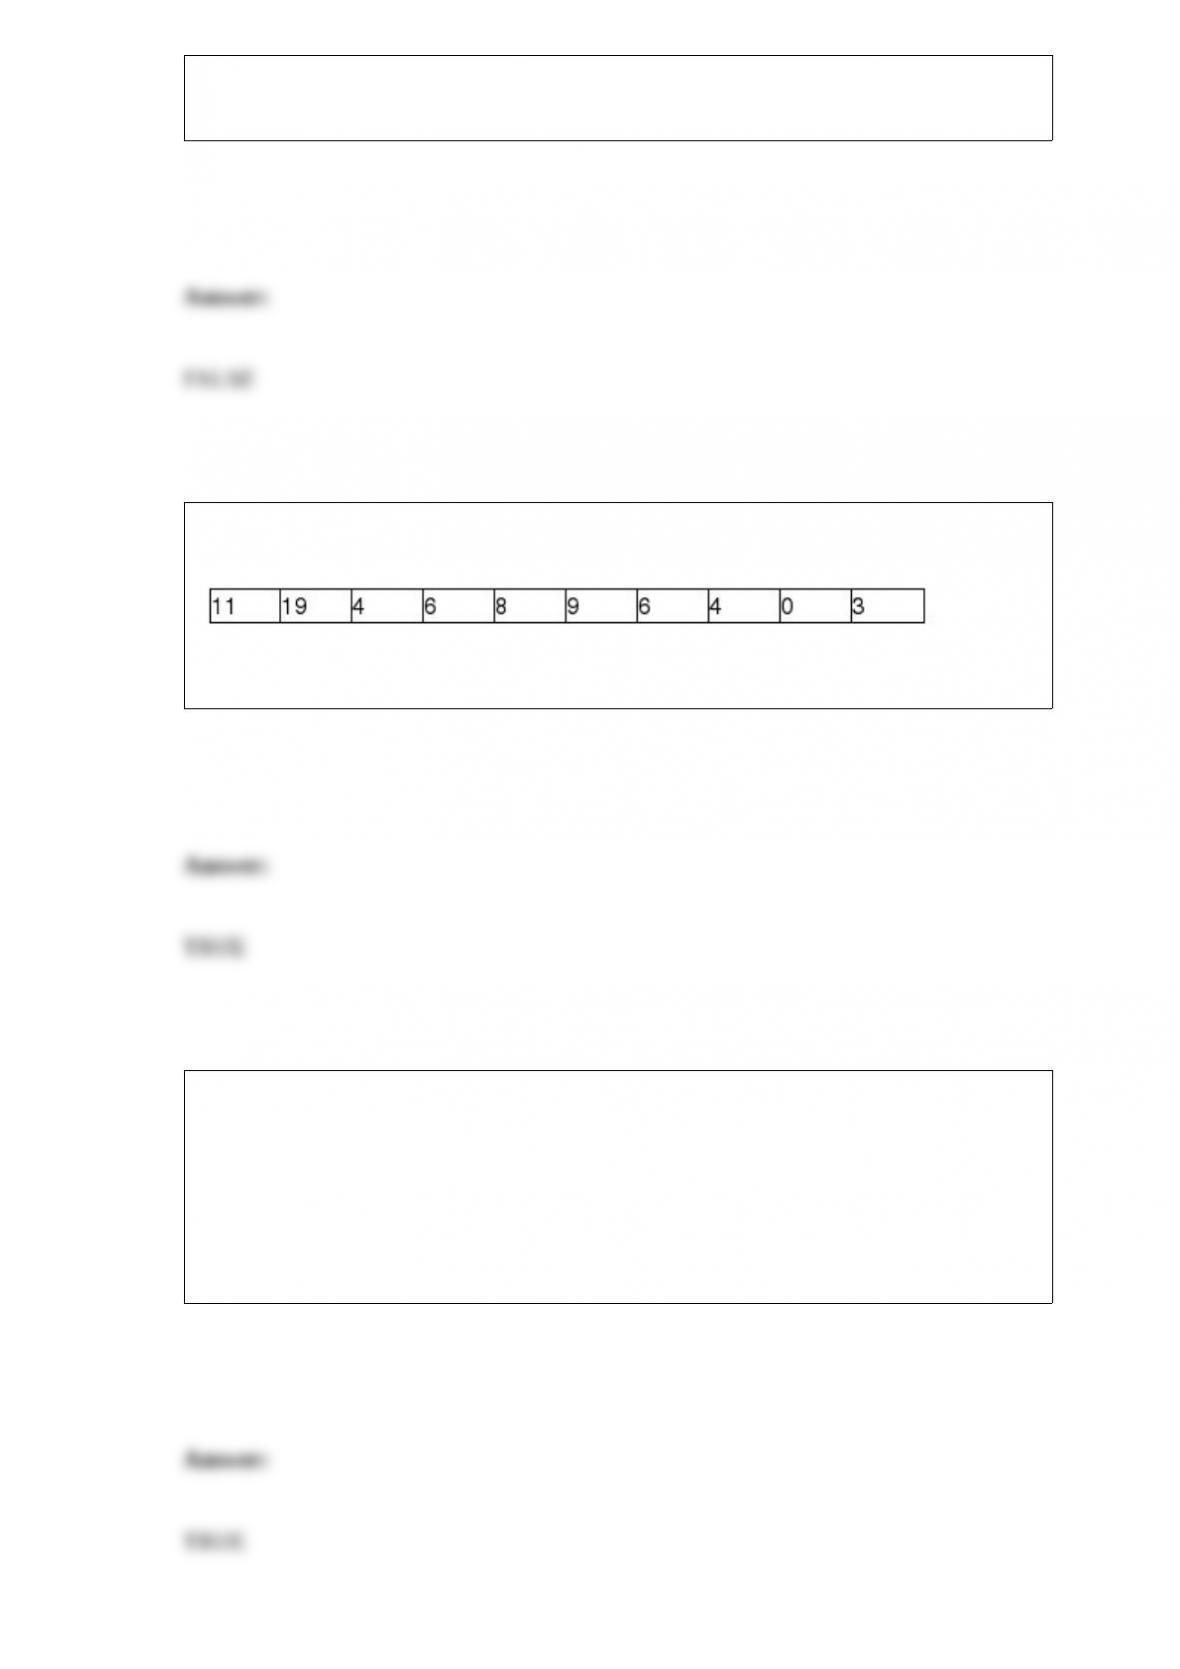
A store manager tracks the number of customer complaints each week. The following
data reflect a random sample of ten weeks.
The variance for these data is approximately 27.78.
Each week American Stores receives a shipment from a supplier. The contract specifies
that the maximum allowable percent defective is 5 percent. When the shipment arrives,
a sample of 20 parts is randomly selected. If 2 or more of the sampled parts are
defective, the shipment is rejected and returned to the supplier. Assume that a shipment
arrives that actually has 4 percent defective parts and the distribution of defective parts
is described by a binomial distribution. The probability that the shipment is rejected is
approximately 0.19.

The Cranston Hardware Company is interested in estimating the difference in the mean
purchase for men customers versus women customers. It wishes to estimate this
difference using a 95 percent confidence level. Assume that the variances are equal and
the populations normally distributed. The following data represent independent samples
from each population:
Based on these data, the upper limit of the interval estimate is approximately $13.82.
Unlike the case of goodness-of-fit testing, with contingency analysis there is no
restriction on the minimum size for an expected cell frequency.

A stem and leaf diagram is used to:
A) display the distribution of a quantitative variable.
B) show the joint relationship between two variables.
C) graph a joint frequency distribution.
D) show relative cumulative frequency.
The National Club Association does periodic studies on issues important to its
membership. The 2012 Executive Summary of the Club Managers Association of
America reported that the average country club initiation fee was $31,912. Suppose a
random sample taken in 2009 of 12 country clubs produced the following initiation
fees:
Based on the sample information, can you conclude at the α = 0.05 level of significance
that the average 2009 country club initiation fees are lower than the 2008 average?
Conduct your test at the level of significance.
A) Because t = -0.4324 is not less than t critical = -1.4512, do not reject Ho. The 2009
average country club initiation fee is not less than the 2008 average.
B) Because t = -0.4324 is not less than t critical = -1.4512, reject Ho. The 2009 average
country club initiation fee is less than the 2008 average.
C) Because t = -0.5394 is not less than t critical = -1.7959, do not reject Ho. The 2009
average country club initiation fee is not less than the 2008 average.
D) Because t = -0.5394 is not less than t critical = -1.7959, reject Ho. The 2009 average
country club initiation fee is less than the 2008 average.

Suppose a recent random sample of employees nationwide that have a 401(k)
retirement plan found that 18% of them had borrowed against it in the last year. A
random sample of 100 employees from a local company who have a 401(k) retirement
plan found that 14 had borrowed from their plan. Based on the sample results, is it
possible to conclude, at the α = 0.025 level of significance, that the local company had a
lower proportion of borrowers from its 401(k) retirement plan than the 18% reported
nationwide?
A) The z-critical value for this lower tailed test is z = -1.96. Because -1.5430 is greater
than the z-critical value we do not reject the null hypothesis and conclude that the
proportion of employees at the local company who borrowed from their 401(k)
retirement plan is not less than the national average.
B) The z-critical value for this lower tailed test is z = -1.96. Because -1.0412 is greater
than the z-critical value we do not reject the null hypothesis and conclude that the
proportion of employees at the local company who borrowed from their 401(k)
retirement plan is not less than the national average.
C) The z-critical value for this lower tailed test is z = 1.96. Because 1.5430 is less than
the z-critical value we do not reject the null hypothesis and conclude that the proportion
of employees at the local company who borrowed from their 401(k) retirement plan is
not less than the national average.
D) The z-critical value for this lower tailed test is z = 1.96. Because 1.0412 is less than
the z-critical value we do not reject the null hypothesis and conclude that the proportion
of employees at the local company who borrowed from their 401(k) retirement plan is
not less than the national average.
A study recently conducted by a marketing firm analyzed three different advertising
designs (factor A) and four different income levels (factor B) of potential customers. At

each combination of factor A and factor B, 5 customers are observed and the number of
products produced is recorded. Interaction between the two factors would exist if low
income customers have higher mean buying when design 1 is used, but higher income
customers have higher mean buying when designs 2 and 3 are used.
A decision maker wishes to test the following null and alternative hypotheses using an
alpha level equal to 0.05:
H0 : μ1 – μ2 = 0
HA : μ1 – μ2 ≠ 0
The population standard deviations are assumed to be known. After collecting the
sample data, the test statistic is computed to be z = 1.78
Using the test statistic approach, what conclusion should be reached about the null
hypothesis?
A) Because z = 2.40 > 1.96, we reject the null hypothesis.
B) Because z = 2.03 > 1.96, we reject the null hypothesis.
C) Because z = 1.78 < 1.96, we do not reject the null hypothesis.
D) Because z = 1.45 < 1.645, we do not reject the null hypothesis.
The following multiple regression output was generated from a study in which two
independent variables are included. The first independent variable (X1) is a quantitative
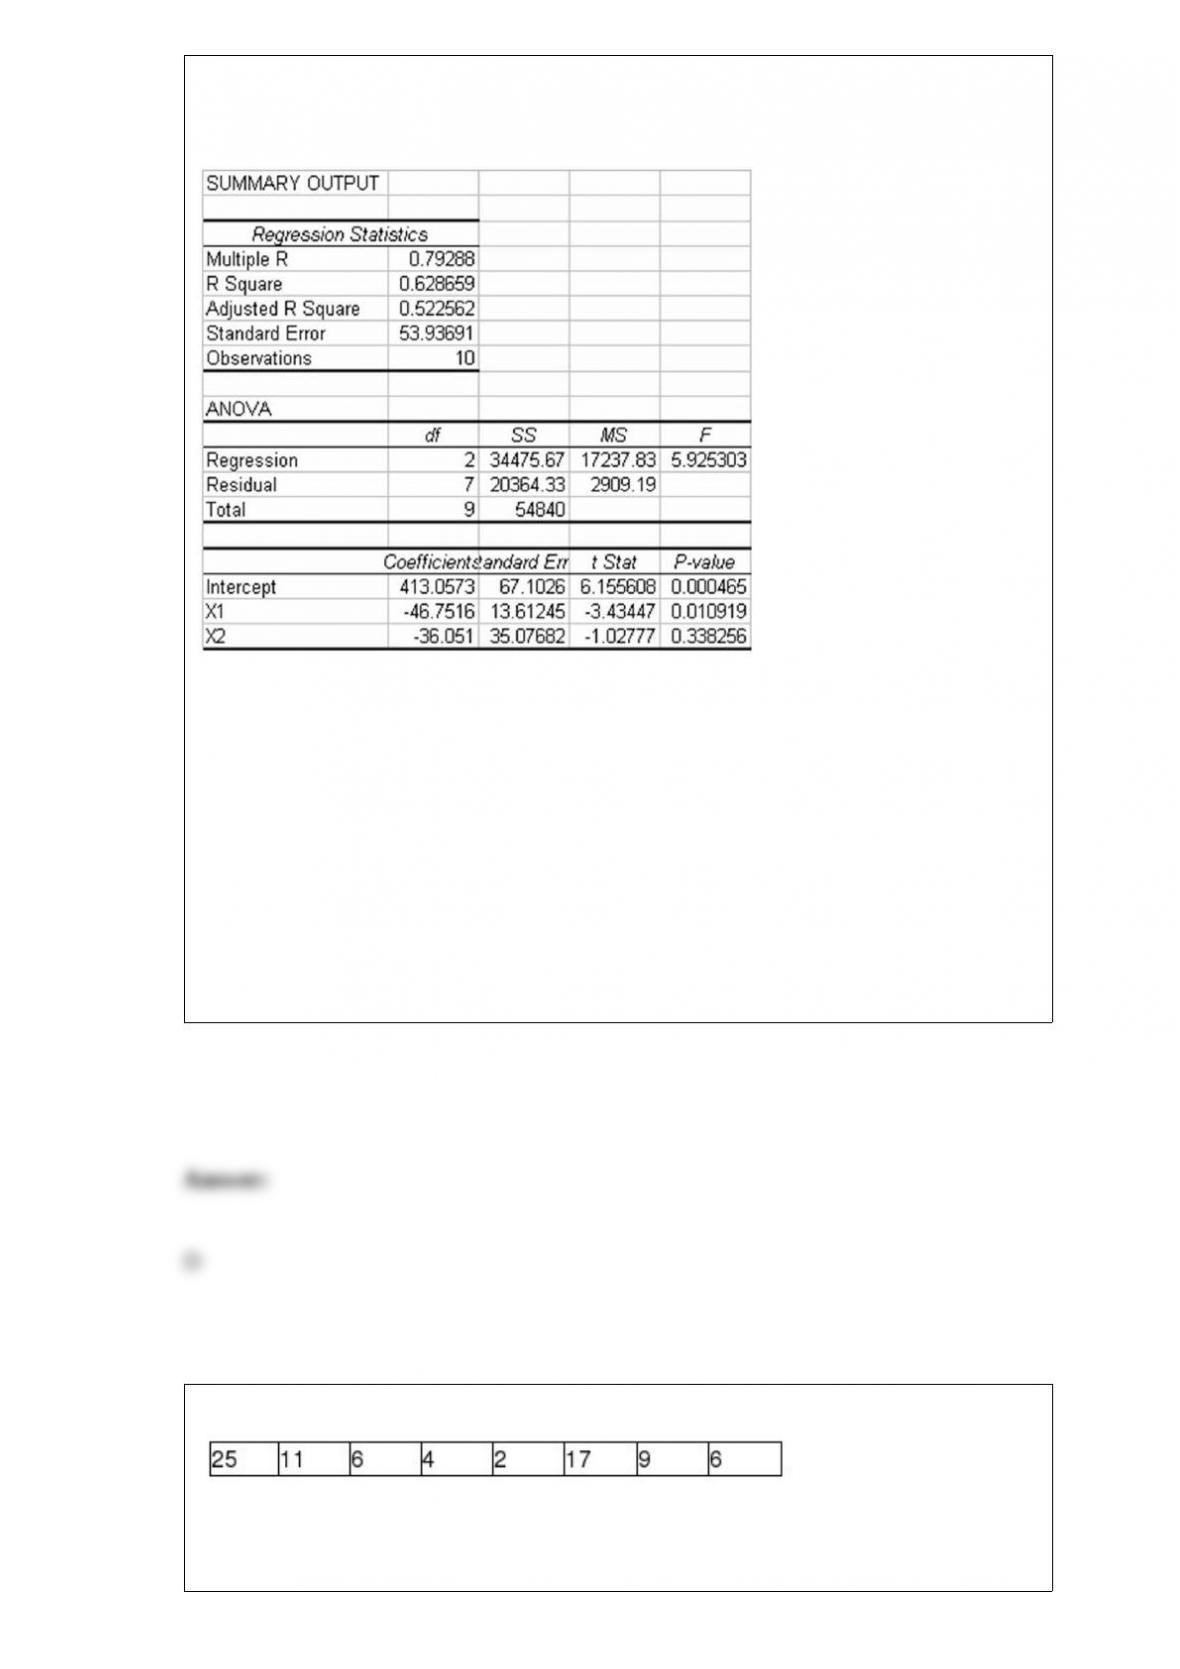
variable measured on a continuous scale. The second variable (X2) is qualitative coded
0 if Yes, 1 if No.
Based on this information, which of the following statements is true?
A) The model explains nearly 63 percent of the variation in the dependent variable
B) If tested at the 0.05 significance level, the overall model would be considered
statistically significant.
C) The variable X1 has a slope coefficient that is significantly different from zero if
tested at the 0.05 level of significance.
D) All of the above are true.
Consider the following sample data:
For these data the median is:

A) 7.5
B) 3.5
C) 10
D) None of the above
The main process change that can be detected with a process control chart is:
A) the process average has shifted up or down from normal.
B) the process average is trending up or down from normal.
C) the process is behaving in such a manner that the existing variation is not random in
nature.
D) All of the above
Which of the following is not a condition of the binomial distribution?
A) Two possible outcomes for each trial
B) The trials are independent.
C) The standard deviation is equal to the square root of the mean.
D) The probability of a success remains constant from trial to trial.
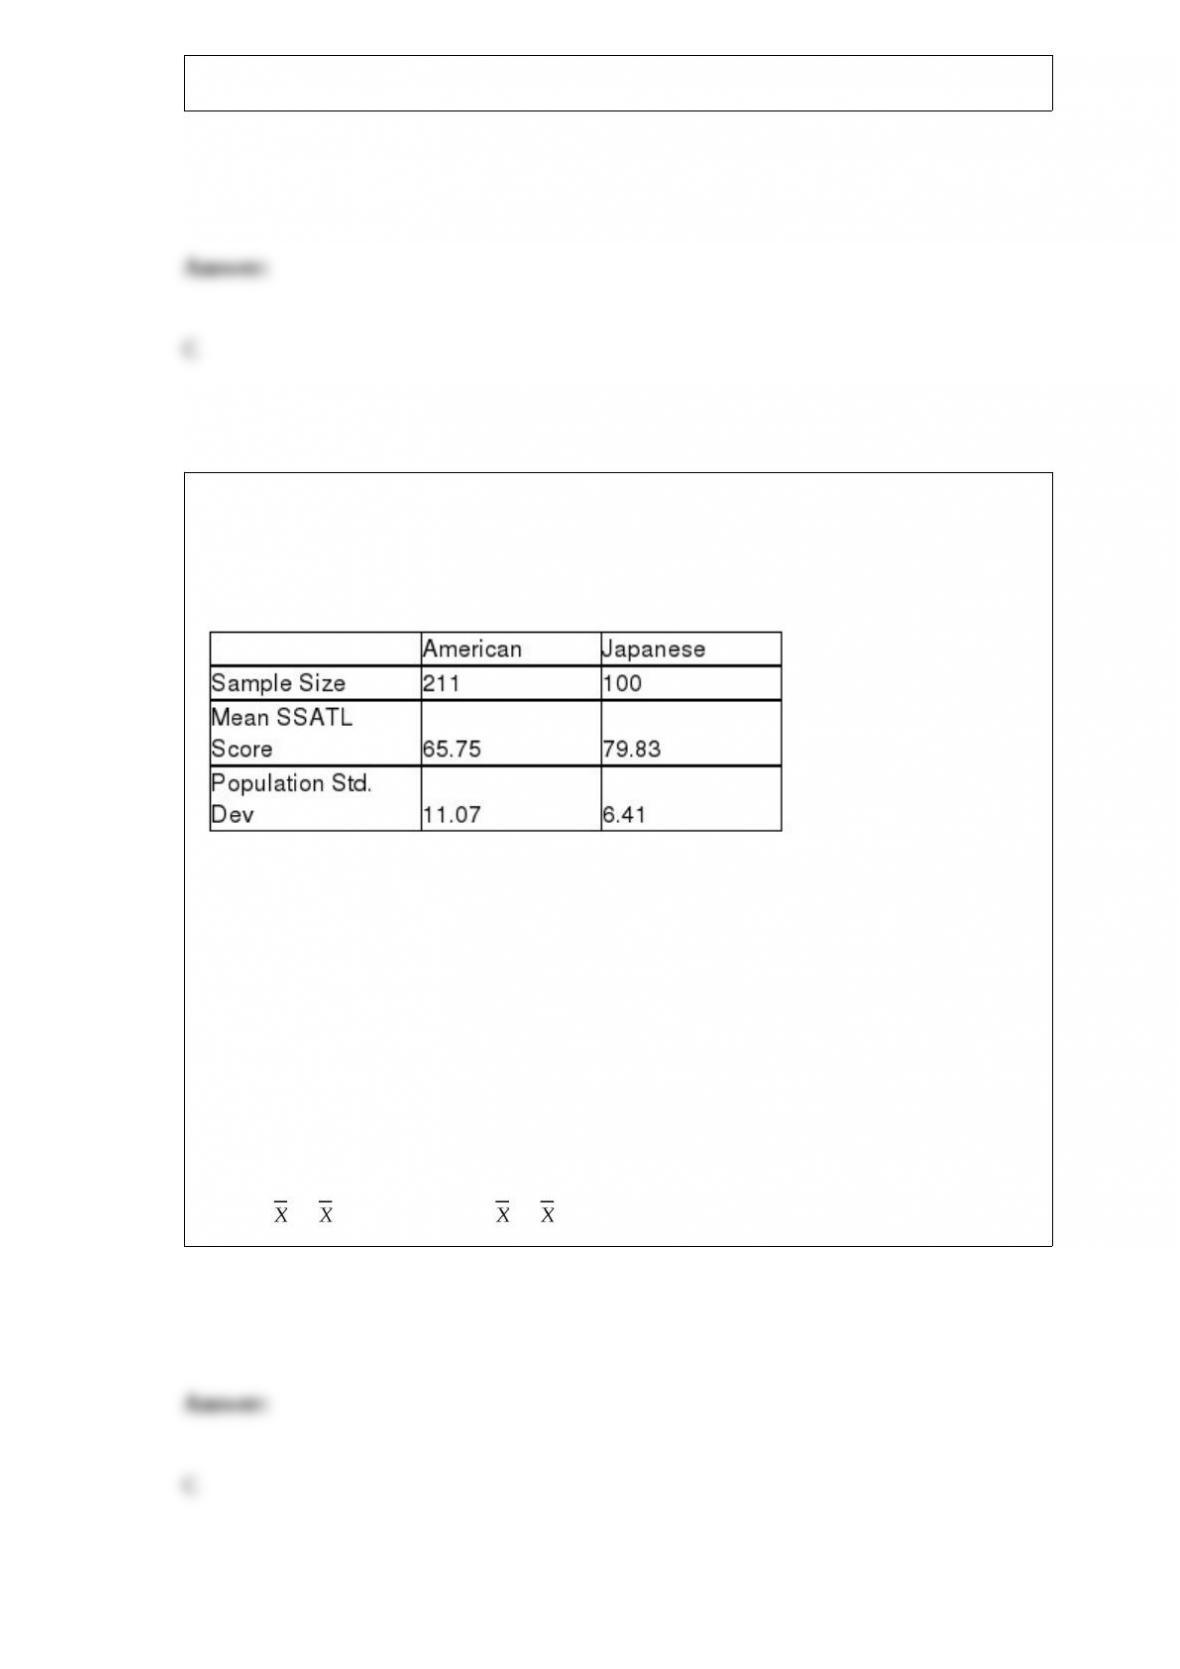
A recent study posed the question about whether Japanese managers are more
motivated than American managers. A randomly selected sample of each was
administered the Sarnoff Survey of Attitudes Toward Life (SSATL), which measures
motivation for upward mobility. The SSATL scores are summarized below.
Which of the following is the correct the null and alternative hypotheses to determine if
the average SSATL score of Japanese managers differs from the average SSATL score
of American managers?
A) H0 : μA – μJ ≥ 0 versus H1 : μA – μJ < 0
B) H0 : μA – μJ ≤ 0 versus H1 : μA – μJ > 0
C) H0 : μA – μJ = 0 versus H1 : μA – μJ ≠ 0
D) H0 : A – J = 0 versus H1 : A – J ≠ 0

In a recent meeting, the sales manager for a drug company stated that she needed to
have a forecast prepared for each week for the next six weeks. The week in this case is
the:
A) forecasting horizon.
B) forecasting period.
C) planning time.
D) forecasting interval.
Under which of the following conditions would you suggest that a double exponential
smoothing model should be used instead of a single exponential smoothing model?
A) When the time-series data exhibit a trend
B) When there are two main time-series variables involved in the forecast application
C) When the data exhibit only random variation
D) When the data set is extremely uneven
Hillman Management Services manages apartment complexes in Tulsa, Oklahoma.
They currently have 30 units available for rent. The monthly rental prices (in dollars)
for this population of 30 units are:
What is the range of possible sampling error if a random sample of sizen = 6 is selected
from the population?
A) -194.33 to 225.67
B) -245.23 to 271.86
C) -184.15 to 215.61
D) -172.52 to 234.04
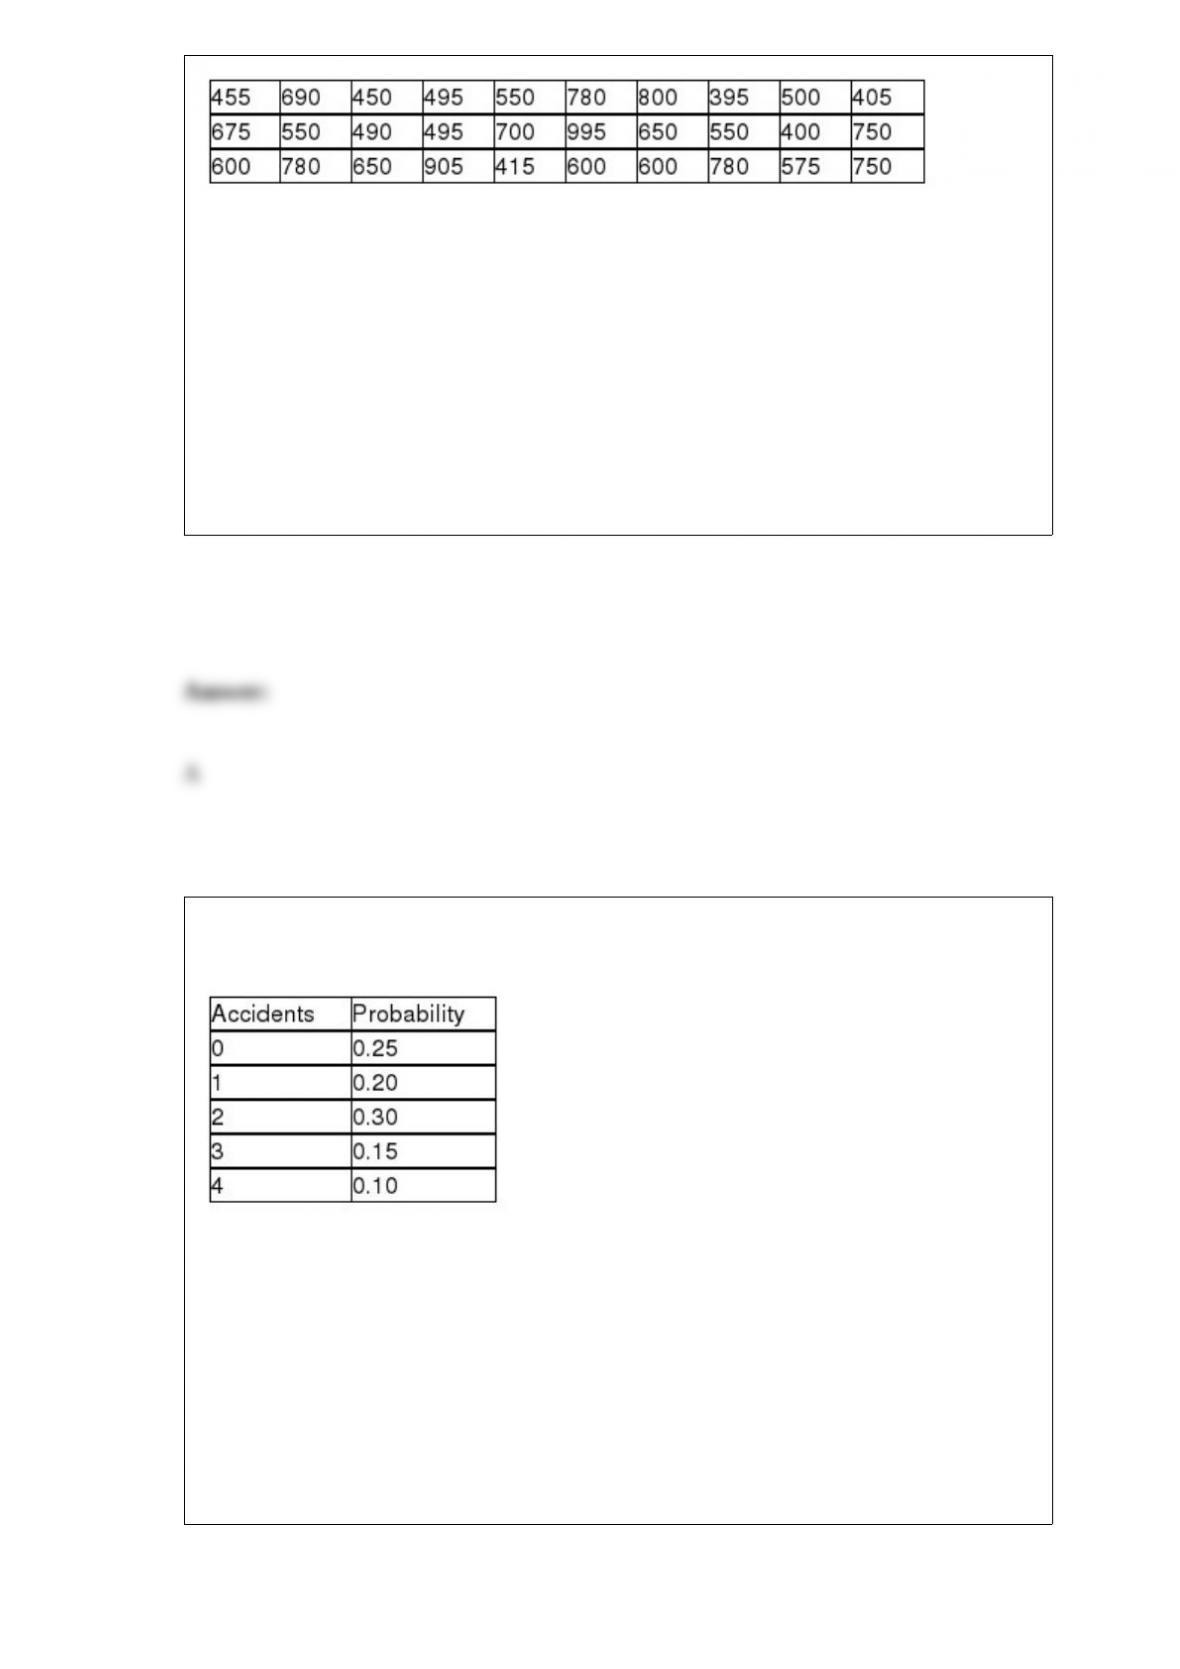
The following probability distribution has been assessed for the number of accidents
that occur in a Midwestern city each day:
Based on this distribution, the expected number of accidents in a given day is:
A) 0.30
B) 1.65
C) 2.00
D) 2.50

In a recent report, it was stated that the proportion of employees who carpool to their
work is 0.14 and that the standard deviation of the sampling proportion is 0.0259.
However, the report did not indicate what the sample size was. What was the sample
size?
A) 100
B) 180
C) 460
D) Can’t be determined without more information
The administrator at Sacred Heart Hospital is interested in estimating the proportion of
patients who are satisfied with the meals at the hospital. A random sample of 250
patients was selected and the patients were surveyed. Of these, 203 indicated that they
were satisfied. Based on this, what is the estimate of the standard error of the sampling
distribution?
A) 0.8120
B) 0.0247
C) 0.0006
D) Can’t be determined without knowing σ.

If the variance of the contents of cans of orange juice is significantly more than 0.003,
the manager has to order to stop the filling machine. A sample of 26 cans of orange
juice showed a standard deviation of 0.06 ounce. Based on the sample and at the 0.05
level of significance, the filling machine should be
A) stopped.
B) kept going.
C) upgraded.
D) downgraded.
Which of the following approaches might be used to determine which value for the
smoothing constant to use in a single exponential smoothing model?
A) Select the value that produces the smallest MAD value
B) Select the value that maximizes the MSE
C) Use the value that gives the largest MAD value
D) Use the value that smoothes the data the most

Men have a reputation for not wanting to ask for directions. A Harris study conducted
for Lincoln Mercury indicated that 42% of men and 61% of women would stop and ask
for directions. The U.S. Census Bureau’s 2012 population estimate was that for
individuals 18 or over, 48.2% were men and 51.8% were women. This exercise
addresses this age group.
Calculate the probability that the driver stops to ask for directions.
A) 0.518
B) 0.420
C) 0.316
D) 0.390
A food warehouse manager plans to conduct a check on damaged packages. The
warehouse covers a large area and products are spread out over the entire building.
Assuming that no products are more likely to have damaged packages than any other,
what statistical sampling method would be used to reduce the time and effort required
to do the study?
A) Convenience sampling
B) Stratified random sampling
C) Cluster random sampling
D) Systematic random sampling

A company has a monthly time series that regularly shows sales being higher in the
summer months. This is an example of which component?
A) Trend
B) Seasonal
C) Cyclical
D) Random
In a randomized complete block design analysis of variance, which of the following
correctly describes the number of degrees of freedom associated with the between sum
of squares?
A) One less than the number of populations involved
B) One less than the number of blocks
C) One less than the combined sample size in the experiment
D) One less than the total number of observations
The control limits in a control chart can be interpreted to mean:
A) any value falling outside the limits is a defect and the product should be discarded.
B) the range of virtually all special cause variation.
C) any value falling within the limits means the product is high quality.
D) the range of virtually all common cause variation.
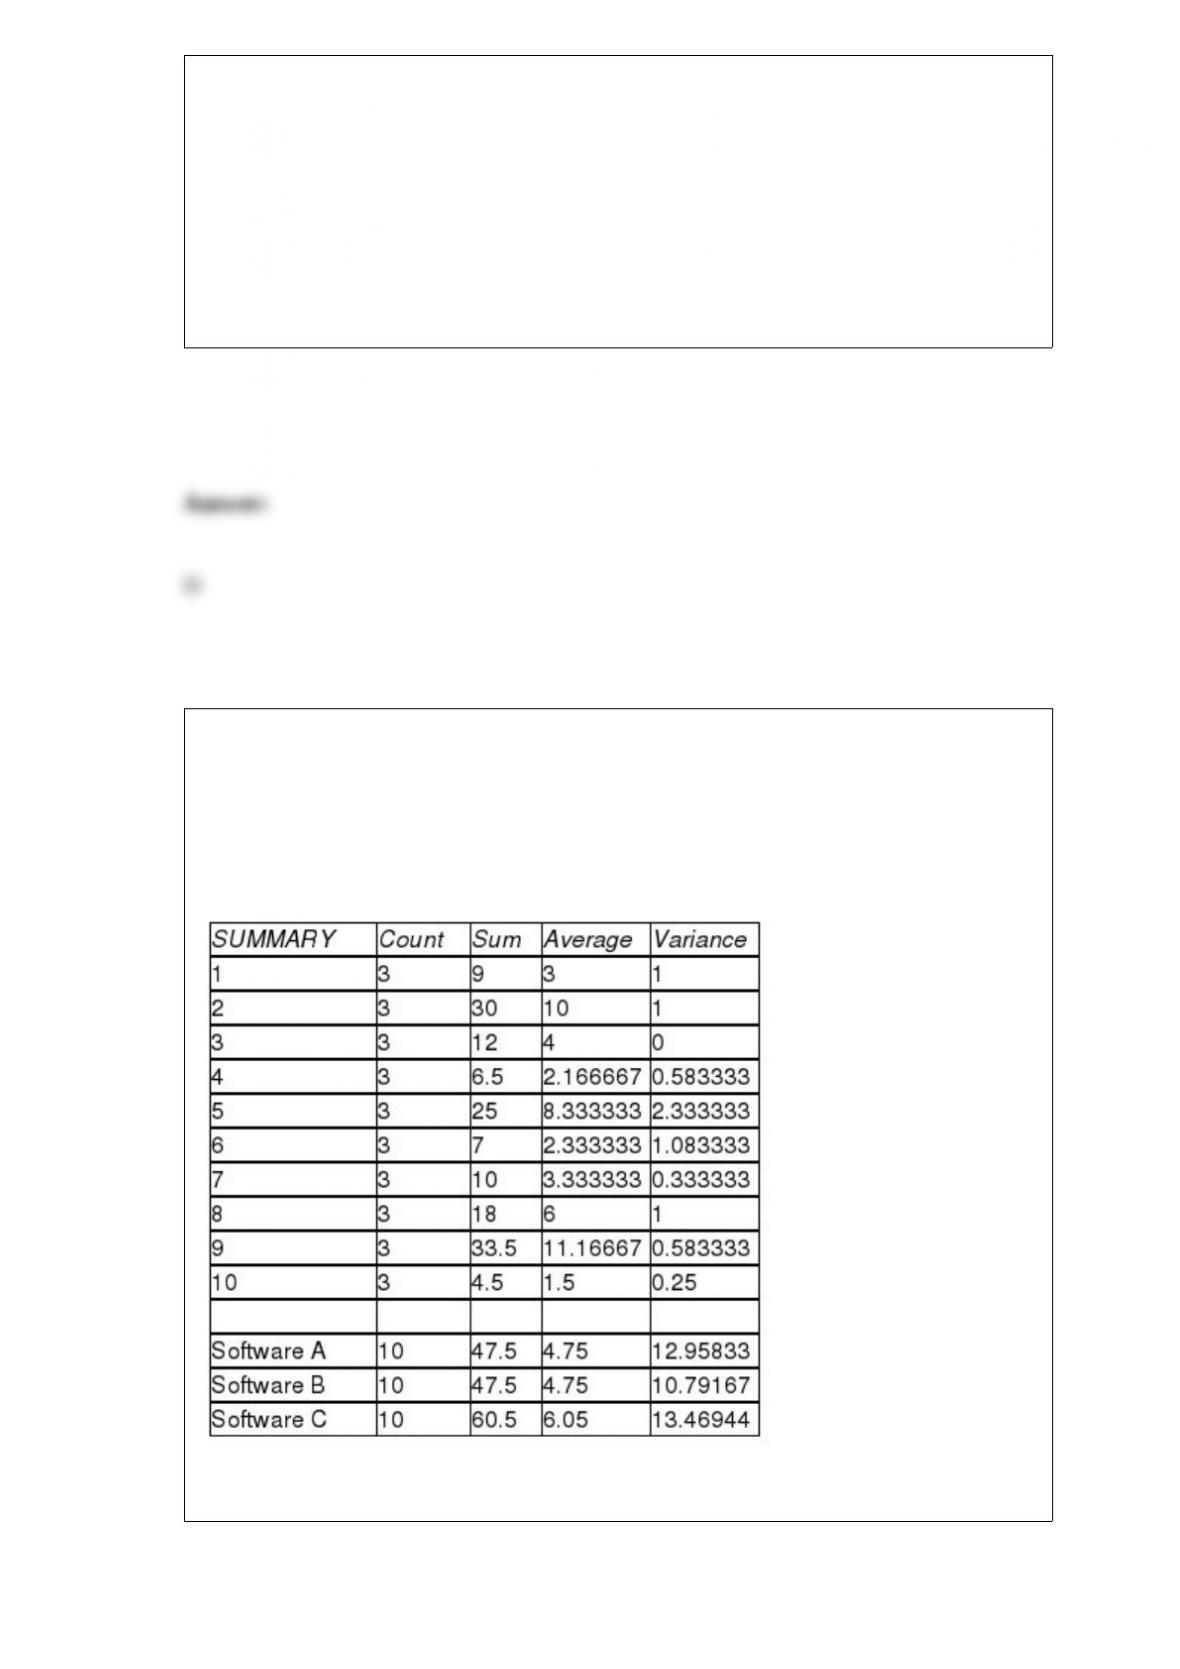
A test is conducted to compare three different income tax software packages to
determine whether there is any difference in the average time it takes to prepare income
tax returns using the three different software packages. Ten different persons’ income
tax returns are done by each of the three software packages and the time is recorded for
each. The computer results are shown below.
ANOVA

Assuming that the hypothesis tests are conducted using a significance level equal to
0.05, the Fisher’s LSD value for multiple comparisons is:
A) approximately 0.4985.
B) about 0.91.
C) approximately 1.91.
D) about 0.5387.
A bar chart possesses which of the following?
A) Capability of displaying the distribution for a quantitative variable
B) The option of displaying the data in scatter diagram form
C) The option for displaying two or more variables on the same chart
D) An easy method for displaying the general shape of a continuous variable

Which distribution is used in testing the hypotheses about the equality of two
population variances?
A) z-distribution
B) F-distribution
C) x2 distribution
D) t-distribution
An inventory of appliances contains four white washers and one black washer. If a
customer selects one at random, what is the probability that the black washer will be
selected?
A) 0.5
B) 0.4
C) 0.2
D) 0.8
A fast food chain operation is interested in determining whether the mean per customer
purchase differs by day of the week. To test this, it has selected random samples of
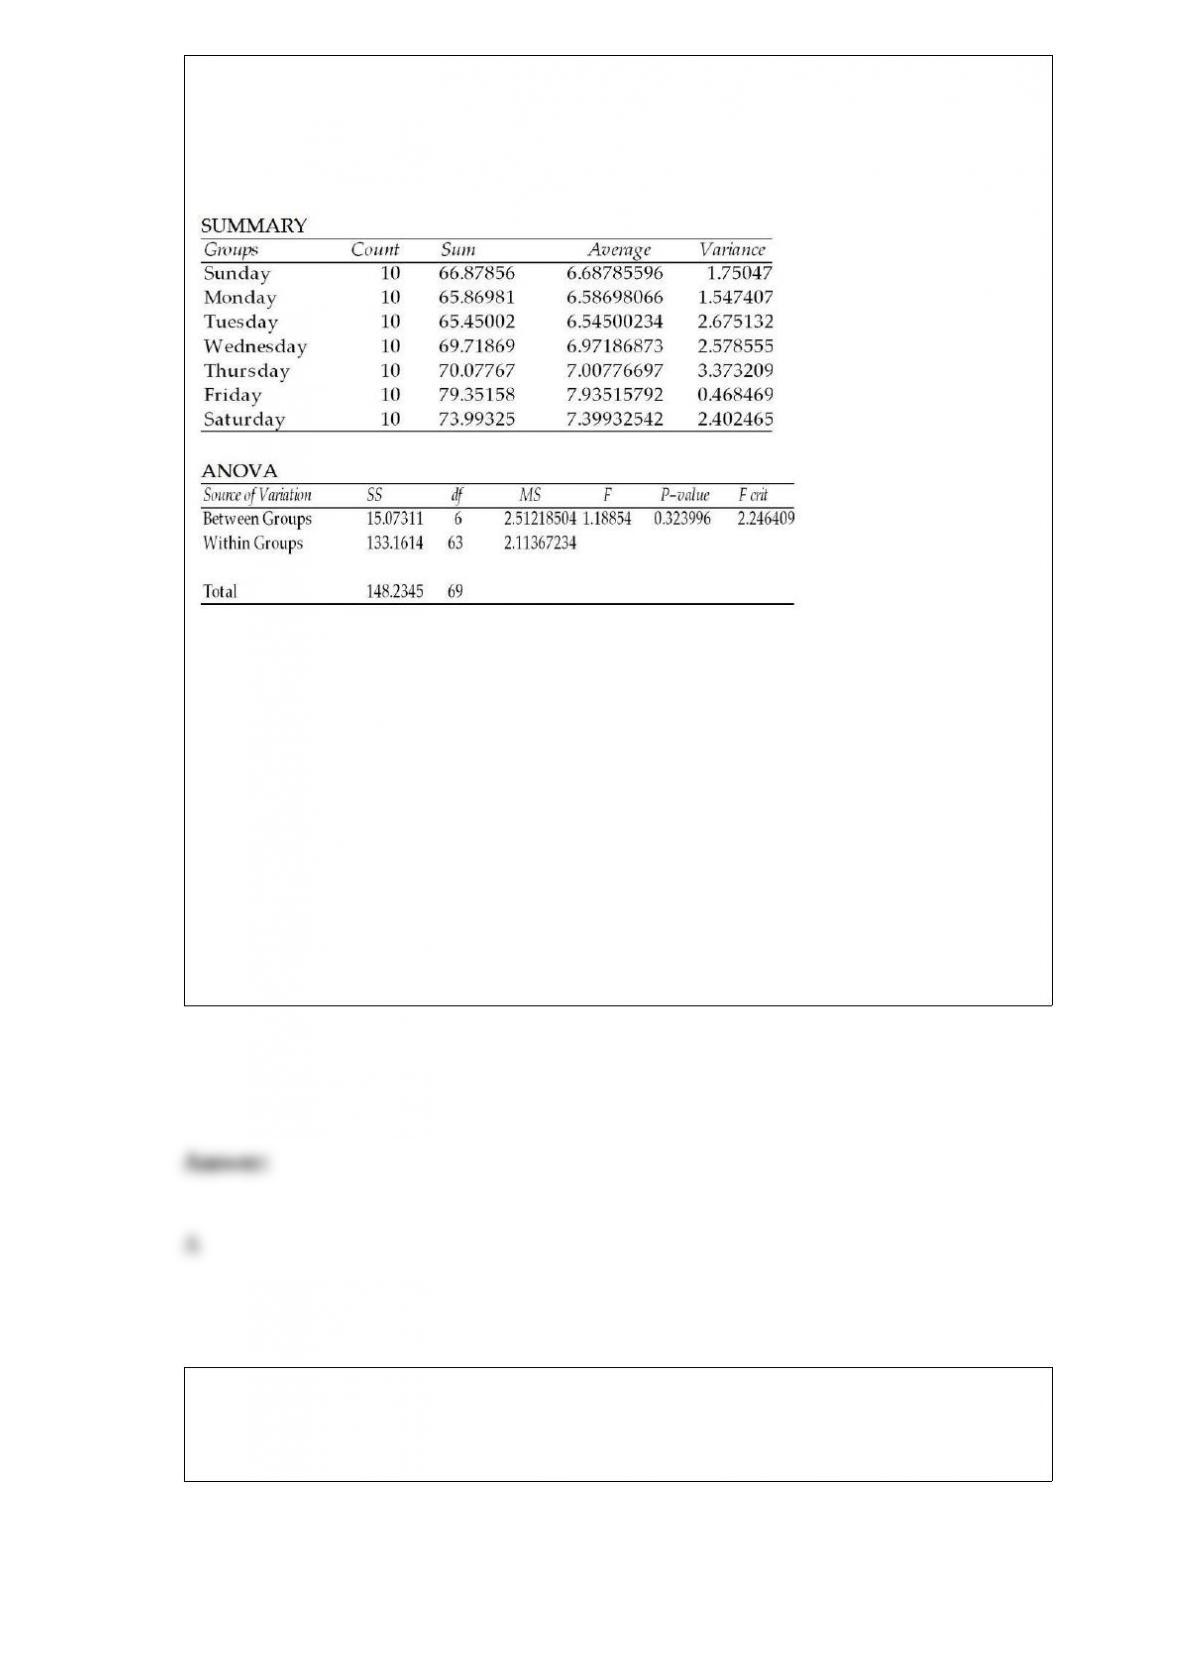
customers for each day of the week. The analysts then ran a one-way analysis of
variance generating the following output:
ANOVA: Single Factor
Based upon this output, which of the following statements is true if the test is conducted
at the 0.05 level of significance?
A) There is no basis for concluding that mean sales is different for the different days of
the week.
B) Based on the p-value, the null hypothesis should be rejected since the p-value
exceeds the alpha level.
C) The experiment is conducted as an unbalanced design.
D) Based on the critical value, the null should be rejected.
Recently, a bank manager pulled a sample of customer accounts and recorded data for
two variables, checking account balance and total number of transactions during the
previous 30 days. The data collected would be considered time-series data.

The human resources department at a major high tech company recently conducted an
employee satisfaction survey of 100 of its 3,000 employees. Data were collected on
such variables as age, gender, marital status, current salary, level of overall satisfaction
on a scale from 1 to 5, number of years with the company, and job title. Which of the
variables would be classified as nominal level data?
A) Age and years with the company
B) Overall satisfaction
C) Gender, marital status, and job title
D) Age and gender
Woof Chow Dog Food Company believes that it has a market share of 25 percent. It
surveys n = 100 dog owners and ask whether or not Woof Chow is their regular brand
of dog food. The appropriate null and alternate hypotheses are:
A) H0 : ρ = .25
Ha : ρ ≠ .25
B) H0 : p = .25
Ha : p ≠ .25
C) H0 : μ = .25
Ha : μ ≠ .25
D) H0 : p ≤ .25
Ha : p > .25

Respond to the following questions using this partially completed one-way ANOVA
table:
Based on the analysis of variance F-test, what conclusion should be reached regarding
the null hypothesis? Test using a significance level of 0.01.
A) Since 7.948 > 2.8778 accept H0 and conclude that all population means are the
same.
B) Since 14.667 > 2.8778 accept H0 and conclude that all population means are the
same.
C) Since 7.948 > 2.8778 reject H0 and conclude that at least two populations means are
different.
D) Since 14.667 > 2.8778 reject H0 and conclude that at least two populations means
are different.