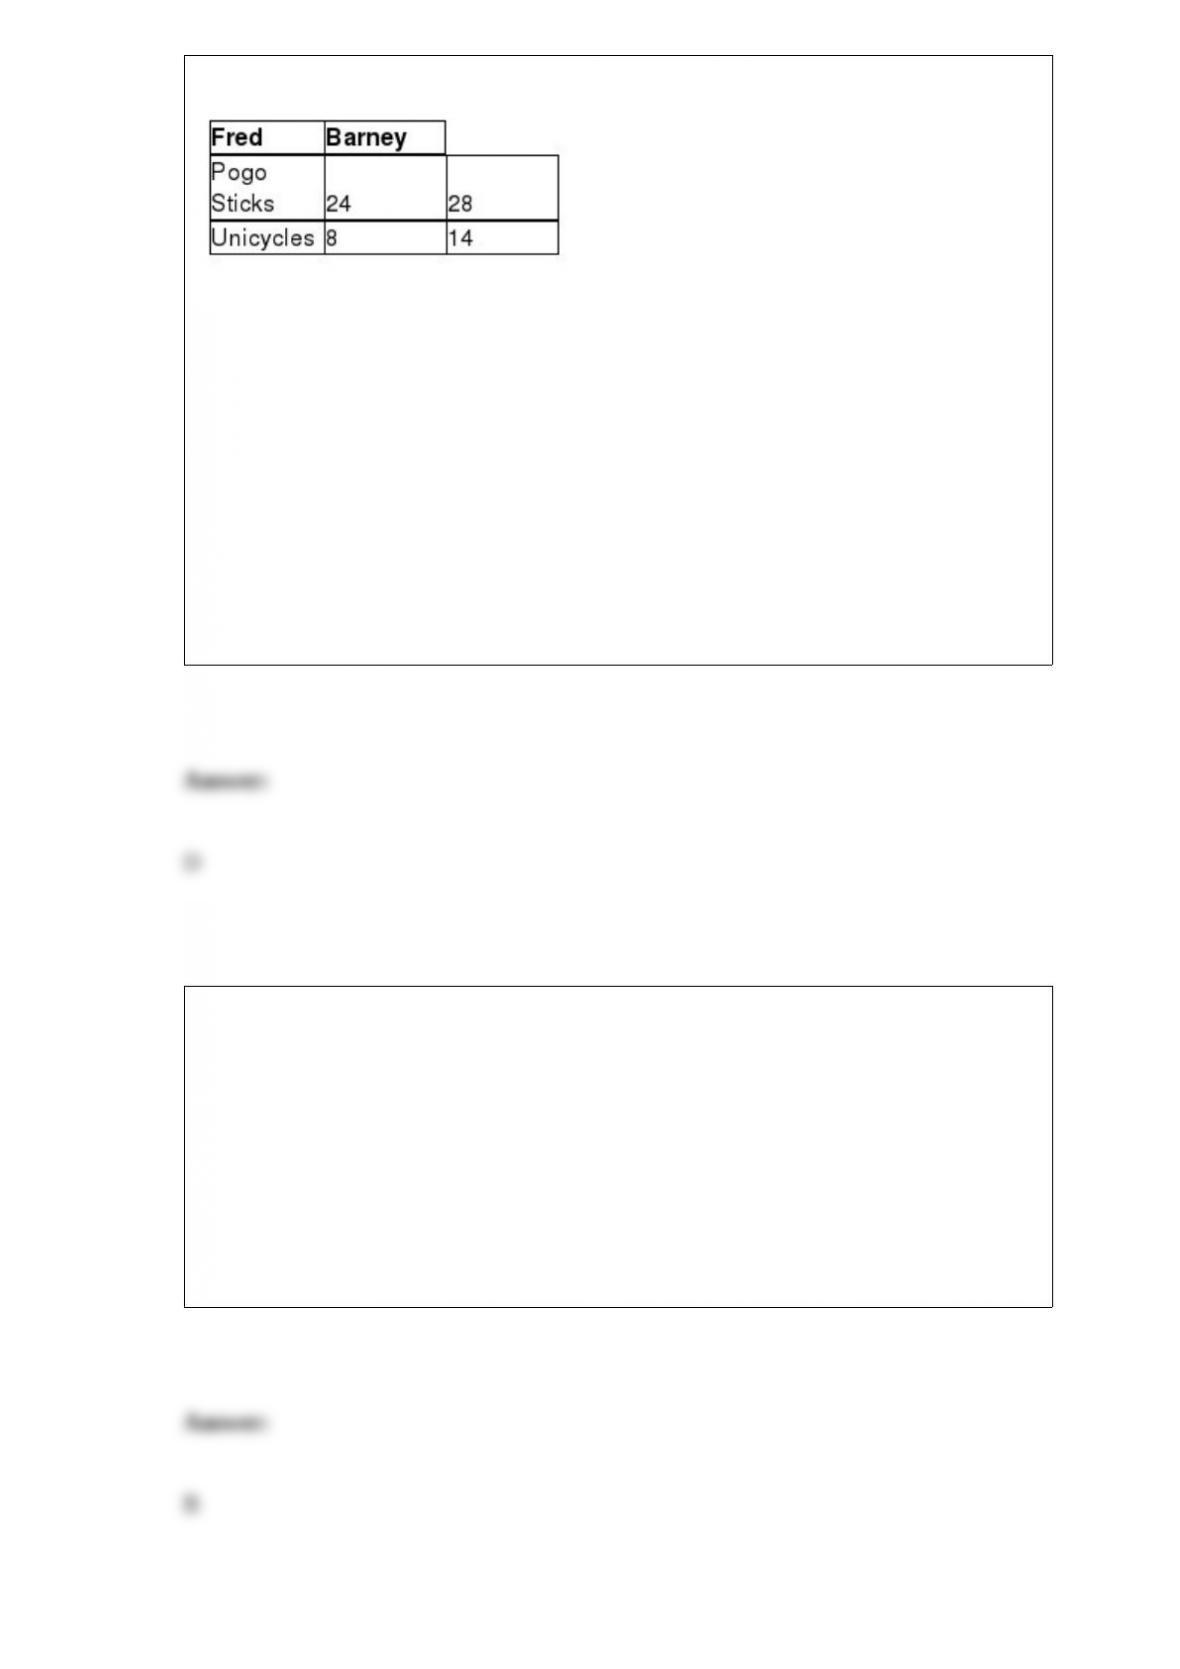
Table 2-10
Table 2-10 shows the output per month of two people, Fred and Barney. They can either
devote their time to making pogo sticks or making unicycles. Which of the following
statements istrue?
A) Fred has a comparative advantage in making both products.
B) Barney has a comparative advantage in making both products.
C) Barney has a comparative advantage in making pogo sticks and Fred in making
unicycles.
D) Barney has a comparative advantage in making unicycles and Fred in making pogo
sticks.
If average total cost is $50 and average fixed cost is $15 when output is 20 units, then
the firm’s total variable cost at that level of output is
A) $1,000.
B) $700.
C) $300.
D) impossible to determine without additional information.
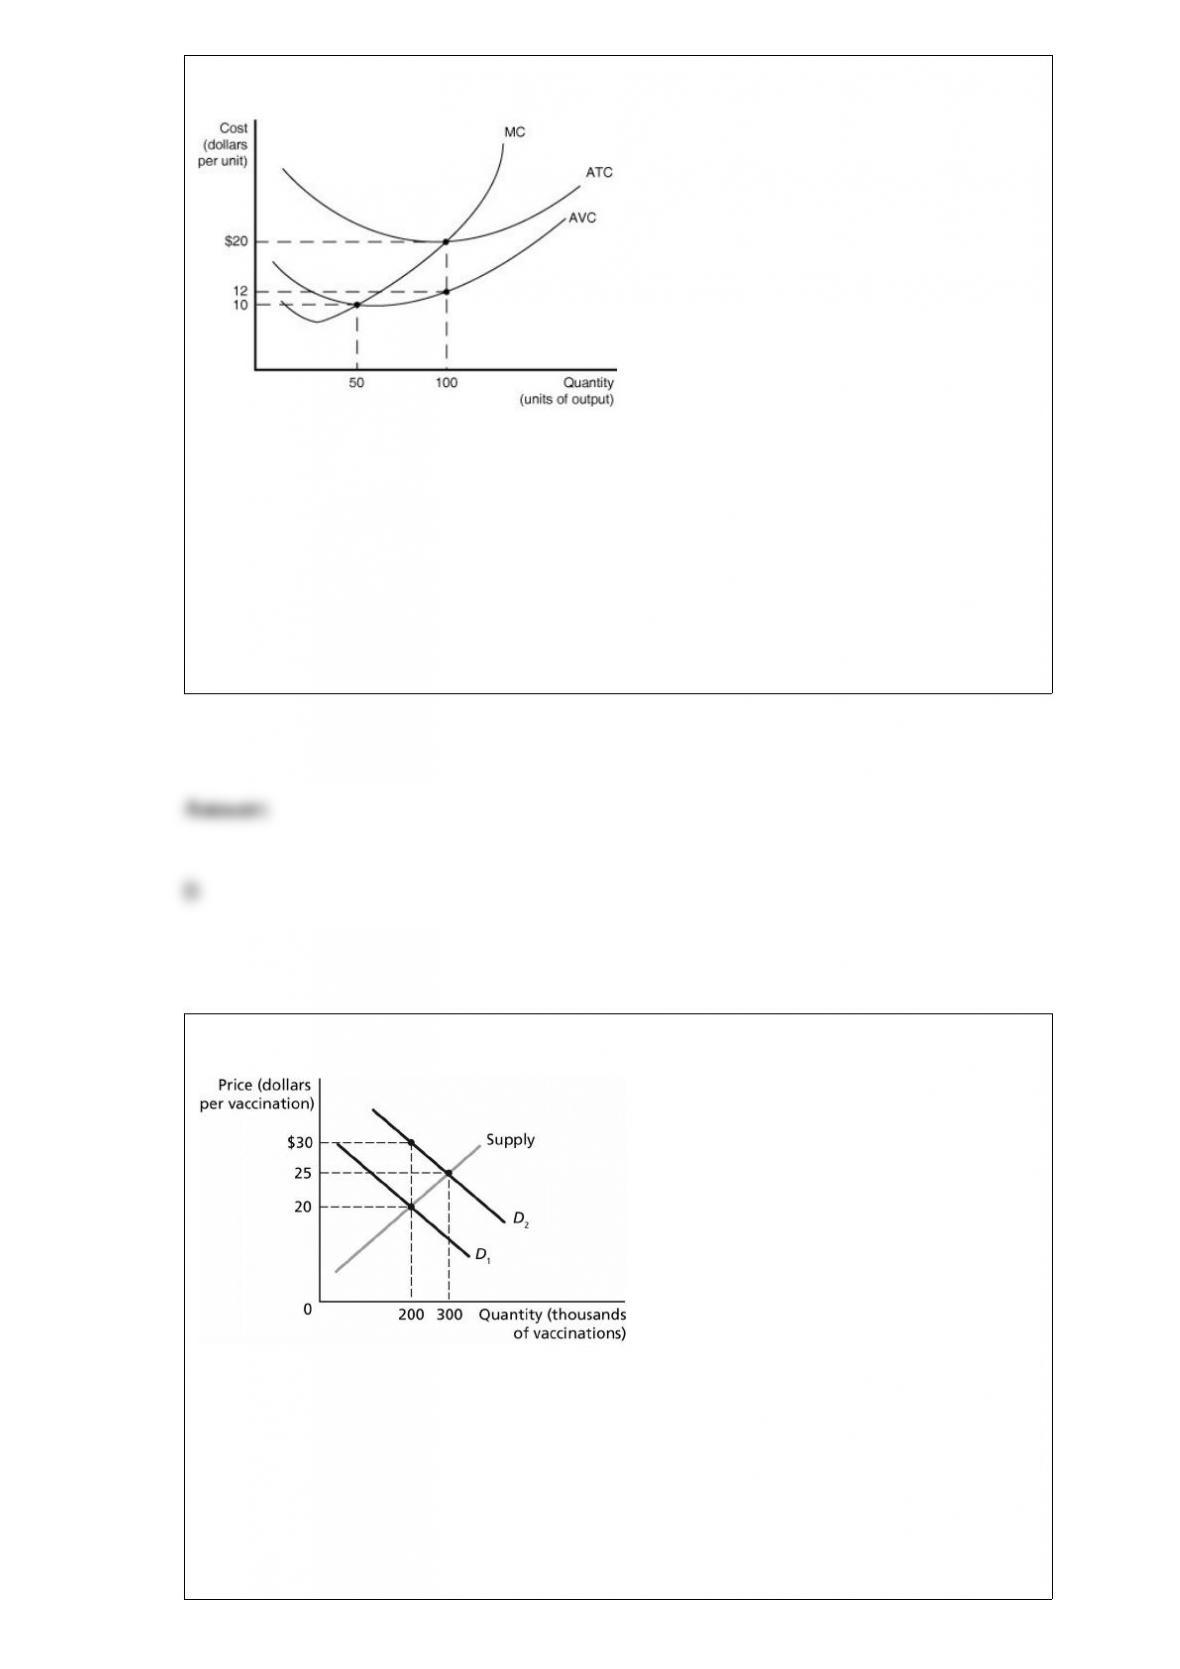
Figure 11-7
Figure 11-7 shows the cost structure for a
firm.When the output level is 100 units average fixed cost is
A) $10.
B) $8.
C) $5.
D) This cannot be determined from the diagram.
Figure 7-1
Figure 7-1 represents the market for
vaccinations. Vaccinations are considered a benefit to society, and the figure shows both
the marginal private benefit and the marginal social benefit from vaccinations. The
market equilibrium quantity is ________ thousand vaccinations.
A) 100
B) 200
C) 300
D) >300
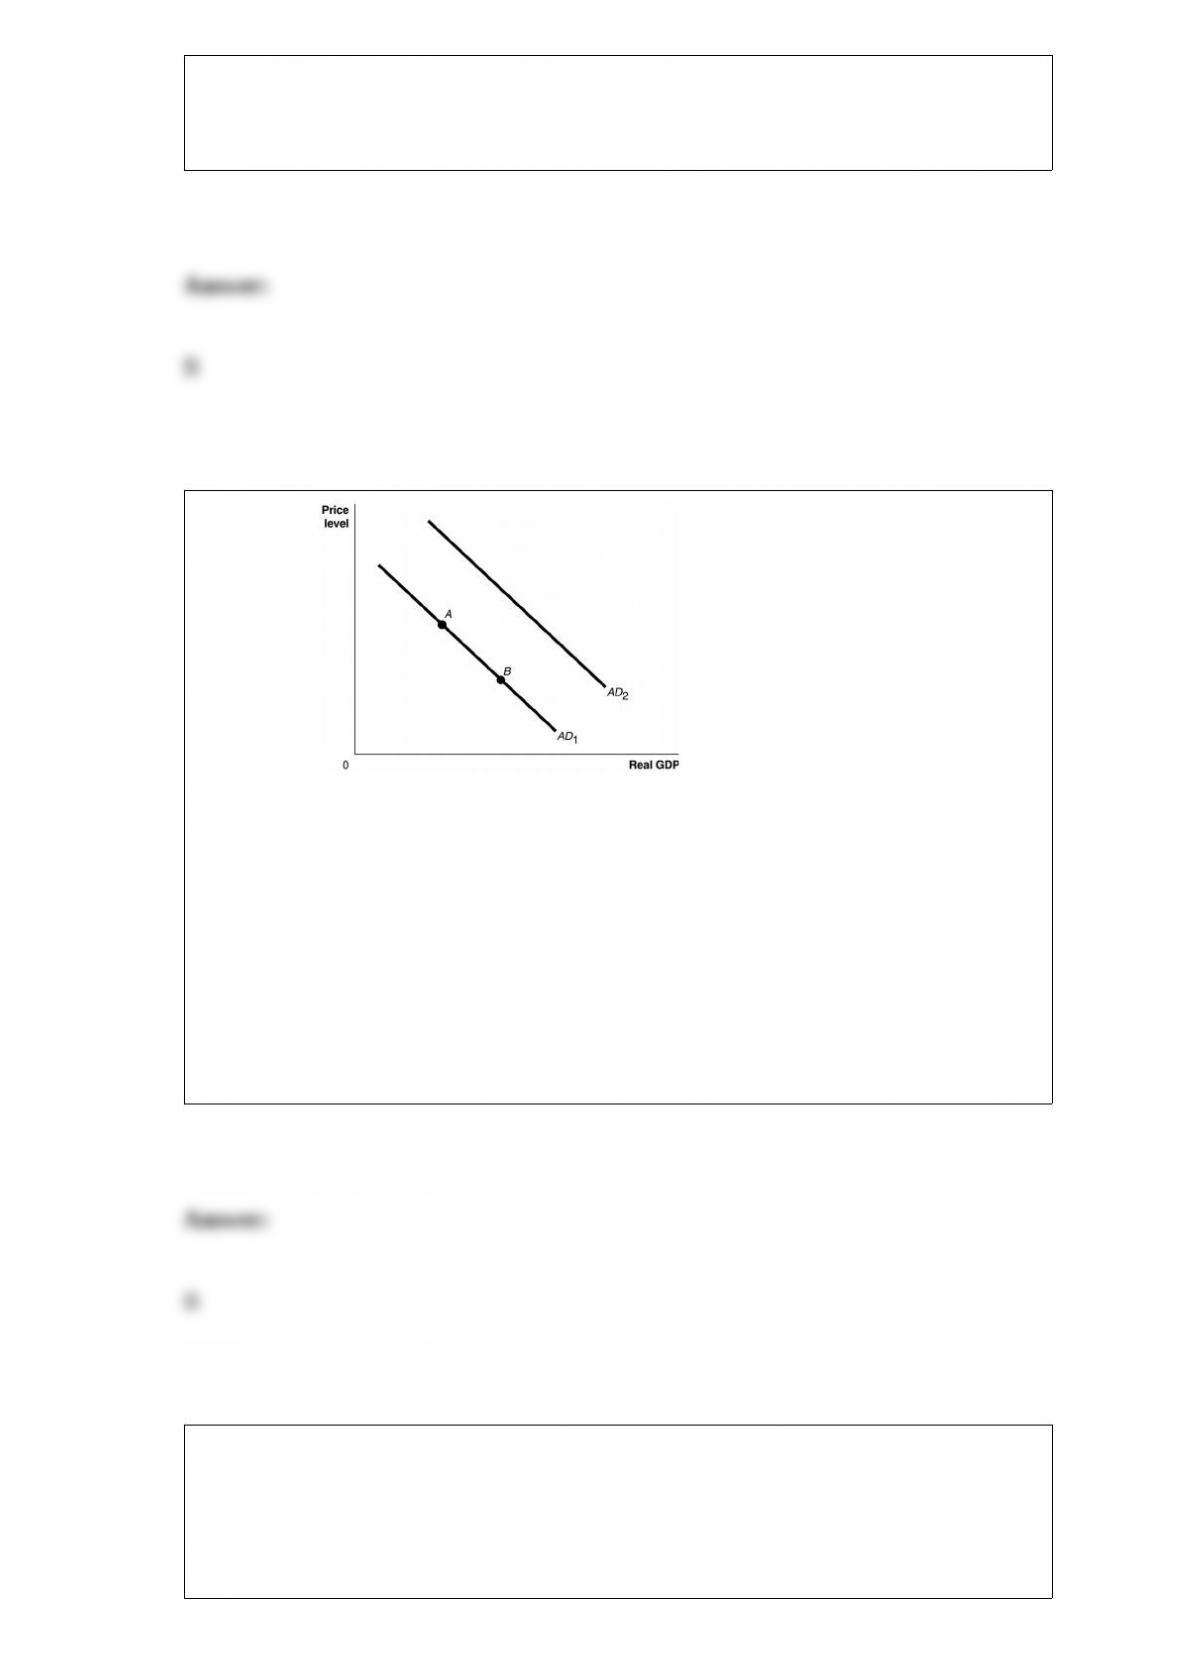
Figure 24-1
Ceteris paribus, an increase in the value of the domestic currency relative to foreign
currencies would be represented by a movement from
A) AD1 to AD2.
B) AD2 to AD1.
C) point A to point B.
D) point B to point A.
Which of the following statements is true?
A) An increase in demand causes an increase in equilibrium price; the increase in price
causes supply to increase.
B) A decrease in supply causes equilibrium price to rise; the increase in price then
results in a decrease in quantity demanded.
C) If both demand and supply decrease, there must be a decrease in equilibrium price;
equilibrium quantity may either increase or decrease.
D) If demand increases and supply decreases, one cannot determine if equilibrium price
will increase or decrease without knowing which change is greater.
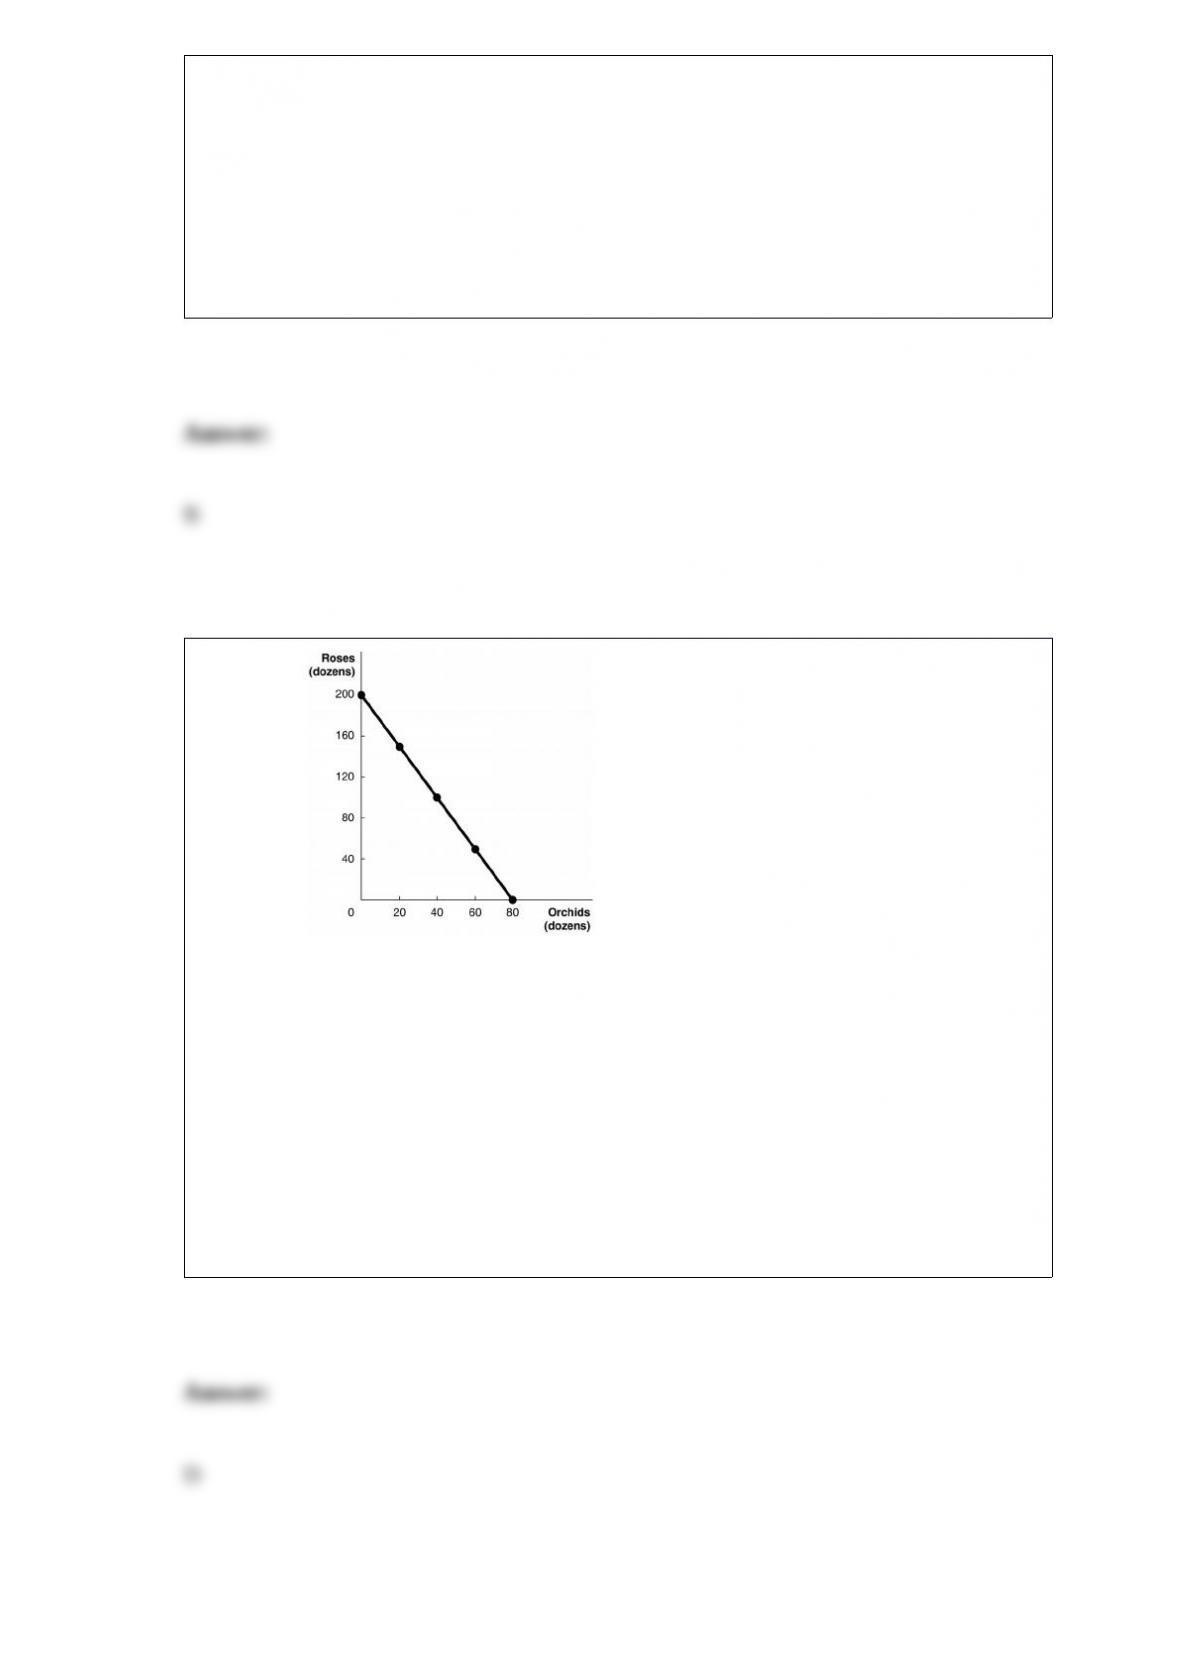
Figure 2-8 Figure 2-8 above shows the production
possibilities frontier for Vidalia, a nation that produces two goods, roses and orchids.
What is the opportunity cost of 80 dozen orchids?
A) 0 roses
B) 2.5 dozen roses
C) 40 dozen roses
D) 200 dozen roses
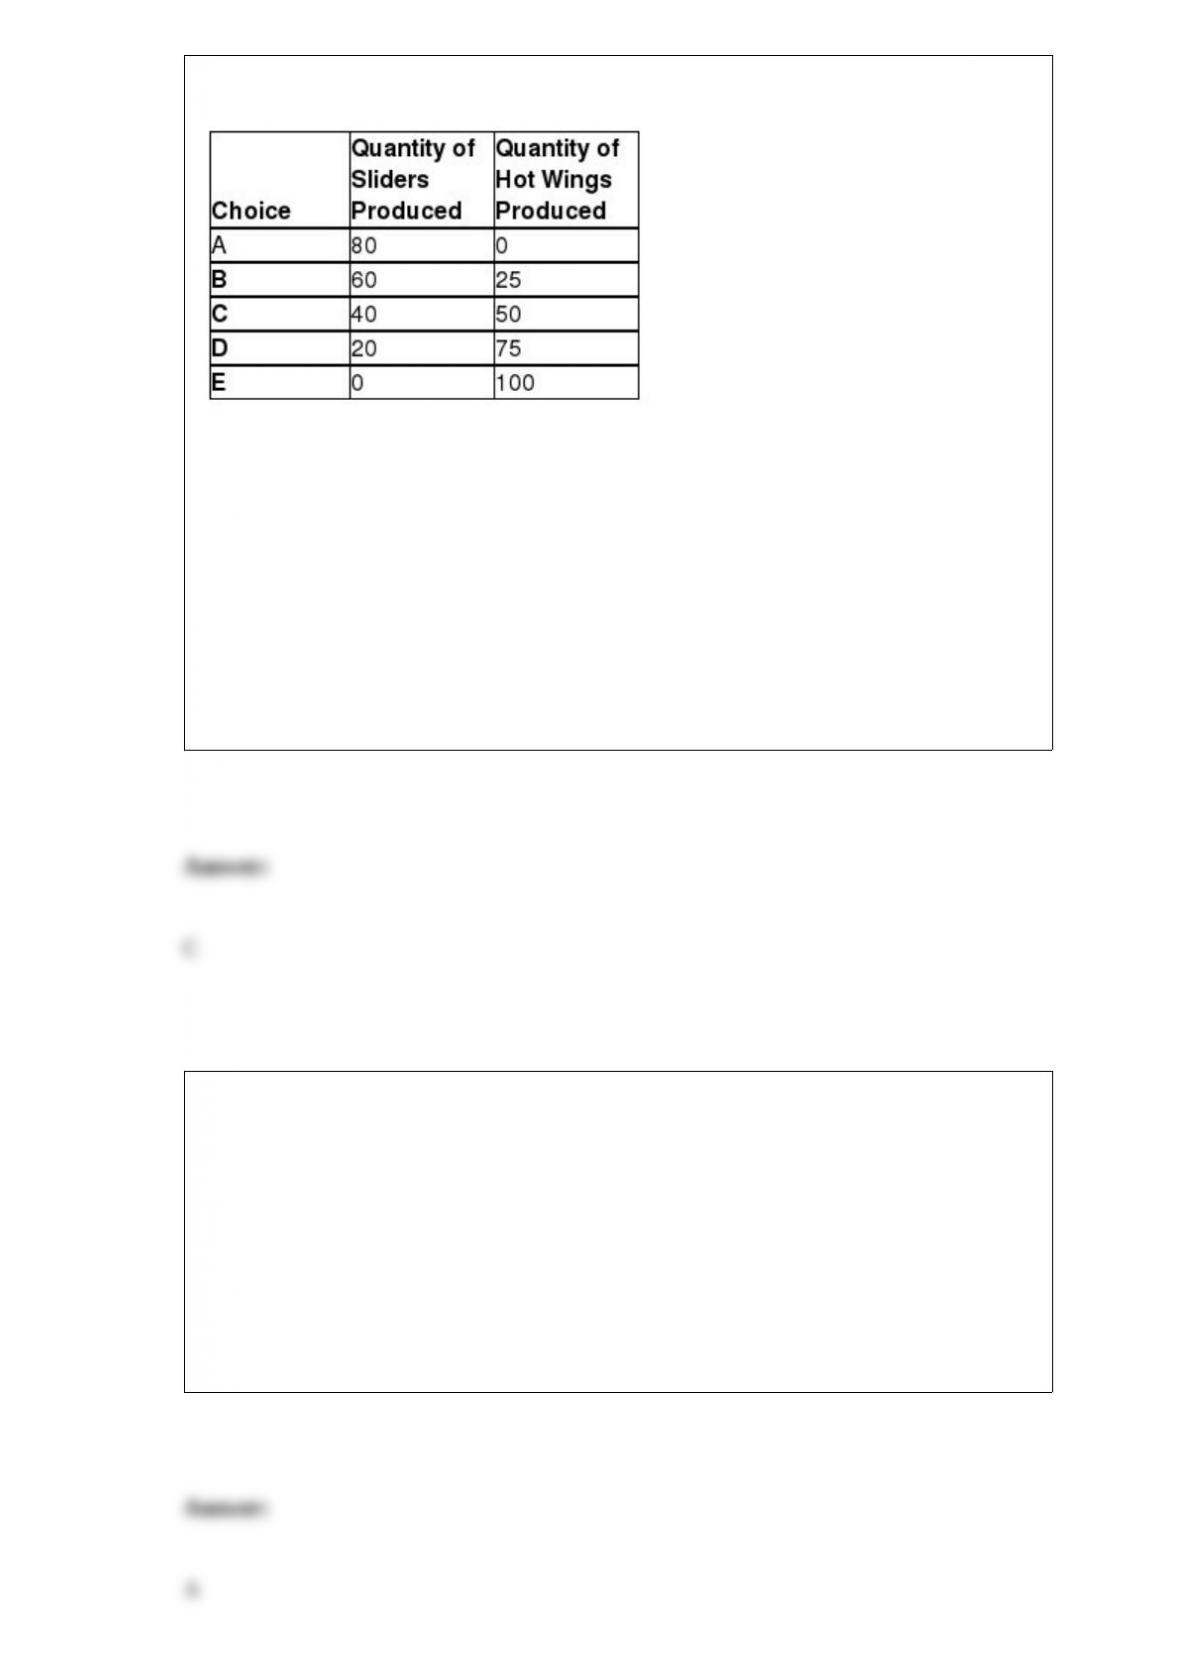
Table 2-1 Production Choices for Dina’s Diner
Assume Dina’s Diner only produces sliders and hot wings. A combination of 60 sliders
and 50 hot wings would appear
A) along Dina’s production possibilities frontier.
B) inside Dina’s production possibilities frontier.
C) outside Dina’s production possibilities frontier.
D) at the vertical intercept of Dina’s production possibilities frontier.
A federal budget deficit ________ interest rates, which ________ exchange rates
(foreign currency per domestic currency), and ________ the balance of trade.
A) raises; raises; reduces
B) reduces; raises; reduces
C) raises; reduces; reduces
D) reduces; reduces; raises
In the United States in 2012, the percentage of firms that employed more than 200
workers and did not offer health insurance as a fringe benefit to the workers was about
A) 2%.
B) 29%.
C) 44%.
D) 98%.
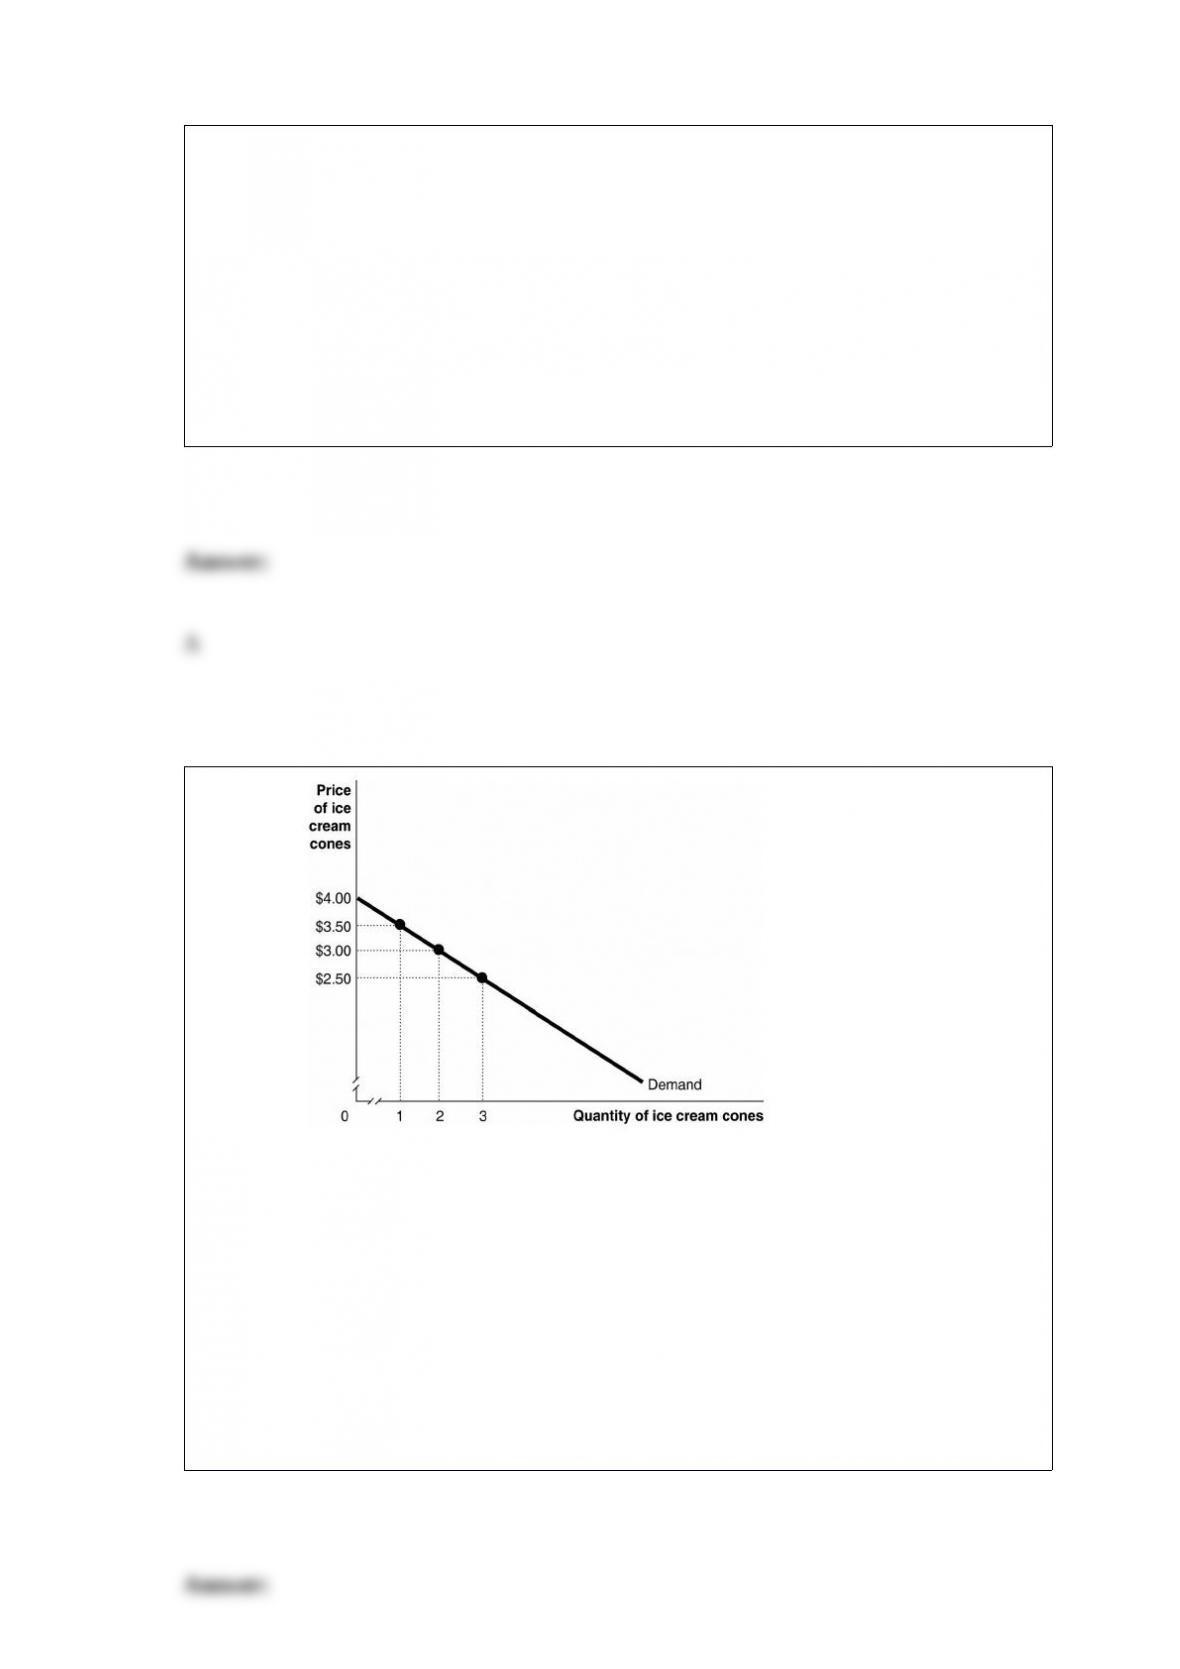
Figure 4-1 Figure 4-1 shows Kendra’s
demand curve for ice-cream cones.
Kendra’s marginal benefit from consuming the second ice cream cone is
A) $6.50
B) $6.00
C) $3.00
D) $2.25