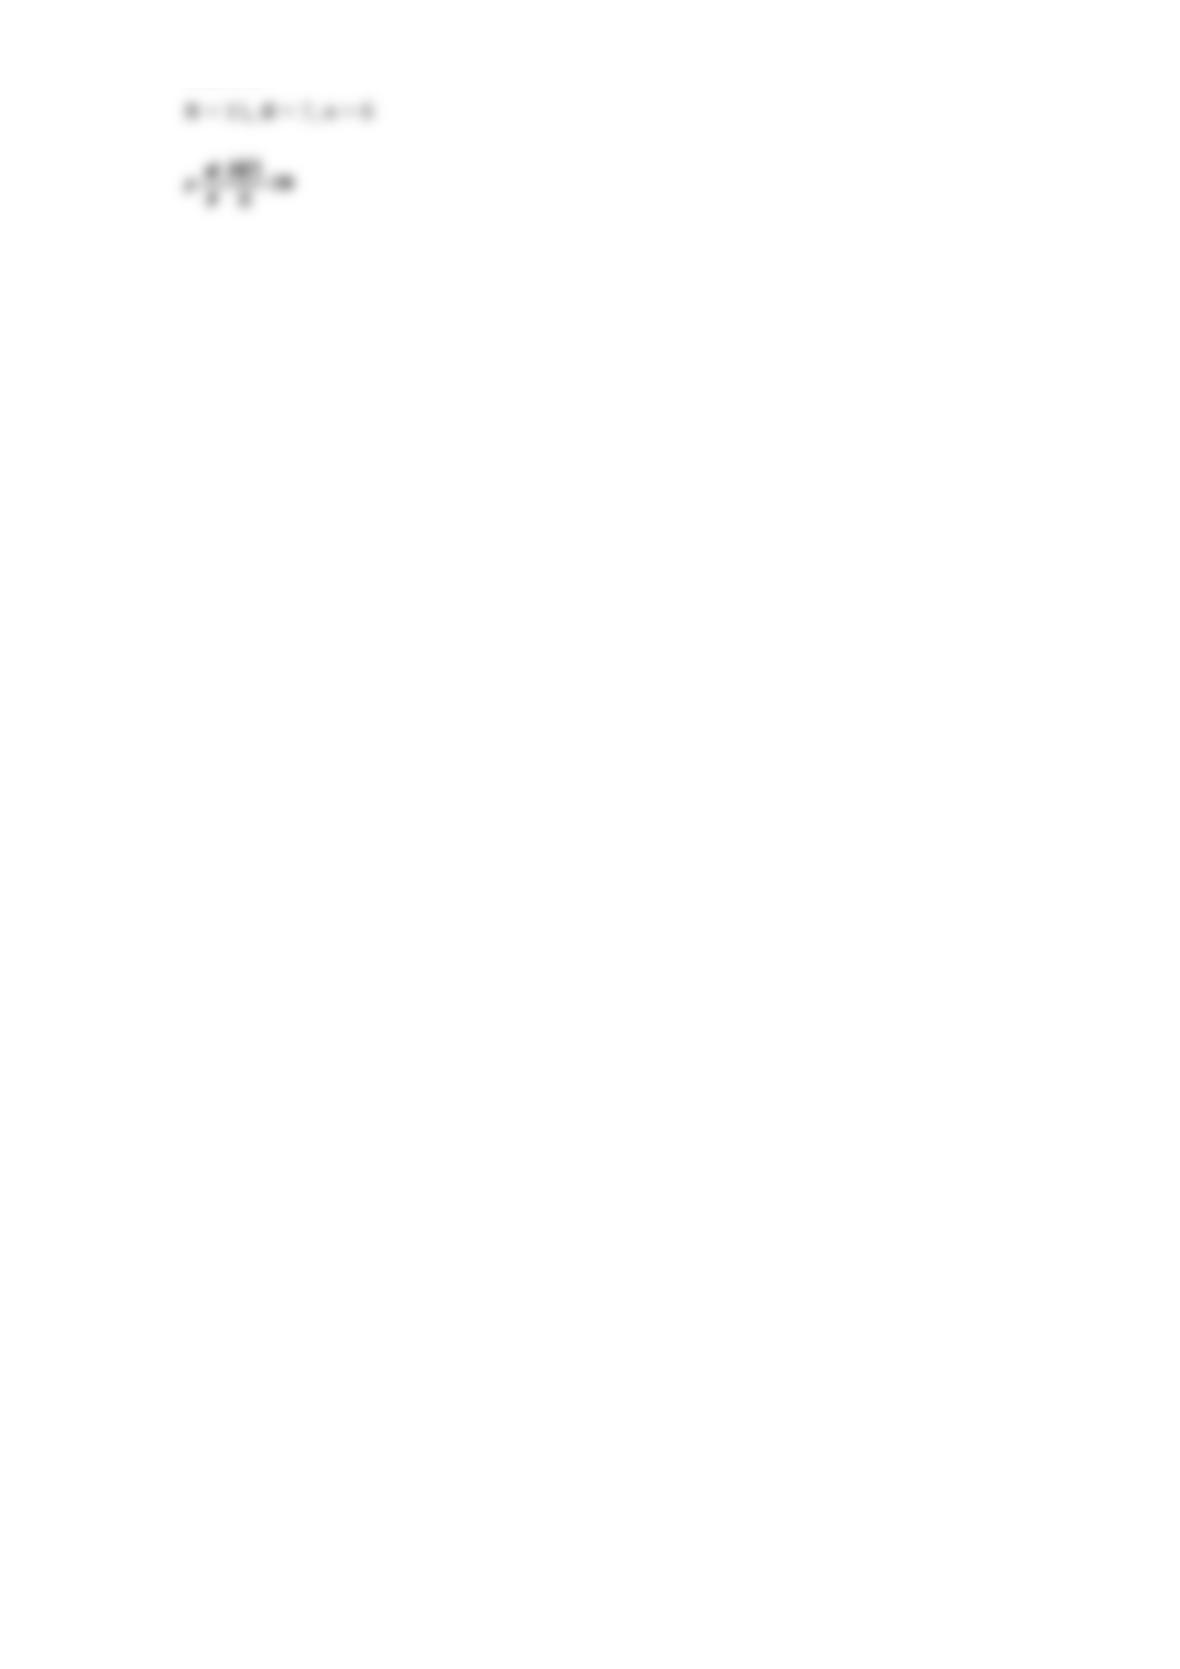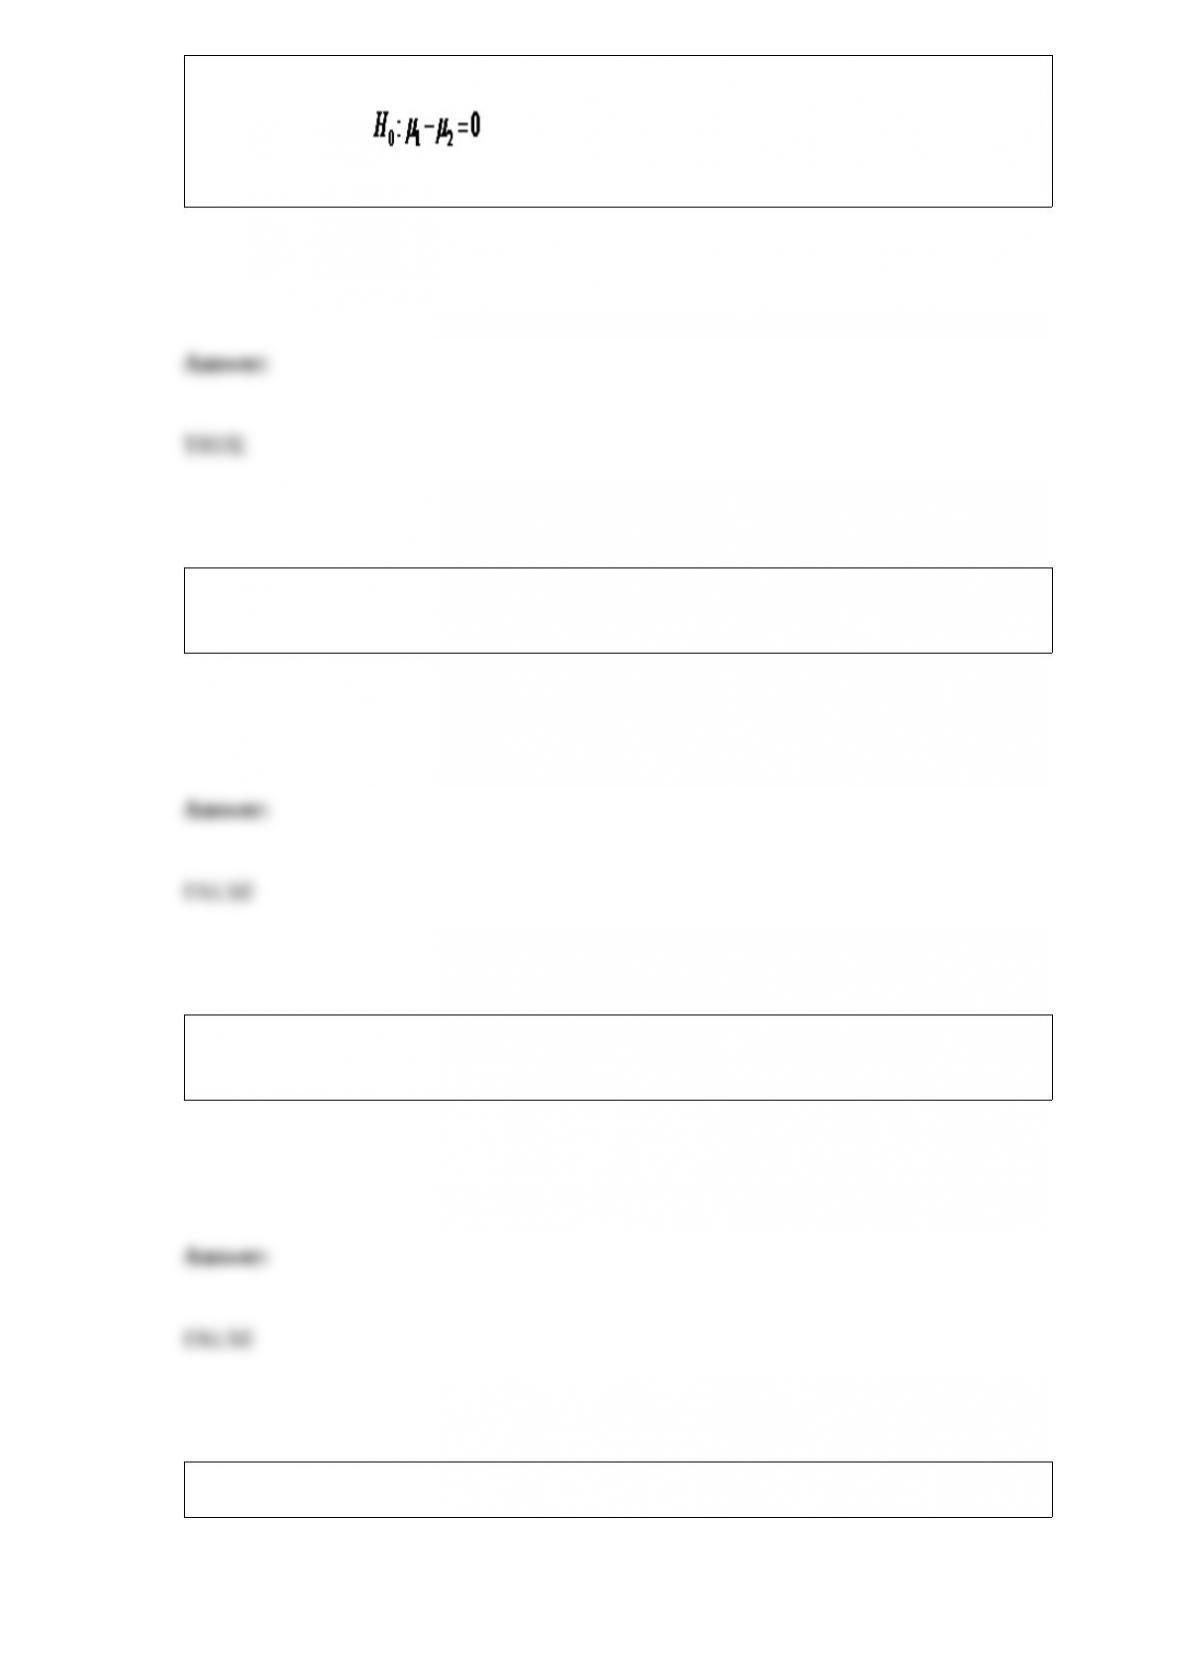
When the confidence interval for the difference between two means does not include
zero when testing , we have support that a significant difference between
population means does exist.
The degrees of freedom are used to determine the critical z-score for the normal
distribution when calculating a confidence interval.
When performing a hypothesis test to compare two or more population proportions, the
null hypothesis is always that not all population proportions are equal.
With randomized block ANOVA, the size of each sample needs to be the same.

One-way ANOVA partitions the total sum of squares into the sum of squares between
and the sum of squares block.
Discrete data can have an infinite number of values within a specific interval.
Using the multiple regression equation to predict the dependent variable using values of
independent variables outside of the range of the original sample can lead to unreliable
results.

Choose a pie chart rather than a bar chart if you want to highlight the actual data values
and when the classes combined don’t form a whole.
When substituting the sample standard deviationfor the population standard deviation,
we can no longer rely on the normal distribution to provide the critical z-score for the
confidence interval.
A negative sample covariance indicates that as one variable increases in value, the
second variable tends to decrease.
The higher the standard error of the mean, the less variation you will notice from one
sample mean to the next as they are drawn from the population.

The mean of a discrete probability distribution needs to equal one of the values of the
random variables.
We construct decision trees in a left-to-right direction and then evaluate the various
branches in a right-to-left direction.
When performing a hypothesis test for the presence of positive autocorrelation, the null
hypothesis states that positive autocorrelation is not present in the time series.

The mean of a data set is also known as the average value.
Mathematically, it is impossible for P(A and B) > P(A).
If the test statistic for the Wilcoxon signed-rank test is greater than the critical value for
the Wilcoxon signed-rank test, the null hypothesis is rejected.
The sampling error for a census equals zero.

The degrees of freedom for the sum of squares block for randomized block ANOVA
equal the number of blocks.
The total sum of squares can never be negative.
According to the Central Limit Theorem, if a distribution follows a bell-shaped,
symmetrical curve centered around the mean, approximately 68, 95, and 99.7 percent of
its values will fall within one, two, and three standard deviations above and below the
mean respectively.

Hypothesis testing relies on proof by contradiction where we assume that the alternative
hypothesis is true and attempt to disprove it by finding evidence to the contrary.
The mathematical expression that describes the shape of normal curves is known as the
normal probability density function.
The mean and standard deviation for discrete probability distributions are useful when
comparing two different distributions.
In a binomial experiment, the number of successes can never exceed the number of
trials.

When we reject the null hypothesis for a chi-square test of independence, we are
concluding that there is no relationship between the two variables.
The probability that a continuous random variable equals a specific value is always
equal to 1.0.
Two-way ANOVA incorporates a blocking factor to account for variation outside of the
main factor in the hopes of increasing the likelihood of detecting a variation due to the
main factor.

If the test statistic for the Wilcoxon rank-sum test is between the upper and lower
critical values, the null hypothesis is rejected.
The widest confidence interval for an average value of y based on a value of x will
occur at the average value for x.
For randomized block ANOVA, we partition the total sum of squares (SST) into the sum
of squares between (SSB) and the sum of squares block (SSBL).
For continuous distributions, the probability that x is less than or equal to a value is the
same as the probability that x is less than that value.

Jeff sells the New York Times Sunday newspaper at a city corner near several churches.
He sells each newspaper for $6.50 after purchasing them for $4.00. Any unsold
newspaper can be returned to the New York Times for a $0.75 credit. Jeff expects
demand on Sunday to be 75, 100, 125, or 150 newspapers and would like to order one
of these four quantities from the New York Times. If Jeff orders 100 papers from the
New York Times and the Sunday demand is for 150 papers, profit will be _________.
A) “$56.00
B) $87.50
C) $250.00
D) $312.50
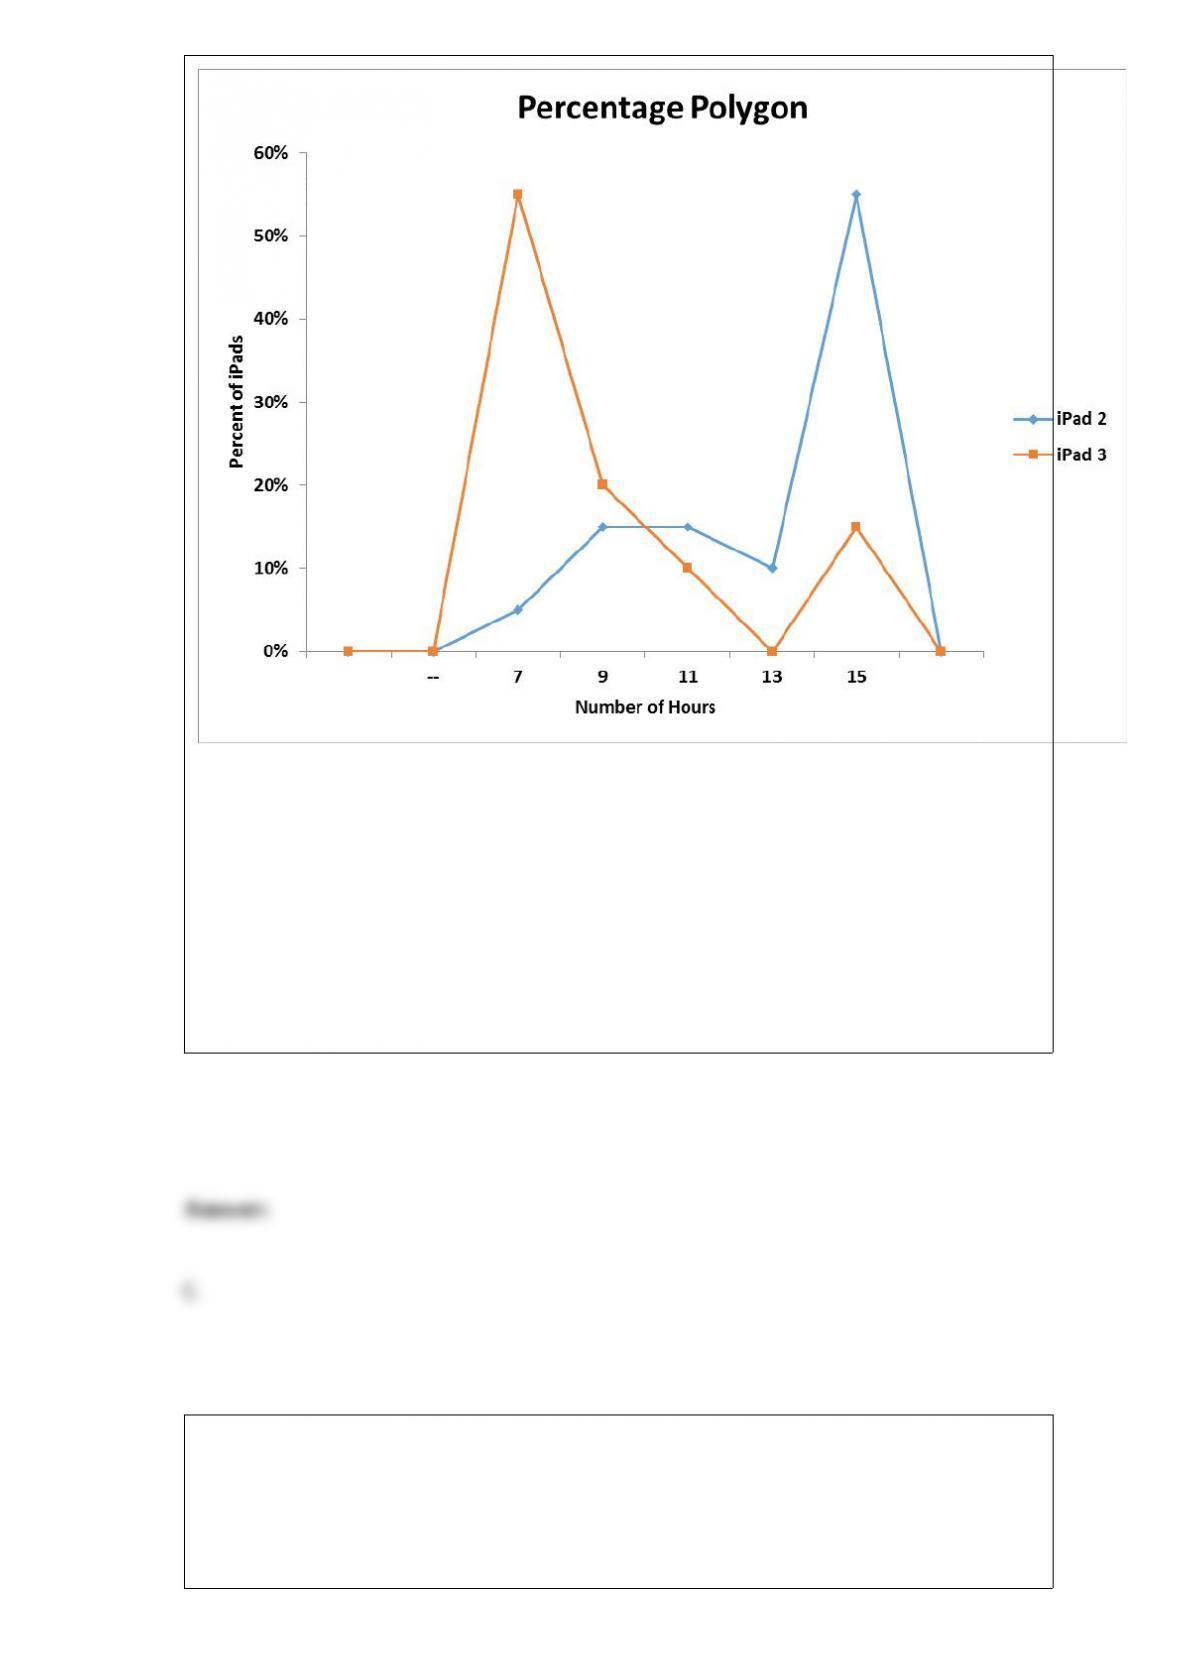
The following graph is a percent polygon showing the battery life, in hours, for a
sample of iPad 2s and iPad 3s. The diamond markers represent the iPad 2 battery life
while the square markers represent the iPad 3 battery life. Based on this graph, which of
the following statements is true?
A) The battery life of the iPad 3 tends to be longer than the battery life of the iPad 2.
B) The battery life of the iPad 3 tends to be about the same as the battery life of the iPad
2.
C) The battery life of the iPad 2 tends to be longer than the battery life of the iPad 3.
D) The difference in battery life between the iPad 2 and iPad 3 cannot be detected with
this graph.
Sara is a regional manager for a restaurant chain that has locations in the towns of
Florence, Camden, and Columbia. A random sample of customers at all three locations
were asked to rate their satisfaction level on a scale of 1 to 20. A two-way ANOVA
procedure was performed on this data using α = 0.05 with Factor A representing each
location and Factor B representing the customer ‘s gender. The results are summarized
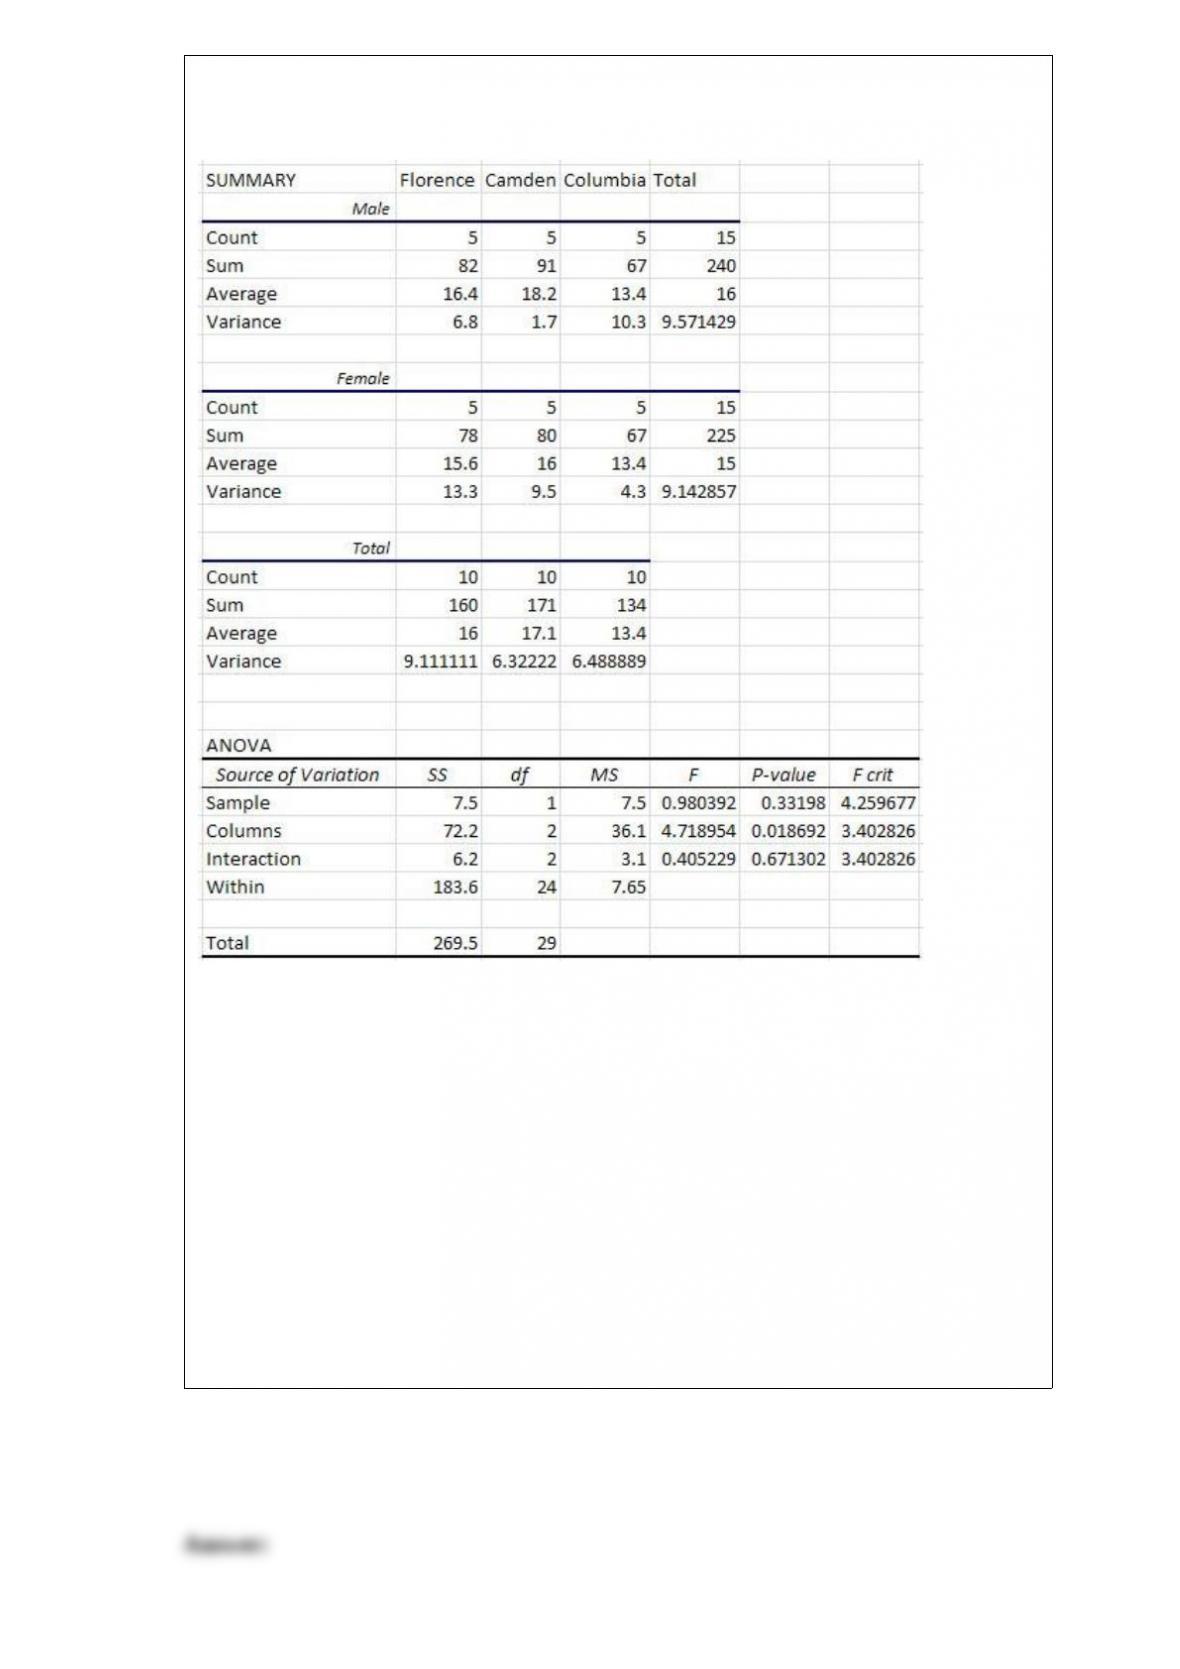
below in the ANOVA table.
The conclusion for the Tukey-Kramer multiple comparisons test using α = 0.05 is that
________.
A) Florence and Camden is the only pair of average satisfaction scores that are different
B) Florence and Columbia is the only pair of average satisfaction scores that are
different
C) Columbia and Camden is the only pair of average satisfaction scores that are
different
D) Florence and Columbia have average satisfaction scores that are different. Camden
and Columbia also have average satisfaction scores that are different
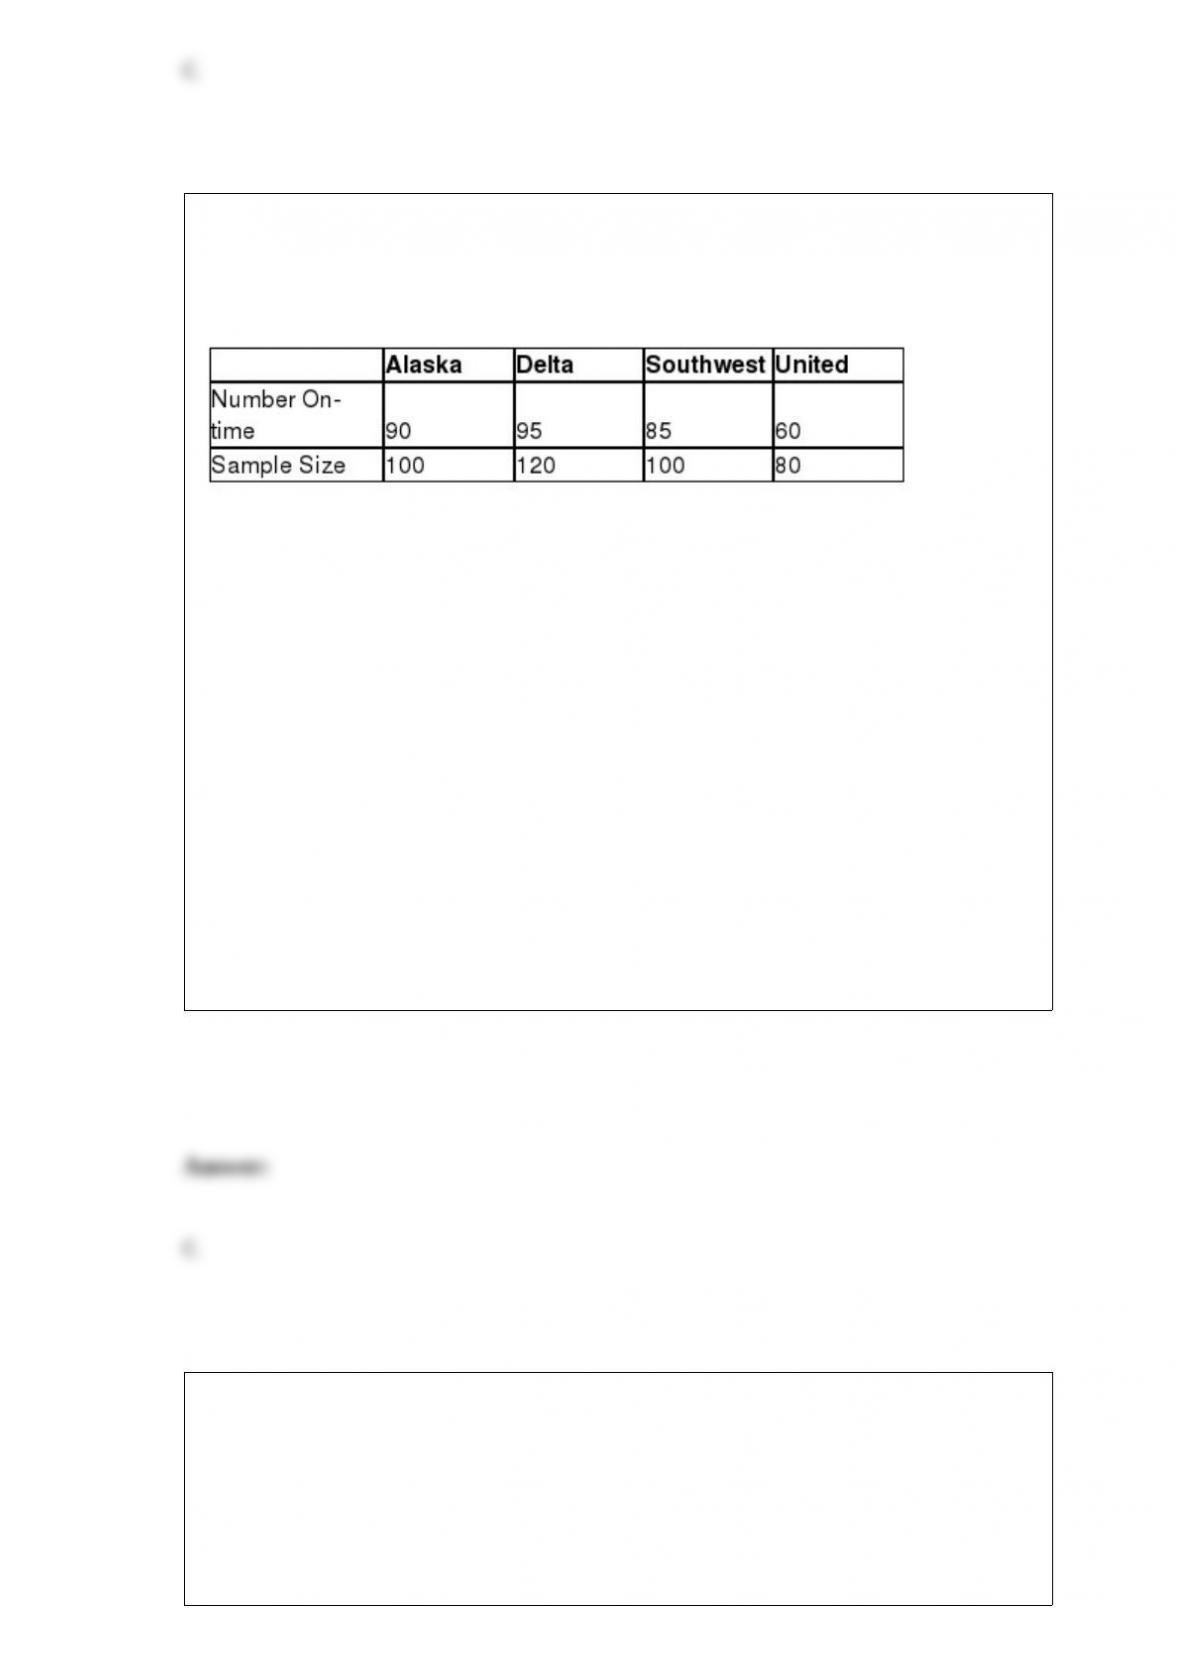
The Department of Transportation would like to investigate if a difference exists in the
proportion of flights that arrive on-time between Alaska Airlines, Delta Airlines,
Southwest Airlines, and United Airlines. The following data represent the number of
on-time flights from random samples taken from each airline.
Using α = 0.05, the conclusion for this chi-square test would be that because the test
statistic is
______________________________________________________________________.
A) more than the critical value, we cannot reject the null hypothesis and conclude that
there is a difference in proportion of on-time flights between these four airlines
B) less than the critical value, we can reject the null hypothesis and conclude that there
is no difference in proportion of on-time flights between these four airlines
C) more than the critical value, we can reject the null hypothesis and conclude that
there is a difference in proportion of on-time flights between these four airlines
D) less than the critical value, we reject the null hypothesis and cannot conclude that
there is a difference in proportion of on-time flights between these four airlines
Steve’s average golf score at his local course is 92.9 from a random sample of 60 rounds
of golf. Assume that the population standard deviation for his golf score is 4.2. The 99%
confidence interval around this sample mean is ________.
A) (87.6, 98.2)
B) (90.7, 95.1)
C) (89.5, 96.3)
D) (92.4, 94.2)
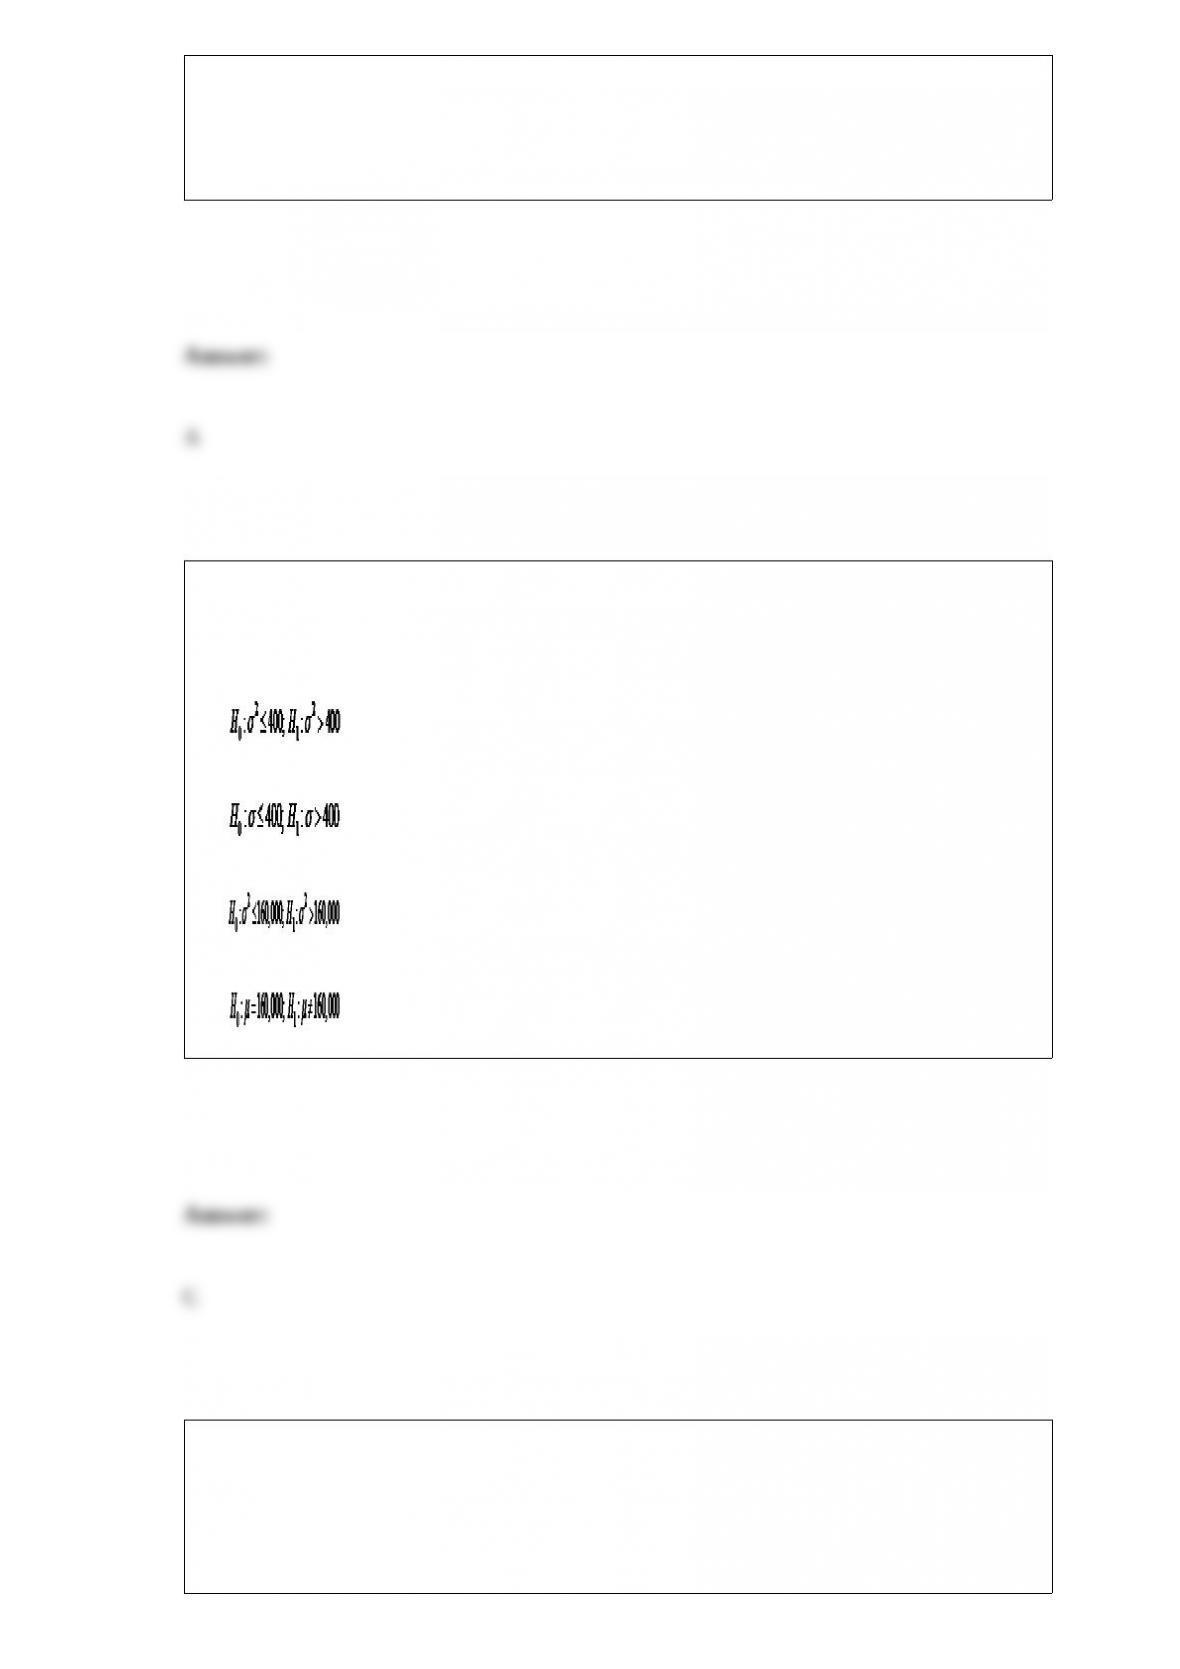
Medicare would like to test the hypothesis that the standard deviation for the monthly
rate for a one-bedroom assisted-living facility is more than $400. The correct
hypothesis statement would be ________.
A)
B)
C)
D)
The Centers for Disease Control (CDC) would like to test the hypothesis that the
proportion of obese adults in the U.S. has increased this year when compared to last
year. A random sample of 125 adults this year found that 56 were obese. Last year, a
random sample of 140 adults found that 42 were obese. If Population 1 is defined as
this year and Population 2 is defined as last year, the correct hypothesis statement for

this hypothesis test would be
A) .
B) .
C) .
D) .
________ is the procedure of choice when we have no information about the
probability for each state of nature in the field of decision analysis.
A) Decision making under probability
B) Decision making under risk
C) Decision making under certainty
D) Decision making under uncertainty
The table below shows the number of cars sold last month by seven employees at

Concord Motors and their number of years of sales experience.
Management would like to use simple regression analysis to estimate monthly car sales
using the number of years of sales experience. The sum of squares regression for this
sample is ________.
A) 9.72
B) 13.33
C) 16.48
D) 26.94
Suppose the round-trip airfare between Philadelphia and Los Angeles a month before
the departure date follows the normal probability distribution with a mean of $387.20
and a standard deviation of $68.50. What is the probability that a randomly selected
airfare between these two cities will be less than $300?
A) 0.1020
B) 0.2005
C) 0.3192
D) 0.4286
With two-way ANOVA, the total sum of squares is partitioned into the sum of squares
for
_______________________________.
A) Factor A, Factor B, block, and error
B) Factor A, Factor B, within, and error
C) Factor A, Factor B, interaction, and error
D) Factor A, Factor B, interaction, and between
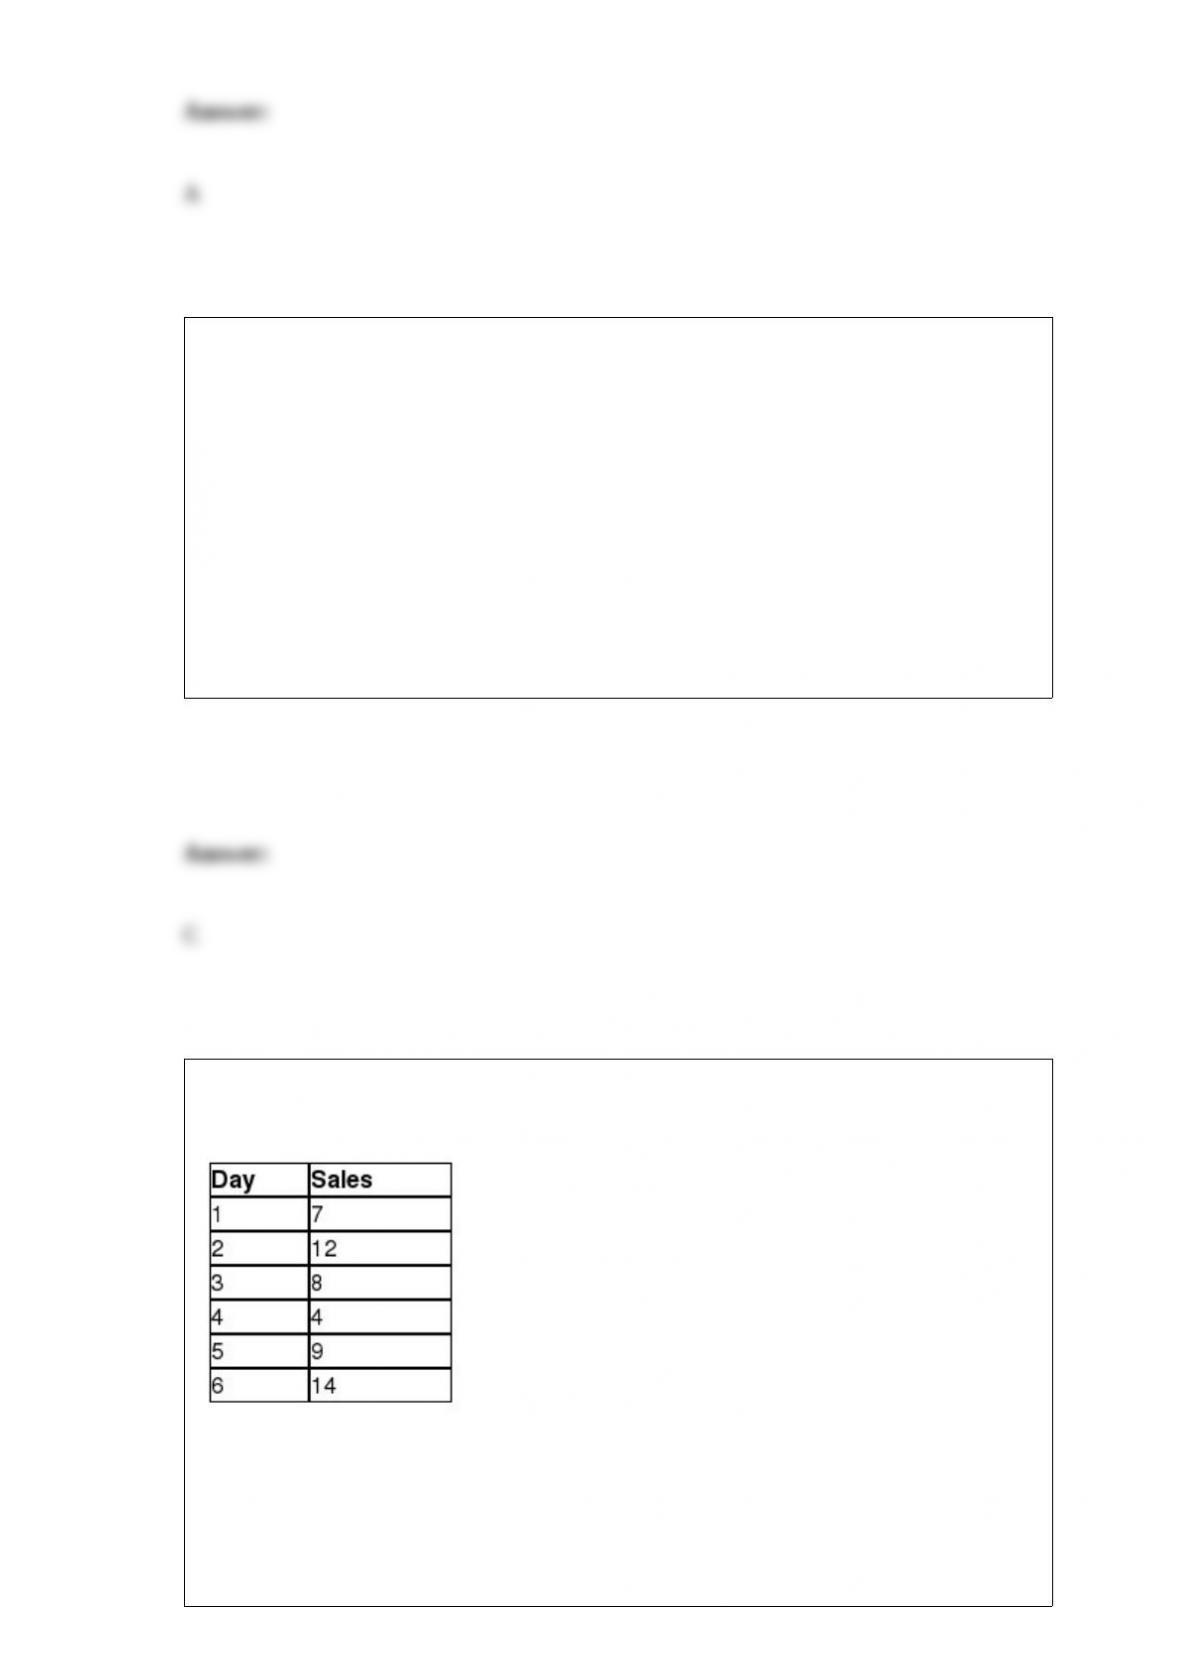
The following data represent the number of sweatshirts sold for each of the past six
days for Hoys Department Store at the beach in Avalon, New Jersey.
Using a three-period simple moving average, the forecasting error for Day 6 is
________.
A) 2.8
B) -4.4
C) -1.0
D) 7.0
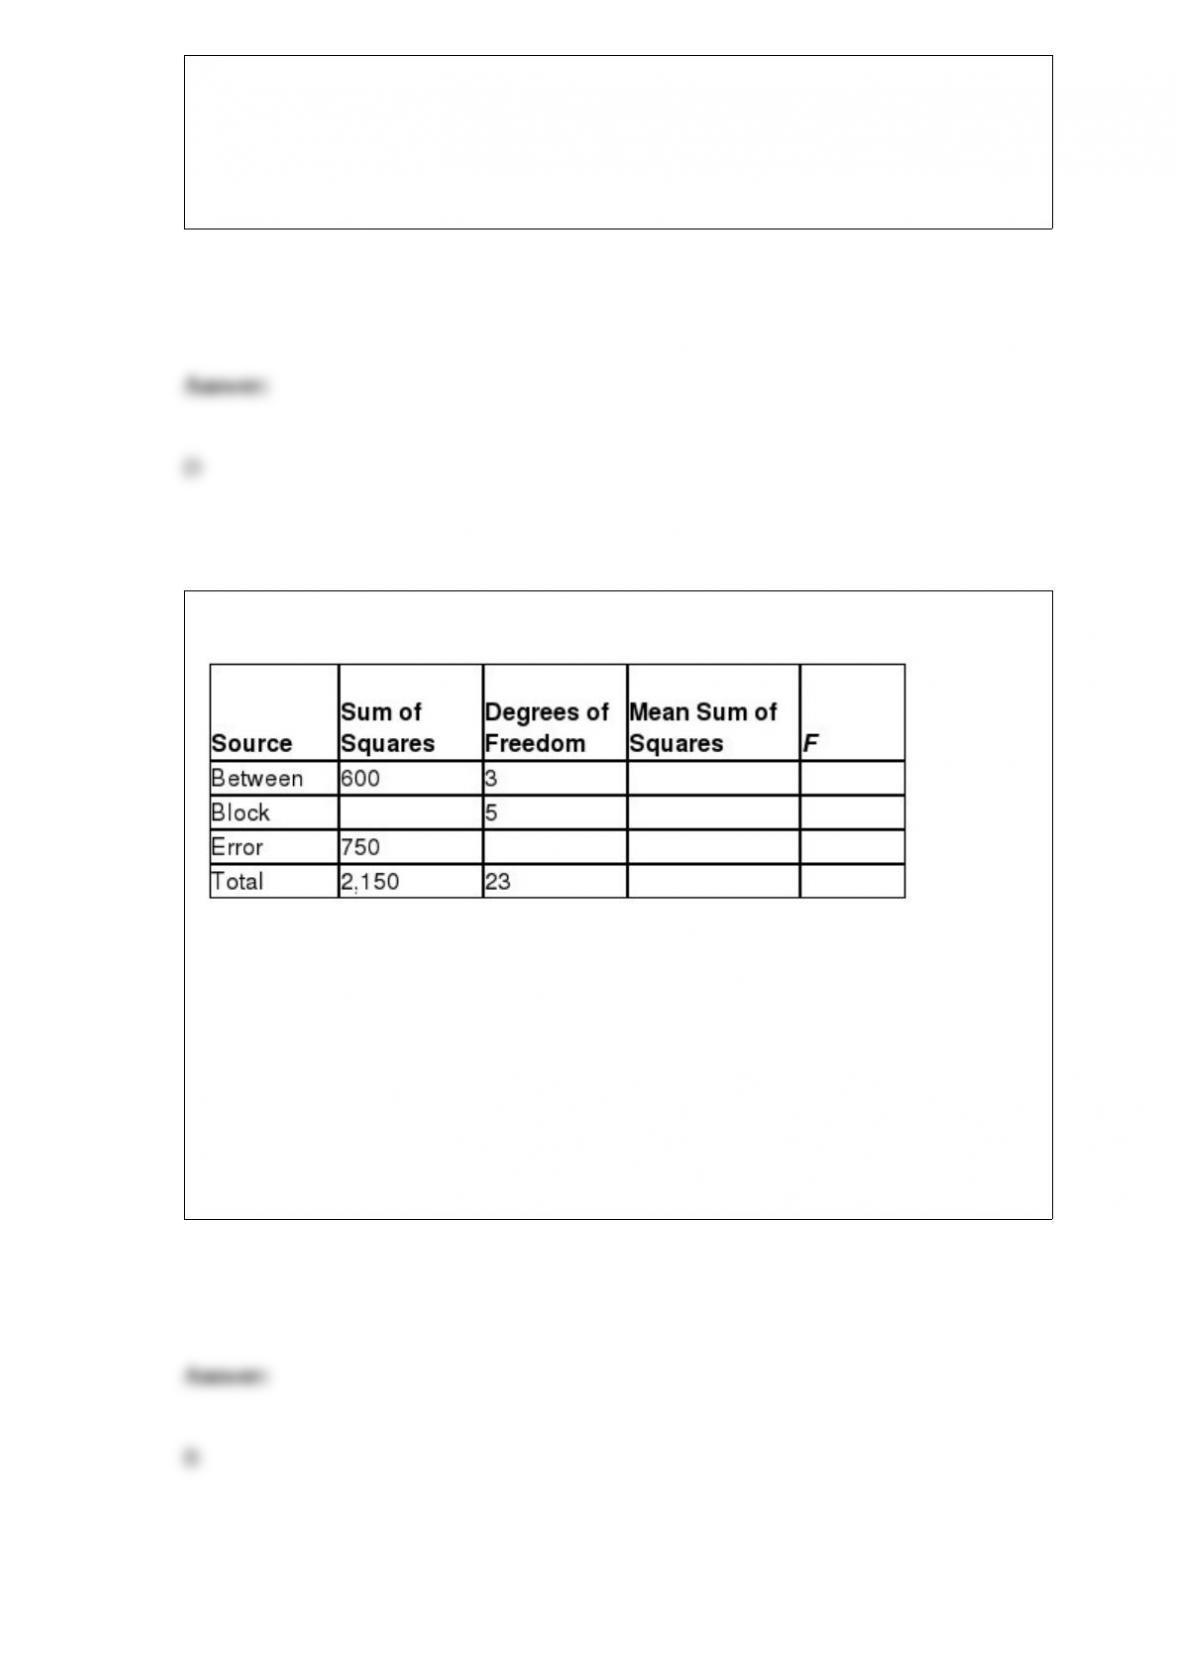
Consider the partially completed randomized block ANOVA summary table.
The main factor F-test statistic for this ANOVA procedure is ________.
A) 3.20
B) 4.00
C) 5.16
D) 6.70

Edmunds.com would like to test the hypothesis that the standard deviation for the age
of an imported car on the road is greater than the standard deviation for the age of a
domestic car. The following data shows the ages of a random sample of import and
domestic cars.
The test statistic for this hypothesis test would be ________.
A) 5.23
B) 6.75
C) 9.41
D) 10.56
A textbook sales representative is responsible for 25 schools and needs to choose three
of these schools to work with today. The number of different ways he can schedule a
time to call these schools is ________.
A) 2,300
B) 13,800
C) 15,625
D) 26,369
The Western Athletic Conference (WAC) consists of eight NCAA teams that compete in
a variety of sports. The number of different ways these eight teams can finish in the
conference standings at the end of the basketball season is ________.
A) 40,320
B) 162,500
C) 362,880
D) 3,628,880
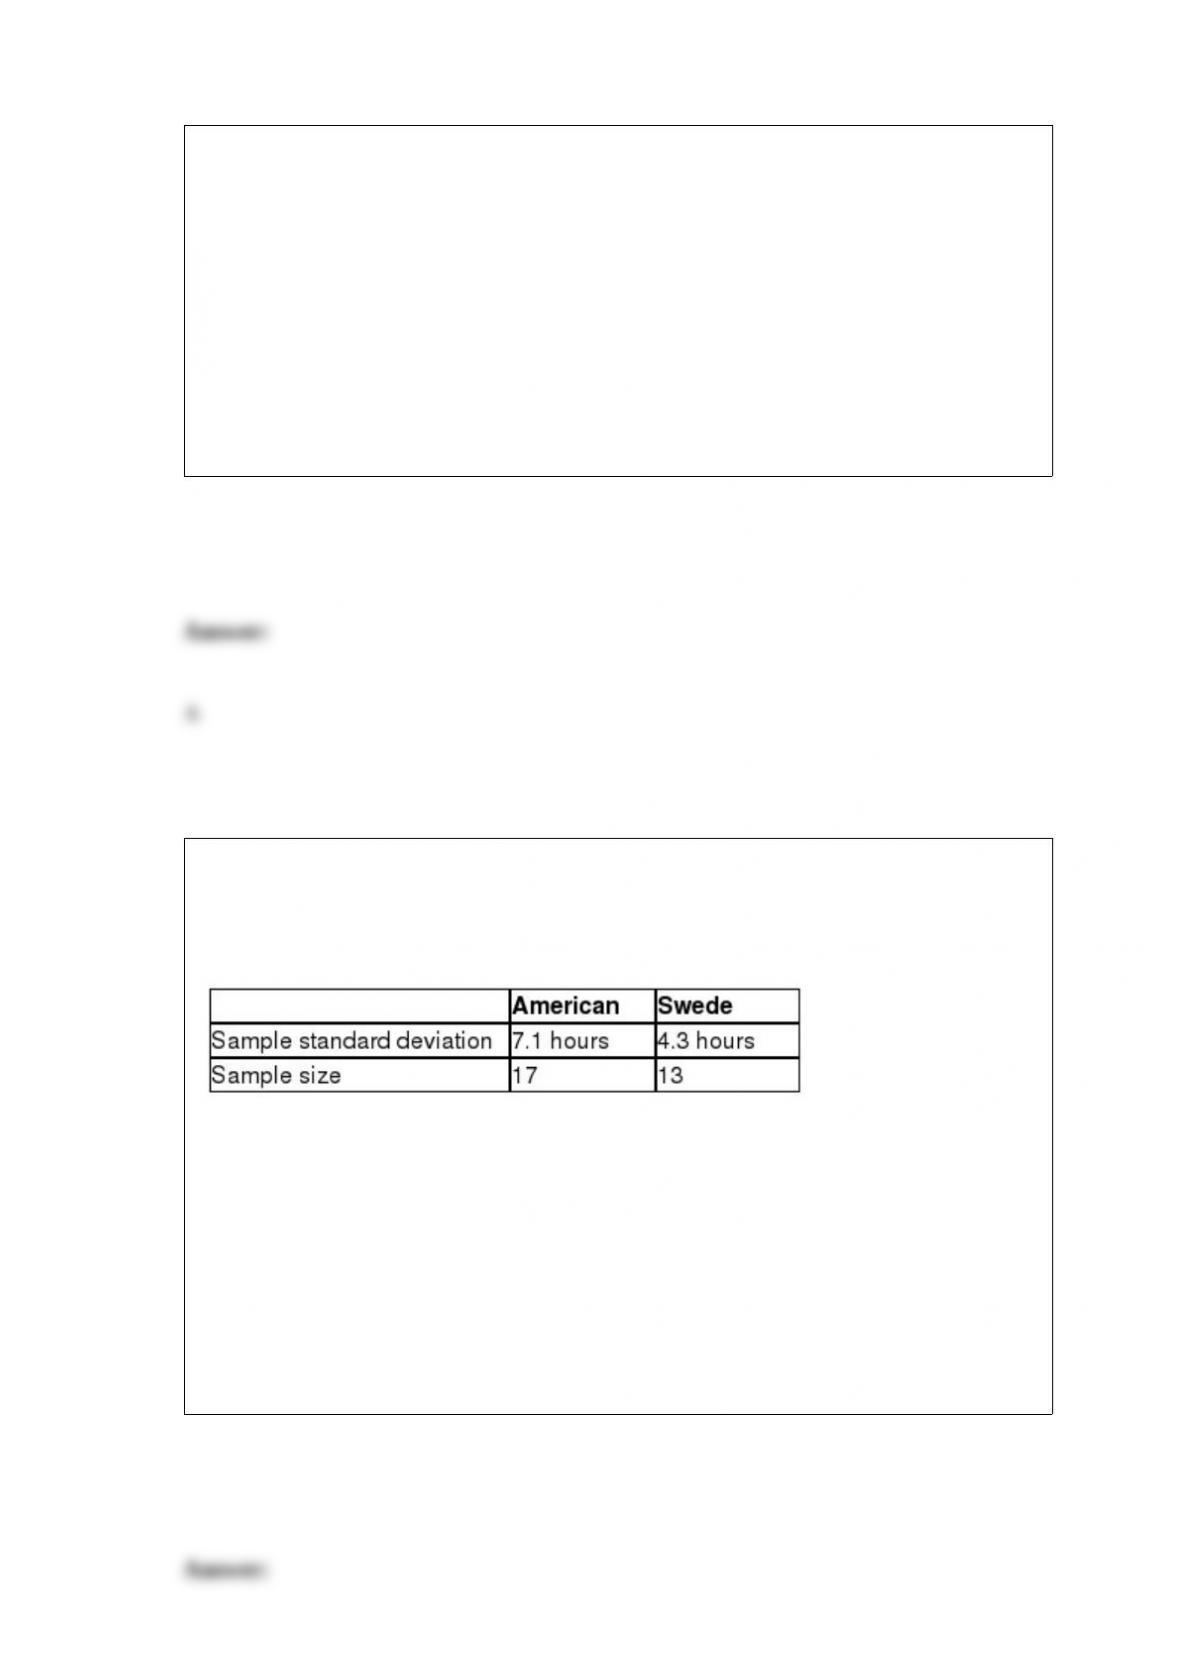
You have been assigned to test the hypothesis that the variability for the number of
hours per week that an American works is equal to the variability for the number of
hours per week that a Swede works. The following data summarizes the sample
statistics for the number of hours worked per week for workers in each country.
The degrees of freedom for the critical value for Population 1 would be ________.
A) 11
B) 12
C) 14
D) 16

According to LIMRA, 77% of husband-wife families with kids under 18 years old have
life insurance. A random sample of six husband-wife families was selected. What is the
probability that exactly four families have life insurance?
A) 0.2789
B) 0.3735
C) 0.4832
D) 0.5215
A survey conducted last year asked employed adults from age 25 to 70 if they plan to
keep a foot in the working world after retirement. Thirty-three percent of the
respondents answered “very likely”. A random sample of 75 adults from this age group
was asked the same question. Using the normal approximation to the binomial
distribution, what is the probability that more than 18 adults from this sample would
very likely plan to keep a foot in the working world after retirement?
A) 0.5557
B) 0.6772
C) 0.8413
D) 0.9370
Costco sells a matching set of T-shirts and shorts. The T-shirt comes in four colors and
six sizes. The shorts come in three colors and five sizes. The number of unique color
and size combinations of T-shirts and shorts is ________.
A) 360
B) 425
C) 500
D) 625
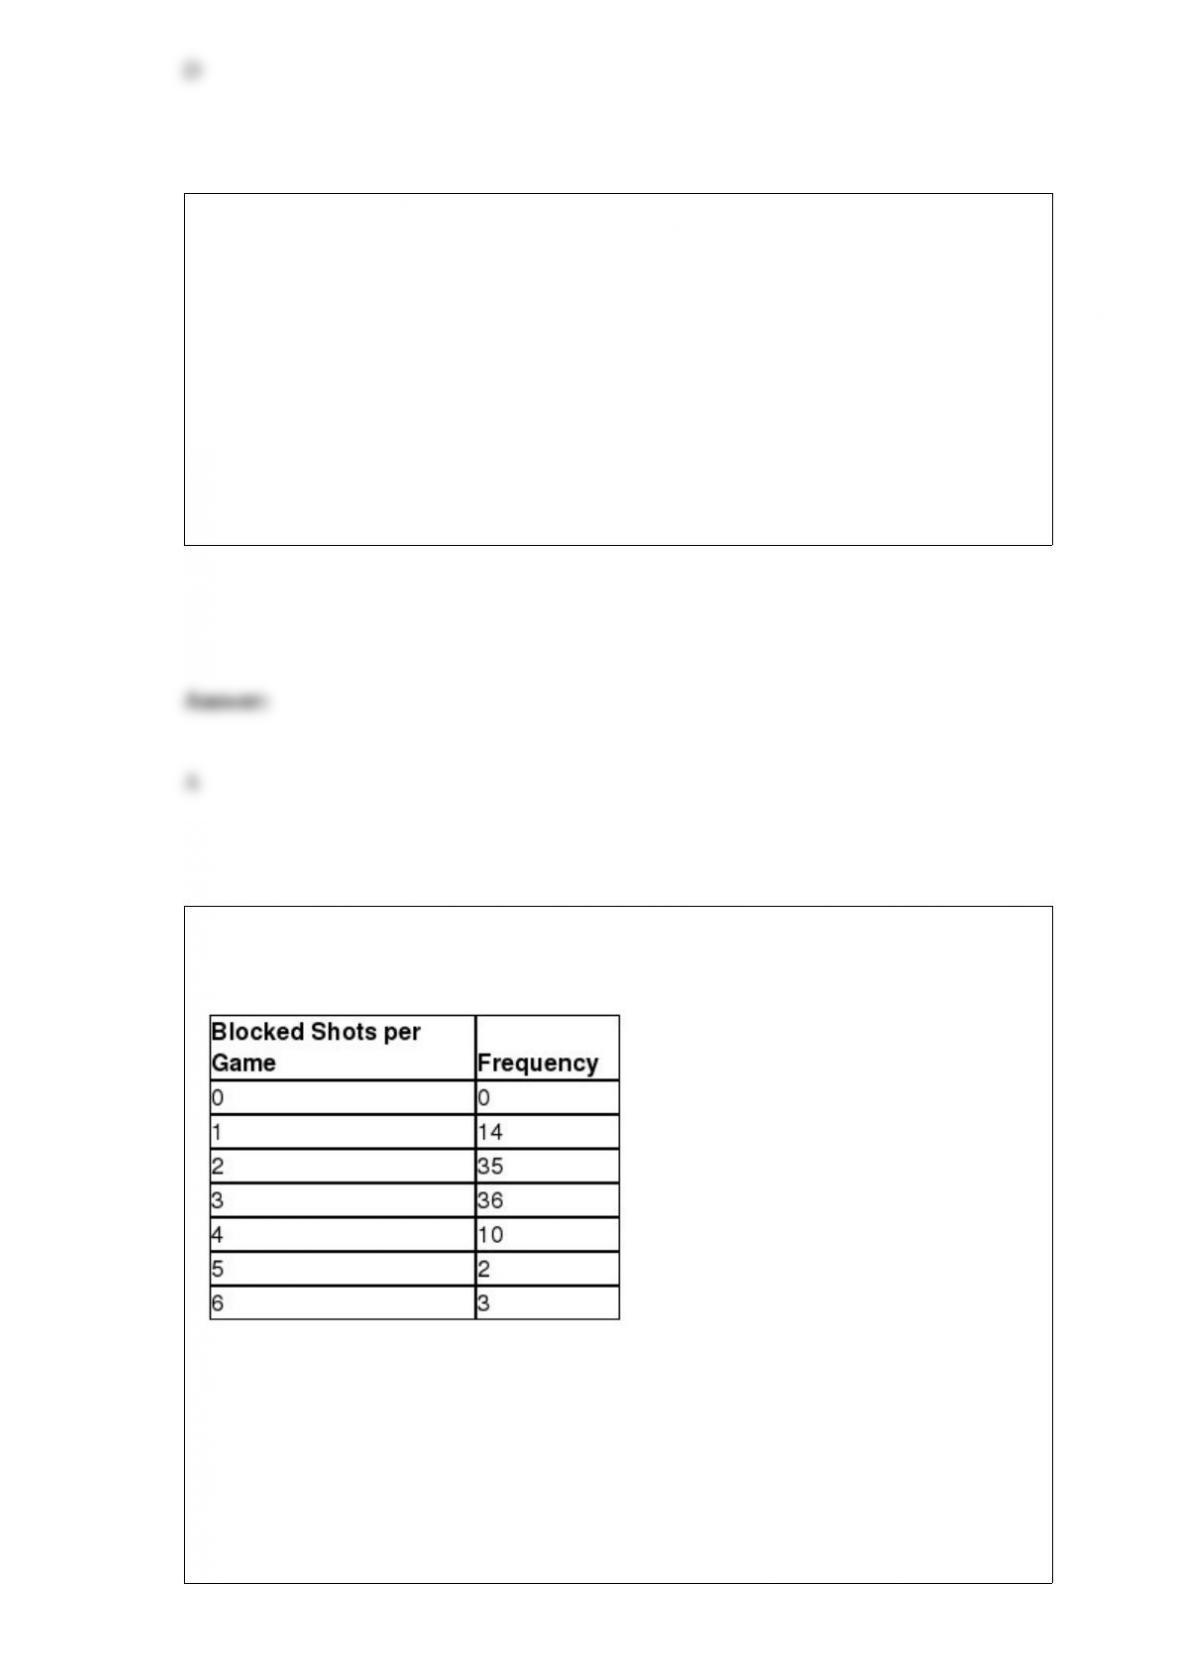
The following distribution shows the frequency distribution of the number of shots a
particular NBA player blocked in one game for a random sample of 100 games.
You have been assigned the task to test if the distribution of blocked shots per game for
this player follows the Poisson distribution using α = 0.05. The critical value for this
hypothesis test is ________.
A) 11.070
B) 12.592
C) 14.067
D) 15.507
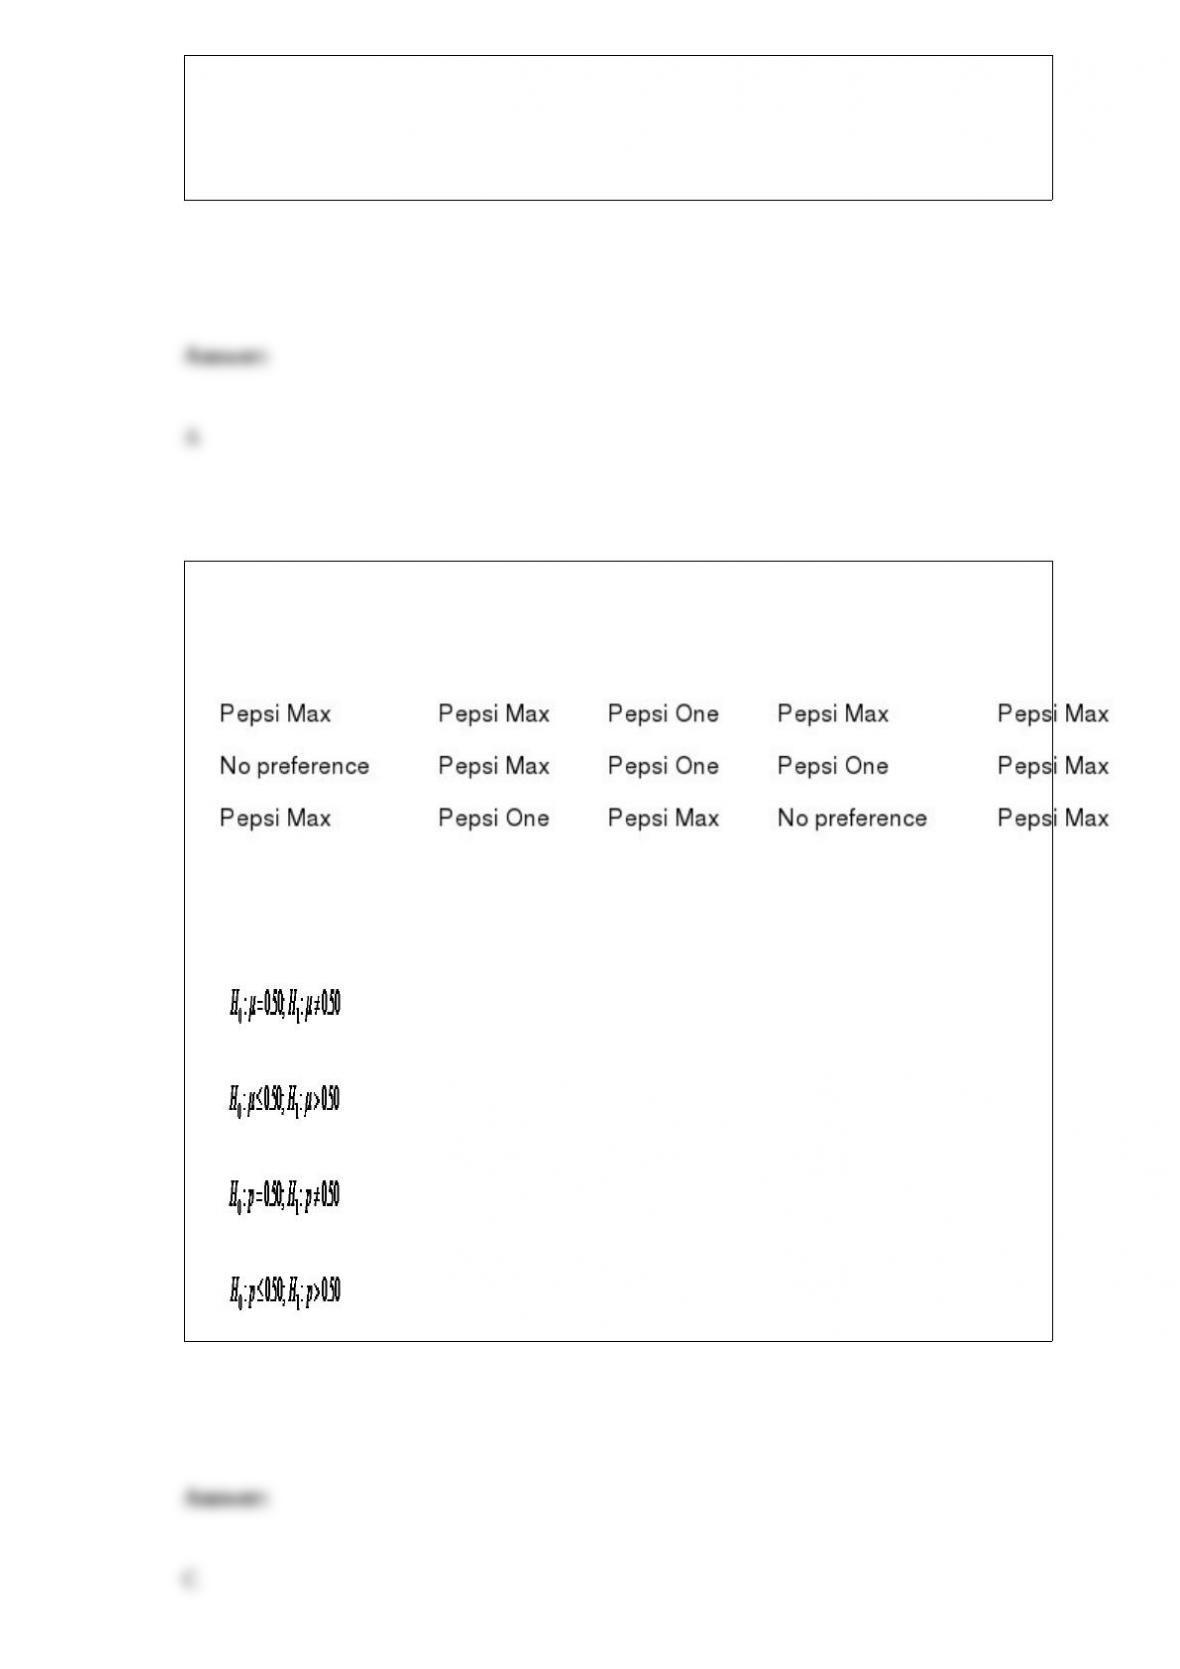
Suppose Pepsi wants to perform a blind taste test to determine if people prefer Pepsi
Max or Pepsi One. The following table shows the preferences of a random sample of
adults.
The correct hypothesis statement for this hypothesis test would be
______________________.
A)
B)
C)
D)

Many hotel chains that offer free Wi-Fi service to their customers have experienced
increasing demand for Internet bandwidth and increasing costs. Marriott International
would like to test the hypothesis that the proportion of customers that are carrying two
Wi-Fi devices exceeds 0.60. A random sample of 120 Marriott customers found that 78
have two Wi-Fi devices. Marriott International would like to set α = 0.01. The critical
value for this hypothesis test would be ________.
A) 1.28
B) 1.645
C) 2.33
D) 1.96
Many franchisers favor owners who operate multiple stores by providing them with
preferential treatment. Suppose the Small Business Administration would like to
perform a hypothesis test to investigate if 80% of franchisees own only one location
using α = 0.05. A random sample of 120 franchisees found that 85 owned only one
store. Which one of the following statements is true?
A) Because the p-value is greater than α, we fail to reject the null hypothesis and
conclude that the proportion of franchisees that own only one store equals 0.80.
B) Because the p-value is greater than α, we fail to reject the null hypothesis and cannot
conclude that the proportion of franchisees that own only one store does not equal 0.80.
C) Because the p-value is less than α, we reject the null hypothesis and conclude that
the proportion of franchisees that own only one store does not equal 0.80.
D) Because the p-value is less than α, we fail to reject the null hypothesis and cannot
conclude that the proportion of franchisees that own only one store does not equal 0.80.

The ________ of Events A and B represent the number of instances in which either
Event A or Event B or both occur together.
A) union
B) addition
C) complement
D) intersection
A ________ sample is used when members of the population are chosen to become part
of the sample simply because they are easily accessible.
A) cluster
B) convenience
C) probability
D) stratified
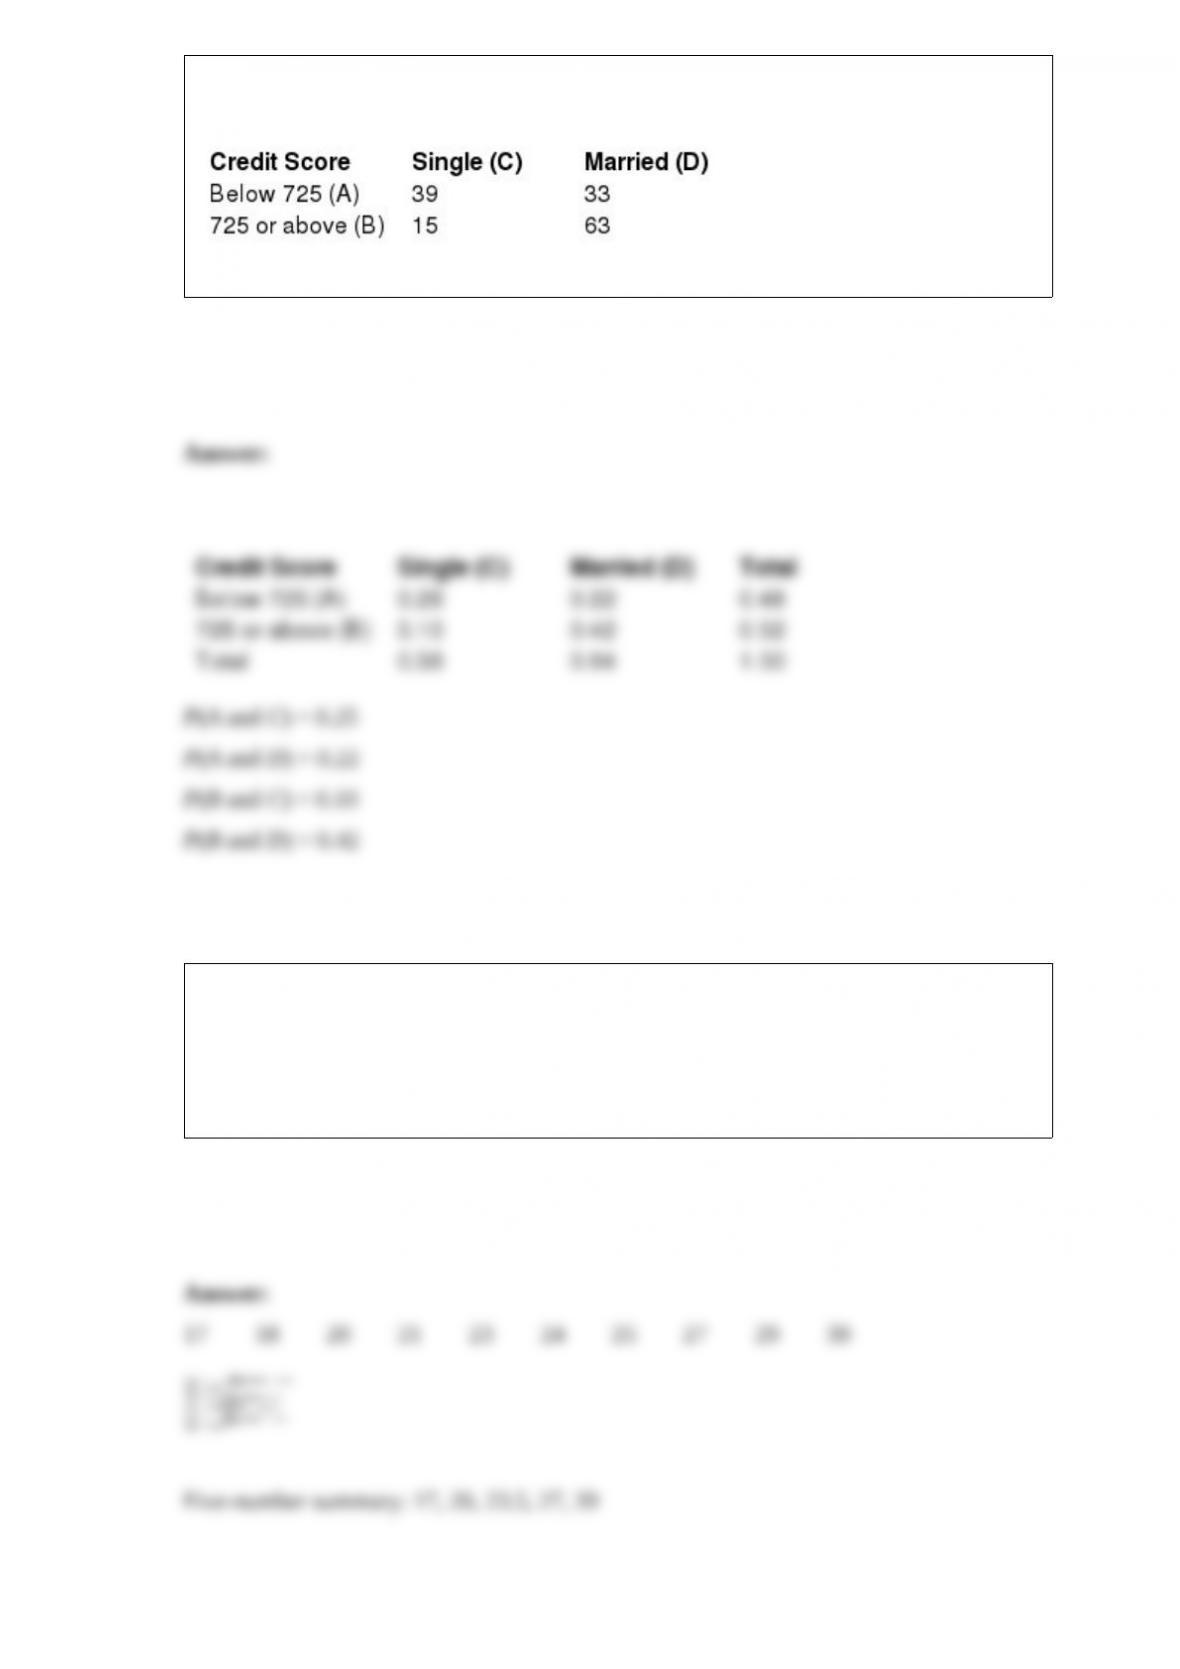
The following contingency table shows the number of adults with credit scores 725 or
above and below 725 as well as their marital status.
Identify the joint probabilities for this table.
The following data represents the amount of time, in minutes, that a random sample of
Parisians spent eating lunch in a particular caf.
25 21 23 24 20 17 29 18 39 27
Determine the five-number summary for this data.
Sony would like to test the hypothesis that the average age of a PlayStation user is
different from the average age of an Xbox user. A random sample of 36 PlayStation
users had an average age of 34.2 years while a random sample of 30 Xbox users had an
average age of 32.7 years. Assume that the population standard deviation for the age of
PlayStation and Xbox users is 3.9 and 4.0 years, respectively. Sony would like to set α
= 0.10. Which one of the following statements is true?
A) Because the 90% confidence interval includes zero, we fail to reject the null
hypothesis and cannot conclude that the average age of PlayStation users is different
from the average age of Xbox users.
B) Because the 90% confidence interval does not include zero, we reject the null
hypothesis and can conclude that the average age of PlayStation users is different from
the average age of Xbox users.
C) Because the 90% confidence interval includes zero, we fail to reject the null
hypothesis and conclude that the average age of PlayStation users is equal to the
average age of Xbox users.
D) Because the 90% confidence interval does not include zero, we fail to reject the null
hypothesis and can conclude that the average age of PlayStation users is different from
the average age of Xbox users.
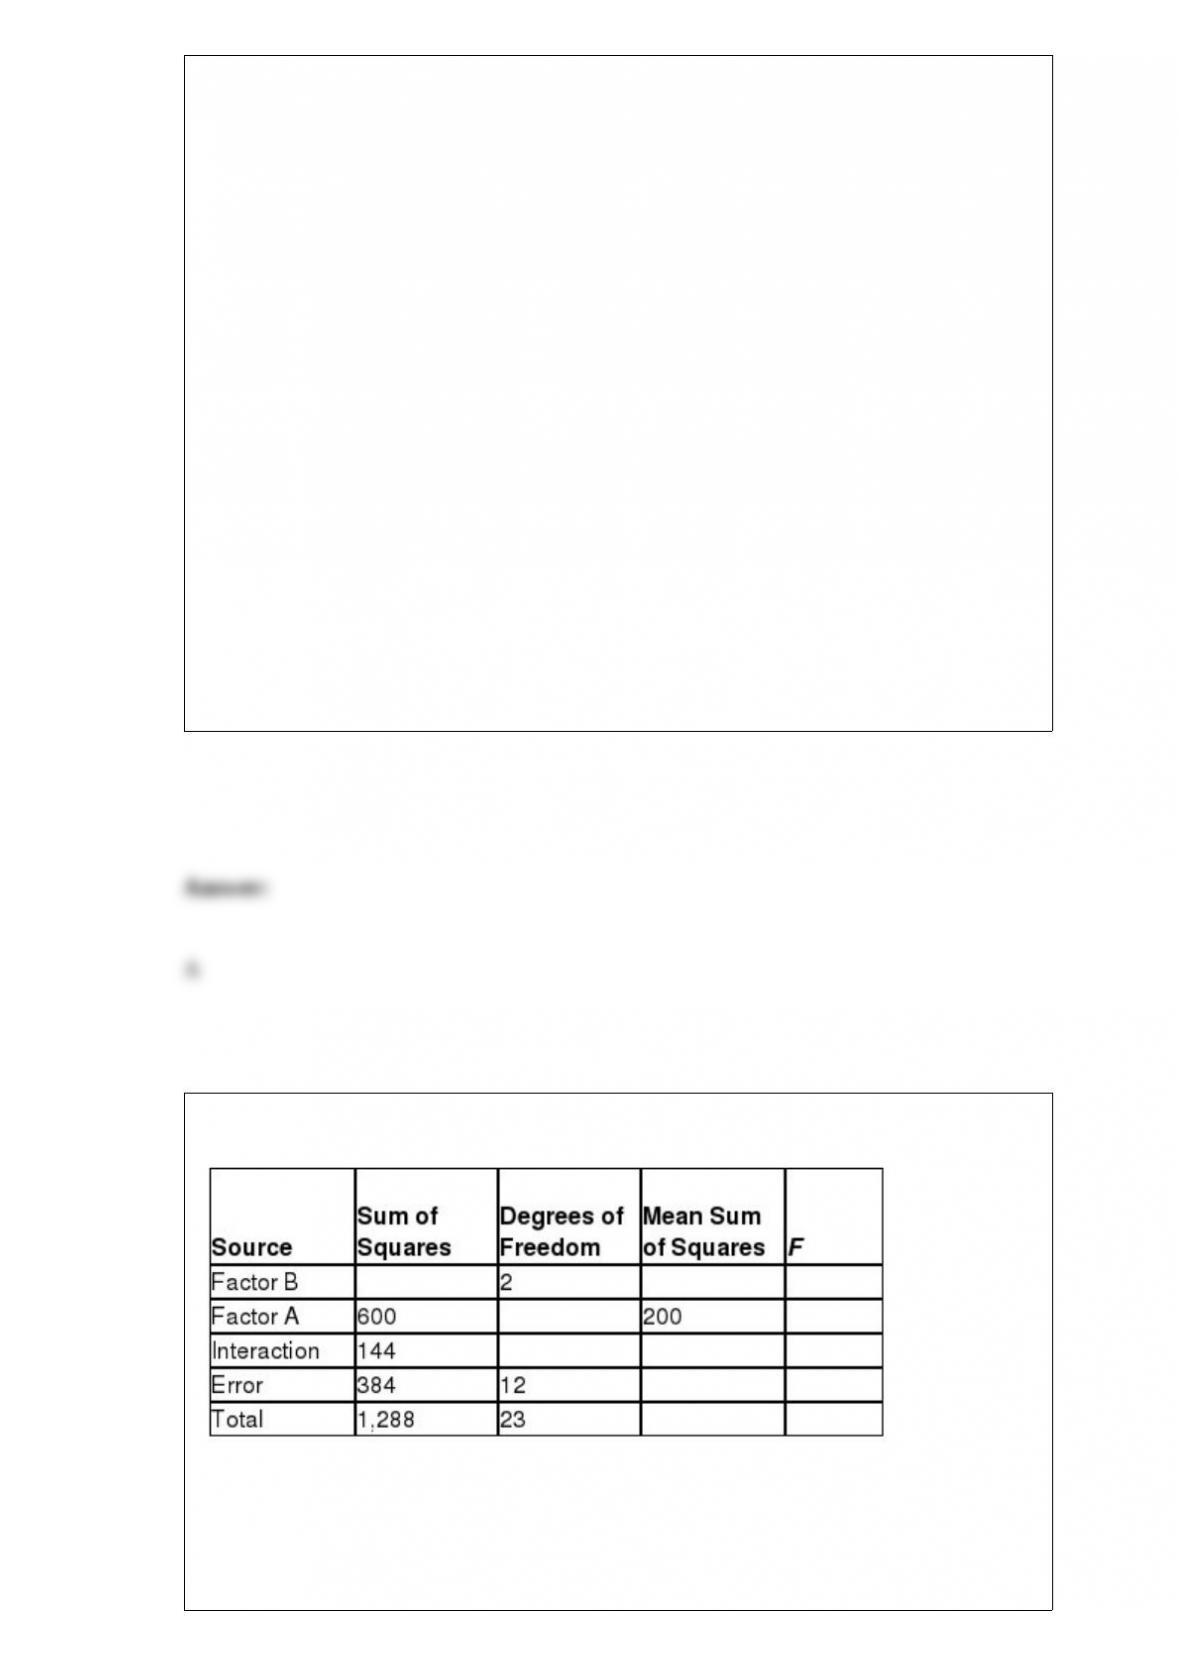
Consider the partially completed two-way ANOVA summary table.
The total number of observations for this ANOVA procedure is _____.
A) 22
B) 23
C) 24
D) 25
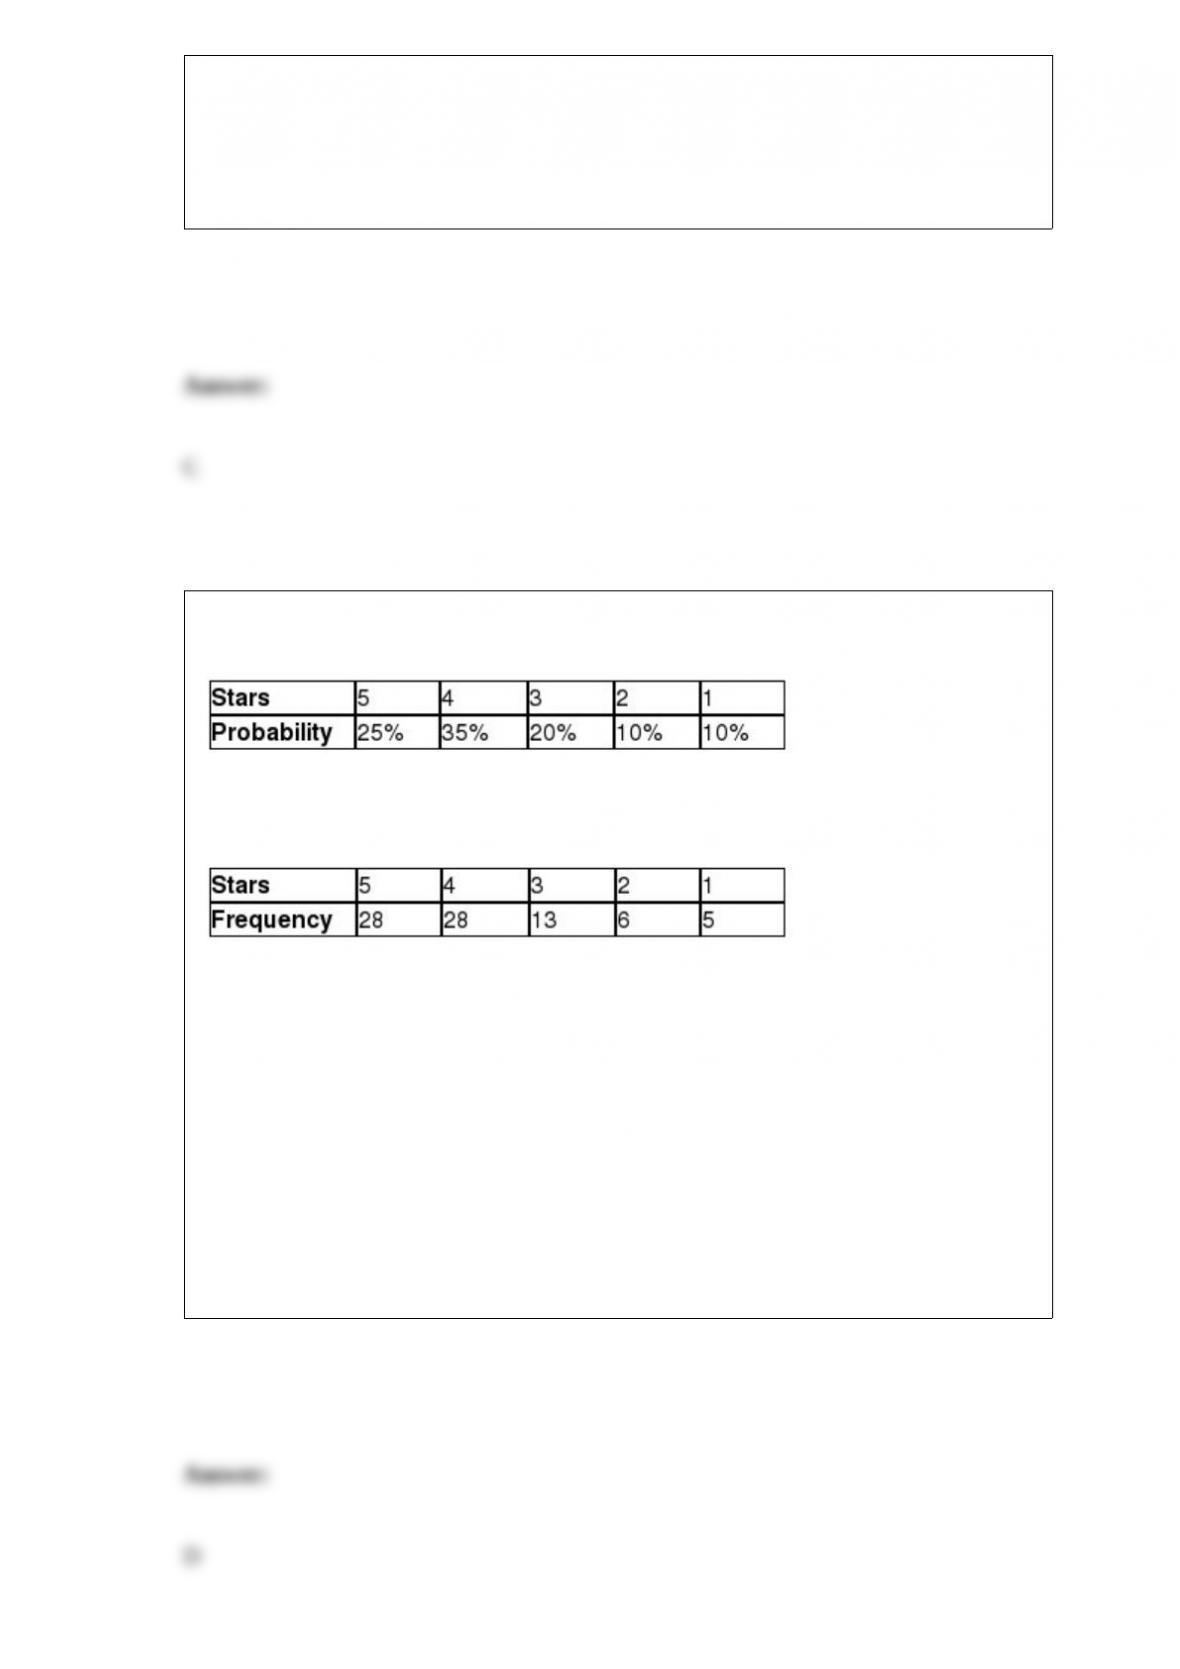
The following data represent the discrete probability distribution for the number of stars
that reviewers gave a first edition statistics reference book.
The second edition of this reference book has been released and a random sample of
people that have purchased the book has been collected with the following results.
The publisher would like to know if the probability distribution for reviews has changed
from the first edition to the second edition using α = 0.025. The critical value for this
hypothesis test is ________.
A) 5.991
B) 7.815
C) 9.448
D) 11.143
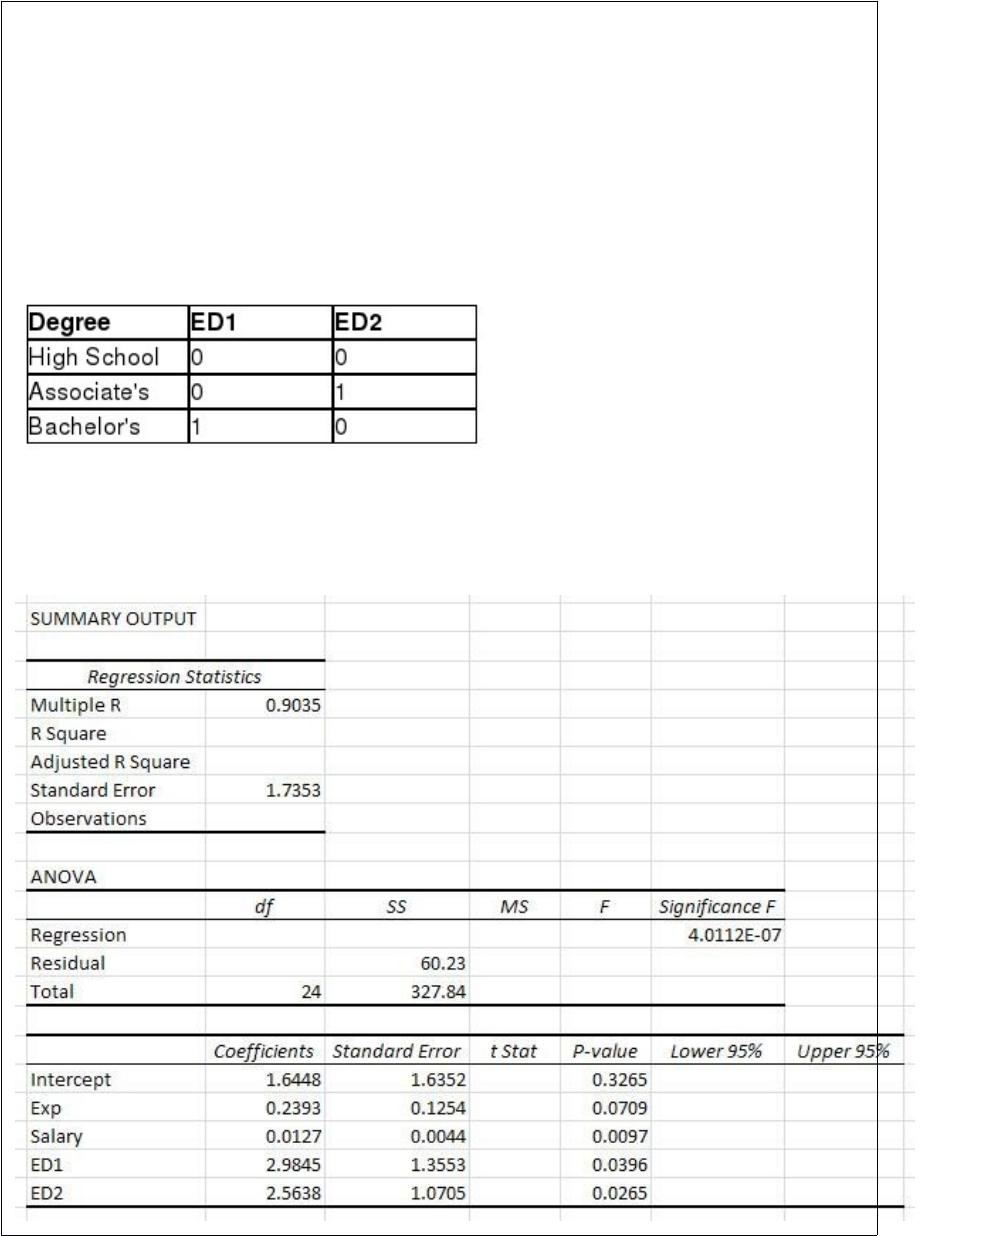
Use the following information to answer the question(s) below.
Ford would like to develop a regression model that would predict the number of cars
sold per month by a dealership employee based on the employee’s number of years of
sales experience (Exp), the employee’s weekly base salary before commissions (Salary),
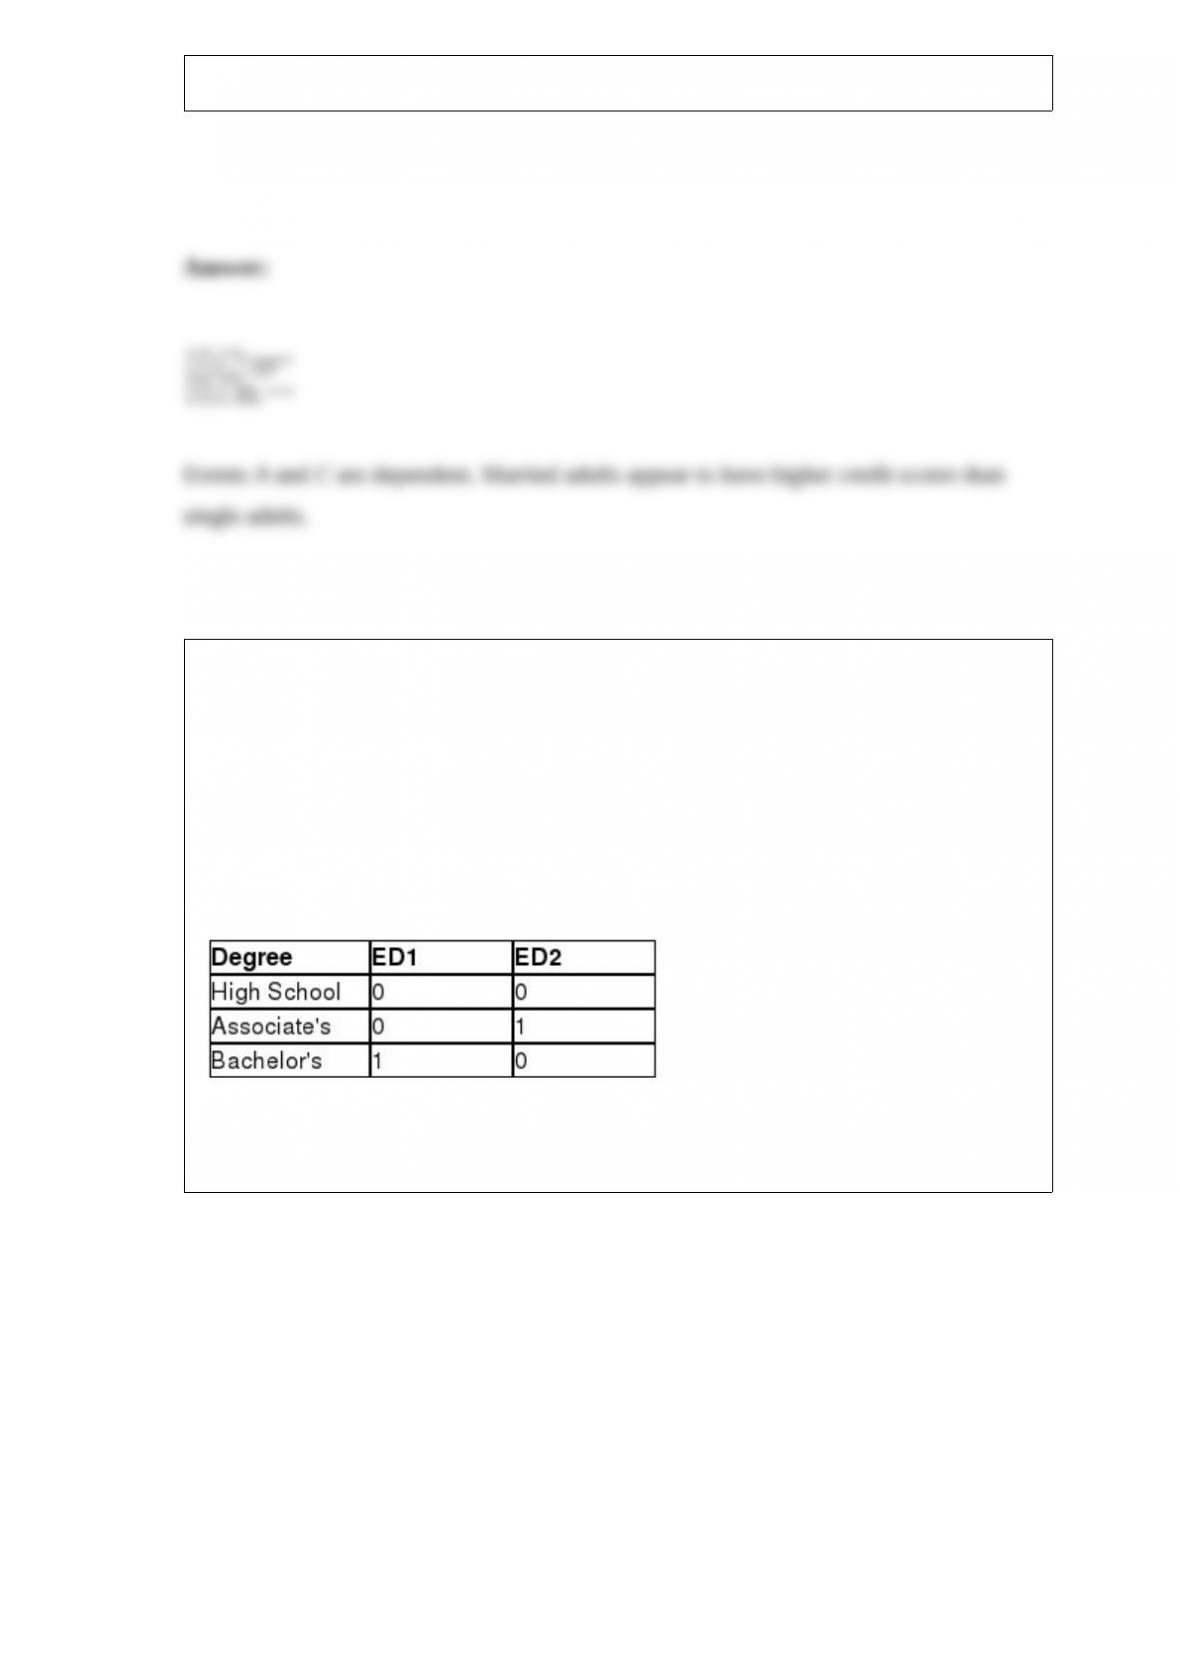
and the education level of the employee. There are three levels of education in the sales
forcehigh school degree, associate’s degree, and bachelor’s degree. The following
dummy variables have been defined.
The following Excel output shows the partially completed regression output from a
random sample of employees from the previous month.
The mean square error for this model is ________.
A) 3.01
B) 60.23
C) 66.90
D) 267.61
The following contingency table shows the number of adults with credit scores above
and below 725 as well as their marital status.
Determine whether Events A and C are independent or dependent. What conclusions
can be made?
Use the following information to answer the question(s) below.
Ford would like to develop a regression model that would predict the number of cars
sold per month by a dealership employee based on the employee’s number of years of
sales experience (Exp), the employee’s weekly base salary before commissions (Salary),
and the education level of the employee. There are three levels of education in the sales
forcehigh school degree, associate’s degree, and bachelor’s degree. The following
dummy variables have been defined.
The following Excel output shows the partially completed regression output from a
random sample of employees from the previous month.
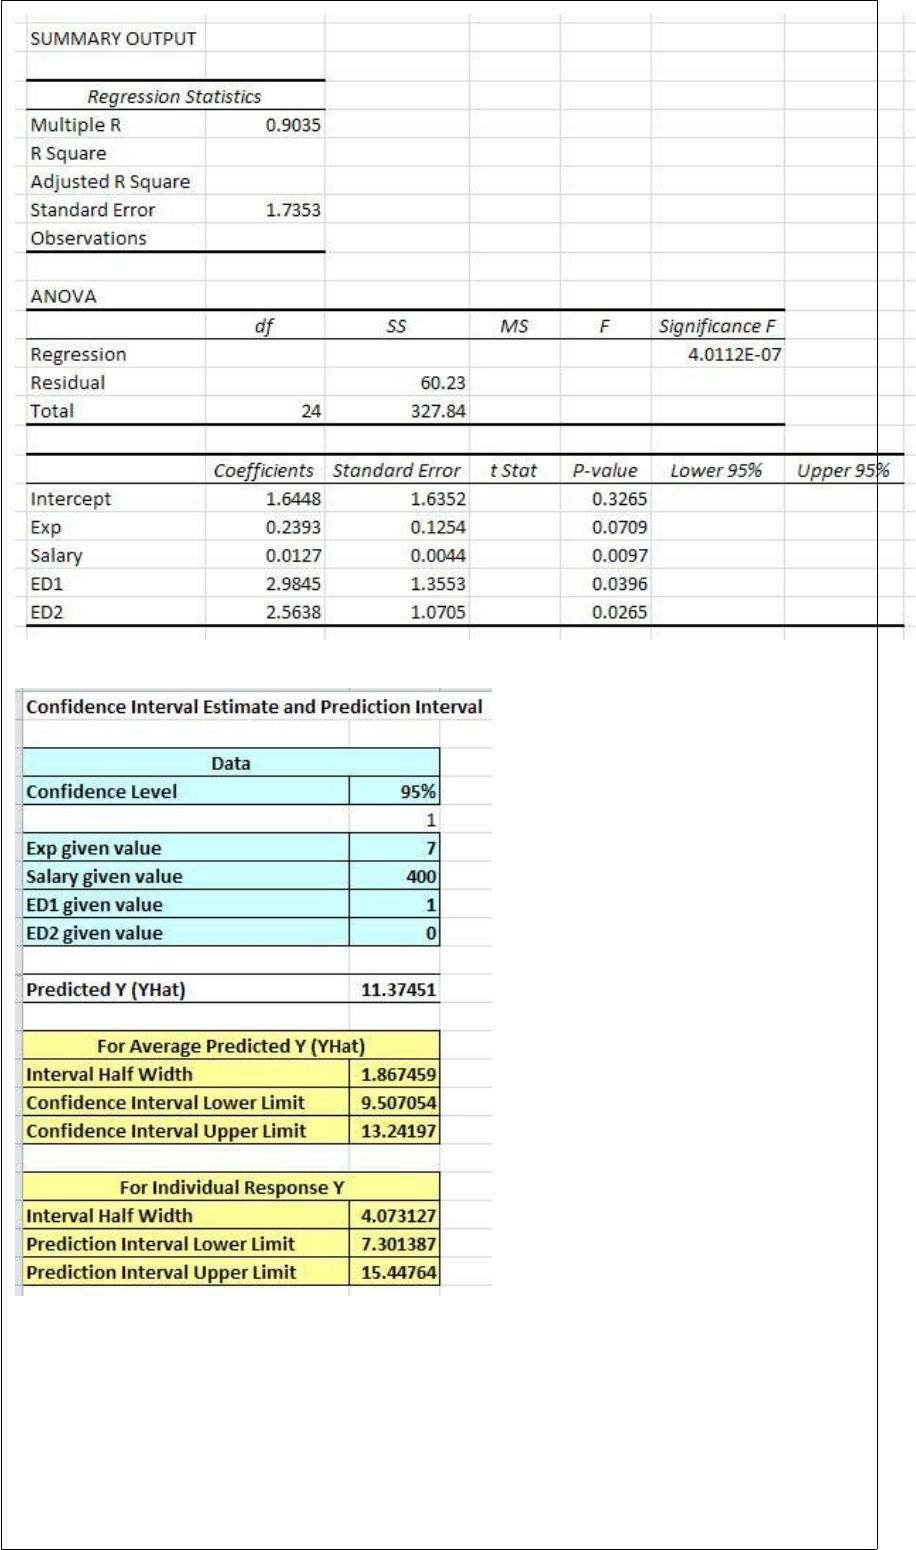
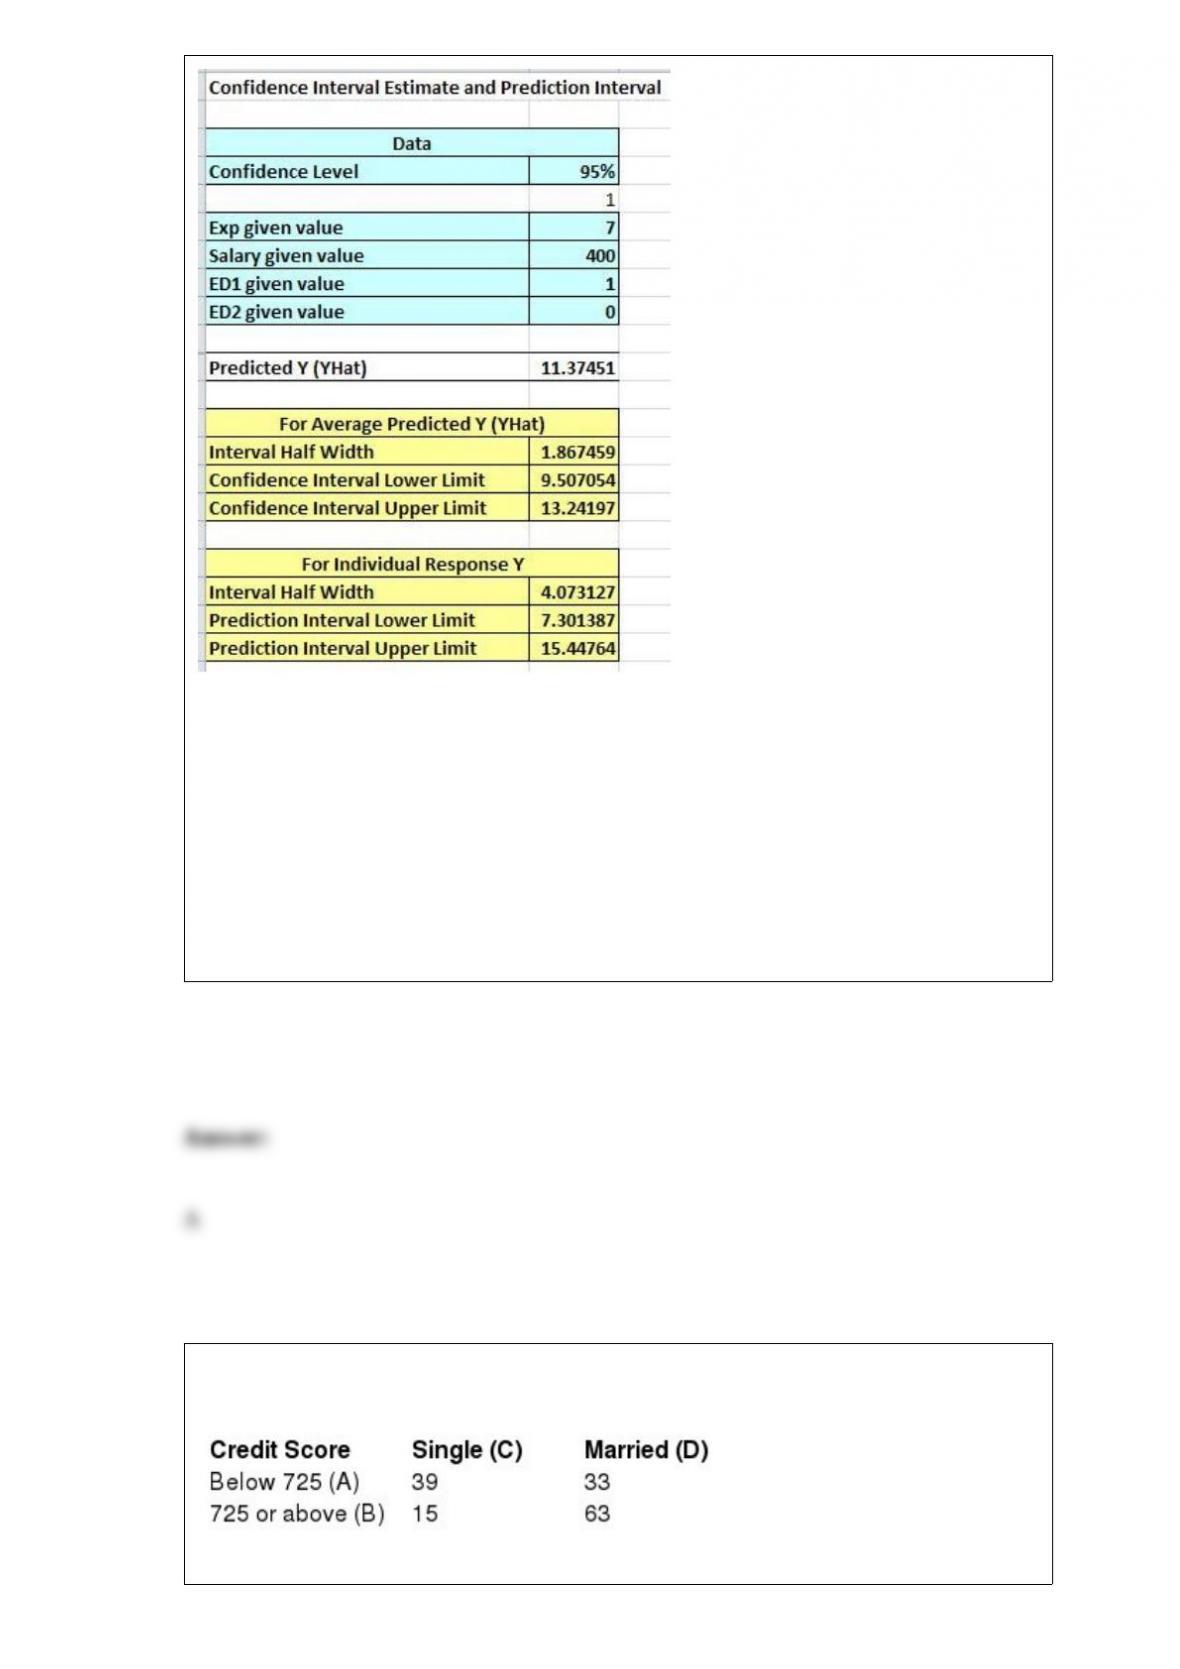
The predicted number of cars sold in a month for an employee with seven years of sales
experience, a base salary of $400, and a bachelor’s degree is ________.
A) 11.4
B) 12.1
C) 12.7
D) 13.3
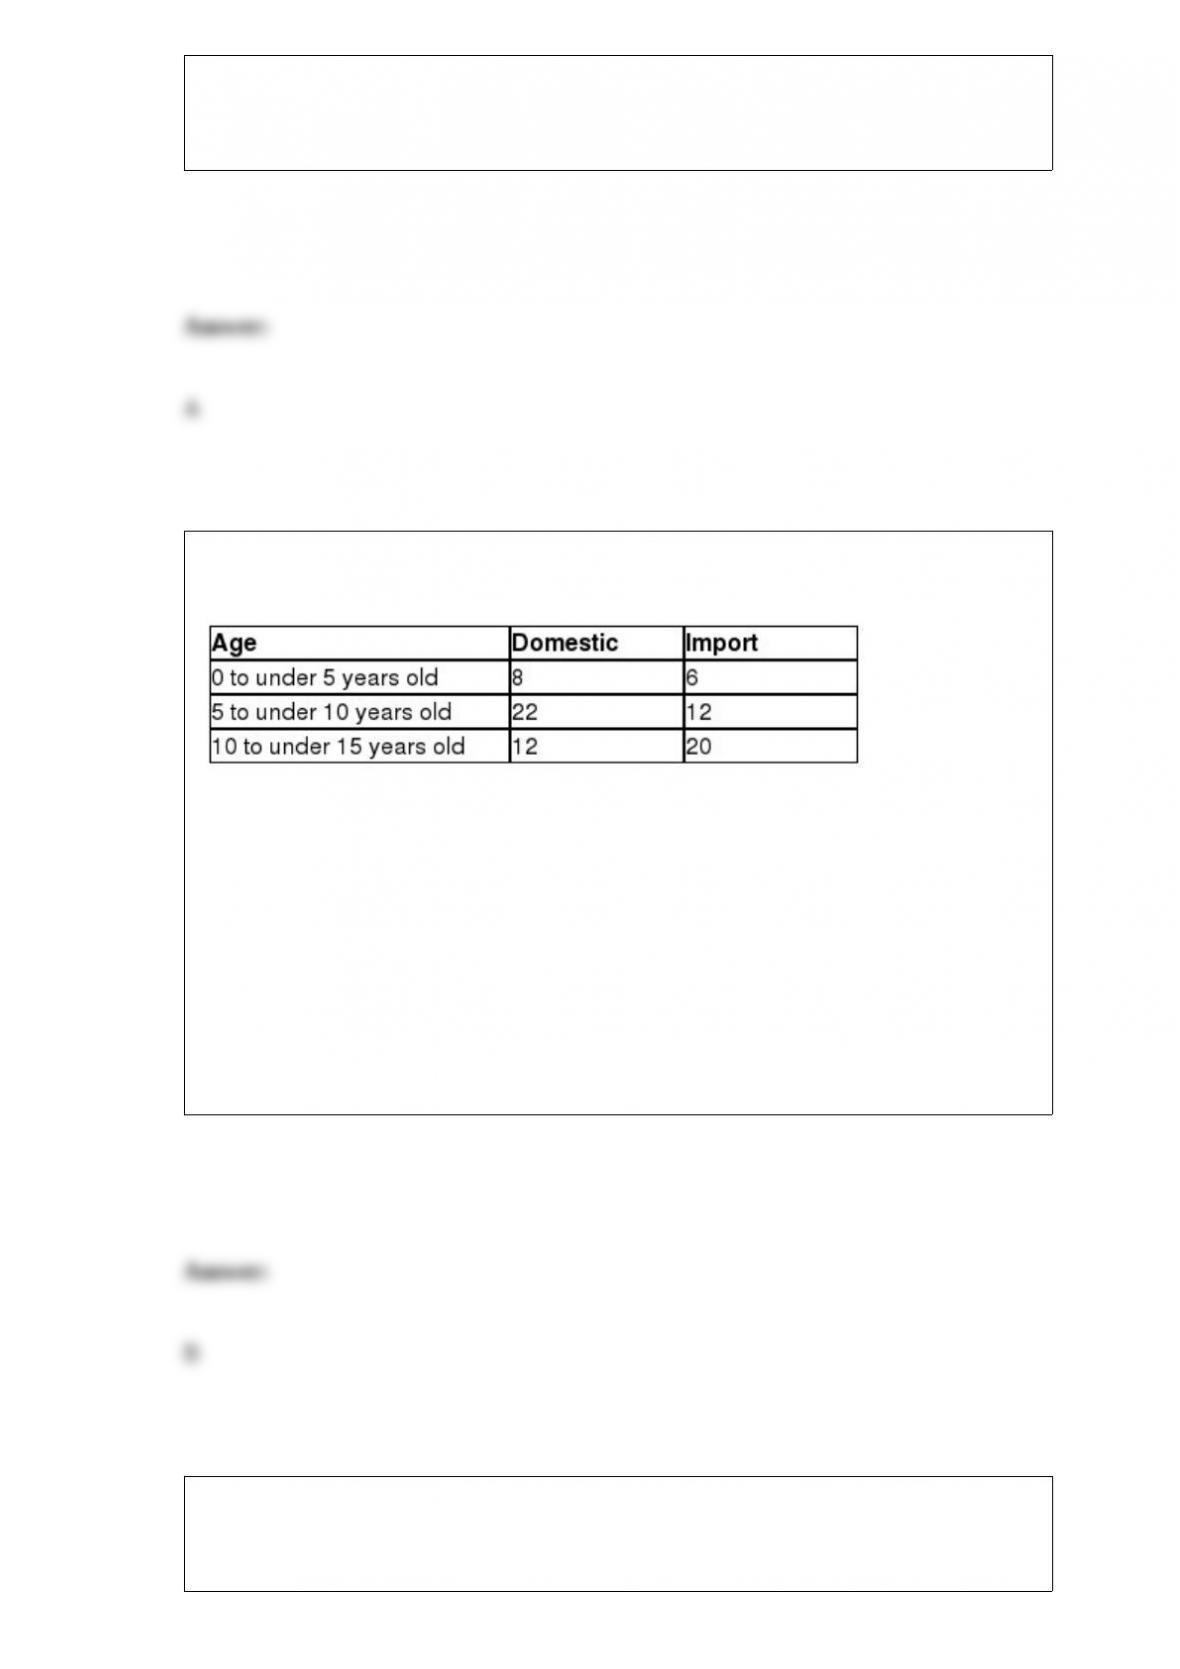
Dempsey’s Garage repairs domestic and import cars. The following table shows the
number of cars that have been serviced by age and type during the last month.
The probability that a randomly selected car from this group was less than 10 years old
is ________.
A) 0.55
B) 0.60
C) 0.76
D) 0.83
Note: The problems below are based on the following information:
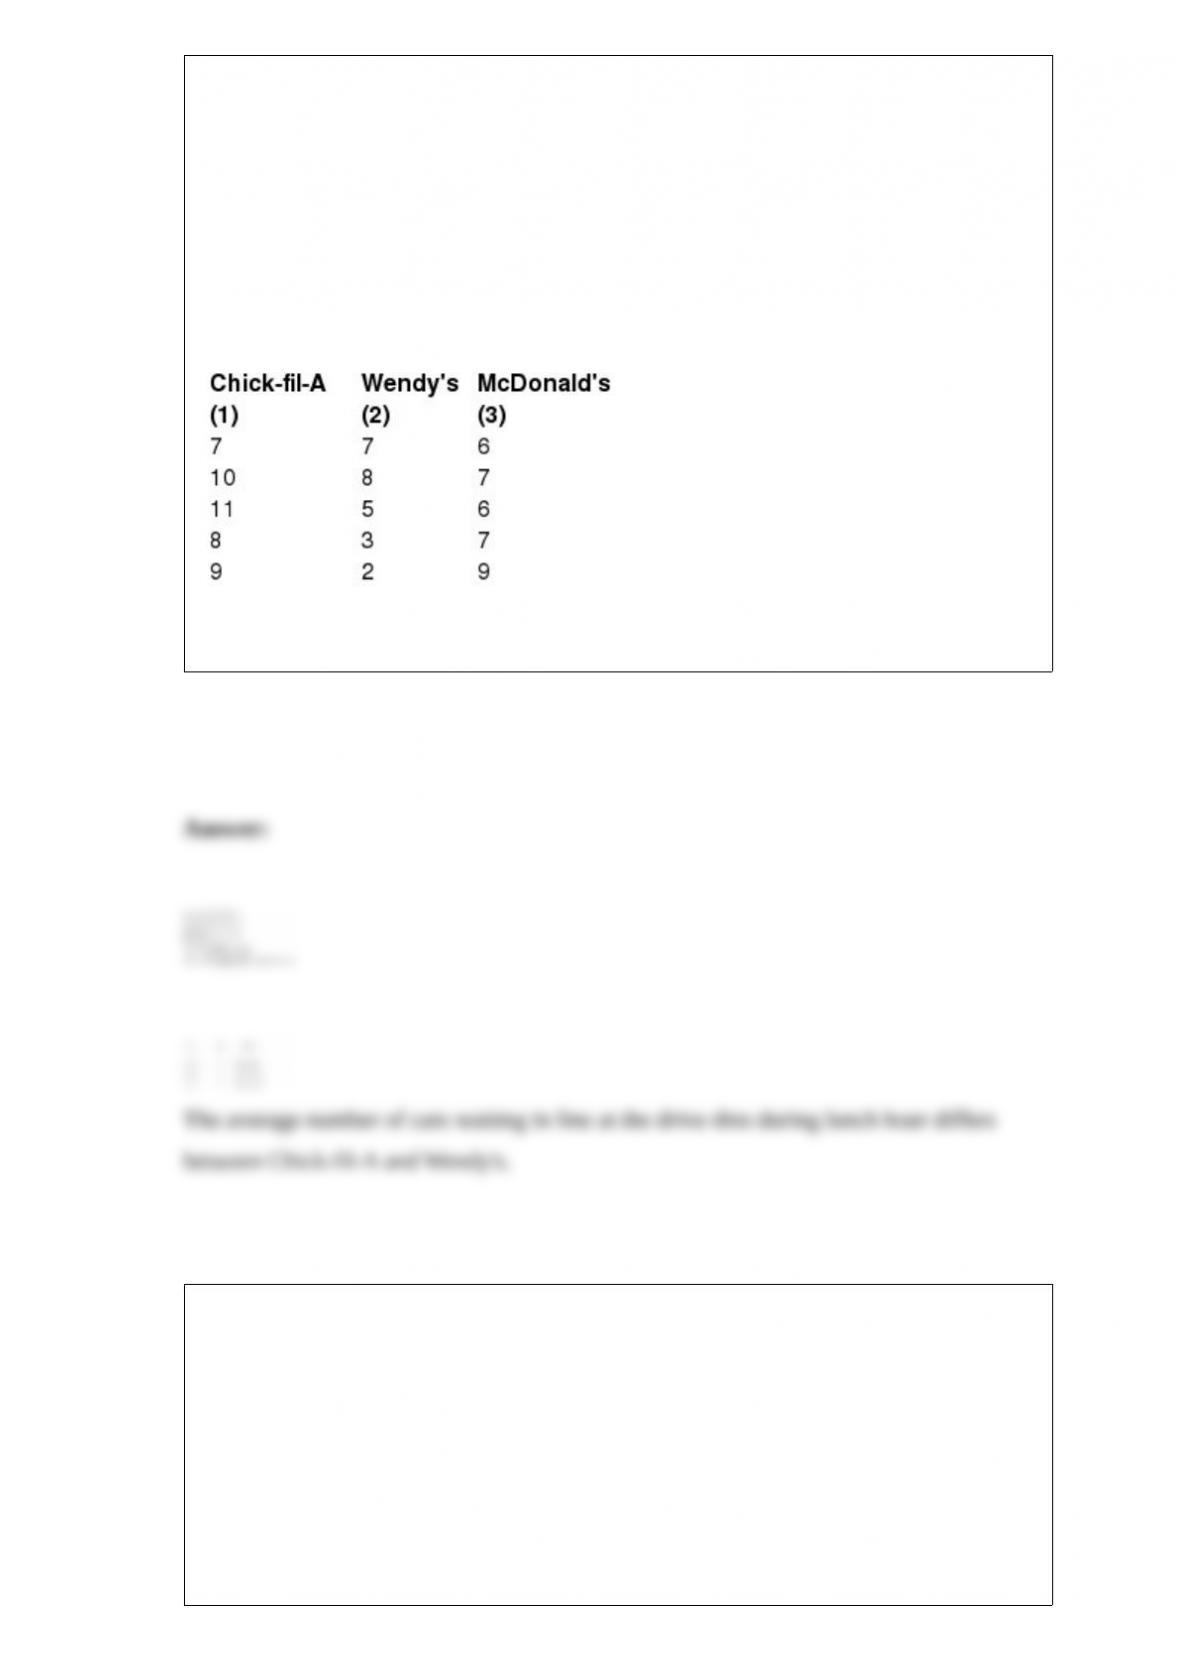
You have been assigned to test the hypothesis that the average number of cars waiting
in line for the drive-thru window during lunch hour differs between Chick-fil-A,
Wendy’s, and McDonald’s. The following data show the number of cars in line during
randomly selected times during the lunch hour at all three chains.
If appropriate, perform a multiple comparisons test to determine which pairs are
different using α = 0.05.
Note: The problems below are based on the following information:
Chris, Steve, and Josh routinely play golf together and would like to know if the
average number of golf balls lost during a round differs between them. The following
table shows the number of golf balls lost by each player during a random sample of golf
rounds.
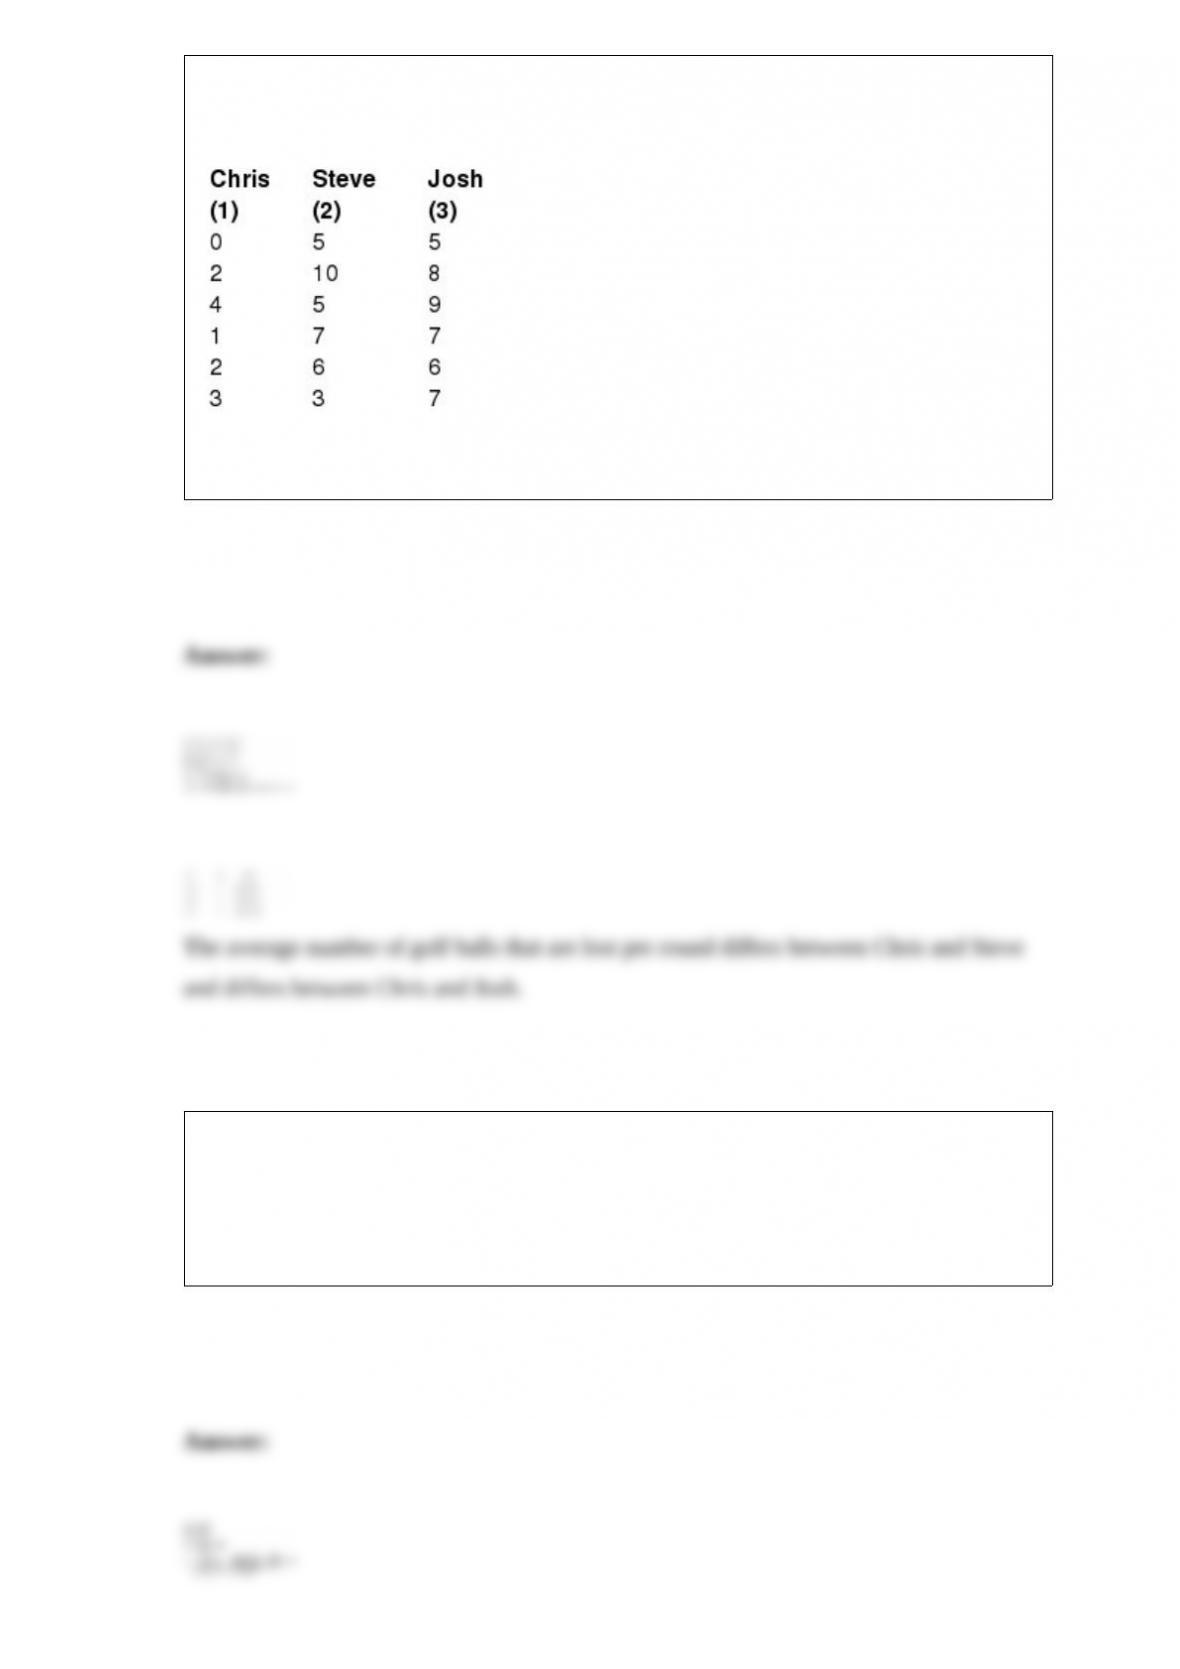
If appropriate, perform a multiple comparisons test to determine which pairs are
different using α = 0.01.
Over the past several years, the proportion of one-person households has been
increasing. The Census Bureau would like to test the hypothesis that the proportion of
one-person households exceeds 0.27. A random sample of 125 households found that 43
consisted of one person. The Census Bureau would like to set α = 0.05. Use the critical
value approach to test this hypothesis.
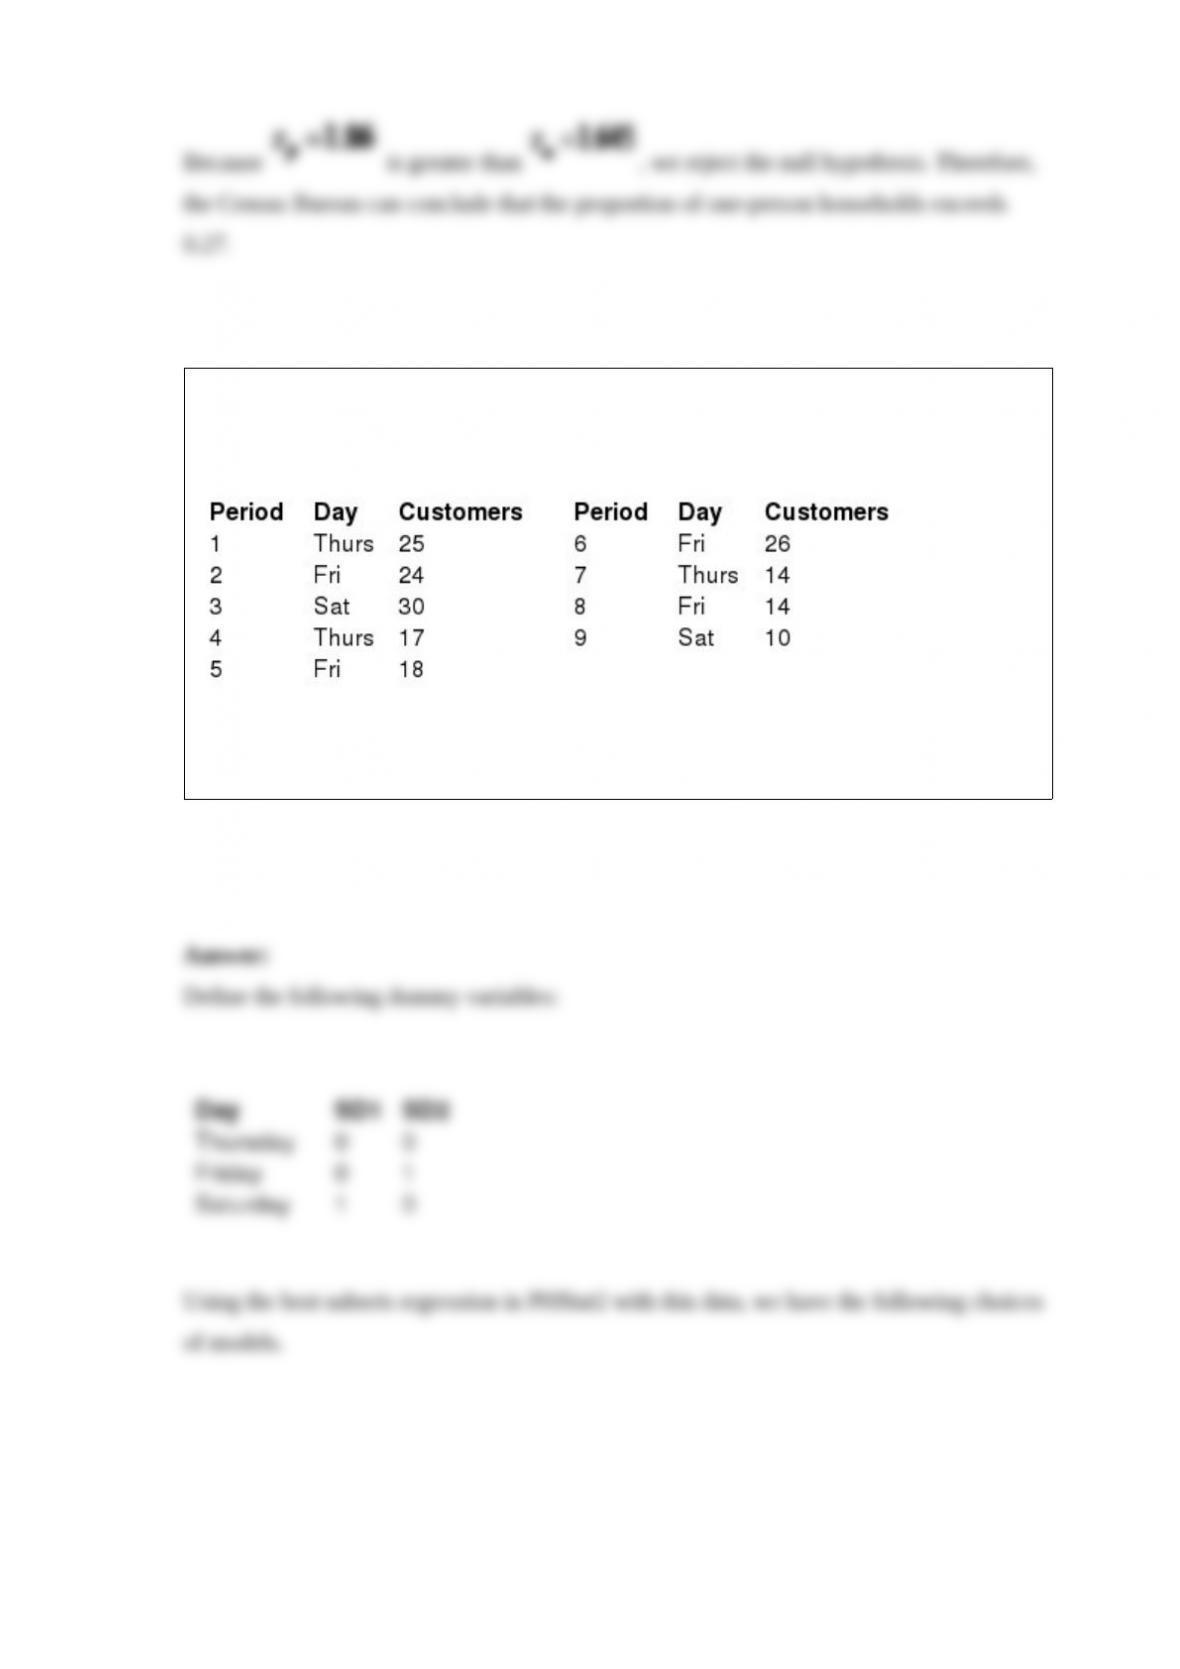
Katie is a waitress at the Princeton Restaurant and works on Thursday, Friday, and
Saturday nights. The following table shows the number of customers that she served
during the past nine nights on her schedule.
Forecast the number of customers that Katie will serve in Period 10 using multiple
regression with dummy variables for seasonality.
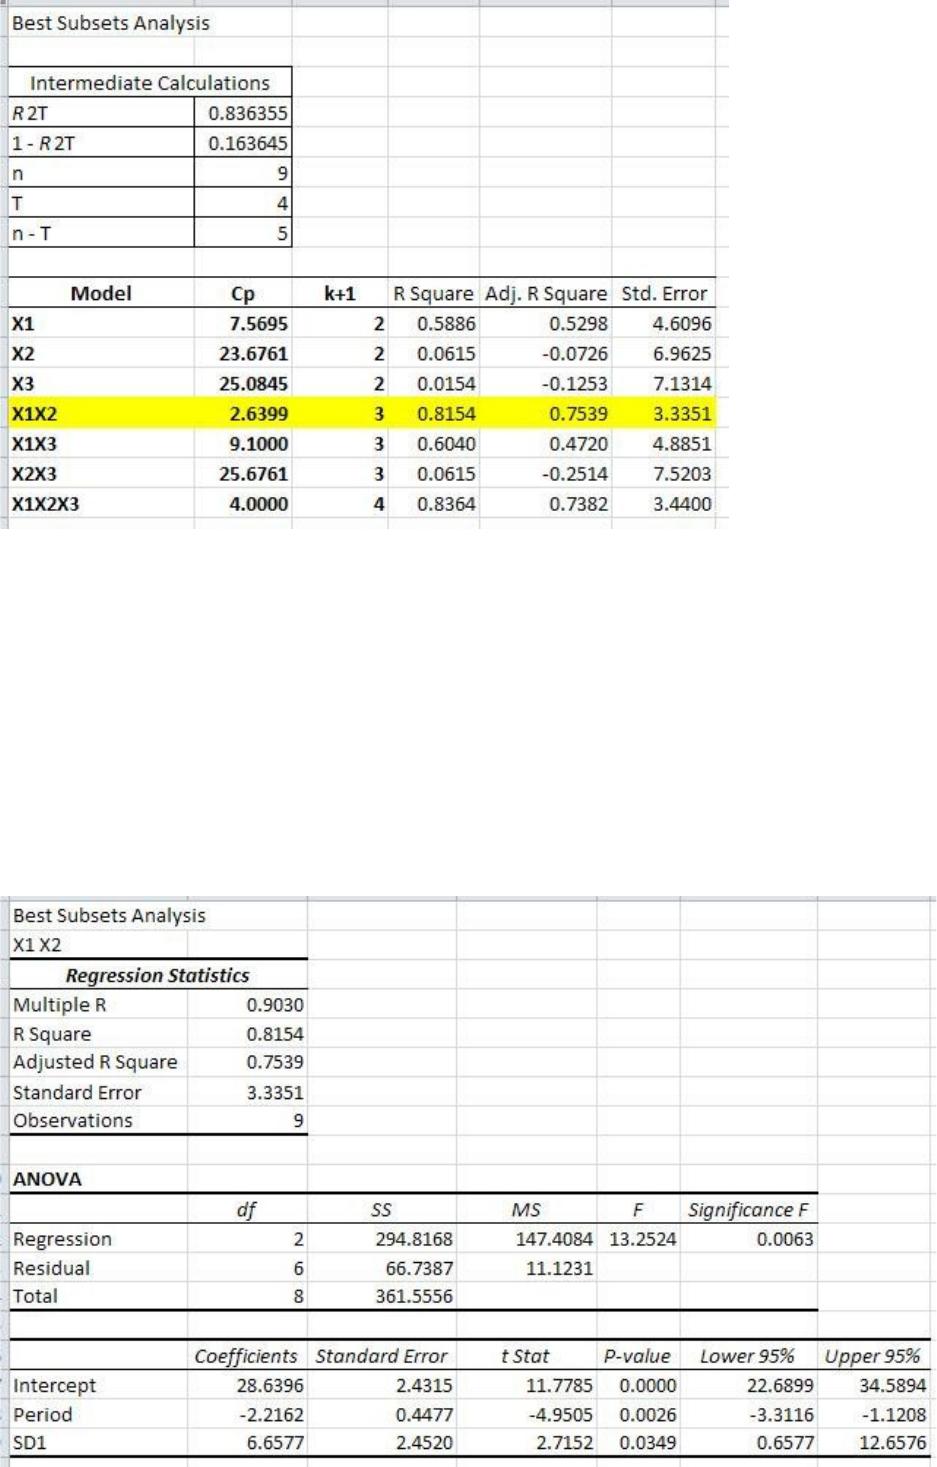
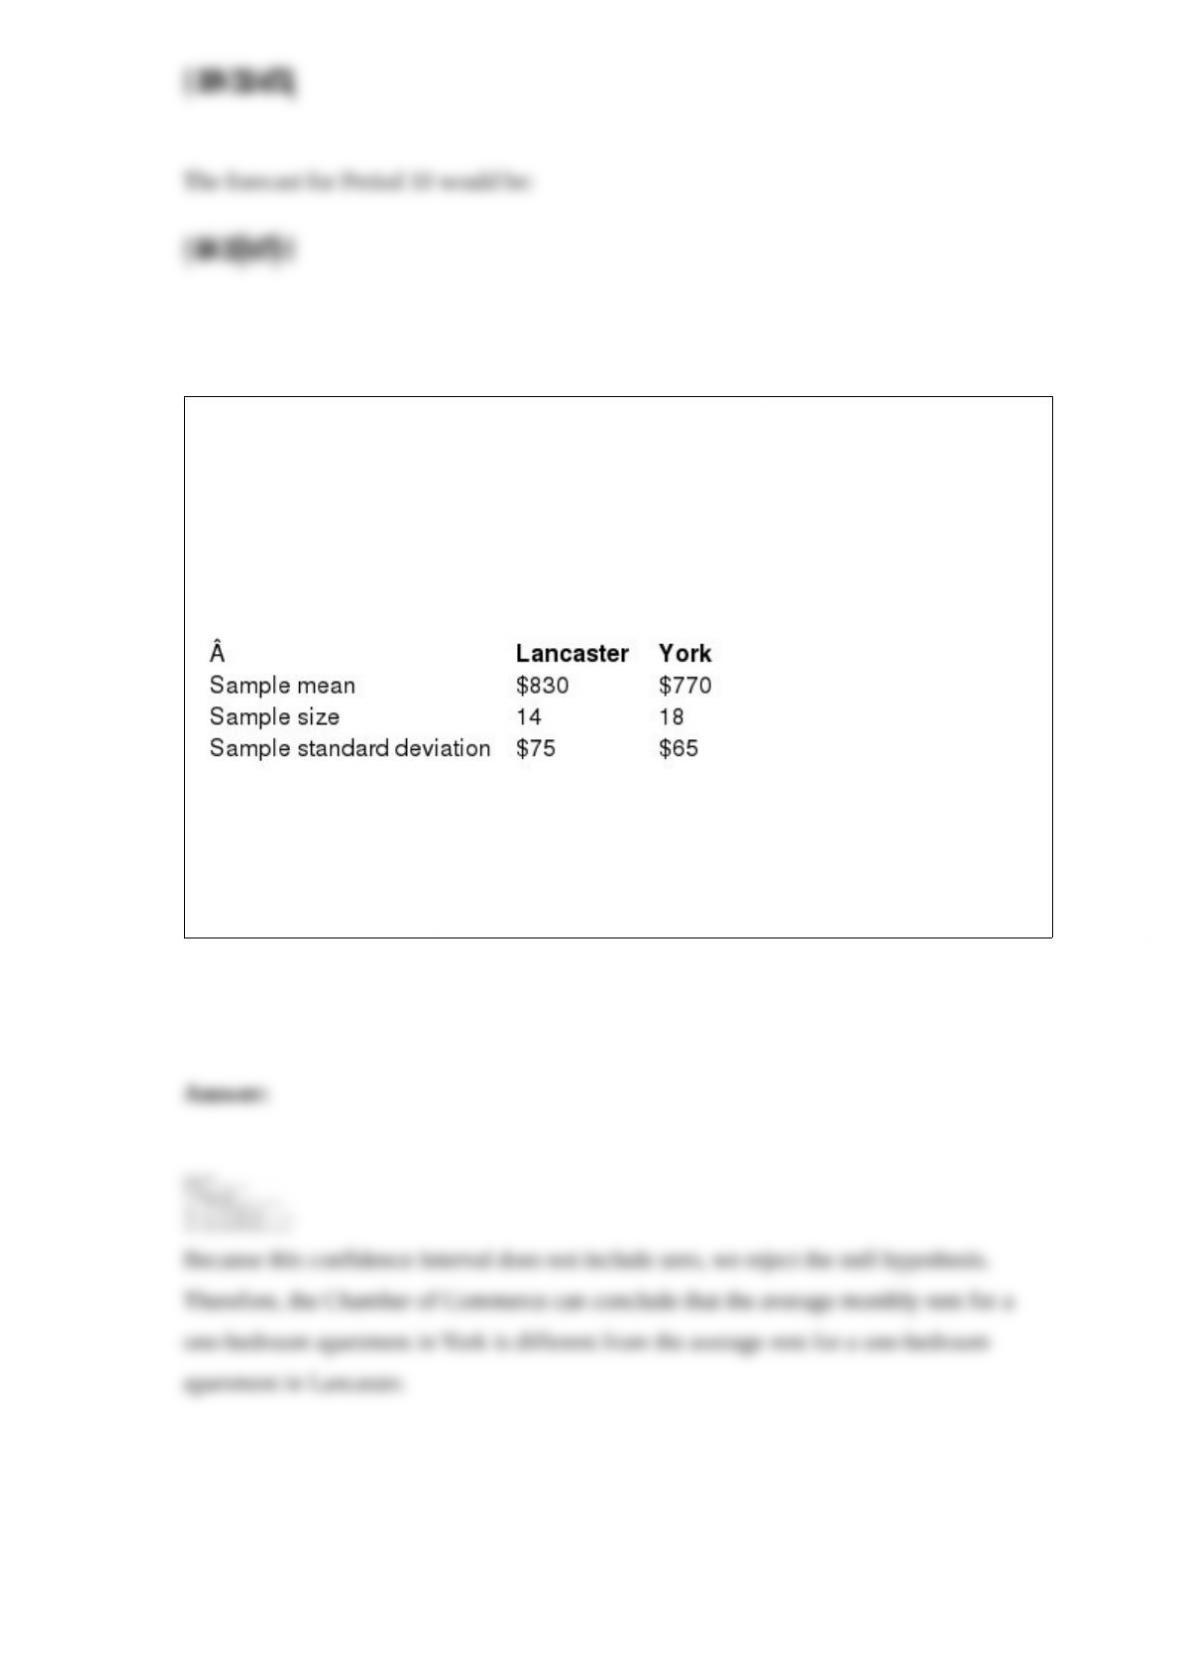
A local Chamber of Commerce would like to test the hypothesis that the average
monthly rent for a one-bedroom apartment in York is different from the average rent of
a one-bedroom apartment in Lancaster. The following data summarizes the sample
statistics for one-bedroom apartment rents for both locations. Assume that the
population variances are equal.
Define Population 1 as Lancaster apartments and Population 2 as York apartments.
Construct a 95% confidence interval for the difference in population mean and interpret
the results.
Use the following information to answer the question(s) below.
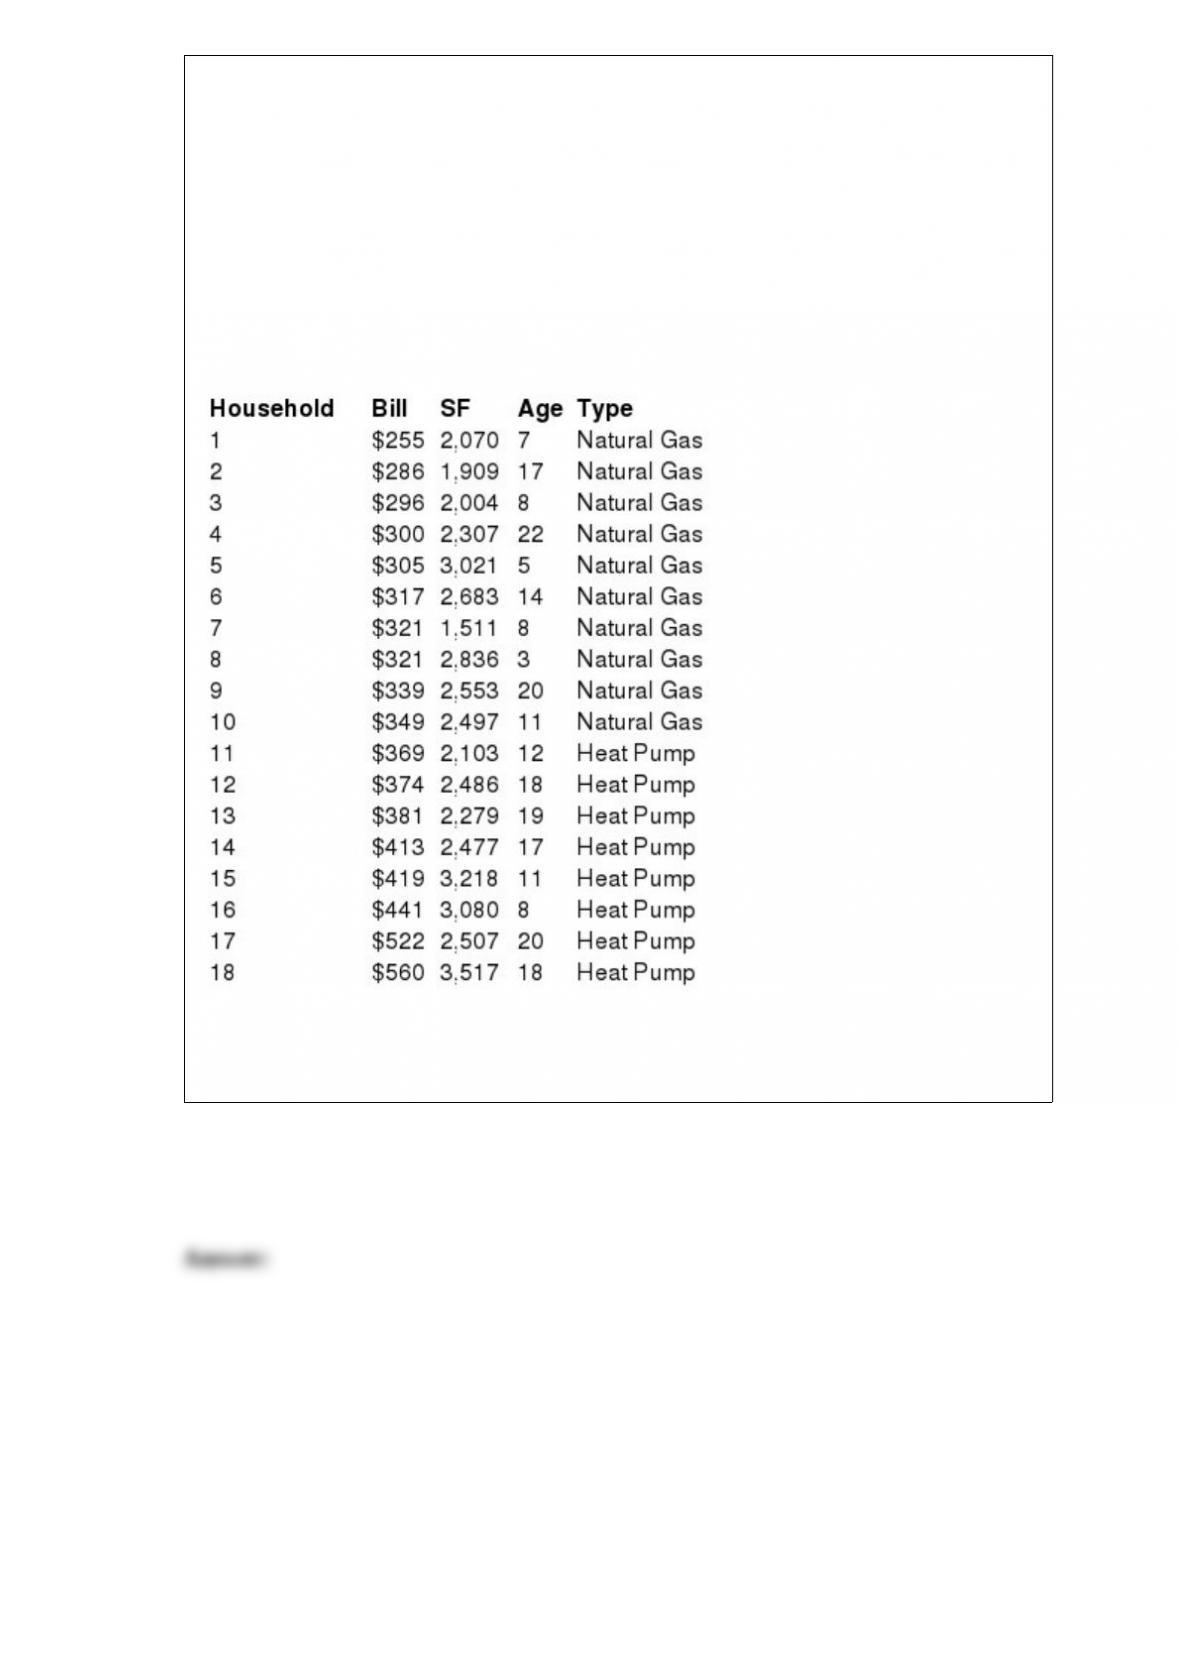
Delmarva Power is a utility company that would like to predict the monthly heating bill
for a household in Kent County during the month of January. A random sample of 18
households in the county were selected and their January heating bill recorded. This
data is shown in the table below along with the square footage of the house (SF), the
age of the heating system in years (Age,) and the type of heating system (heat pump = 1
or natural gas = 0).
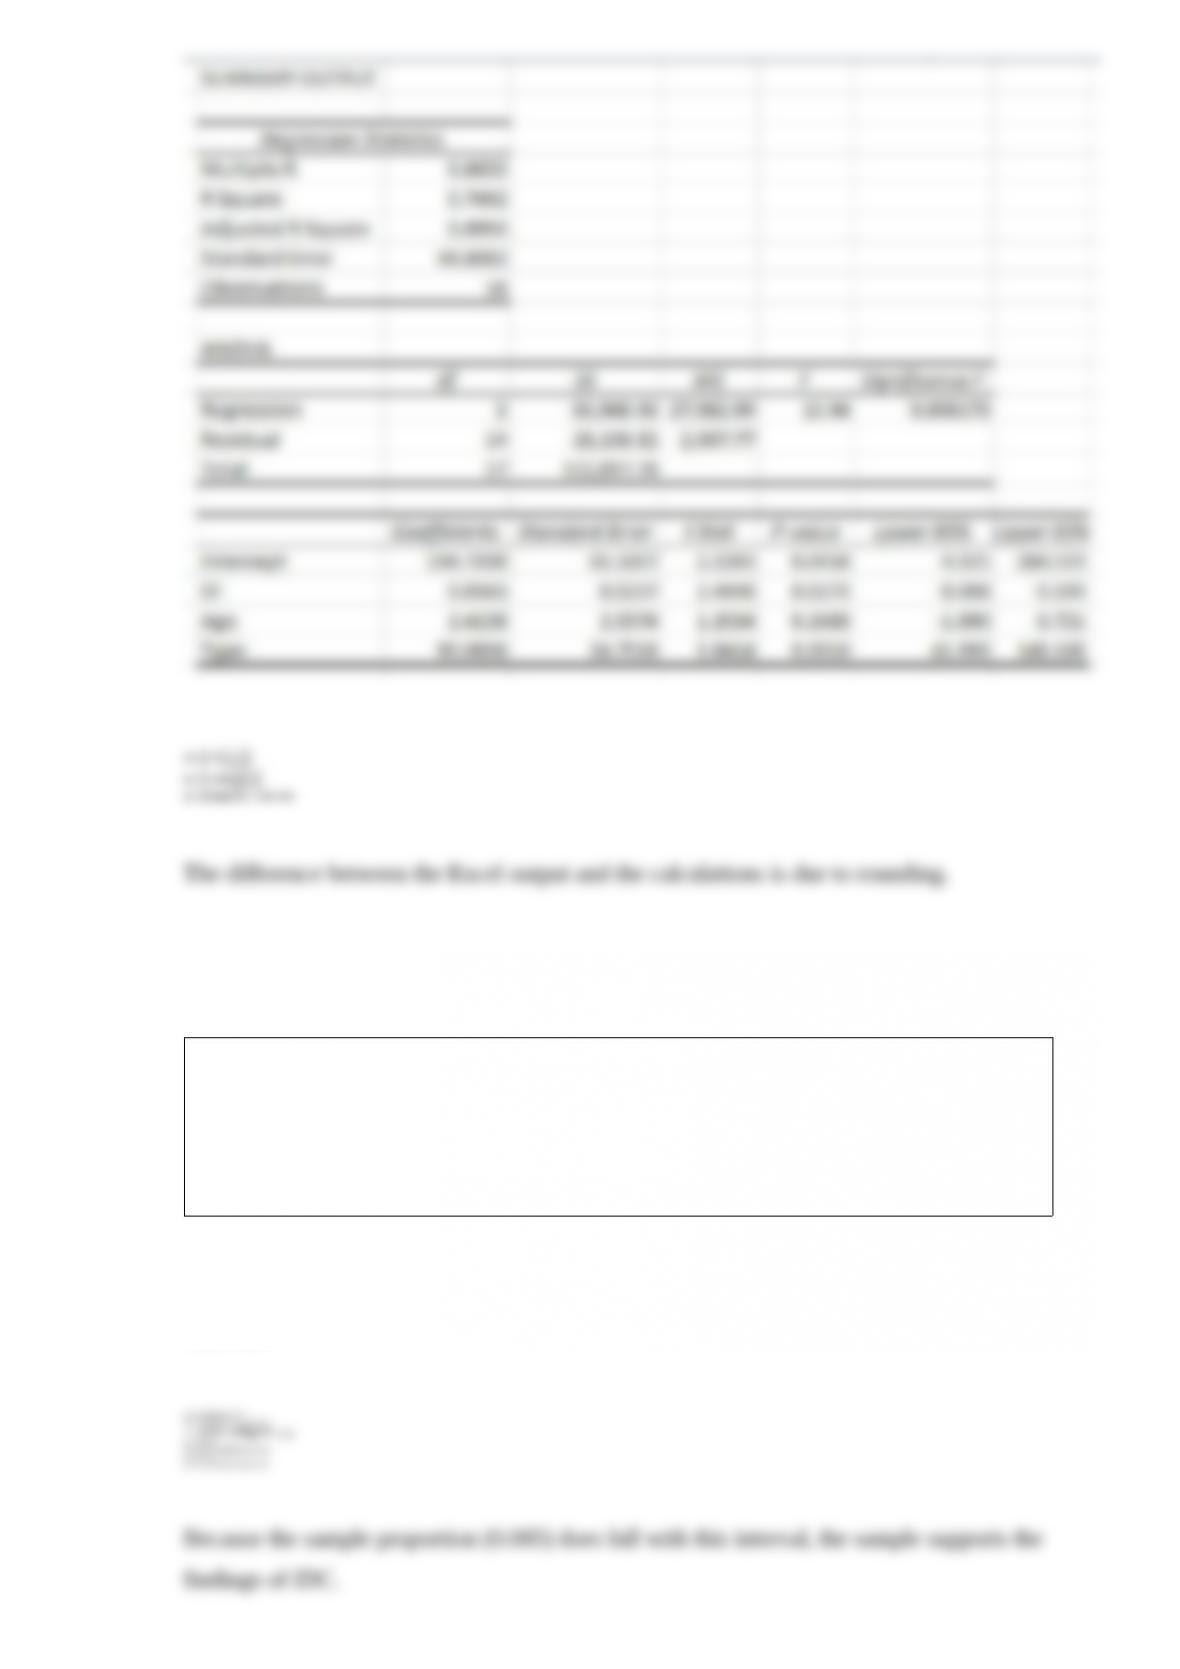
Show the calculations for the adjusted multiple coefficient of determination for
predicting a heating bill for a house in Kent County during the month of January.
According to IDC, Apple controlled 10.0% of the global computer market in the 1st
quarter of 2013. To verify this market share, a random sample of 150 computer users
was selected of which 8.5% were Apple models. Determine the interval that contains
95% of the sample proportions from this sampling distribution and conclude whether or
not this sample supports the findings of IDC.
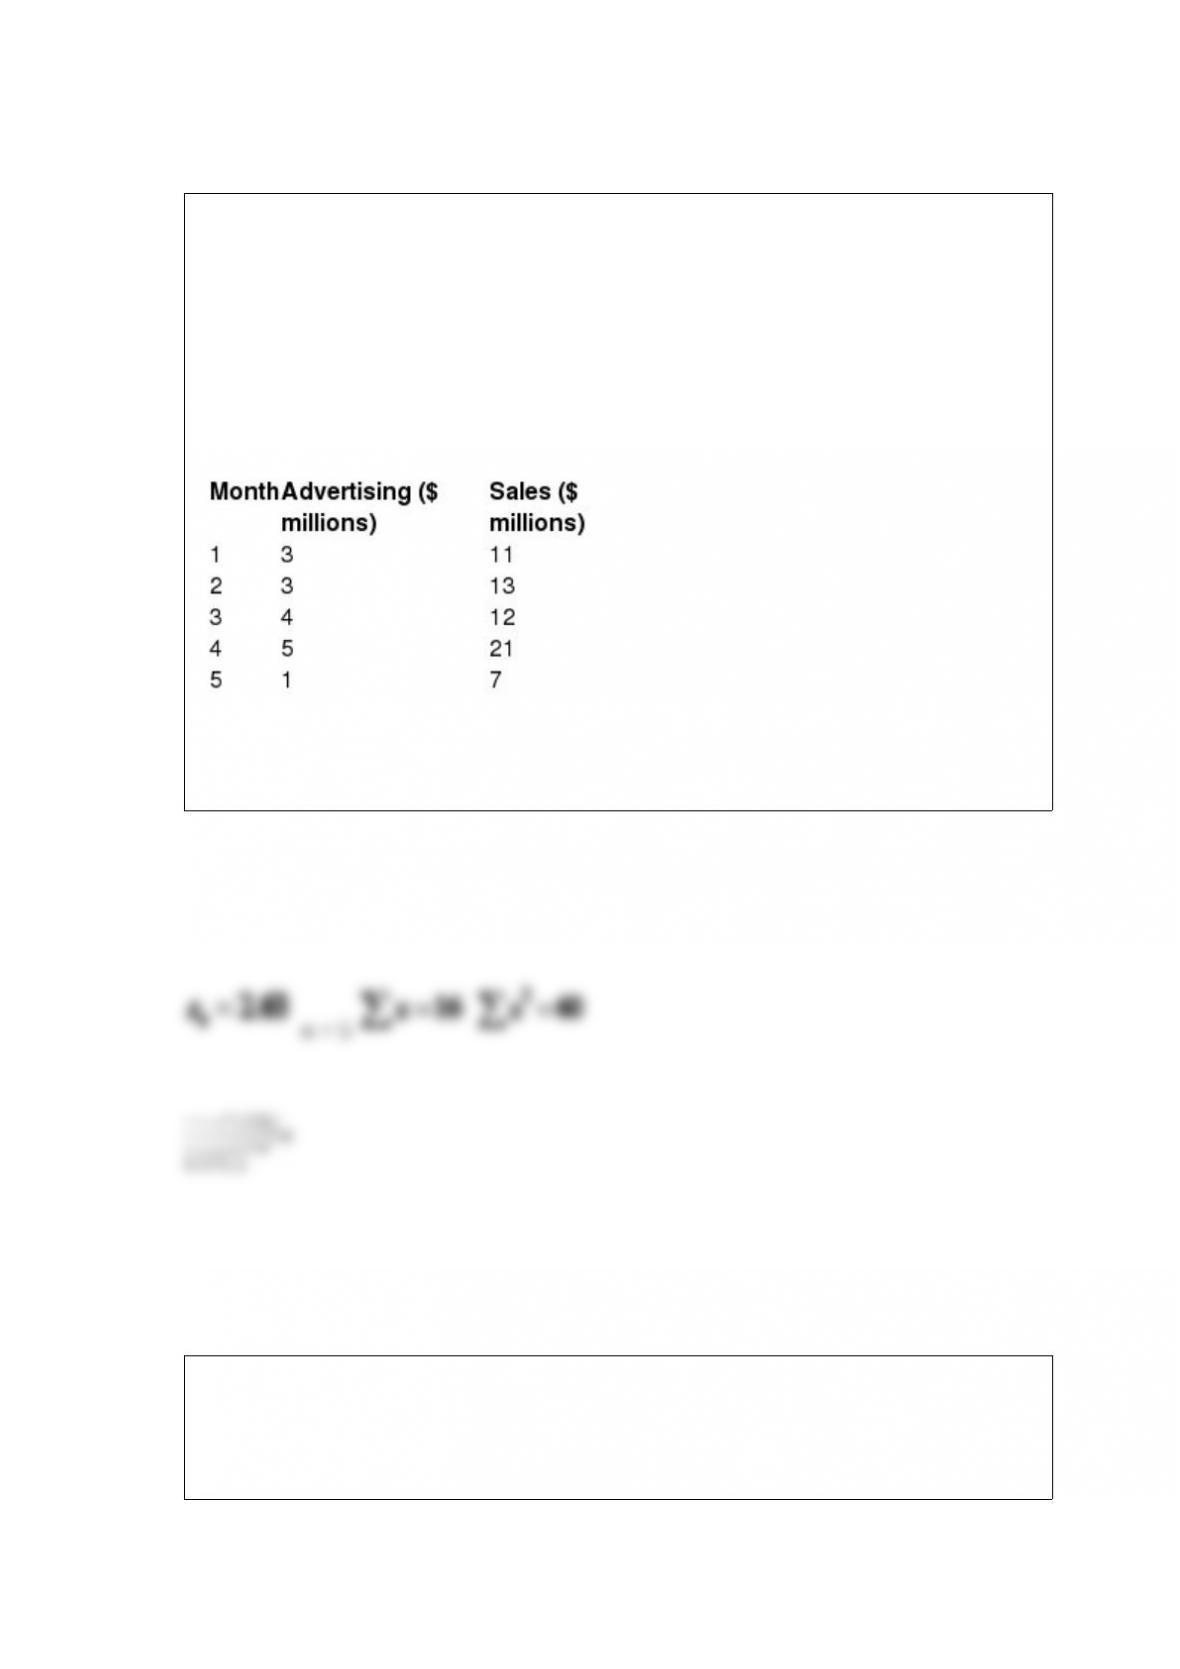
Use the information below to answer the following question(s).
Steve Taylor is the owner of Home Plus, which is a chain of home improvement stores.
He would like to investigate the relationship between month advertising and monthly
sales. The table below shows the amount spent on advertising, in millions of dollars,
over several months along with the corresponding sales, also in millions of dollars.
Use the Home Plus data to calculate the 95% prediction interval for the sales for a
month where $4 million was spent on advertising.
Hotels.com would like to test the hypothesis that the proportion of American travelers
in Europe that prefer an American-branded hotel equals 0.42. A random sample of 90
Americans found that 49 preferred American-branded hotels. Hotels.com would like to
set α = 0.05. Use the critical value approach to test this hypothesis.
Candy Kitchen sells chocolate nonpareils in 8 oz. containers. Because the candy pieces
are not uniform, the weight of each individual container varies slightly. A random
sample of nine containers was weighed on a precision scale and the results are shown
below:
8.09 8.20 8.03 7.86 7.87 8.06 8.43 7.99 8.08
Determine the 40th percentile of this sample.
A business school has 15 full-time faculty and seven of them have tenure. A random
sample of six faculty are randomly selected to form a committee. What is the mean of
this distribution?