Using either the critical value rule or the p-value rule, if a one-sided null hypothesis is
rejected at a given significance level, then the corresponding two-sided null hypothesis
(i.e., the same sample size, the same standard deviation, and the same mean) will
______________ be rejected at the same significance level.
A. always
B. sometimes
C. never
According to data from the state blood program, 40 percent of all individuals have
group A blood. If six individuals give blood, find the mean number of individuals
having group A blood.
A. 1.2
B. 1.55
C. 1.44
D. 2.4
In which of the following tests is the variable of interest the difference between the
values of the observations from the two samples, rather than the actual observations
themselves?

A. a test of hypothesis about the mean of a population of paired differences selected
from two related samples
B. a test of hypothesis about the difference between the means of two normally
distributed populations using independent samples
C. a test of hypothesis about the difference between two population proportions, using
large independent random samples
D. a test of hypothesis about the difference between the variances of two normally
distributed populations using independent samples
In a major midwestern university, 55 percent of all undergraduates are female, 25
percent of all undergraduates belong to a Greek organization (fraternity or sorority), and
40 percent of all males belong to a Greek organization. What is the probability that an
undergraduate is in a Greek organization, given that the undergraduate is a female?
A. .07
B. .55
C. .127
D. .039
E. 138
If n = 15 and p = .4, then the standard deviation of the binomial distribution is
A. 9.

B. 6.
C. 3.6.
D. 1.897.
E. .4.
Find z when the area to the right of z is .1314.
A. 1.12
B. 0.55
C. −0.55
D. −1.12
In the upcoming election for governor, the most recent poll, based on 900 respondents,
predicts that the incumbent will be reelected with 55 percent of the votes. What is ?
A. .00825
B. .0166
C. .0247
D. .0003
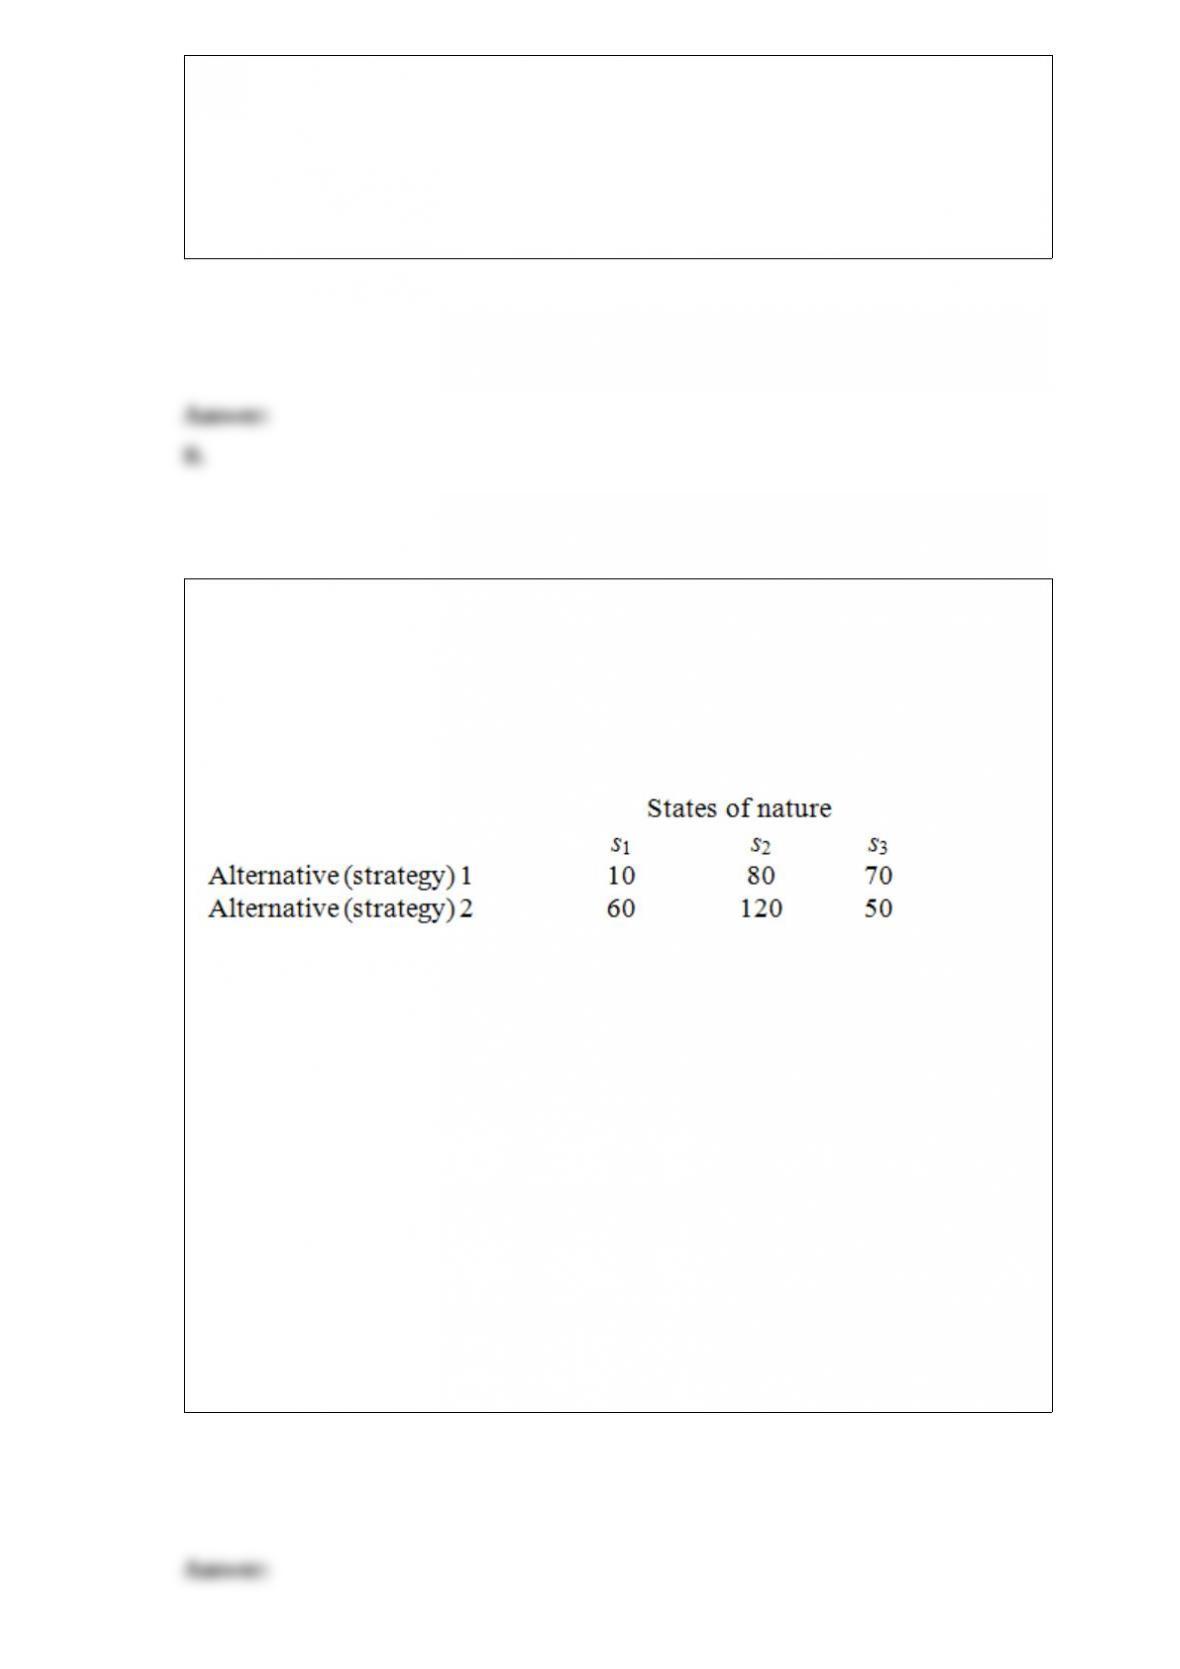
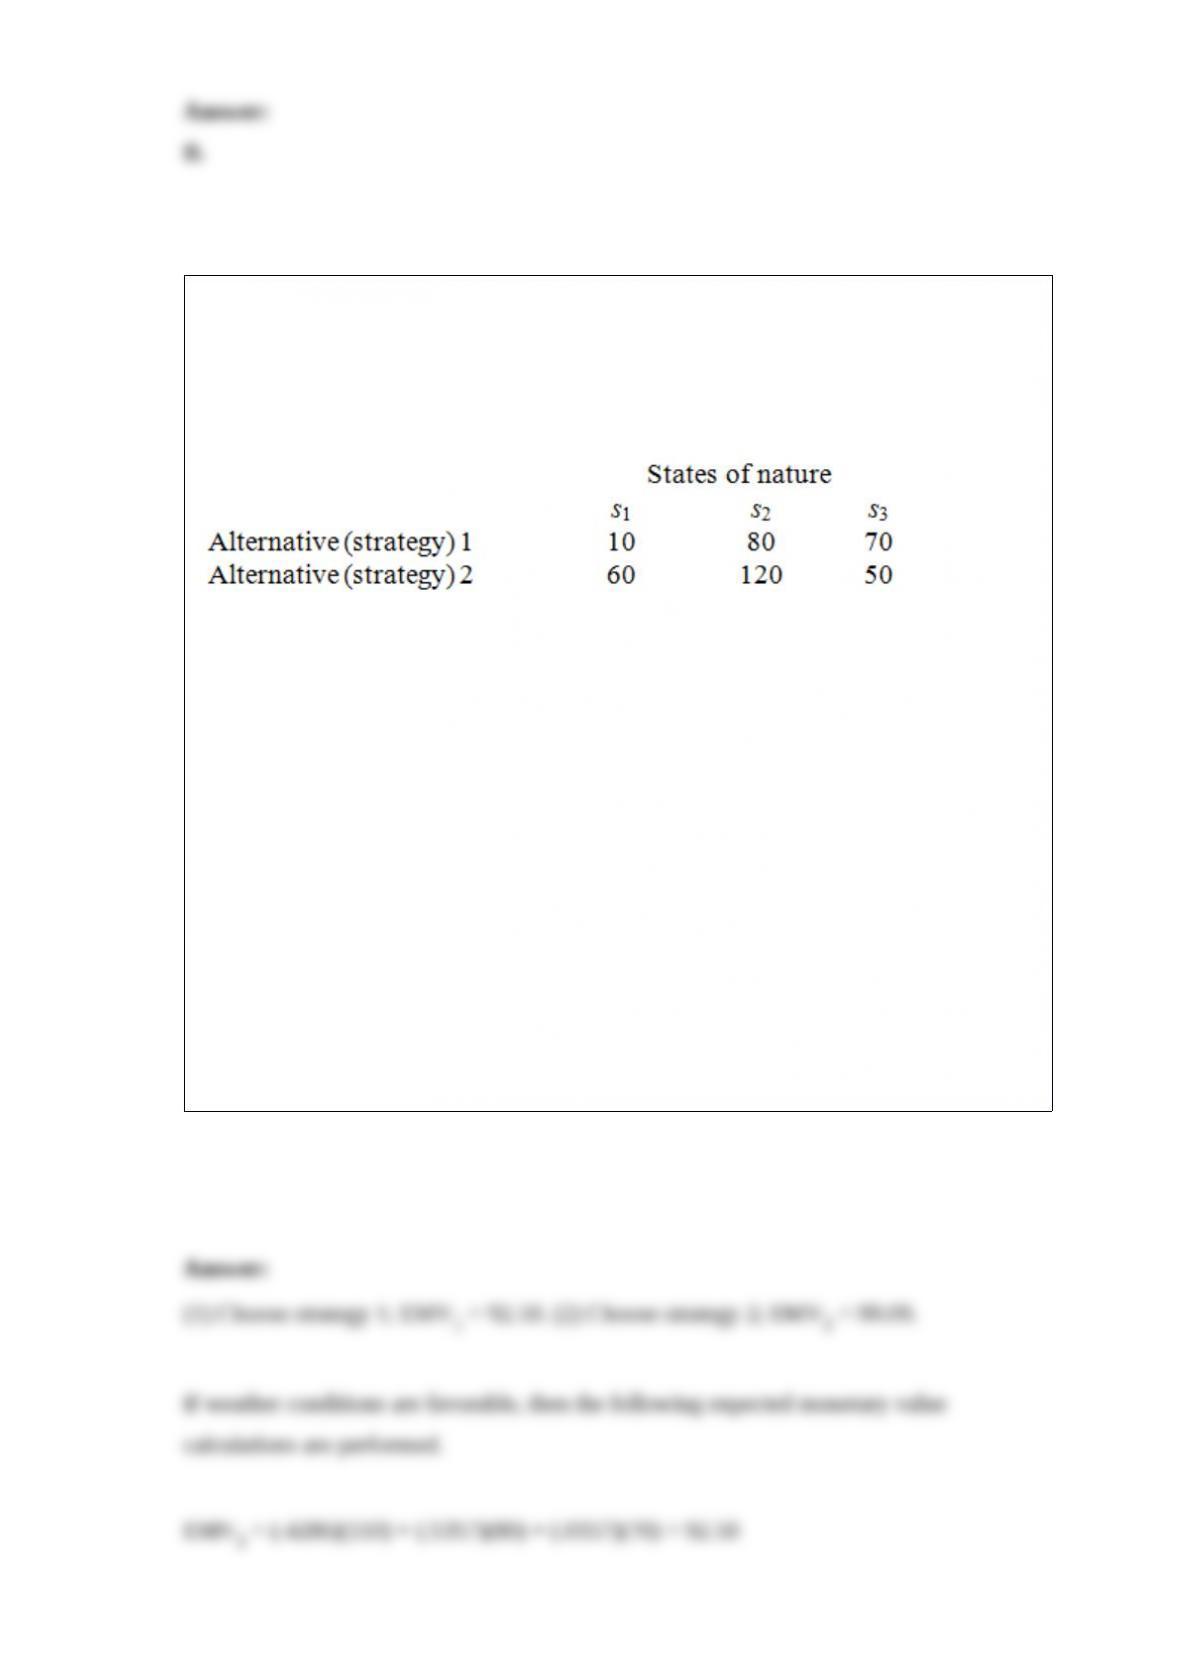
Alternatives 1 and 2 in the following payoff table represent the two possible
manufacturing strategies that the EKA manufacturing company can adopt. The level of
demand affects the success of both strategies. The states of nature (SI) represent the
levels of demand for the company products. S1, S2, and S3 characterize high, medium,
and low demand, with probabilities of .3, .6, and .1, respectively. The payoff values are
in thousands of dollars.
Find the expected monetary value for each of the alternatives and determine the best
alternative (course of action) for the EKA manufacturing company using the expected
monetary value criterion.
A. EMV1 = $98,000, EMV2 = $95,000, choose strategy 1
B. EMV1 = $88,000, EMV2 = $95,000, choose strategy 2
C. EMV1 = $88,000, EMV2 = $85,000, choose strategy 1
D. EMV1 = $66,667, EMV2 = $76,667, choose strategy 2
E. EMV1 = $120,000, EMV2 = $110,000, choose strategy 1

Suppose that x has a hypergeometric distribution with N = 10, r = 5, and n = 3.
Calculate the mean of the distribution.
A. 0.500
B. 0.333
C. 1.500
D. 3.000
A foreman wants to use an chart to control the average length of the bolts
manufactured. He has recently collected the six samples given below.
Sample
1 1.99 2.01 2.02 2.02
2 2.00 2.00 2.01 2.01
3 1.98 1.99 2.01 1.98
4 2.01 2.02 2.02 1.99
5 1.99 1.99 2.01 1.99
6 2.03 1.98 2.03 2.04
Determine the LCL and the UCL for the R chart.
A. [0, .0685]
B. [0, .076]
C. [0, .03]
D. [0, .0601]
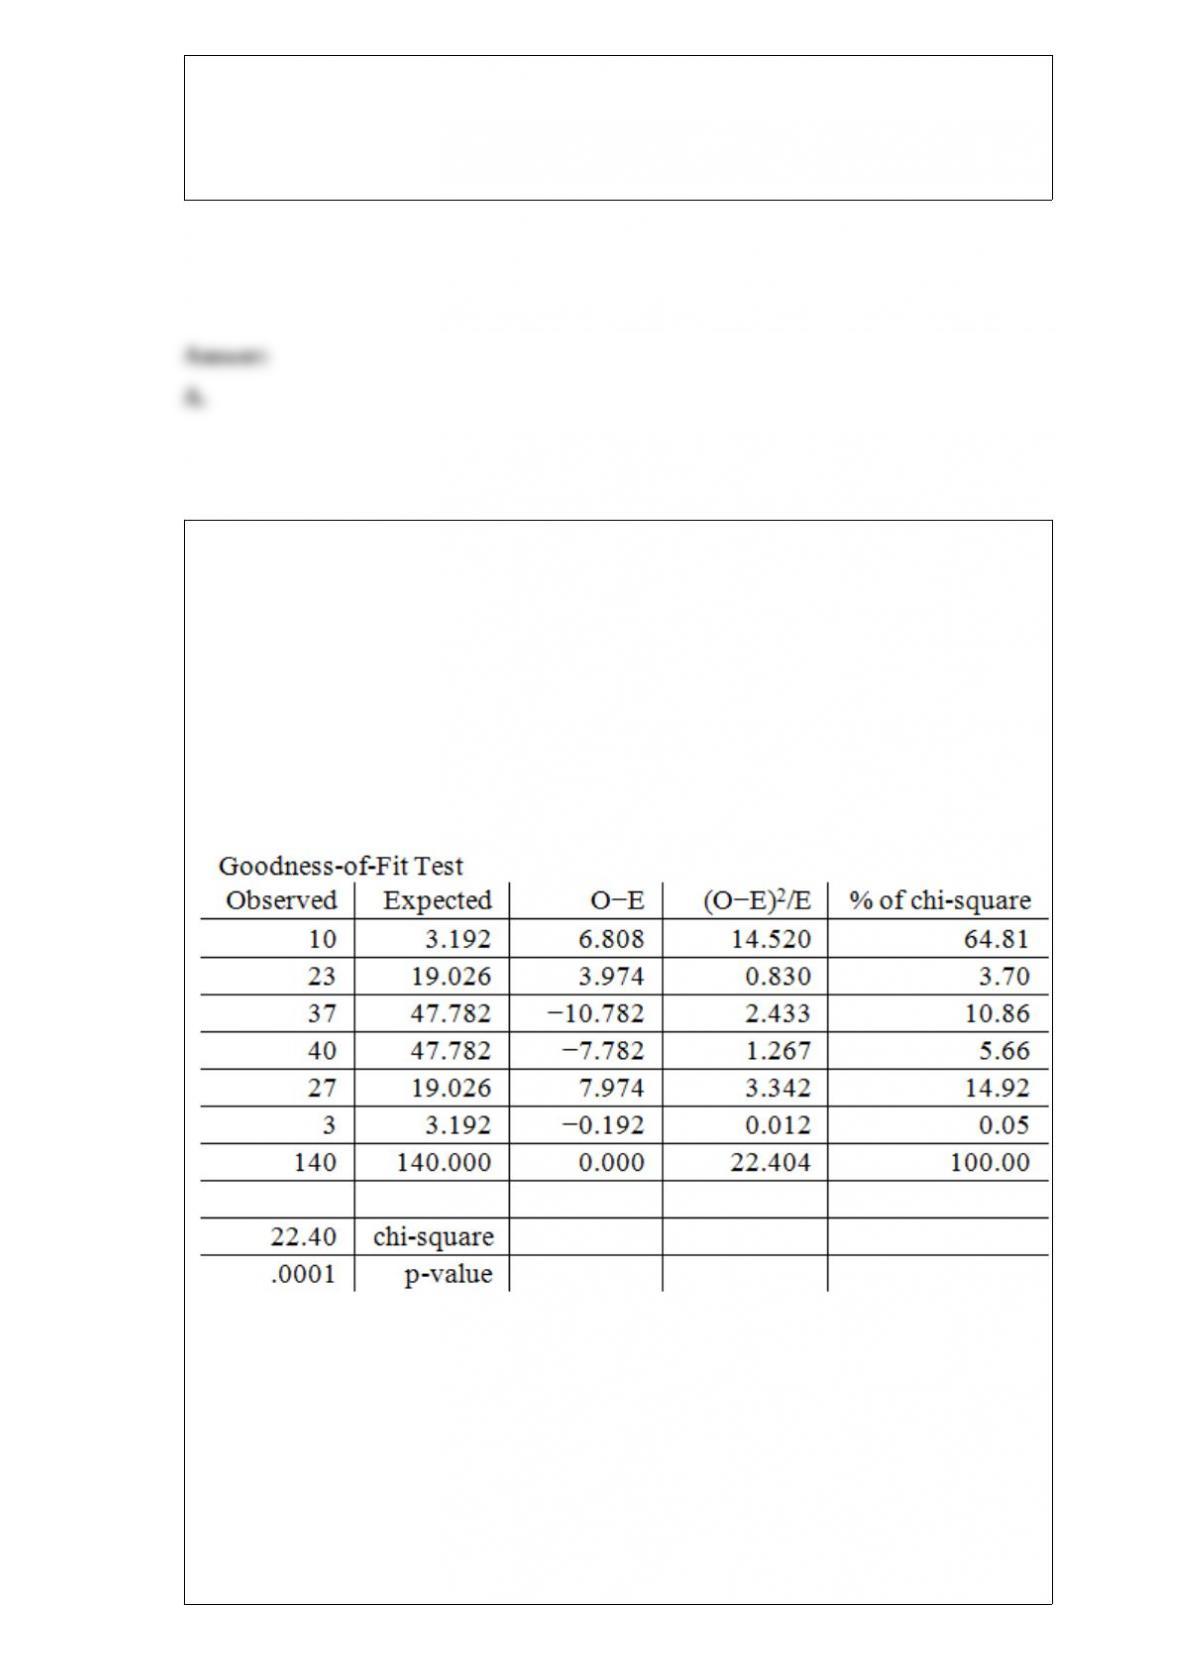
A real estate company is analyzing the selling prices of residential homes in a given
community. 140 homes that have been sold in the past month are randomly selected and
their selling prices are recorded. The statistician working on the project has stated that
in order to perform various statistical tests, the data must be distributed according to a
normal distribution. In order to determine whether the selling prices of homes included
in the random sample are normally distributed, the statistician divides the data into 6
classes of equal size and records the number of observations in each class. She then
performs a chi-square goodness-of-fit test for normal distribution. The results are
summarized in the following table.
At a significance level of .05, we
A. reject H0; conclude that the residential home selling prices are not distributed
according to a normal distribution.
B. do not reject H0; conclude that the residential home selling prices are not distributed
according to a normal distribution.

C. reject H0; conclude that the residential home selling prices are distributed according
to a normal distribution.
D. do not reject H0; conclude that the residential home selling prices are distributed
according to a normal distribution.
What sample size is needed to estimate the proportion of highway speeders within 5
percent using a 90 percent confidence level?
A. 385
B. 68
C. 271
D. 165
The Consumer Price Index and the Producer Price Index are both calculated using the
___________ index formula.
A. Paasche
B. weighted aggregate
C. Laspeyres
D. cyclical (seasonal)

A discrete probability distribution is expressed as a table, graph, or ___________ that
gives the probability associated with each possible value that the random variable can
assume.
A. binomial
B. formula
C. Poisson
D. hypergeometric
According to data from the state blood program, 40 percent of all individuals have
group A blood. If six individuals give blood, find the probability that exactly three of
the individuals have group A blood.
A. .4000
B. .2765
C. .5875
D. .0041

Which of the following is a categorical variable?
A. air temperature
B. bank account balance
C. daily sales in a store
D. whether a person has a traffic violation
E. value of company stock
If x is a Poisson random variable with a mean of 10, what is the probability that x is
greater than or equal to 2?
A. .9972
B. .0028
C. .9995
D. .0005
Container 1 has 8 items, 3 of which are defective. Container 2 has 5 items, 2 of which
are defective. If one item is drawn from each container, what is the probability that the
item from Container 1 is defective and the item from Container 2 is not defective?

A. 0.3846
B. 0.2250
C. 0.3750
D. 0.6154
E. 0.1500
XYZ Company, Annual Data
Based on the information given in the table above, what is the MSD?
A. 1.3333
B. 1.6667
C. 2.5
D. 3.3333
E. 4.5

An international economist believes that there is a significant relationship between the
amount of debt and the rate of unemployment. He randomly selected six countries to
determine if there is a significant relationship between debt and unemployment rate. In
the following table, debt figures for the 6 countries are given in billions of dollars and
the corresponding unemployment rate is given in percentages. He also discovered that
both the distribution of debt and the distribution of unemployment rate were highly
skewed. Use Spearman’s rank correlation and determine if there is a significant
correlation between debt and unemployment rate. Show the rank correlation.
Country Debt Unemployment Rate
1 1 5
2 3 5
3 5 8
4 1 4
5 6 8
6 6 12
A. rs = .914, reject the null hypothesis.
B. rs = .886, do not reject the null hypothesis.
C. rs = .886, reject the null hypothesis.
D. rs = .914, do not reject the null hypothesis.
In testing the difference between the means of two normally distributed populations
using independent random samples, the correct test statistic to use is the
A. z statistic.
B. t statistic.

C. F statistic.
D. chi-square statistic.
E. None of the other choices is correct.
A manufacturer of cell phone batteries claims that the median life of a battery is more
than 40 hours. Suppose a random sample of 75 batteries finds that 32 have a life of
more than 40 hours. Using α = .05, can we conclude that the battery life is more than 40
hours?
A. Reject the null hypothesis; z = 1.38.
B. Do not reject the null hypothesis; z = 1.38.
C. Reject the null hypothesis; z = −1.38.
D. Do not reject the null hypothesis; z = −1.38.
A normal distribution with mean equal to zero and a standard deviation equal to one is
called the ____________ normal distribution.
A. continuous
B. uniform
C. exponential
D. standard

In a statistics class, 10 scores were randomly selected, with the following results: 74,
73, 77, 77, 71, 68, 65, 77, 67, 66.
What is the 90th percentile?
A. 77
B. 73
C. 74
D. 67
E. 65.9
The chief chemist for a major oil and gasoline production company claims that the
regular unleaded gasoline produced by the company contains on average 4 ounces of a
certain ingredient. The chemist further states that the distribution of this ingredient per
gallon of regular unleaded gasoline is normal and has a standard deviation of 1.2
ounces. What is the probability of finding an average of less than 3.85 ounces of this
ingredient from 64 randomly inspected 1-gallon samples of regular unleaded gasoline?
A. .1587
B. .8413
C. .1357
D. .8643

Suppose the daily change in price of a stock is normally distributed with mean = .20
and standard deviation = .30. What price change is associated with the 25th percentile?
A. .1925
B. .2075
C. .401
D. −.001
A set of final examination grades in a calculus course was found to be normally
distributed with a mean of 69 and a standard deviation of 9. Only 5 percent of the
students taking the test scored higher than what grade?
A. 70.04
B. 67.96
C. 55.48
D. 82.52

Refer to the MegaStat/Excel output for the Wilcoxon rank sum test given in the table
below.
At a significance level of .05, which one of the following rejection point conditions is
correct regarding the null hypothesis, H0: D1 and D2 are identical probability
distributions, and the alternative hypothesis of Ha: D1 is shifted to the left of D2
A. Reject H0 if T ≥ 83.
B. Reject H0 if T ≤ 127.
C. Reject H0 if T ≥ 131.
D. Reject H0 if T ≤ 83.
E. Reject H0 if T ≤ 79.
The following is a relative frequency distribution of grades in an introductory statistics
course.
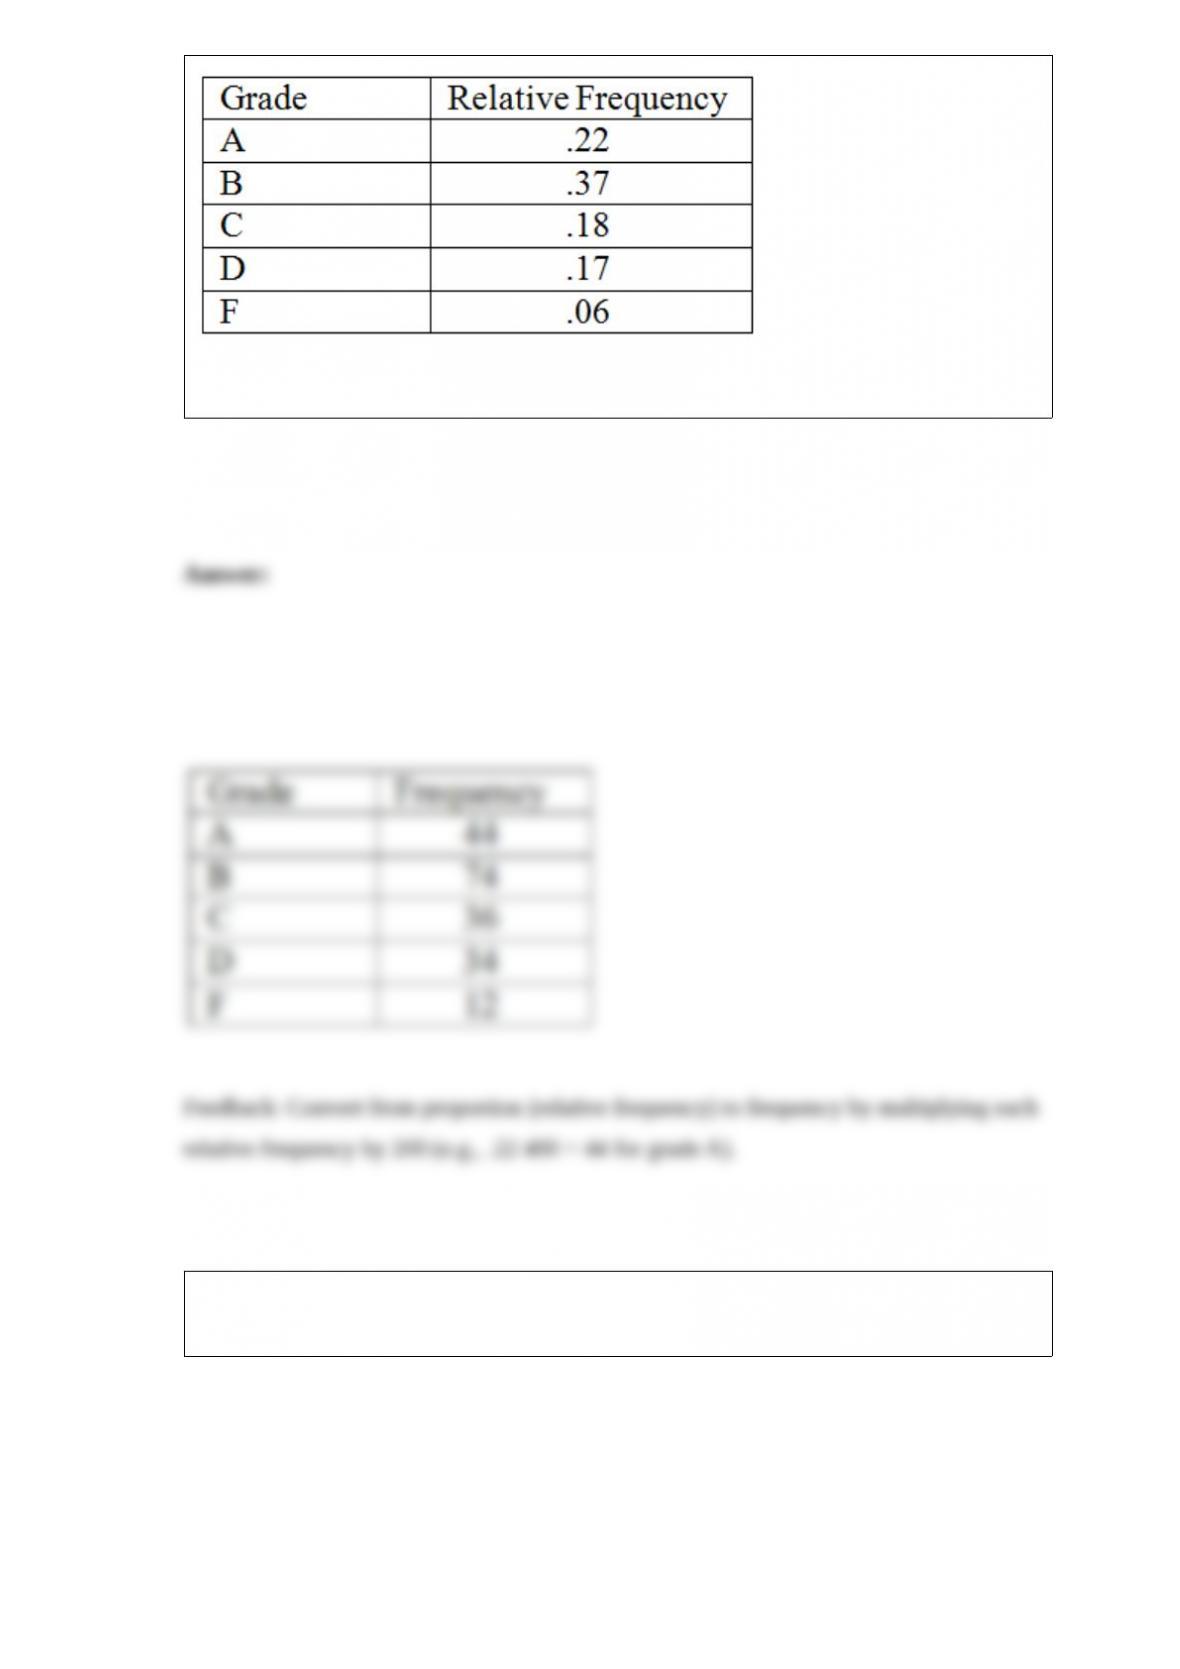
If this was the distribution of 200 students, give the frequency distribution for this data.
The following is a relative frequency distribution of grades in an introductory statistics
course.

If this was the distribution of 200 students, find the frequency for the highest two
grades.
A. 44
B. 118
C. 59
D. 74
E. 35
When using Chebyshev’sTheorem to obtain the bounds for 99.73 percent of the values
in a population, the interval generally will be ___________ the interval obtained for the
same percentage if a normal distribution is assumed (Empirical Rule).
A. shorter than
B. wider than
C. the same as
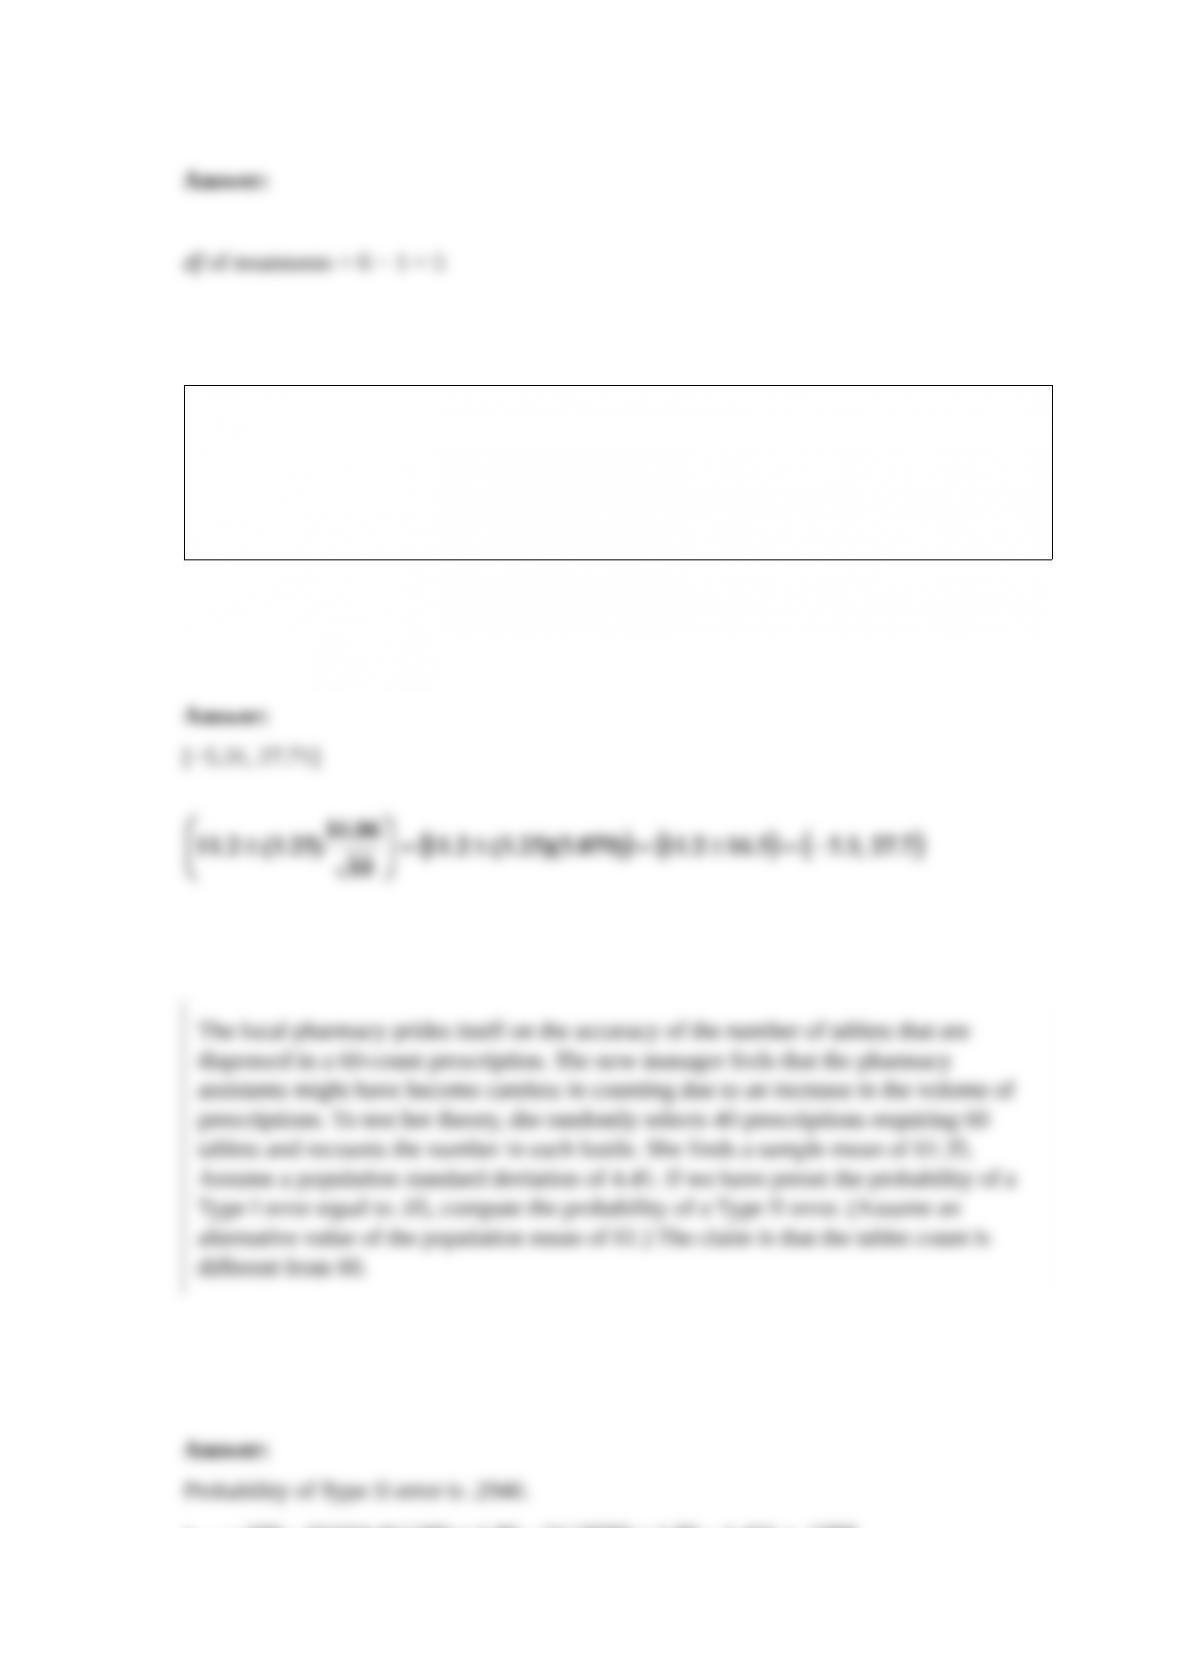
A company has developed a new ink-jet cartridge for its printer that it believes has a
longer lifetime on average than the one currently being produced. To investigate its
length of life, 240 of the new cartridges were tested by counting the number of
high-quality printed pages each was able to produce. The sample mean and standard
deviation were determined to be 1511.4 pages and 35.7 pages, respectively. The
historical average lifetime for cartridges produced by the current process is 1502.5
pages. At α = .05, test the claim that the new cartridge has a longer lifetime using the
critical value rule.
Based on a random sample of 25 units of product X, the average weight is 102 lb and
the sample standard deviation is 10 lb. We would like to decide whether there is enough
evidence to establish that the average weight for the population of product X is greater
than 100 lb. Assume the population is normally distributed. What is the value of the test
statistic to test the claim?

It has been hypothesized that, on average, employees spend one hour a day playing
video games at work. To test this at her company, a manager takes a random sample of
35 employees, who showed a mean time of 55 minutes per day, with an assumed
population standard deviation of 5 minutes. Calculate the test statistic.
Consider the one-way ANOVA table.
Source df Sum of Squares
Model 3 213.88125
Error 20 11.208333
Total 23 225.0895
What is the mean square error?
Consider a standard deck of 52 playing cards, a randomly selected card from the deck,
and the following events: R = red, B = black, A = ace, N = nine, D = diamond, and C =
club.
Are N and C mutually exclusive?
A. Yes, mutually exclusive.
B. No, not mutually exclusive.
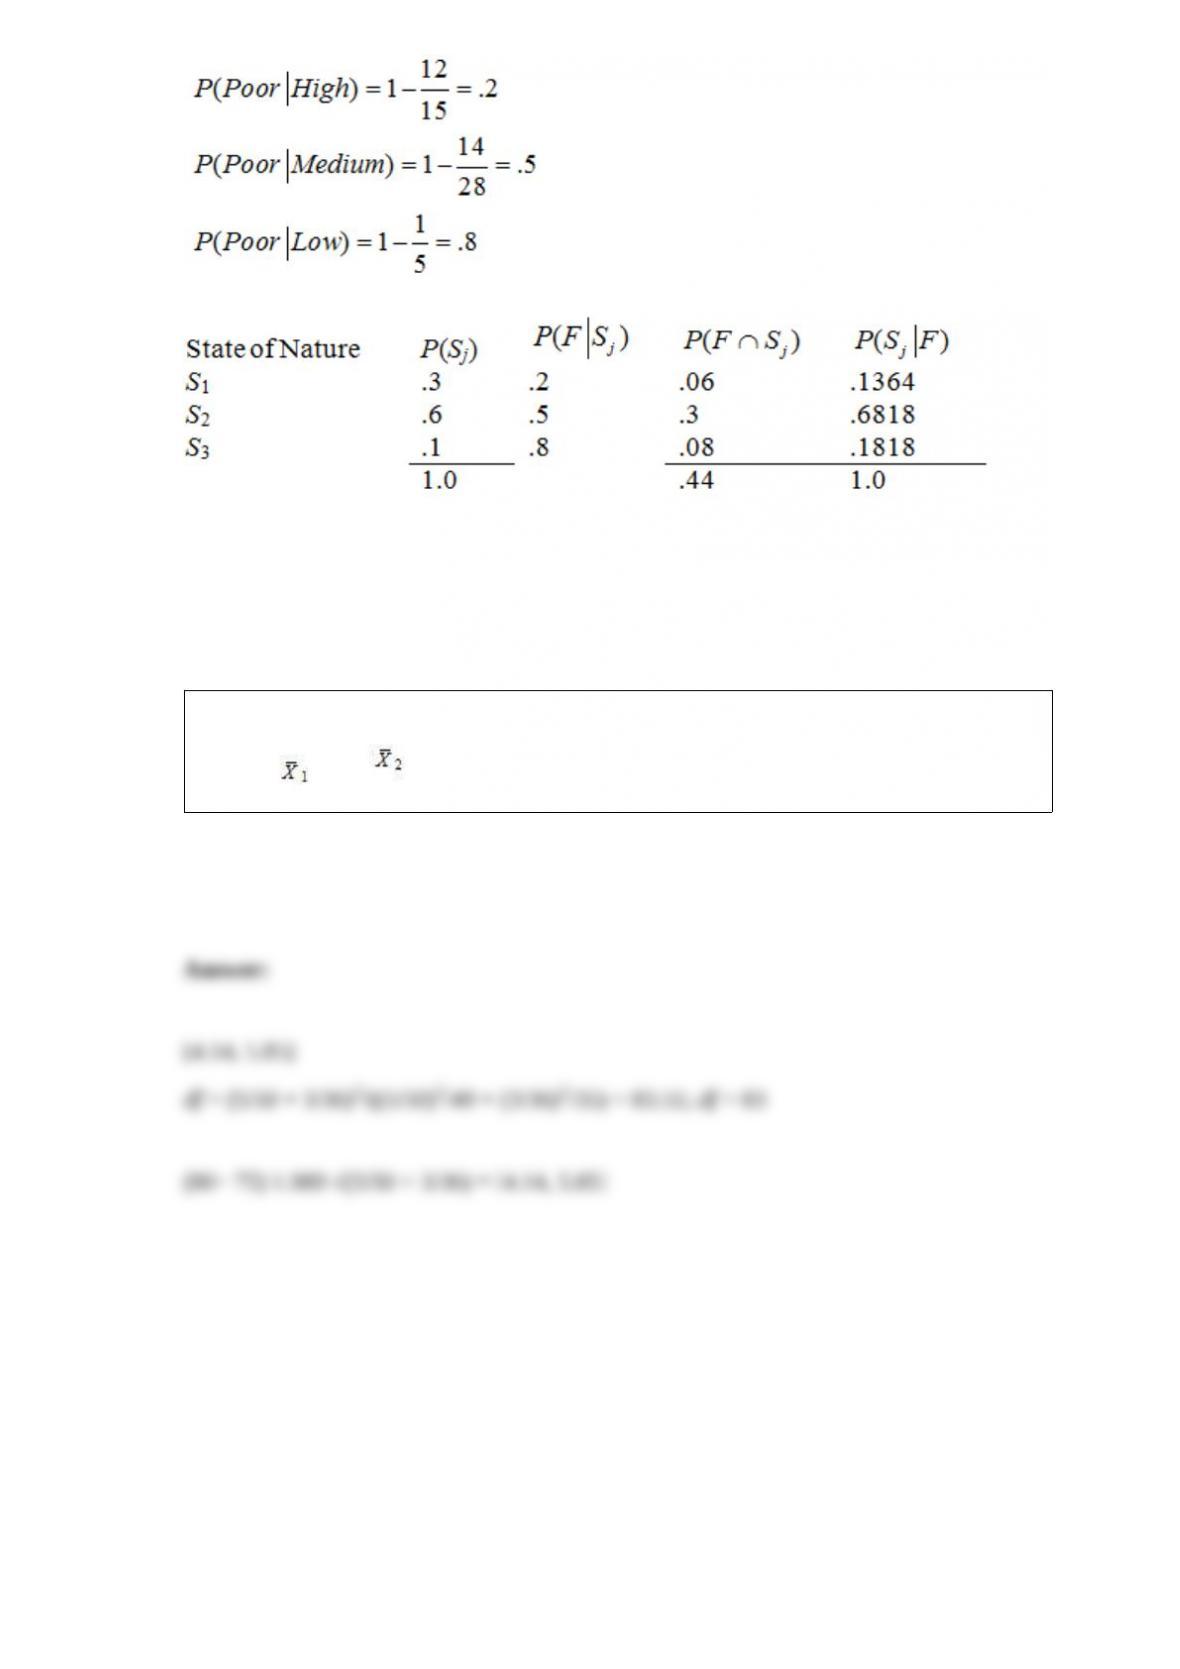
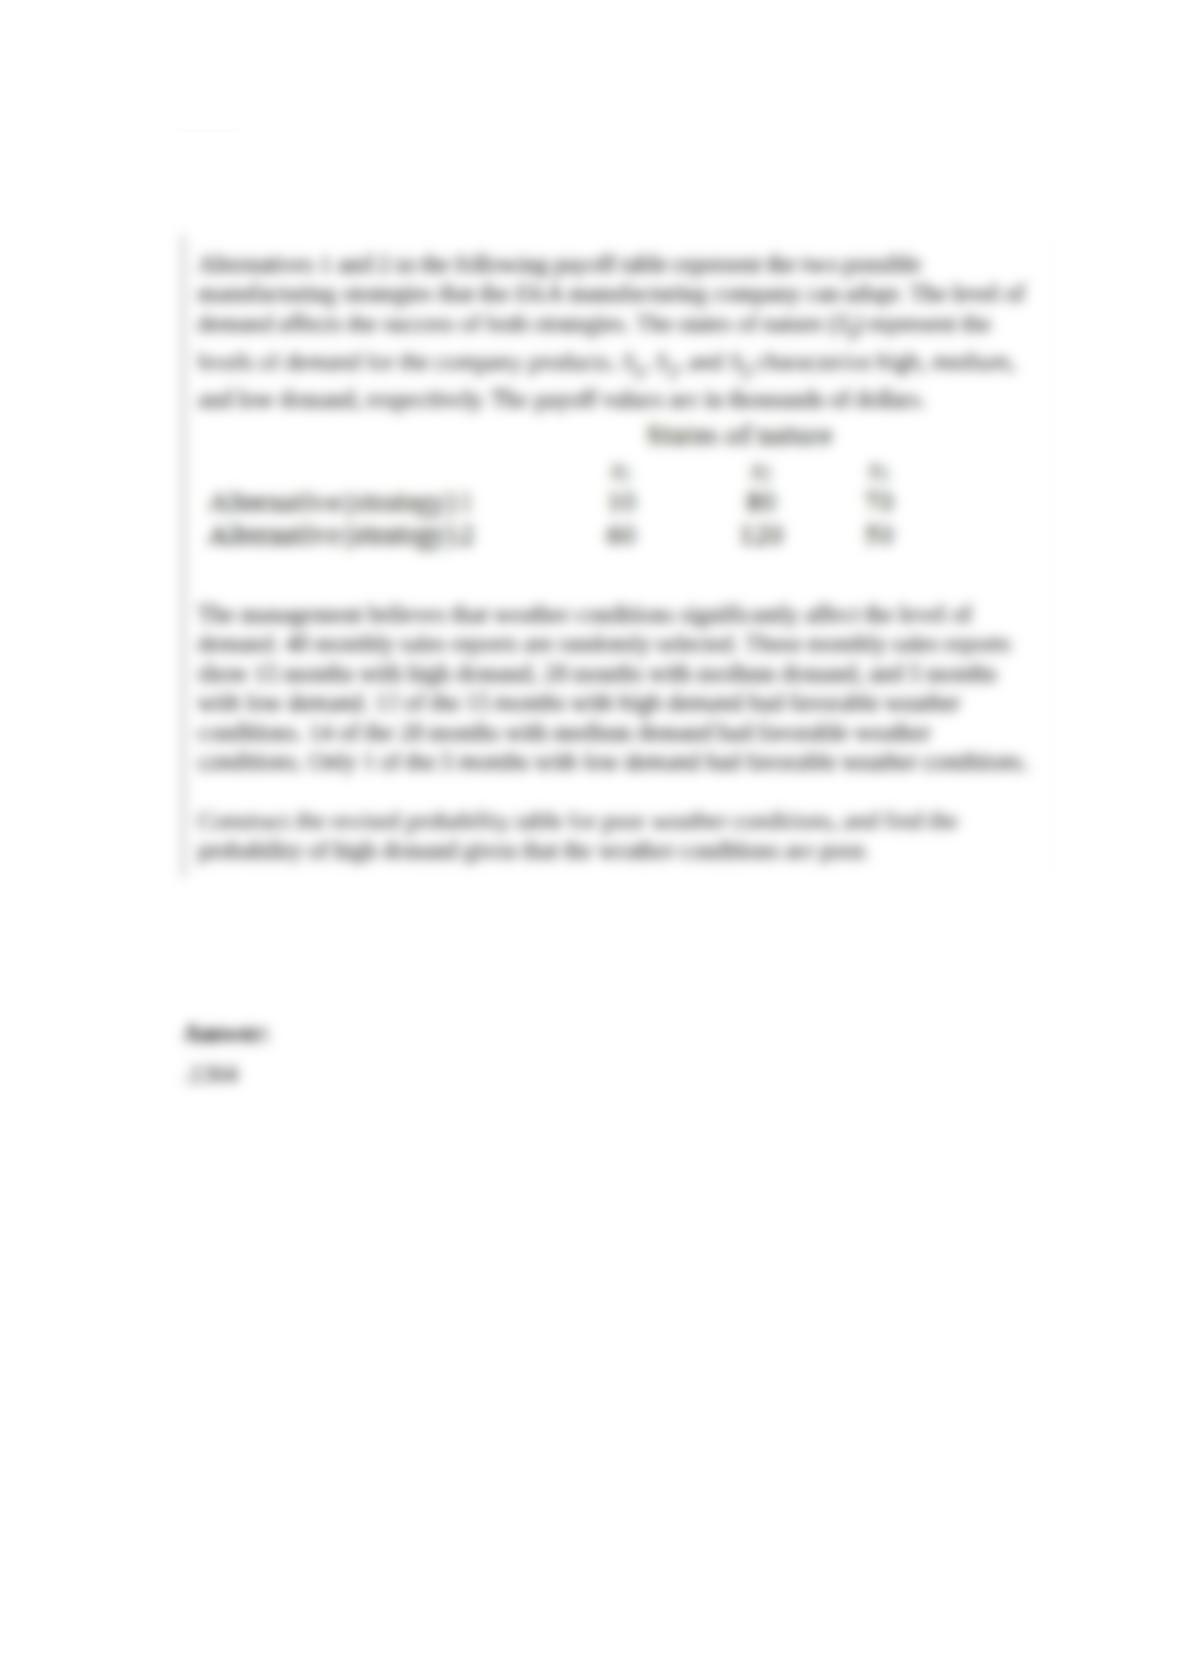
Alternatives 1 and 2 in the following payoff table represent the two possible
manufacturing strategies that the EKA manufacturing company can adopt. The level of
demand affects the success of both strategies. The states of nature (SI) represent the
levels of demand for the company products. S1, S2, and S3 characterize high, medium,
and low demand, respectively. The payoff values are in thousands of dollars.
The management believes that weather conditions significantly affect the level of
demand. 48 monthly sales reports are randomly selected. These monthly sales reports
show 15 months with high demand, 28 months with medium demand, and 5 months
with low demand. 12 of the 15 months with high demand had favorable weather
conditions. 14 of the 28 months with medium demand had favorable weather
conditions. Only 1 of the 5 months with low demand had favorable weather conditions.
Based on this information, the prior probabilities have been revised. If the weather
conditions are favorable, P(S1) = .4286, P(S2) = .5357, and P(S3) = .0357; and if the
weather conditions are poor, P(S1) = .1364, P(S2) = .6818, and P(S3) = .1818. It is also
determined that the probability of favorable weather is 0.56 and the probability of poor
weather is 0.44.
Carry out a preposterior analysis and, using the revised probabilities, determine (1) the
expected monetary value when the weather conditions are favorable and (2) the
expected monetary value when the weather conditions are poor.
When testing H0: σ12 ≤ σ22 and HA: σ12> σ22, where s12 = .004, s22 = .002, n1 = 4, and
n2 = 7 at α = .05, what is the decision on H0?
Do not reject the null hypothesis.
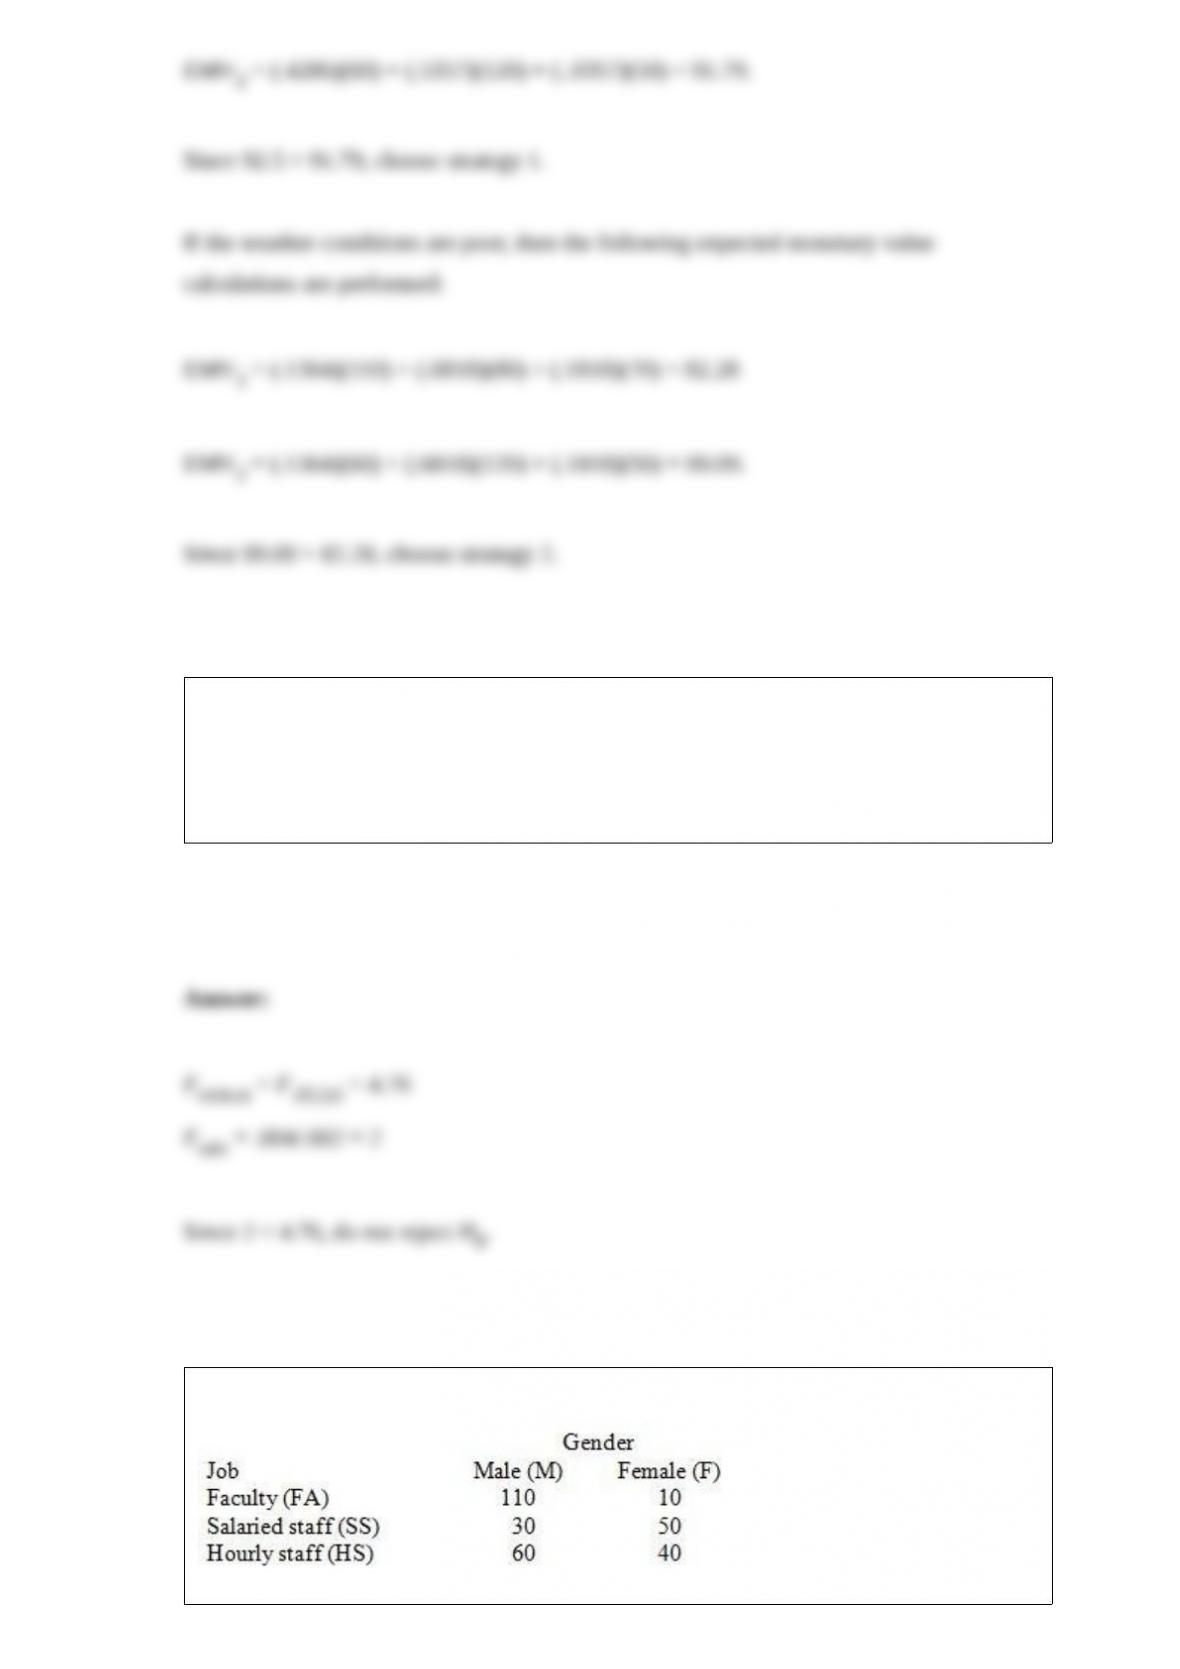
Employees of a local university have been classified according to gender and job type.
Are gender and type of job statistically independent?
A. Yes
B. No
ANOVA table
An experiment was performed on a certain metal to determine if the strength is a
function of heating time. The simple linear regression equation is = 1 + 1X. The time
is in minutes and the strength is measured in pounds per square inch. The 95 percent
confidence interval for the slope is from .564 to 1.436. Can we reject β1 = 0?
What is the degrees of freedom treatment (between-group variation) of a completely
randomized design (one-way) ANOVA test with 4 groups and 15 observations per each
group?
A data set with 7 observations yielded the following. Use the simple linear regression
model.
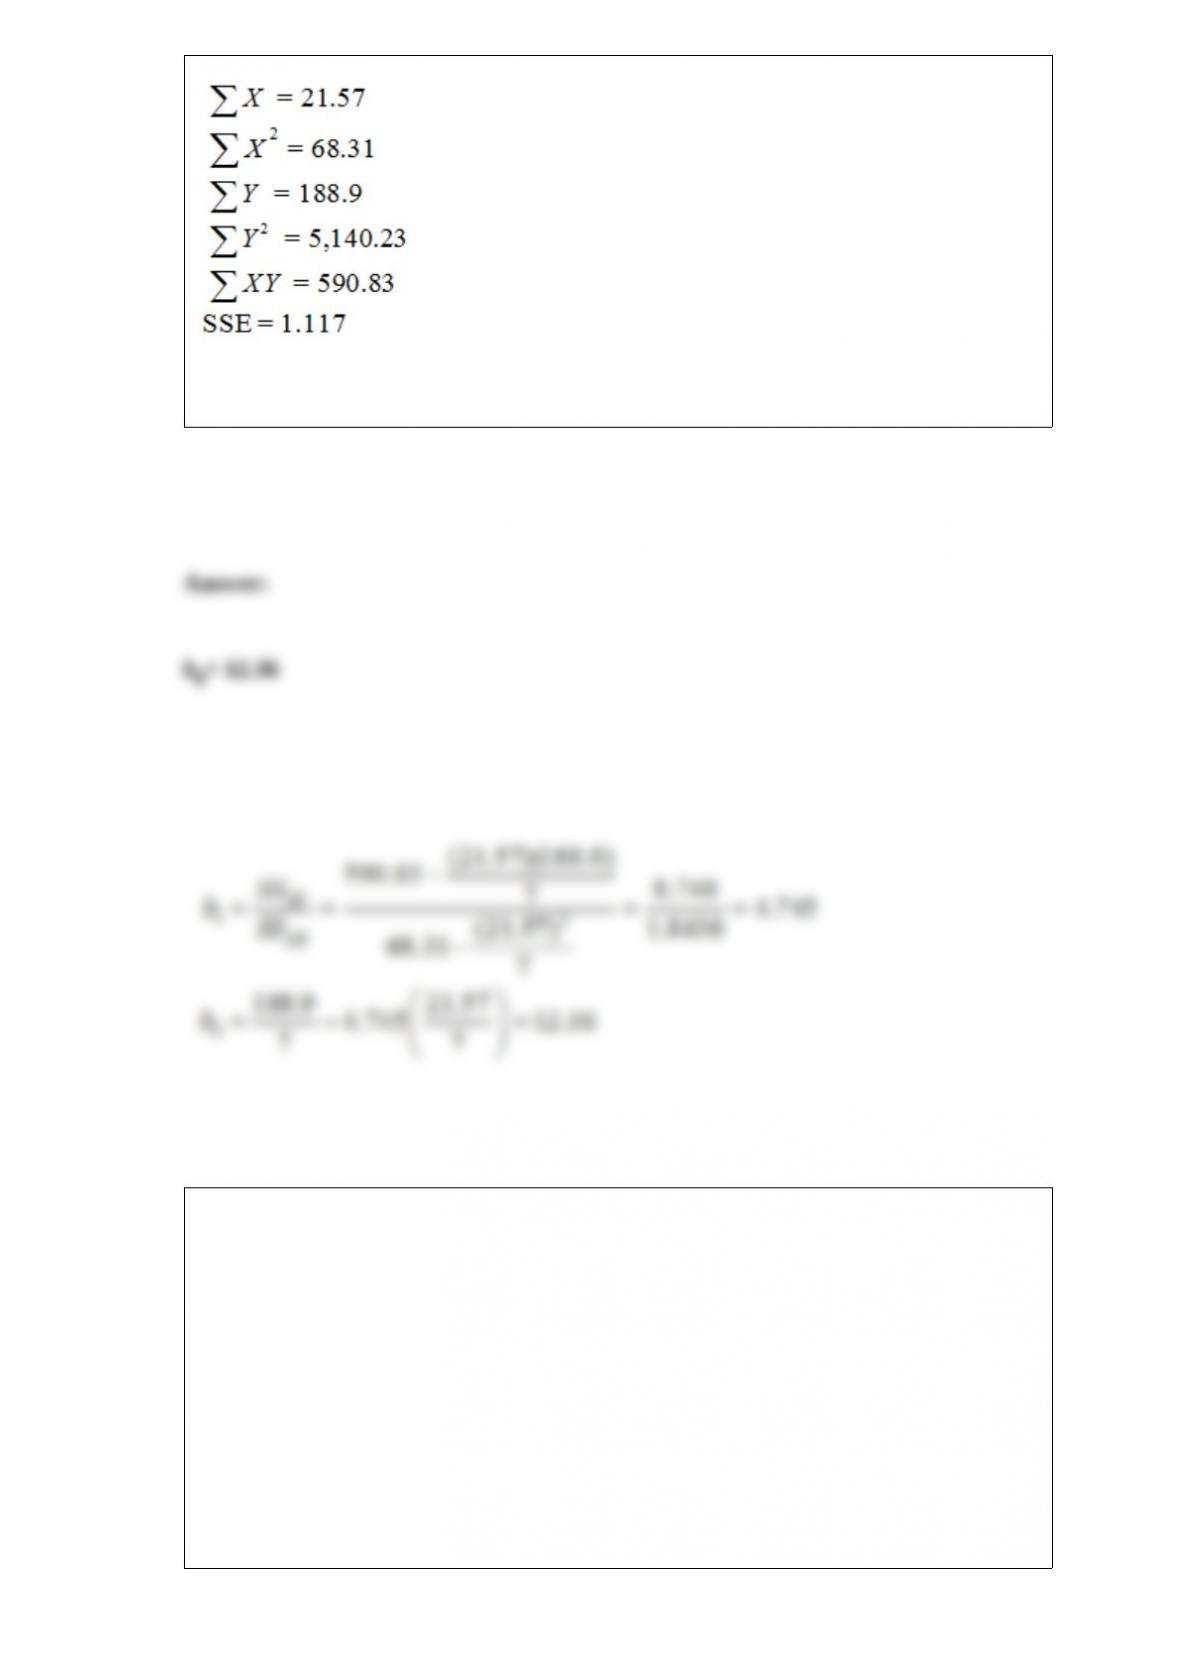
Find the estimated y-intercept.
Consider the following partial analysis of variance table from a randomized block
design with 10 blocks and 6 treatments.
Source SS
Treatments 2,477.53
Blocks 3,180.48
Error 11,661.38
Total
What is the treatment mean square?
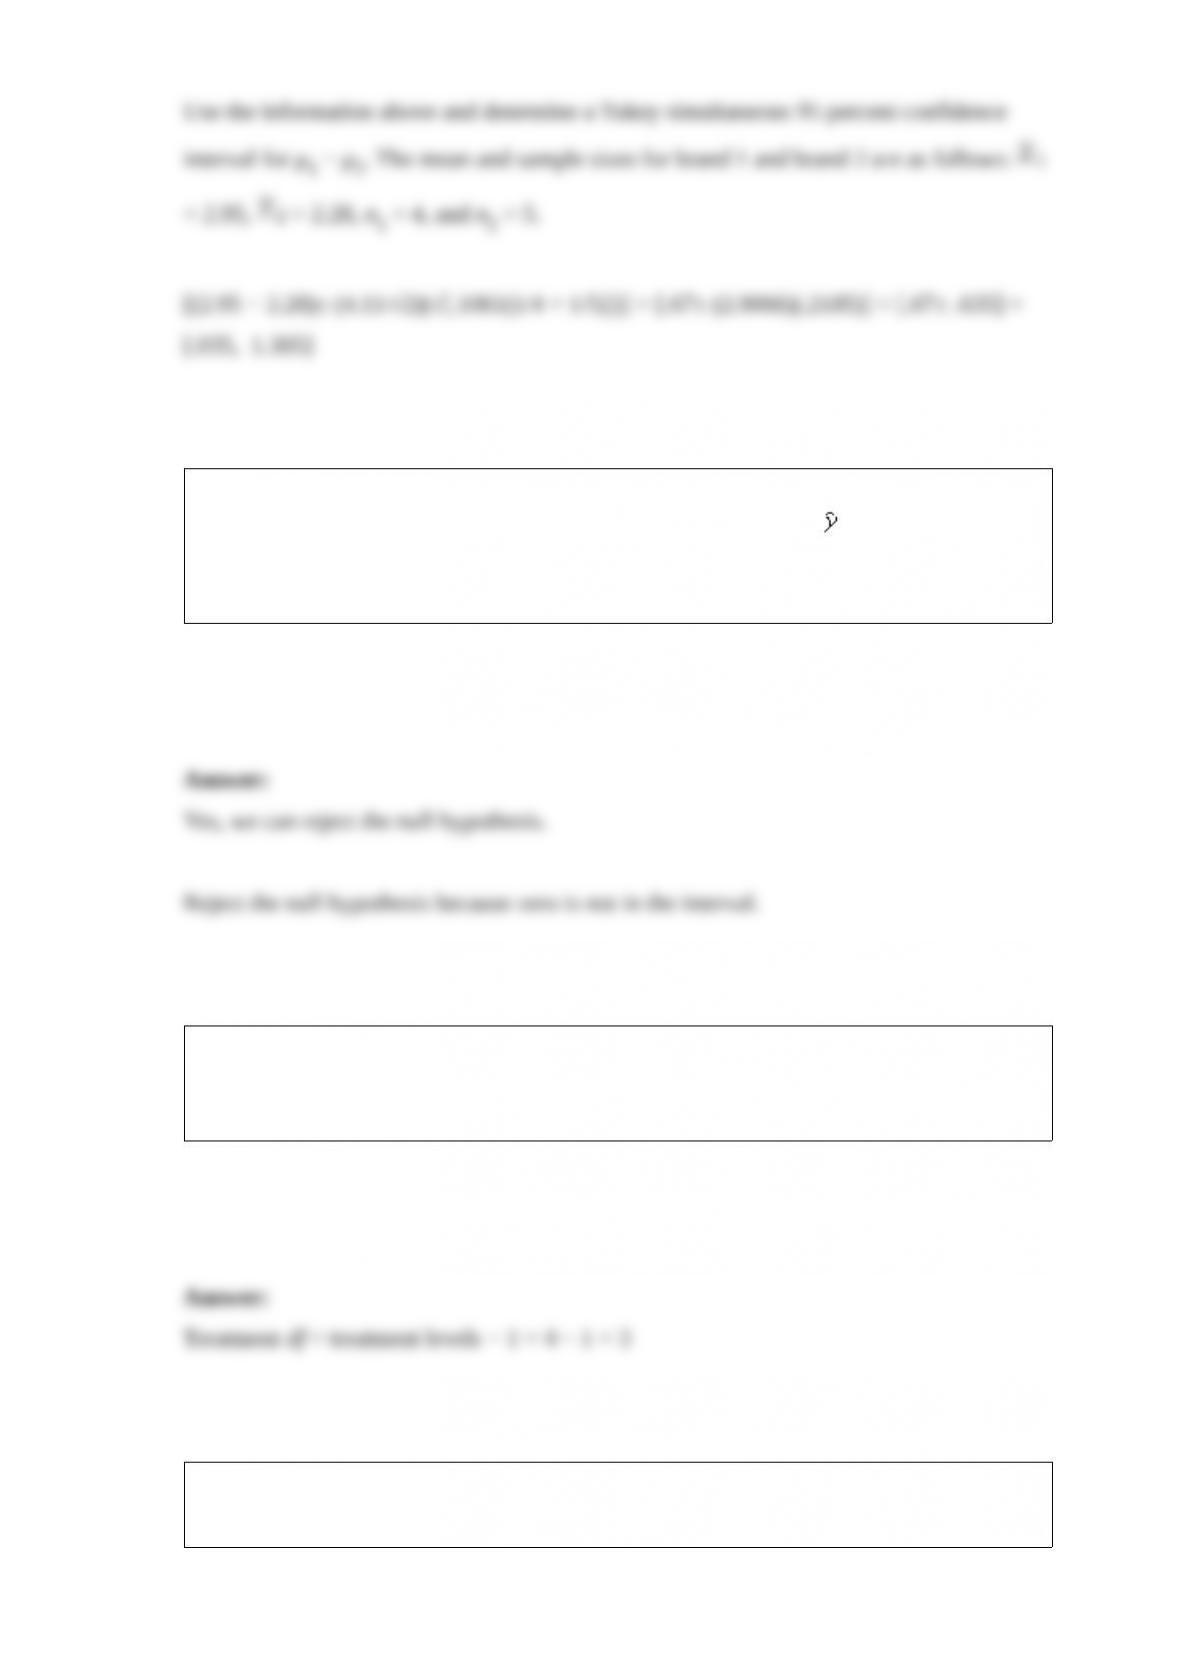
A test of mathematical ability is given to a random sample of 10 eighth-grade students
before and after they complete a semester-long basic mathematics course. The mean
score before the course was 119.60, and after the course the mean score was 130.80.
The standard deviation of the difference is 16.061. Calculate a 99 percent confidence
interval.
Alternatives 1 and 2 in the following payoff table represent the two possible
manufacturing strategies that the EKA manufacturing company can adopt. The level of
demand affects the success of both strategies. The states of nature (SI) represent the
levels of demand for the company products. S1, S2, and S3 characterize high, medium,
and low demand, respectively. The payoff values are in thousands of dollars.
The management believes that weather conditions significantly affect the level of
demand. 48 monthly sales reports are randomly selected. These monthly sales reports
show 15 months with high demand, 28 months with medium demand, and 5 months
with low demand. 12 of the 15 months with high demand had favorable weather
conditions. 14 of the 28 months with medium demand had favorable weather
conditions. Only 1 of the 5 months with low demand had favorable weather conditions.
Construct the revised probability table for poor weather conditions, and find the
probability of high demand given that the weather conditions are poor.