
If the price elasticity of demand for a good is 2, then a 10 percent decrease in the
quantity demanded must be the result of
a. a 0.2 percent increase in the price.
b. a 2.5 percent increase in the price.
c. a 5 percent increase in the price.
d. a 20 percent increase in the price.
Ford Motor Company announces that next month it will offer $3,000 rebates on new
Mustangs. As a result of this information, today’s demand curve for Mustangs
a. shifts to the right.
b. shifts to the left.
c. shifts either to the right or to the left, but we cannot determine the direction of the
shift from the given information.
d. will not shift; rather, the demand curve for Mustangs will shift to the right next
month.
If sellers do not adjust their quantities supplied at all in response to a change in price,
a. advances in technology must be prevalent.
b. the time period under consideration must be very long.
c. supply is perfectly elastic.
d. supply is perfectly inelastic.
The Earned Income Tax Credit is an example of a
a. minimumwage law.
b. price ceiling.
c. wage subsidy.
d. rent subsidy.
Figure 811
Refer to Figure 811. The size of the tax is represented by the
a. length of the line segment connecting points A and B.
b. length of the line segment connecting points A and C.
c. length of the line segment connecting points B and C.
d. area of the triangle bounded by the points A, B, and C.
Where can an economy not produce?
a. inside its production possibilities frontier

b. on its production possibilities frontier
c. outside its production possibilities frontier
d. at the endpoints of its production possibilities frontier
To fully understand how taxes affect economic wellbeing, we must
a. assume that economic wellbeing is not affected if all tax revenue is spent on goods
and services for the people who are being taxed.
b. compare the taxes raised in the United States with those raised in other countries,
especially France.
c. compare the reduced welfare of buyers and sellers to the amount of revenue the
government raises.
d. take into account the fact that almost all taxes reduce the welfare of buyers, increase
the welfare of sellers, and raise revenue for the government.
If a tax shifts the demand curve upward (or to the right), we can infer that the tax was
levied on
a. buyers of the good.
b. sellers of the good.
c. both buyers and sellers of the good.
d. We cannot infer anything because the shift described is not consistent with a tax.
Table 323

Assume that the farmer and the rancher can switch between producing pork and
producing tomatoes at a constant rate.
Labor Hours Needed to Make 1 Pound of Pounds Produced in 24 Hours
PorkTomatoesPorkTomatoes
Farmer6348
Rancher4466
Refer to Table 323. Assume that the farmer and the rancher each has 24 labor hours
available. If each person spends all his time producing the good in which he has a
comparative advantage and trade takes place at a price of 1 pound of pork for 2 pounds
of tomatoes, then
a. the farmer and the rancher will both gain from this trade.
b. the farmer will gain from this trade, but the rancher will not.
c. the rancher will gain from this trade, but the farmer will not.
d. neither the farmer nor the rancher will gain from this trade.
Consider the market for gasoline. Buyers
a. and sellers would lobby for a price ceiling.
b. and sellers would lobby for a price floor.
c. would lobby for a price ceiling, whereas sellers would lobby for a price floor.
d. would lobby for a price floor, whereas sellers would lobby for a price ceiling.
Table 73
The only four consumers in a market have the following willingness to pay for a good:
BuyerWillingness to Pay
Carlos$15
Quilana$25
Wilbur$35
Mingla$45
Refer to Table 73. If the market price for the good is $20, who will purchase the good?
a. Mingla only
b. Carlos and Quilana only
c. Quilana and Wilbur only
d. Quilana, Wilbur, and Mingla only
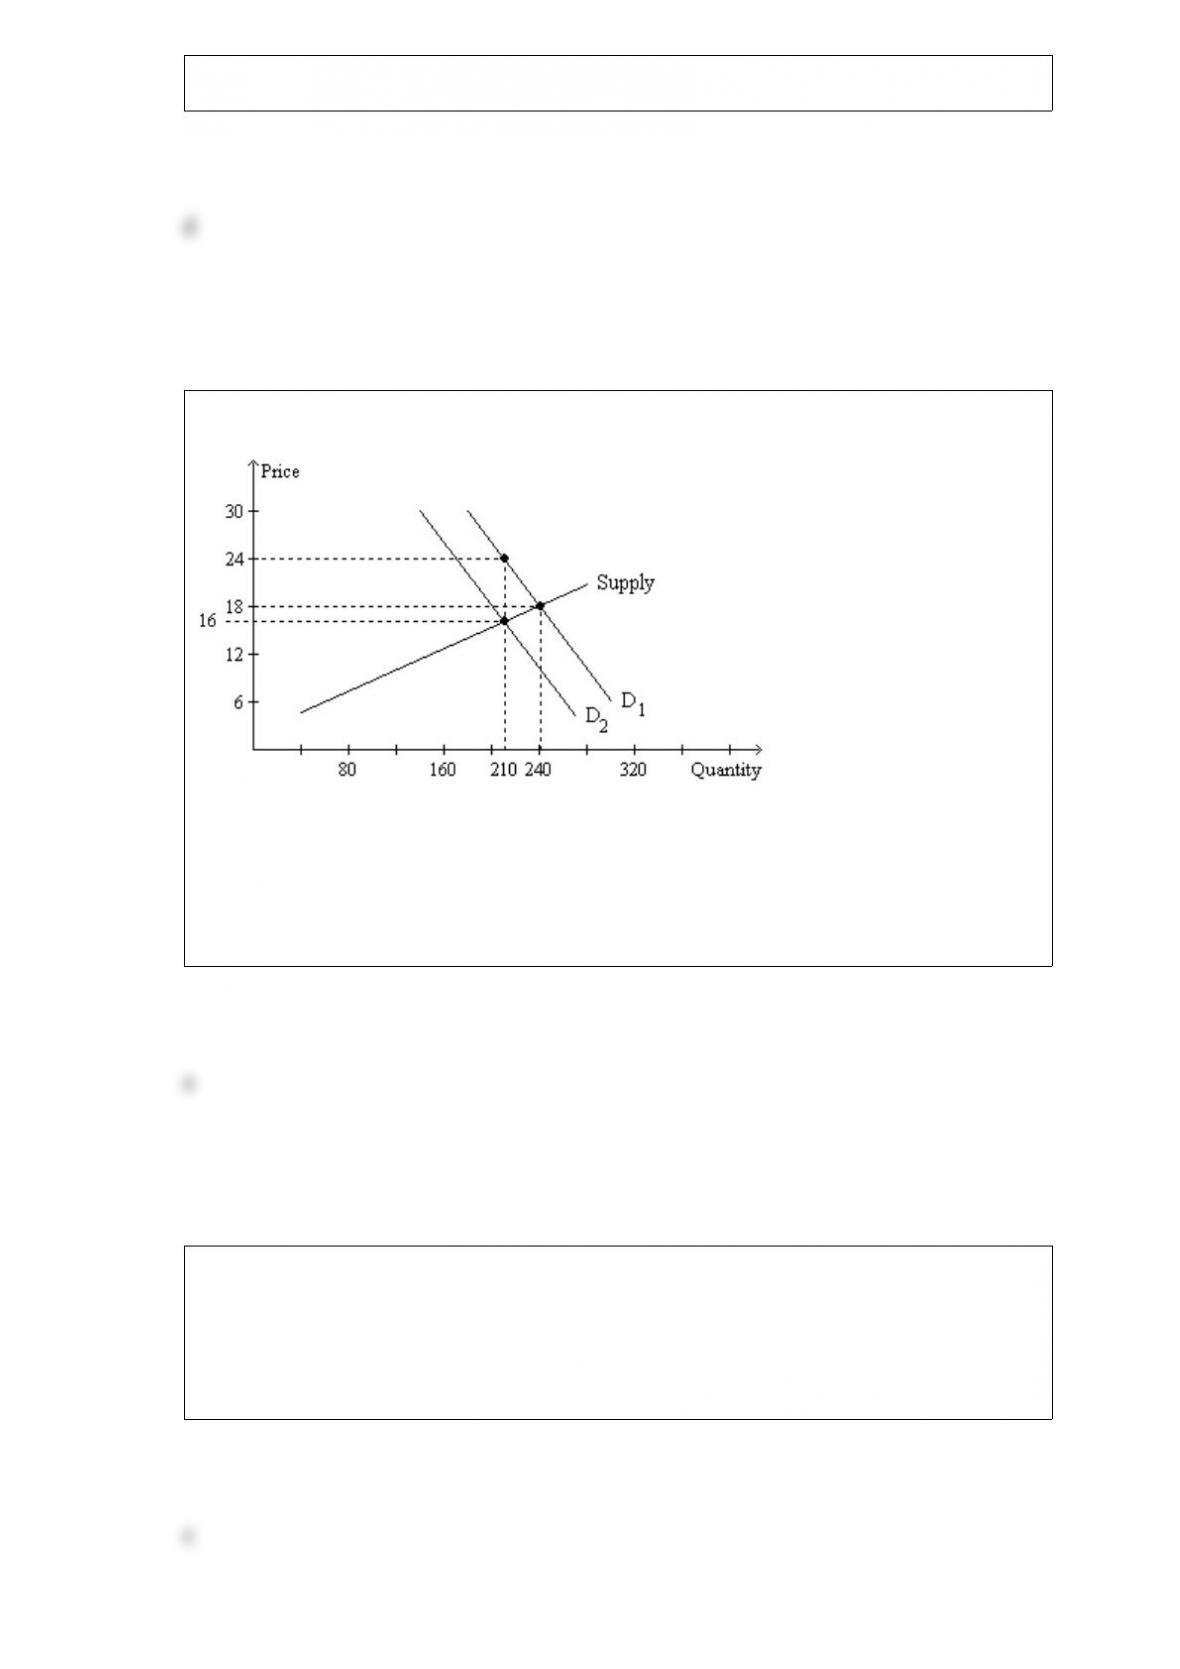
Figure 624
Refer to Figure 624. The price paid by buyers after the tax is imposed is
a. $24.
b. $21.
c. $18.
d. $16.
To obtain the market demand curve for a product, sum the individual demand curves
a. vertically.
b. diagonally.
c. horizontally.
d. and then average them.

People are likely to respond to a policy change
a. only if they think the policy is a good one.
b. only if the policy change changes the costs of their behavior.
c. only if the policy change changes the benefits of their behavior.
d. if the policy changes either the costs or benefits of their behavior.
Economists use the word equality to describe a situation in which
a. each member of society has the same income.
b. each member of society has access to abundant quantities of goods and services,
regardless of his or her income.
c. society is getting the maximum benefits from its scarce resources.
d. society’s resources are used efficiently.
If the tax on a good is doubled, the deadweight loss of the tax
a. increases by 50 percent.
b. doubles.
c. triples.
d. quadruples.
Figure 84
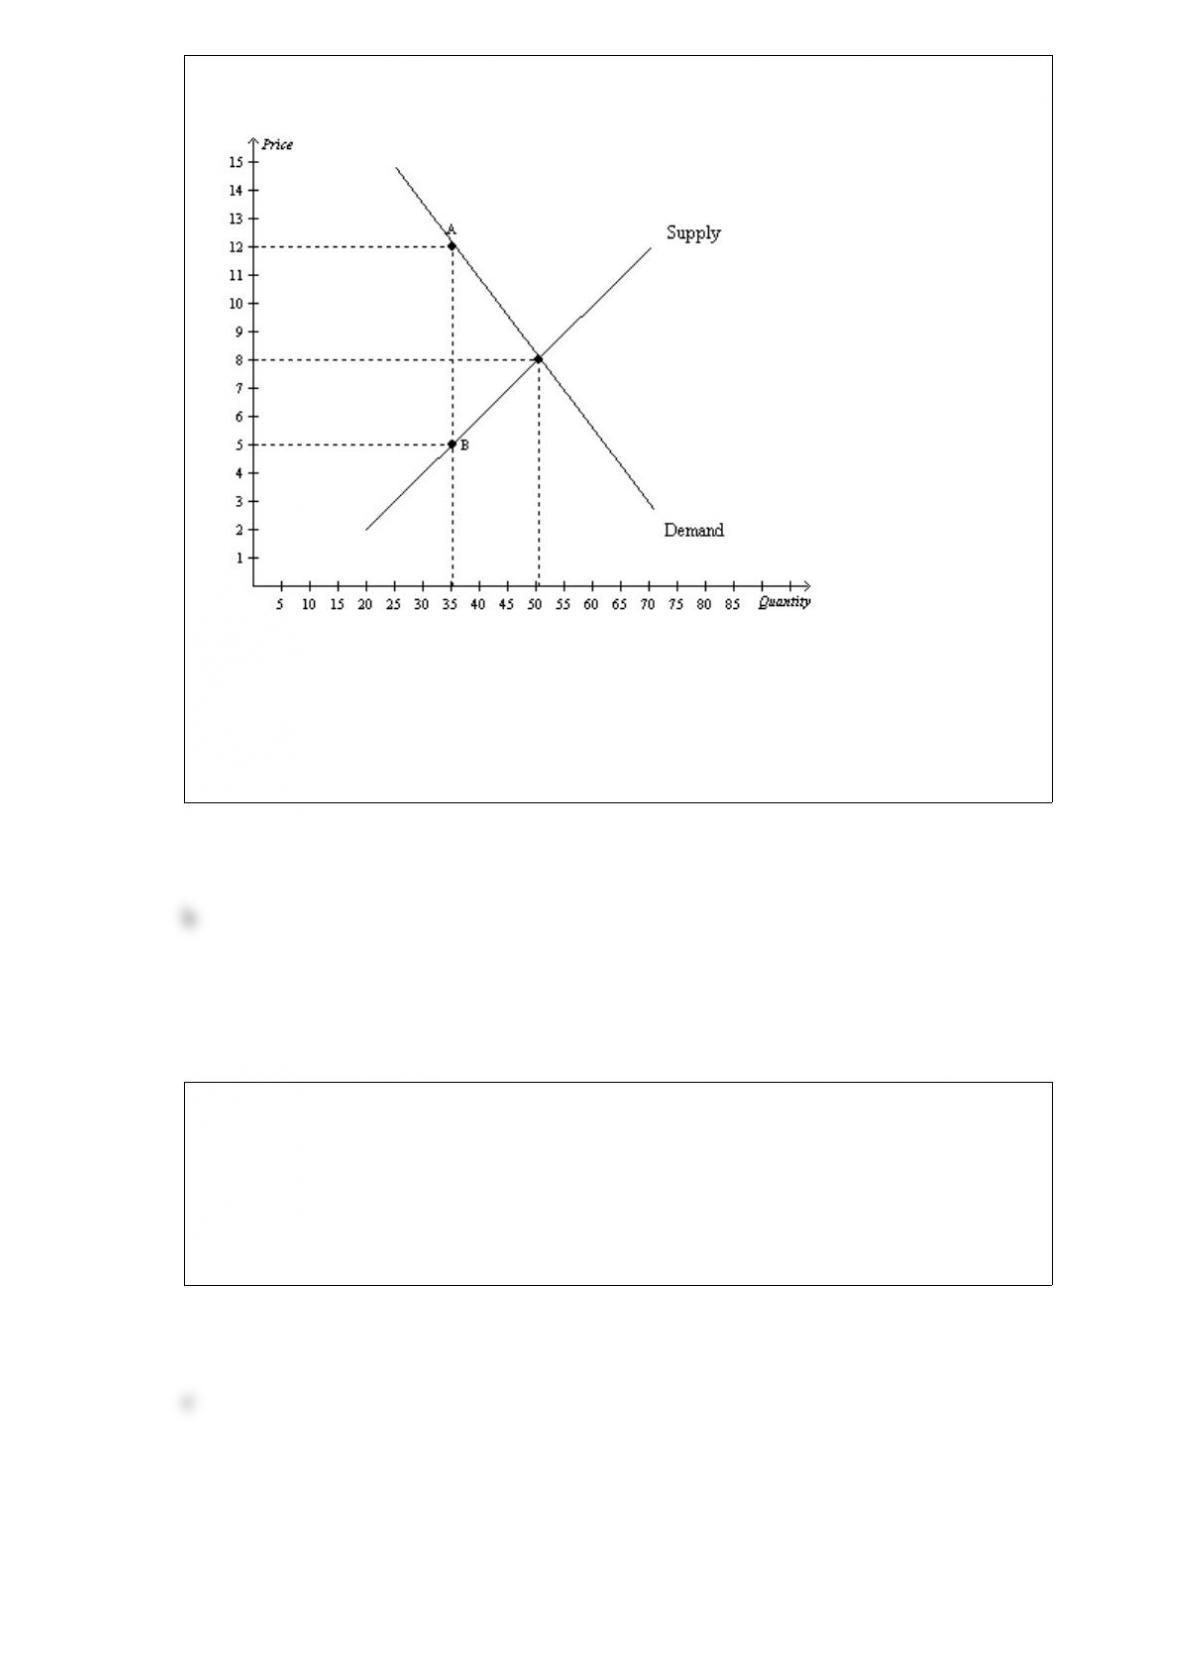
The vertical distance between points A and B represents a tax in the market.
Refer to Figure 84. The equilibrium price before the tax is imposed is
a. $12, and the equilibrium quantity is 35.
b. $8, and the equilibrium quantity is 50.
c. $5, and the equilibrium quantity is 35.
d. $5, and the equilibrium quantity is 50.
Which of the following is not an advantage of a multilateral approach to free trade over
a unilateral approach?
a. A multilateral approach can reduce trade restrictions abroad as well as at home.
b. A multilateral approach has the potential to result in freer trade.
c. A multilateral approach requires the agreement of two or more nations.
d. A multilateral approach may have political advantages.

The supply of oil is likely to be
a. inelastic in both the short run and long run.
b. elastic in both the short run and long run.
c. elastic in the short run and inelastic in the long run.
d. inelastic in the short run and elastic in the long run.
Assume the supply curve for cigars is a typical, upwardsloping straight line, and the
demand curve for cigars is a typical, downwardsloping straight line. Suppose the
equilibrium quantity in the market for cigars is 1,000 per month when there is no tax.
Then a tax of $0.50 per cigar is imposed. The effective price paid by buyers increases
from $1.50 to $1.90 and the effective price received by sellers falls from $1.50 to $1.40.
The government’s tax revenue amounts to $475 per month. Which of the following
statements is correct?
a. The demand for cigars is less elastic than the supply of cigars.
b. The tax causes a decrease in consumer surplus of $390 and a decrease in producer
surplus of $97.50.
c. The deadweight loss of the tax is $12.50.
d. All of the above are correct.
Figure 412
Firm AFirm B
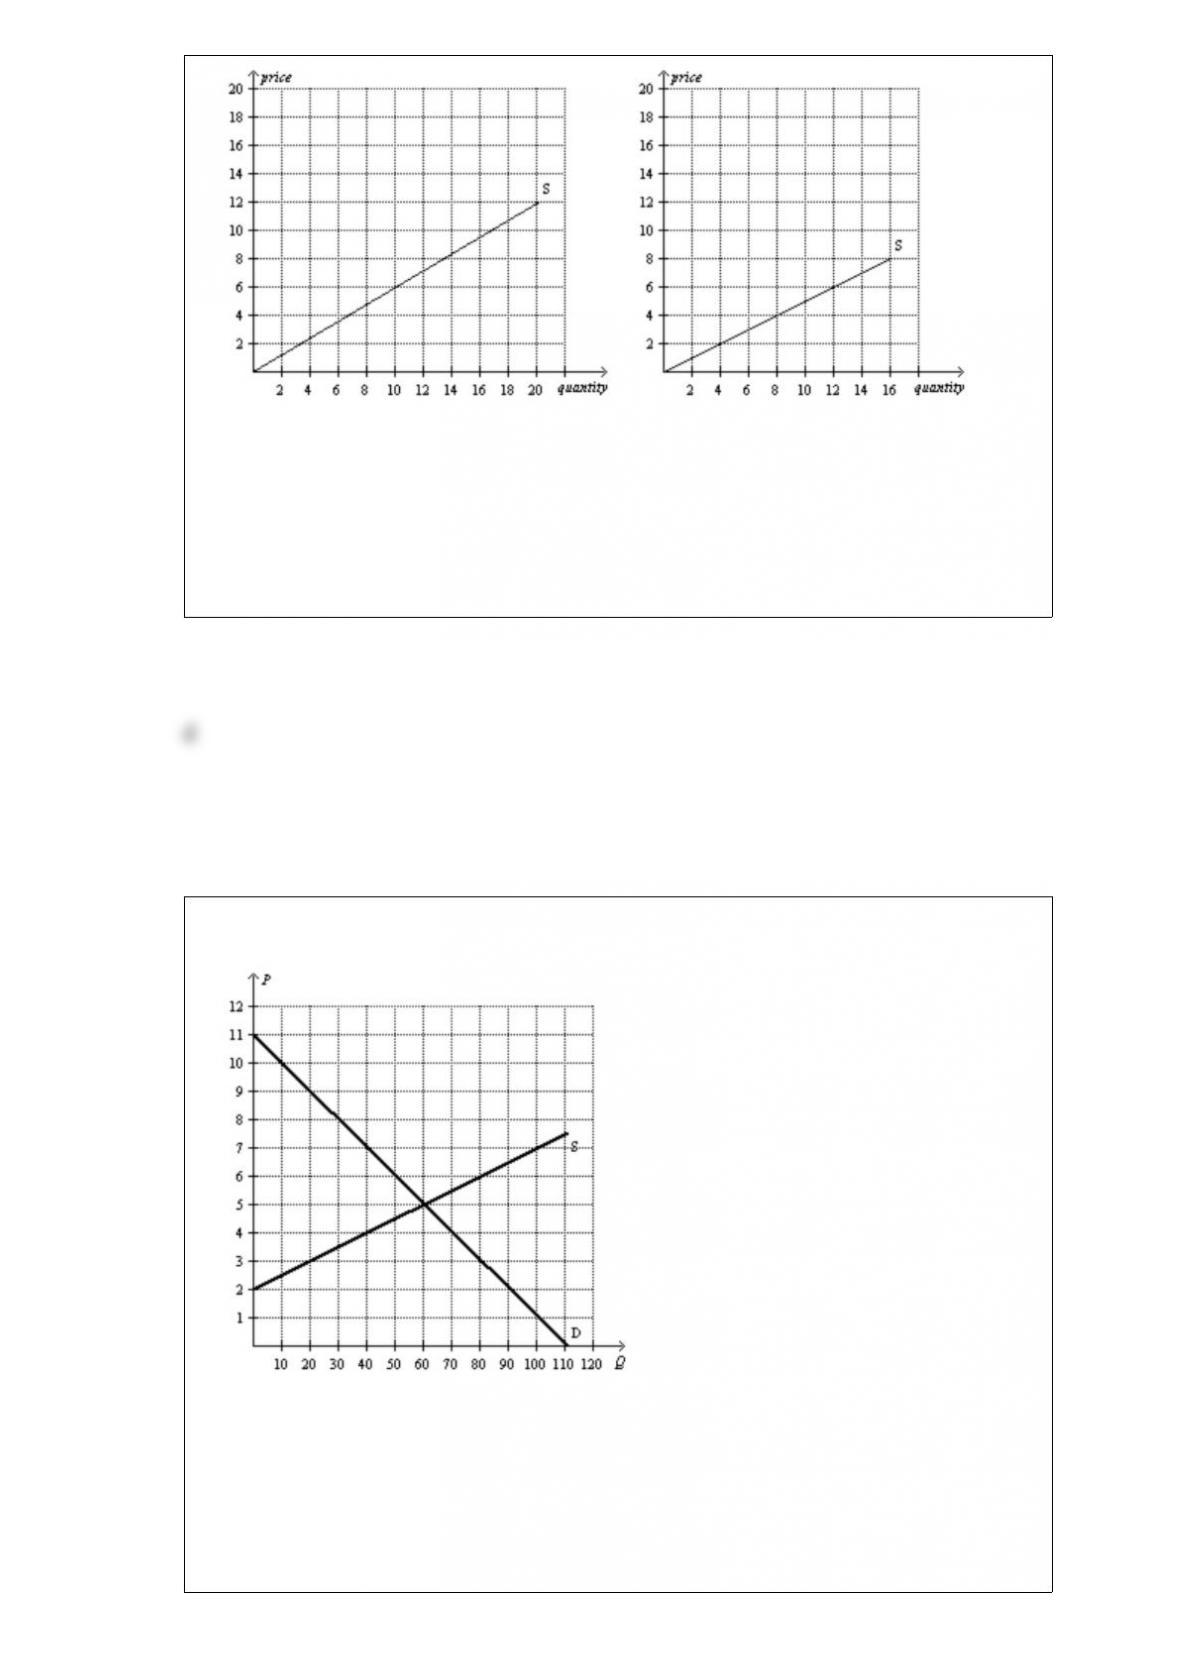
Refer to Figure 412. If these are the only two sellers in the market, then the market
quantity supplied at a price of $8 is
a. 14 units.
b. 15 units.
c. 16 units.
d. 29 units.
Figure 822
Refer to Figure 822. Suppose the government initially imposes a $3 perunit tax on this
good. Now suppose the government is deciding whether to lower the tax to $1.50 or
raise it to $4.50. Which of the following statements is not correct?
a. Compared to the original tax, the larger tax will decrease tax revenue.
b. Compared to the original tax, the smaller tax will decrease deadweight loss.
c. Compared to the original tax, the smaller tax will decrease tax revenue.
d. Compared to the original tax, the larger tax will increase deadweight loss.
If the price elasticity of demand for aluminum foil is 1.45, then a 2.4% decrease in the
price of aluminum foil will increase the quantity demanded of aluminum foil by
a. 1.66%, and aluminum foil sellers’ total revenue will increase as a result.
b. 1.66%, and aluminum foil sellers’ total revenue will decrease as a result.
c. 3.48%, and aluminum foil sellers’ total revenue will increase as a result.
d. 3.48%, and aluminum foil sellers’ total revenue will decrease as a result.
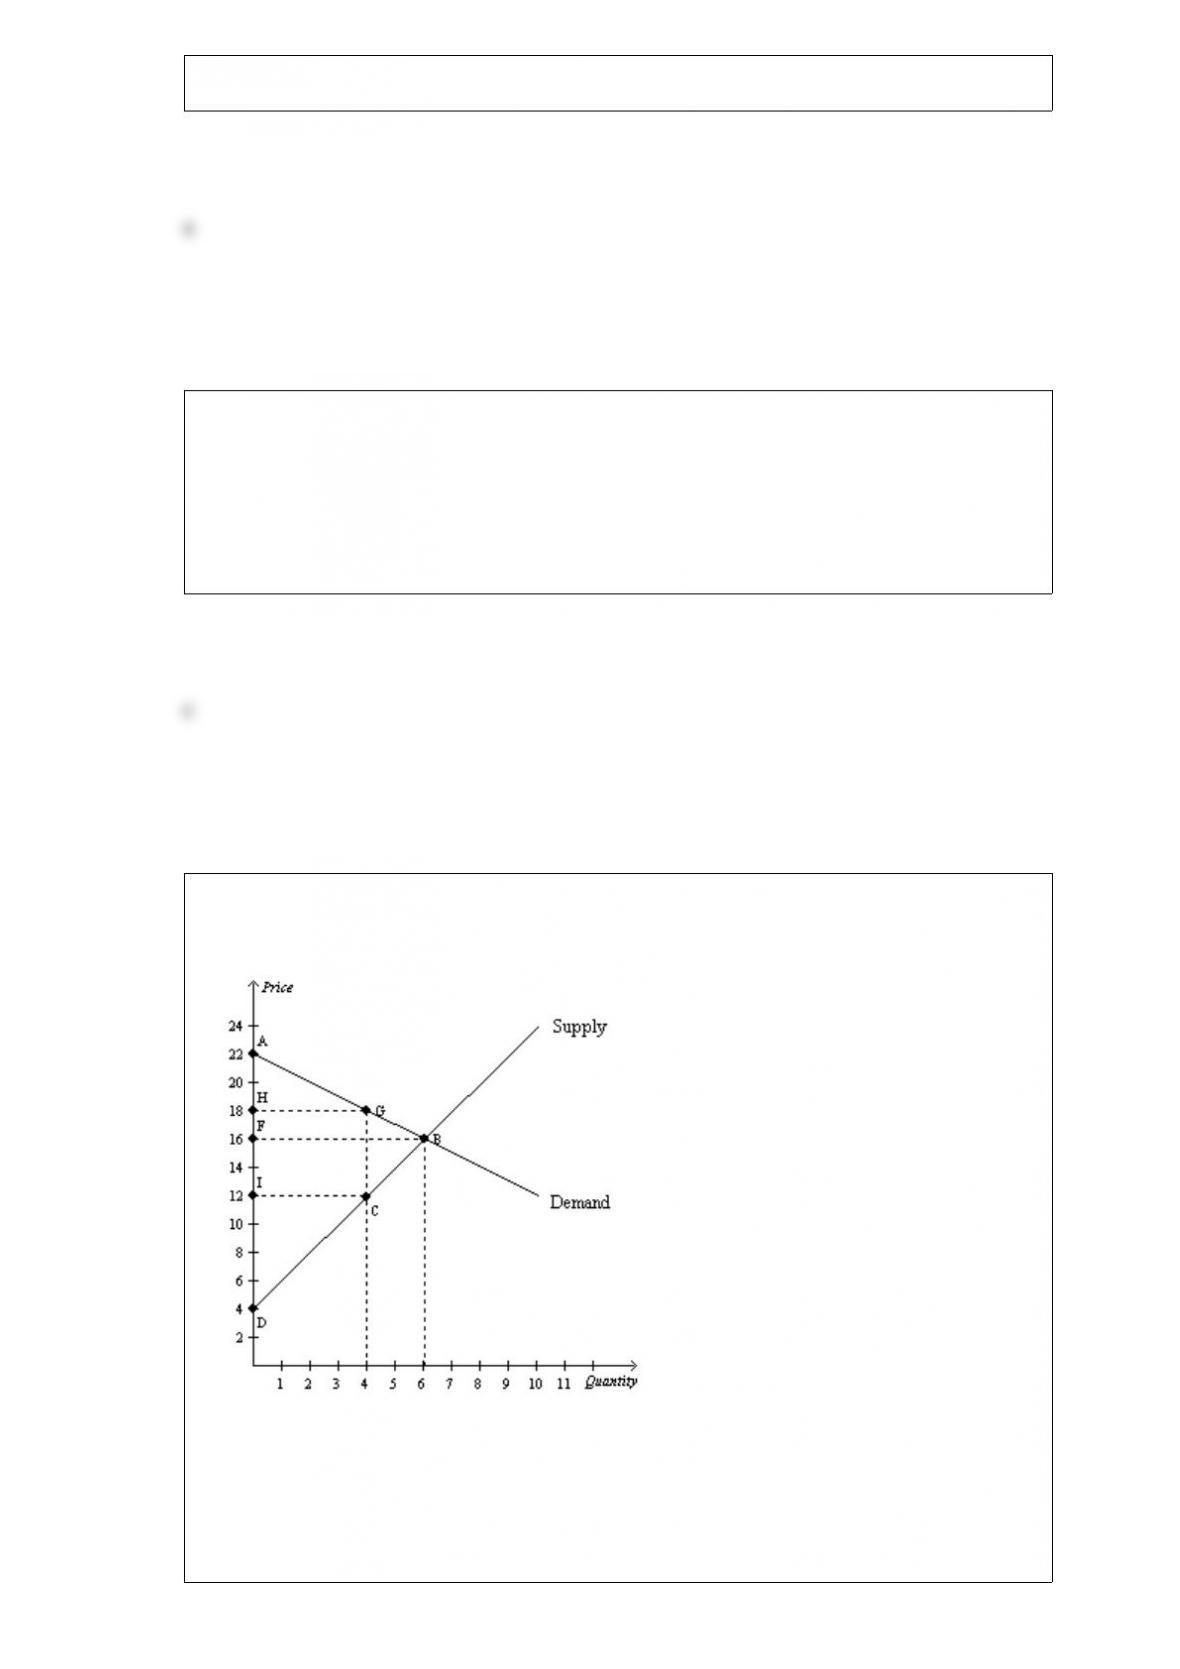
Figure 724
Refer to Figure 724. At equilibrium, producer surplus is measured by the area
a. ABD.
b. ABF.
c. CDI.
d. BDF.

U.S. laws requiring that drivers wear seat belts have resulted in
a. a reduction in both driver deaths and pedestrian deaths.
b. fewer accidents and fewer deaths per accident.
c. fewer driver deaths, fewer accidents and fewer pedestrian deaths.
d. little change in the number of driver deaths, but more accidents and more pedestrian
deaths.
Which of the following is not held constant in a demand schedule?
a. income
b. tastes
c. price
d. expectations
Rent control
a. serves as an example of how a social problem can be alleviated or even solved by
government policies.
b. serves as an example of a price ceiling.
c. is regarded by most economists as an efficient way of helping the poor.
d. is the most efficient way to allocate scarce housing resources.
When income increases the slope of an individual’s demand curve, the demand curve
a. turns positive.
b. becomes undefined.
c. remains negative.
d. becomes infinite.
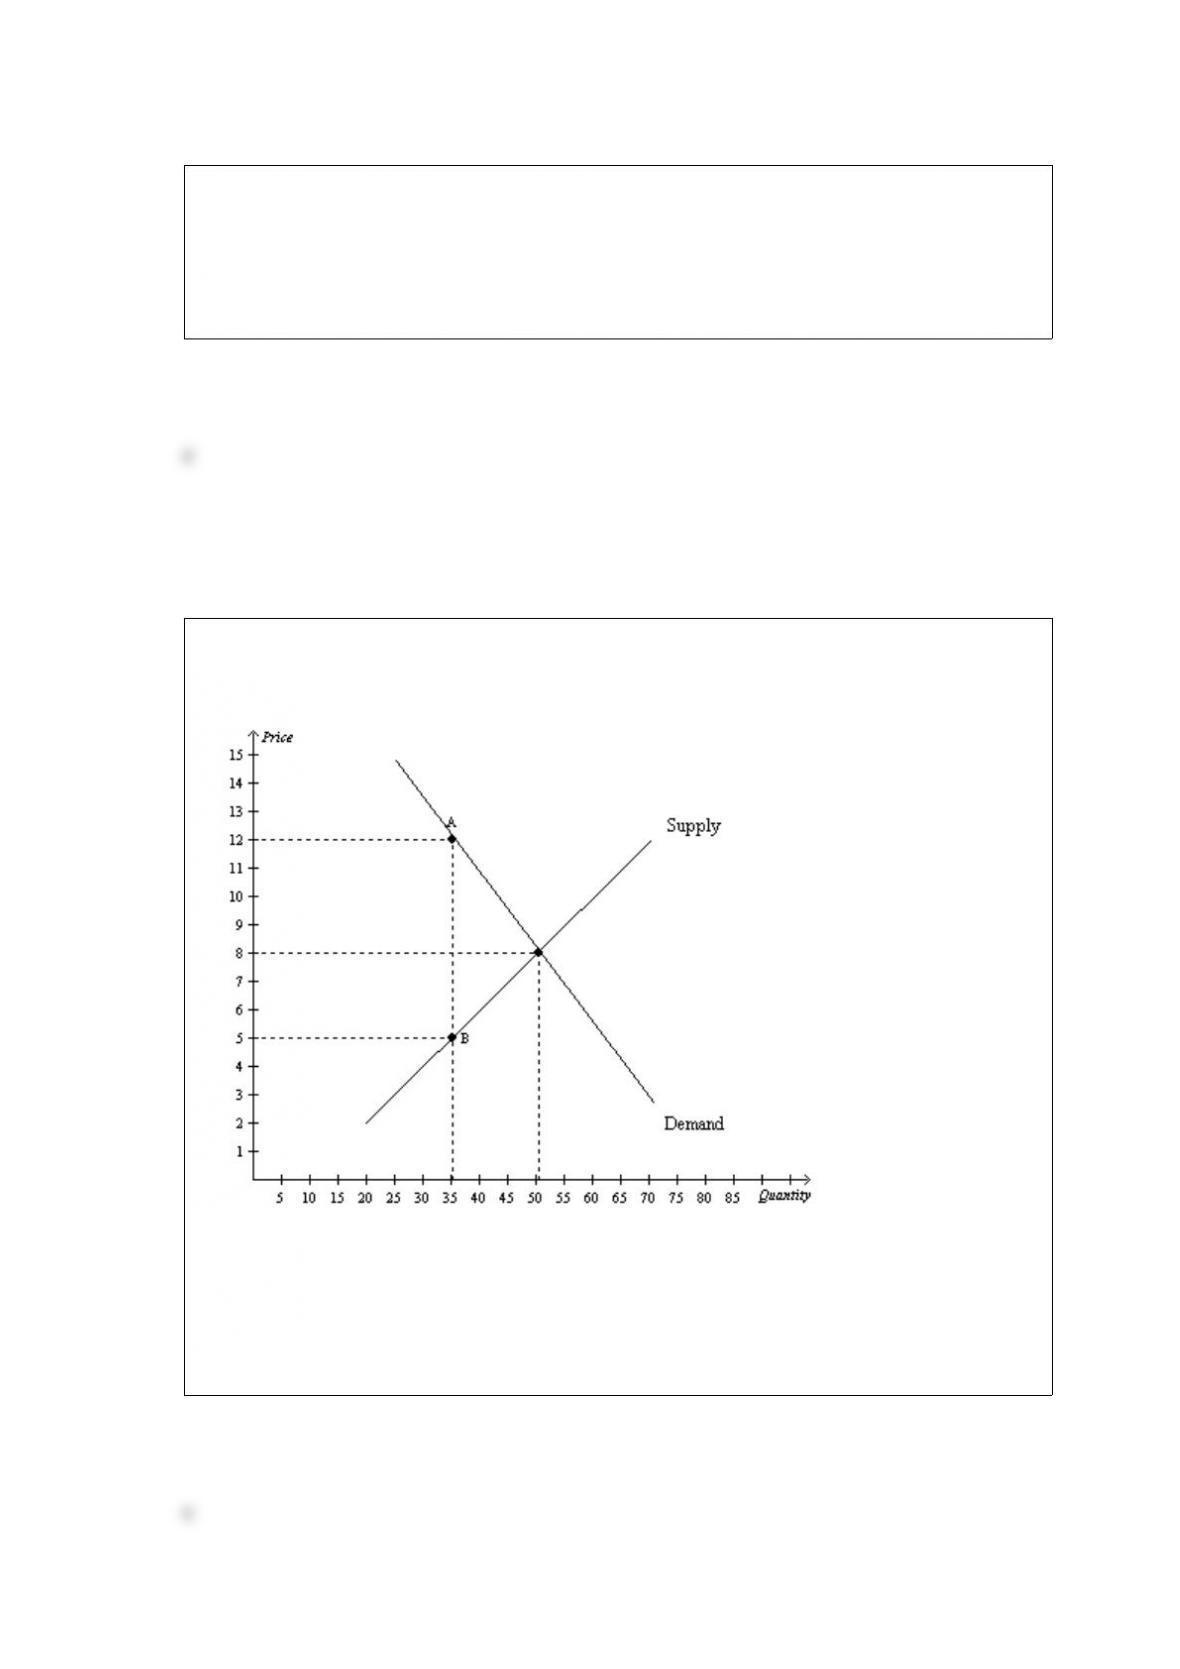
Figure 84
The vertical distance between points A and B represents a tax in the market.
Refer to Figure 84. The amount of deadweight loss as a result of the tax is
a. $35.00.
b. $45.25.
c. $52.50.
d. $105.00.
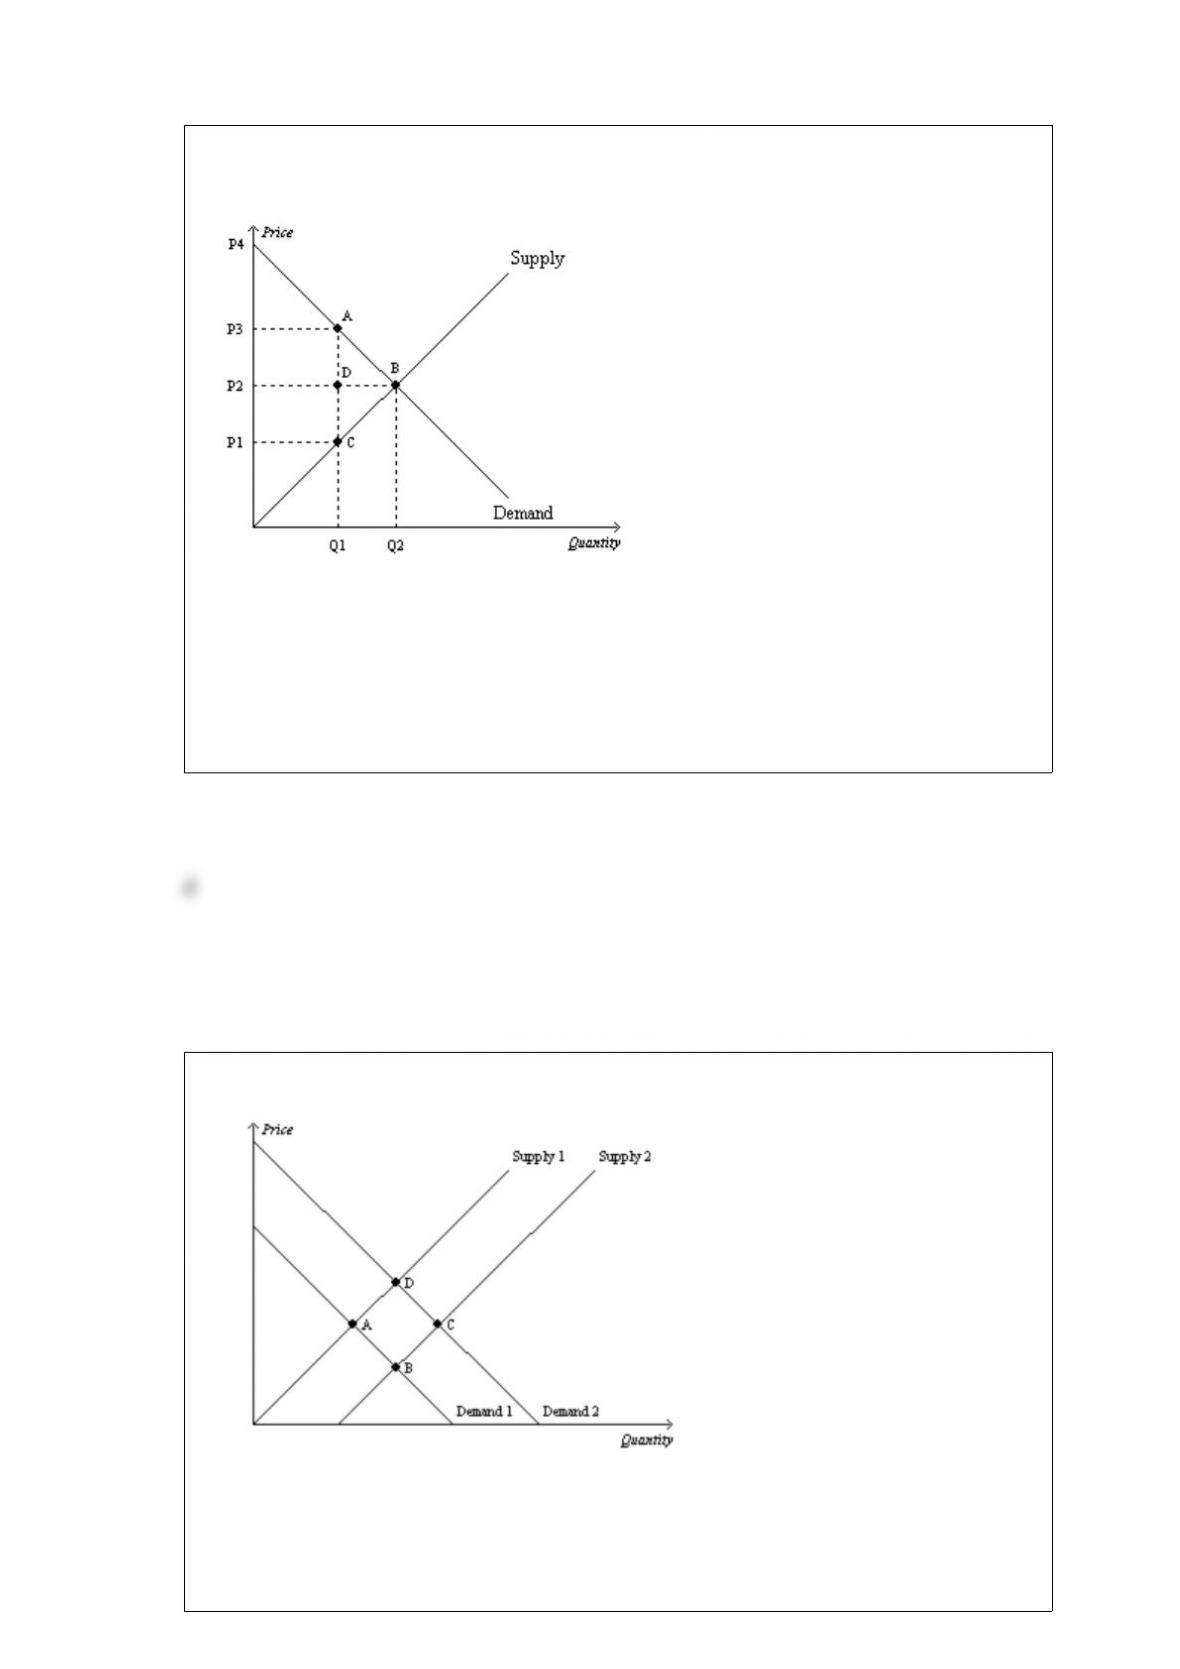
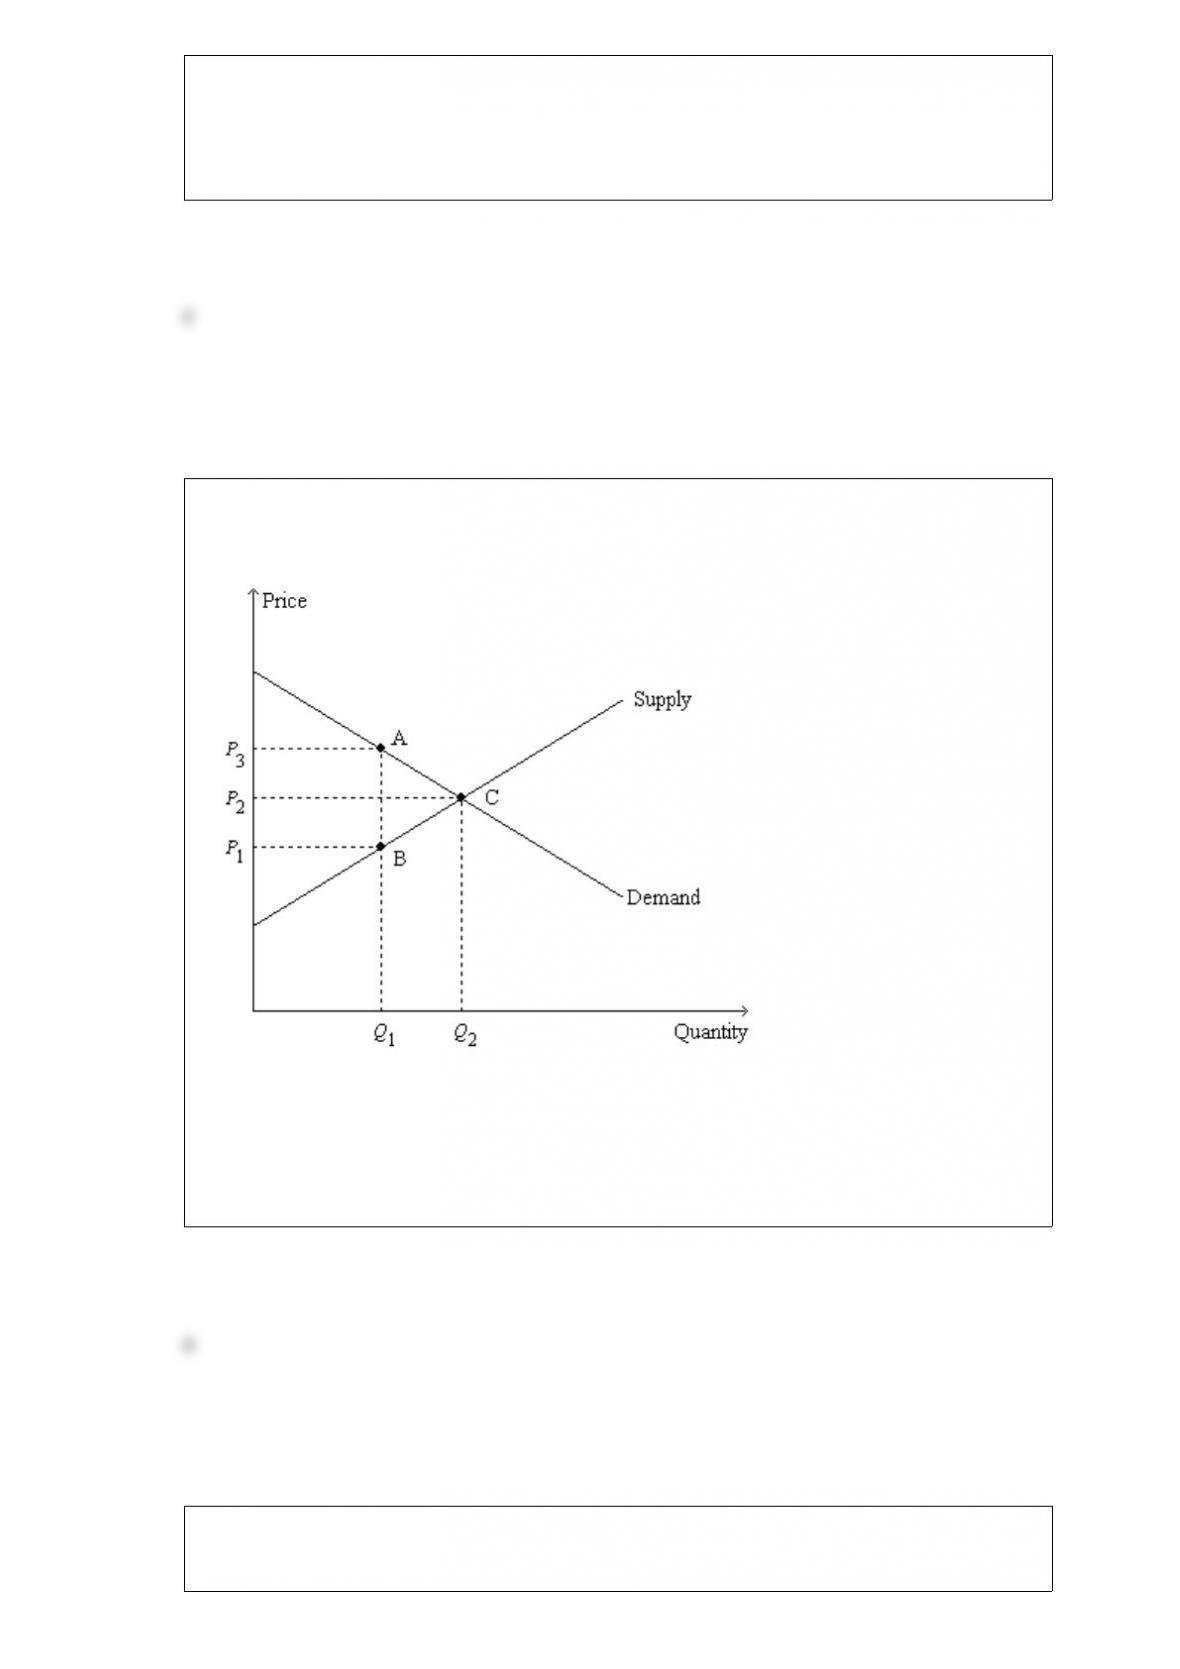
Figure 83
The vertical distance between points A and C represents a tax in the market.
Refer to Figure 83. Which of the following equations is valid for the deadweight loss
of the tax?
a. Deadweight loss = (1/2)(P2 P1)(Q2 + Q1)
b. Deadweight loss = (1/2)(P3 P1)(Q2 + Q1)
c. Deadweight loss = (1/2)(P3 P2)(Q2 Q1)
d. Deadweight loss = (1/2)(P3 P1)(Q2 Q1)
Figure 426
Refer to Figure 426. Which of the following movements would illustrate the effect in
the market for doctor’s visits of an increase in the number of medical students
graduating from medical school and successfully completing their residency programs?
a. Point A to Point B

b. Point C to Point B
c. Point C to Point D
d. Point A to Point D
If the price elasticity of demand for a good is 0.2, then a 3 percent decrease in price
results in a
a. 0.6 percent increase in the quantity demanded.
b. 1.5 percent increase in the quantity demanded.
c. 2 percent increase in the quantity demanded.
d. 6 percent increase in the quantity demanded.
Scenario 92
• For a small country called Boxland, the equation of the domestic demand curve for
cardboard is
,
where represents the domestic quantity of cardboard demanded, in tons, and
represents the price of a ton of cardboard.
• For Boxland, the equation of the domestic supply curve for cardboard is
,
where represents the domestic quantity of cardboard supplied, in tons, and again
represents the price of a ton of cardboard.
Refer to Scenario 92. Suppose the world price of cardboard is $60 and international
trade is allowed. Then Boxland’s consumers demand
a. 110 tons of cardboard and Boxland’s producers supply 120 tons of cardboard.
b. 96 tons of cardboard and Boxland’s producers supply 96 tons of cardboard.
c. 96 tons of cardboard and Boxland’s producers supply 115 tons of cardboard.
d. 80 tons of cardboard and Boxland’s producers supply 120 tons of cardboard.
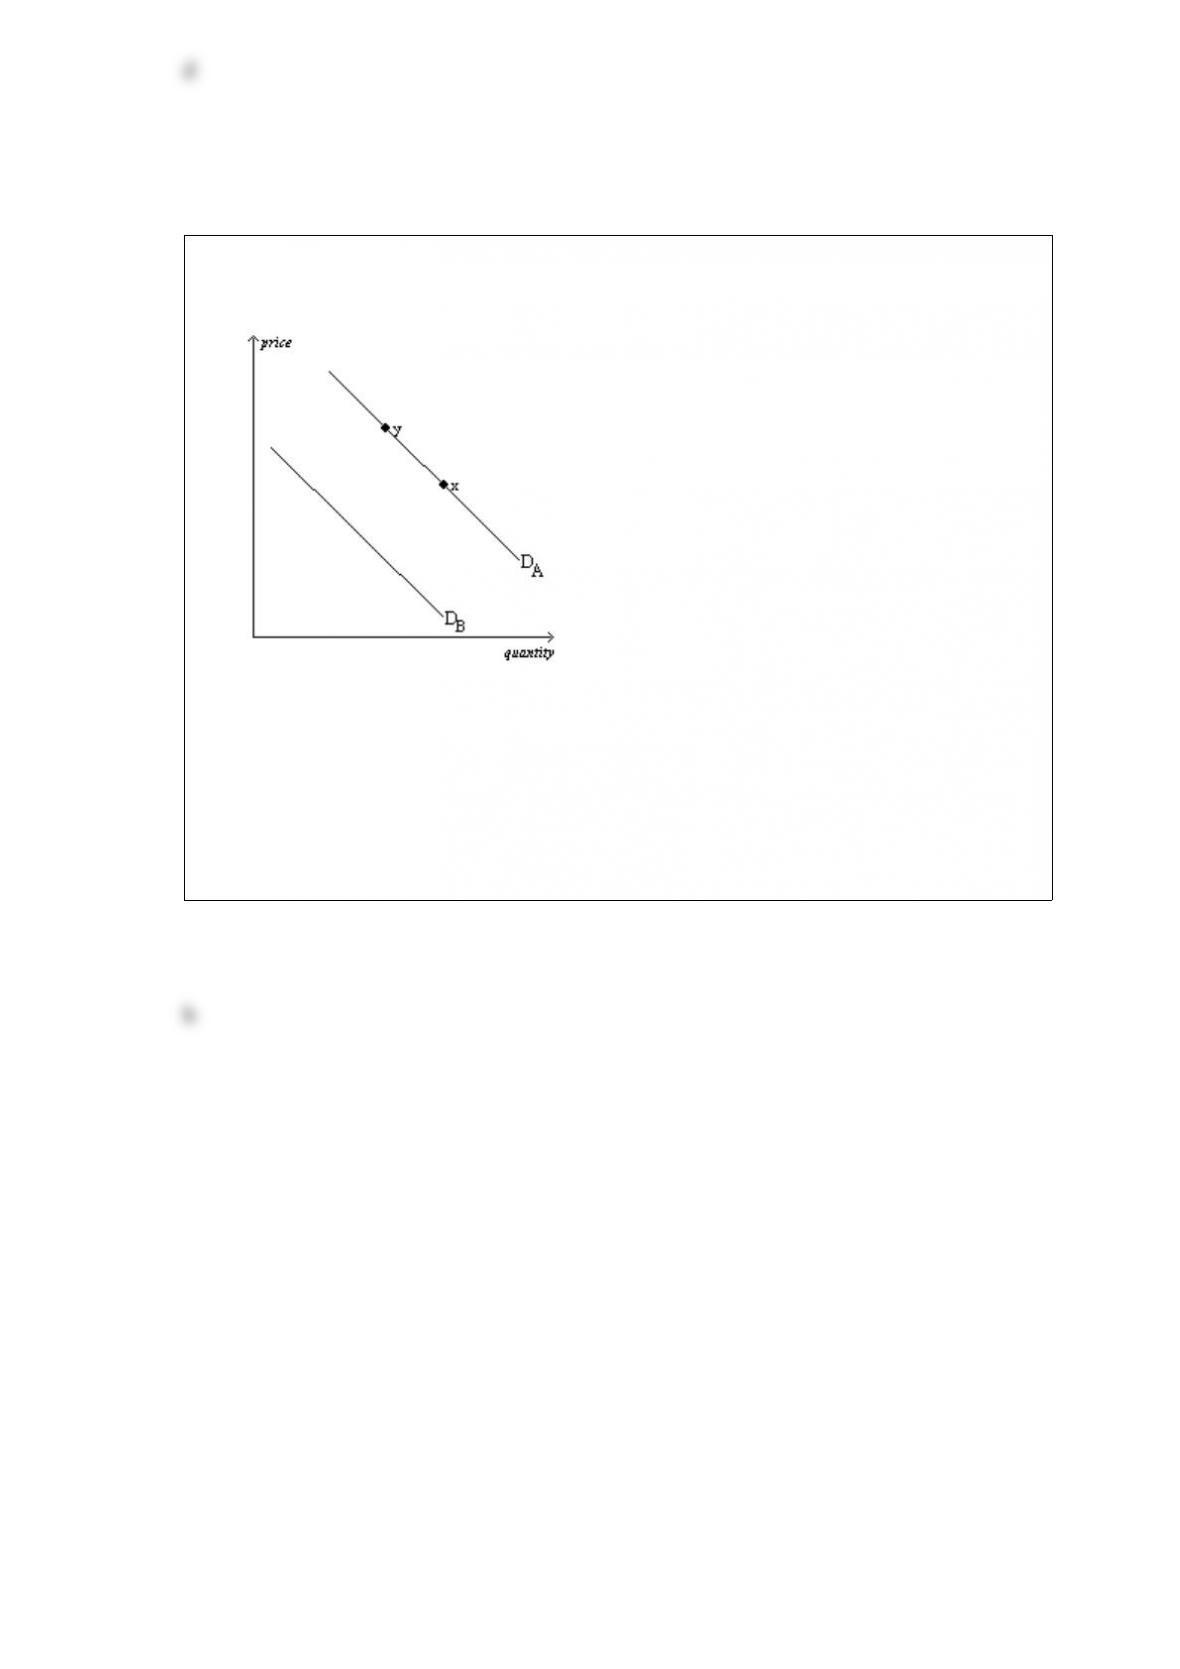
Figure 424
The diagram below pertains to the demand for turkey in the United States.
Refer to Figure 424. All else equal, buyers expecting turkey to be more expensive in
the future would cause a current move from
a. DA to DB.
b. DB to DA.
c. x to y.
d. y to x.