When conducting a hypothesis test comparing two populations with independent
samples, the sample sizes must be equal.
Quantitative data are values that are categorical, describing a characteristic such as
gender or level of education.
The number of typographical errors found in a manuscript would best be described
using a Poisson probability distribution.
The z-score has no units even though the original values will normally be expressed in
units such as dollars, years, pounds, or calories.

Predicting election results by asking voters their intentions is an example of descriptive
statistics.
A small sample size could provide a smaller sampling error than a larger sample size
when taken from the same population.
You canconclude that, because events are not independent, they will be mutually
exclusive.

The pooled variance is used to calculate the test statistics for comparing two population
means when the population variances are assumed to be unequal.
When the p-value for testing the significance of the regression slope is less than alpha,
we conclude that there is a significant relationship between the dependent and
independent variables.
The only forms of payment that a particular grocery store accepts are cash, debit card,
and credit card. The sample space {cash, credit card} is not collectively exhaustive in
this example.
Interval data deals strictly with qualitative data assigned to predetermined categories.

The expected value without sample information (EVwoSI) represents the expected
long-term payoff of making decisions without using sample information.
Cluster sampling is often used to test market new products.
When calculating a weighted mean, the weights need to sum to 1.0.

The necessary sample size to determine the confidence interval for the mean will
double when the required margin of error is reduced by half.
A smaller standard error of the slope increases the likelihood that we can establish a
significant relationship between the independent and dependent variables.
Interval data has all of the properties of ordinal data with the added feature that allows
us to measure the differences between the categories with actual numbers in a
meaningful way.
The hypothesis statement is an example of a null hypothesis.

Ordinal data has all of the properties of interval data with the added feature that allows
us to measure the differences between the categories with actual numbers in a
meaningful way.
The z-score in a normal probability distribution determines the number of standard
deviations that a particular value, x, is from the mean.
Bar charts can display data either horizontally or vertically.

When using best subsets regression, all possible combinations of independent variables
are considered when choosing a final model.
When the F-test statistic is greater than the critical F-score for ANOVA, the correct
conclusion is to fail to reject the null hypothesis.
To use the Central Limit Theorem, we need to know the mean and standard deviation of
the population.
An unbiased sample is a sample that does not represent the intended population and can
lead to distorted findings. Unbiased sampling can occur either intentionally or
unintentionally.

The dummy variable that is assigned a 1 and the dummy variable that is assigned a 0
are arbitrary choices.
The correlation coefficient measures the percentage of the total variation of the
dependent variable that is explained by the independent variable from a sample.
The test statistic that is used to compare the variances of two populations follows the
chi-square distribution.

Residuals describe the difference between the actual and predicted values of
independent variables in a regression analysis.
A weighted mean allows you to assign more weight to certain values and less weight to
others.
The test statistic that is used to compare the variances of two populations will always be
greater than 1.0.
The degrees of freedom for the appropriate critical value with a hypothesis test

comparing two population means with population variances that are unknown but
assumed to be equal are determined by .
The slope value for a regression equation represents the average change in the
dependent variable for a one-unit increase in the independent variable.
The bootstrap method can be applied to estimate parameters such as the population
proportion, mean, median, or variance.
When calculating the degrees of freedom for a hypothesis test comparing two
population means with population variances that are unknown and assumed to be
unequal, always round up the degrees of freedom to the next highest integer. This
makes it more challenging to reject the null hypothesis which is a more conservative
approach.

The null hypothesis for a chi-square test of independence always states that the two
variables are not independent of one another.
An assumption of regression analysis is that the relationship between the independent
and dependent variables is linear.
An assumption of a regression analysis is that the residuals exhibit no patterns across
values for the dependent variable.
A camera manufacturer just shipped a batch of 36 digital cameras to local retailers and
seven of the cameras have a defective sensor. Cutler Electronics received eight of these
digital cameras. What is the probability that more than one of the cameras shipped to
Cutler are defective?
A) 0.2456
B) 0.3050
C) 0.4972
D) 0.6322
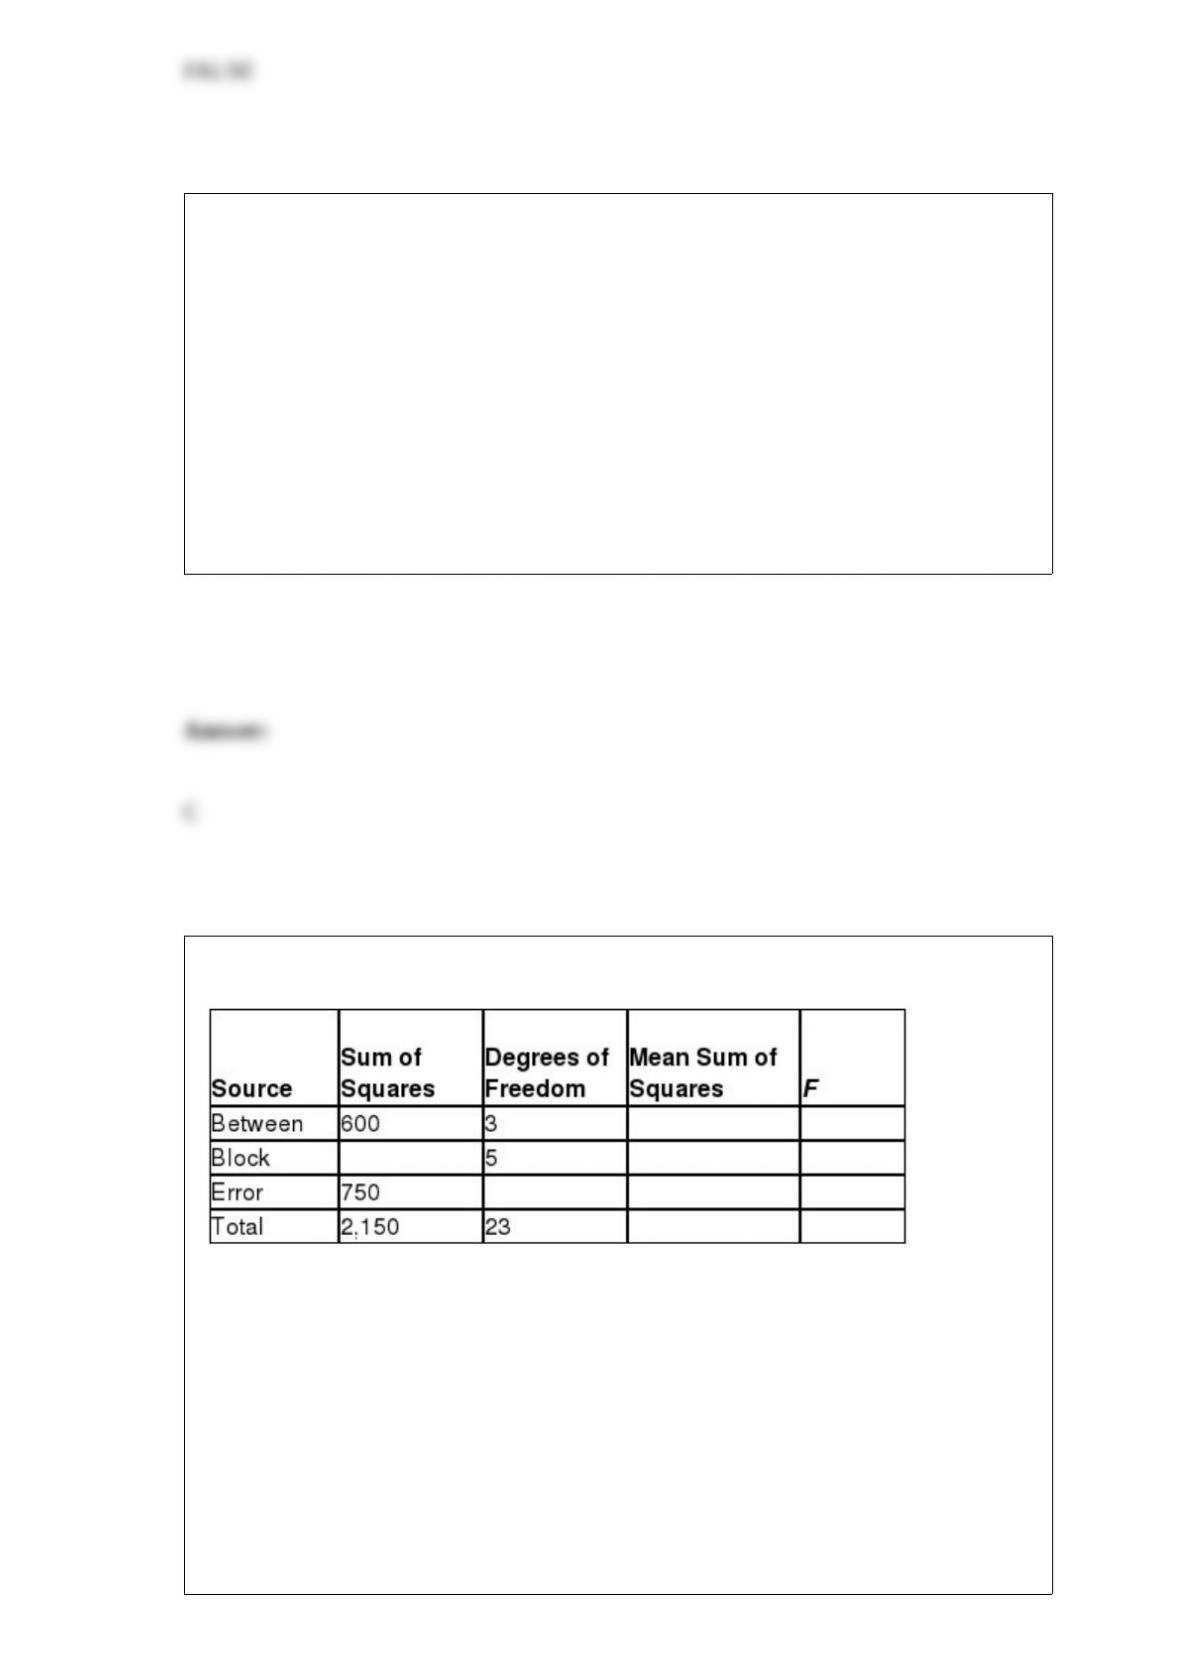
Consider the partially completed randomized block ANOVA summary table.
Using α = 0.05, the critical F-score for the main factor for this ANOVA procedure is
________.
A) 2.901
B) 3.157
C) 3.287
D) 4.885

A Bank of America employee records the amount of time that customers spend using
the ATM machine at her branch. This method of gathering data is known as
_______________.
A) direct observation
B) focus groups
C) experiments
D) surveys
Suppose the round-trip airfare between Philadelphia and Los Angeles a month before
the departure date follows the normal probability distribution with a mean of $387.20
and a standard deviation of $68.50. What is the probability that a randomly selected
airfare between these two cities will be more than $450?
A) 0.0788
B) 0.1788
C) 0.2033
D) 0.3669
The goal of the _____________ criterion is to minimize the decision maker’s regret of
making a wrong choice.
A) Hurwicz
B) equally likely
C) minimax regret
D) maximax
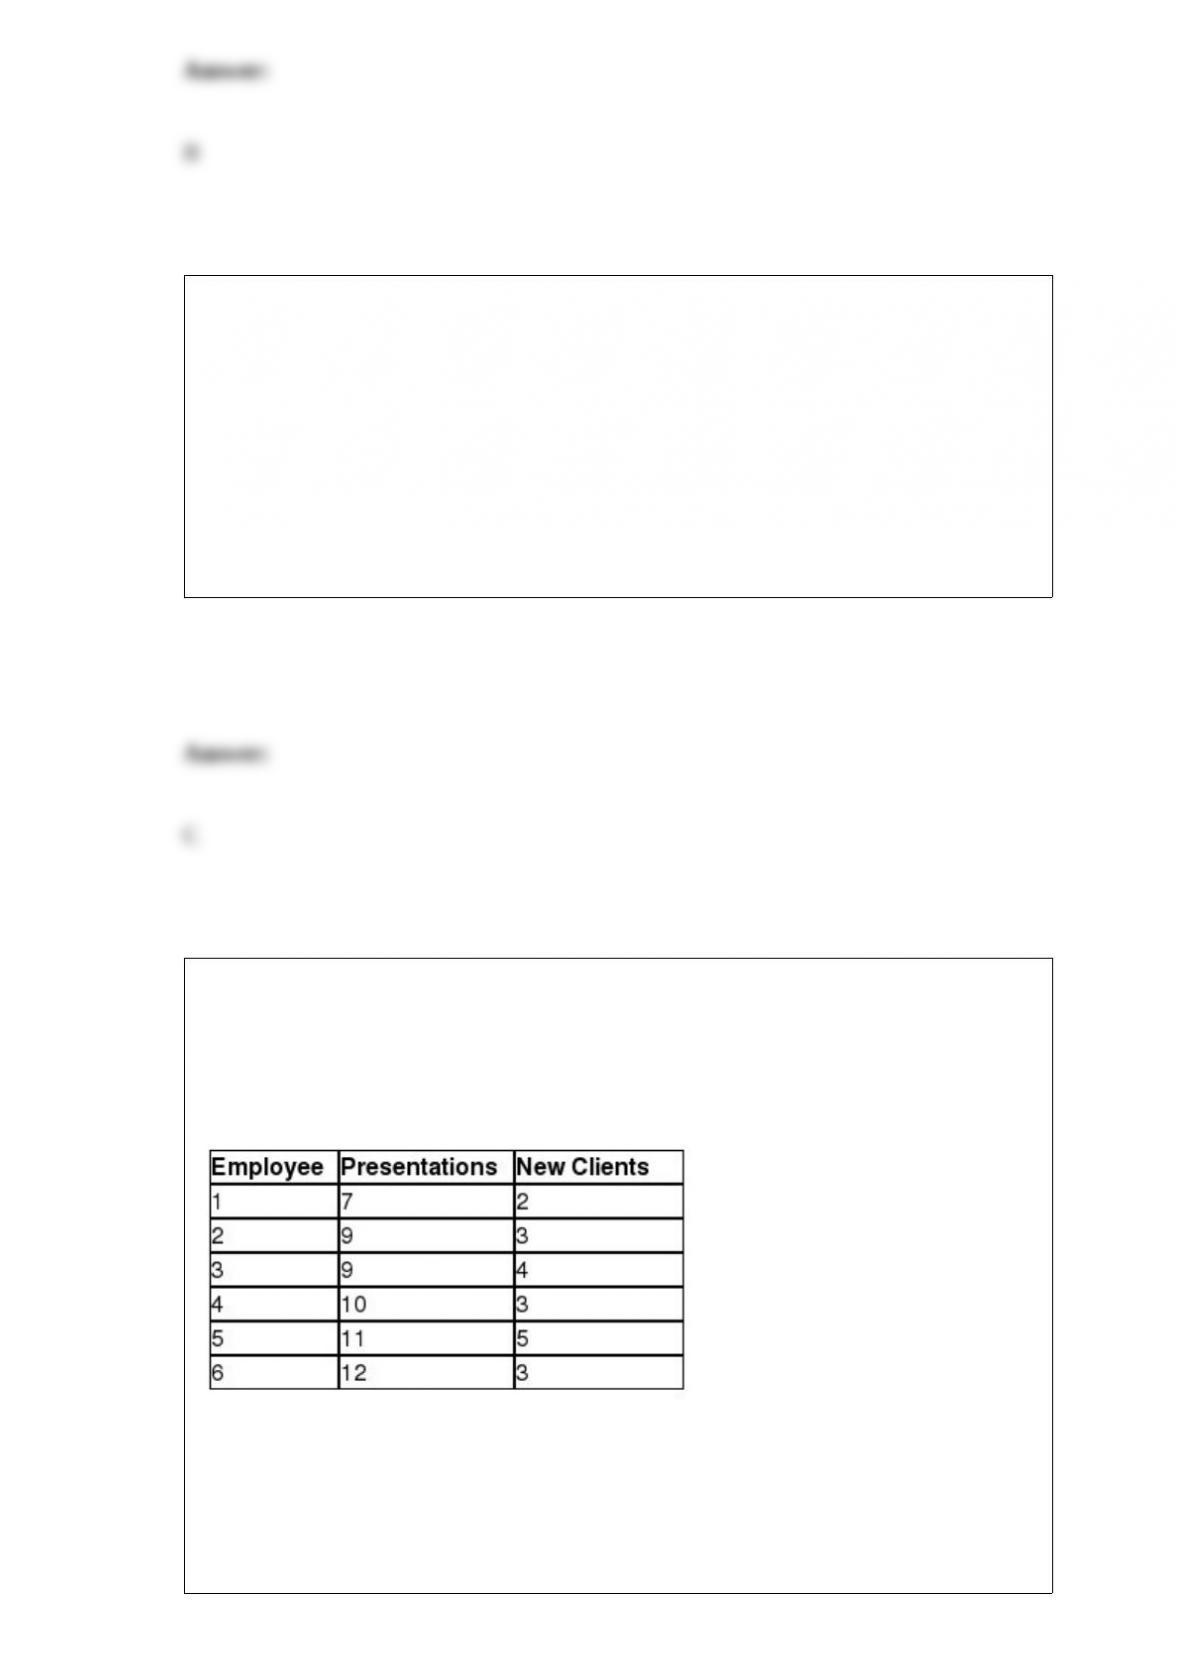
Sarah is the office manager for a group of financial advisors who provide financial
services for individual clients. She would like to investigate whether a relationship
exists between the number of presentations made to prospective clients in a month and
the number of new clients per month. The following table shows the number of
presentations and corresponding new clients for a random sample of six employees.
The correlation coefficient for this data is ________.
A) 0.167
B) 0.323

C) 0.403
D) 0.516
The following data shows the number of home runs hit by the top 12 home run hitters
during a recent Major League Baseball season.
The lower limit for determining outliers for a box-and-whisker plot is ________.
A) 20.0
B) 22.5
C) 23.75
D) 25.25
The following contingency table shows the number of customers who bought various
brands of digital cameras at Walmart and Best Buy.
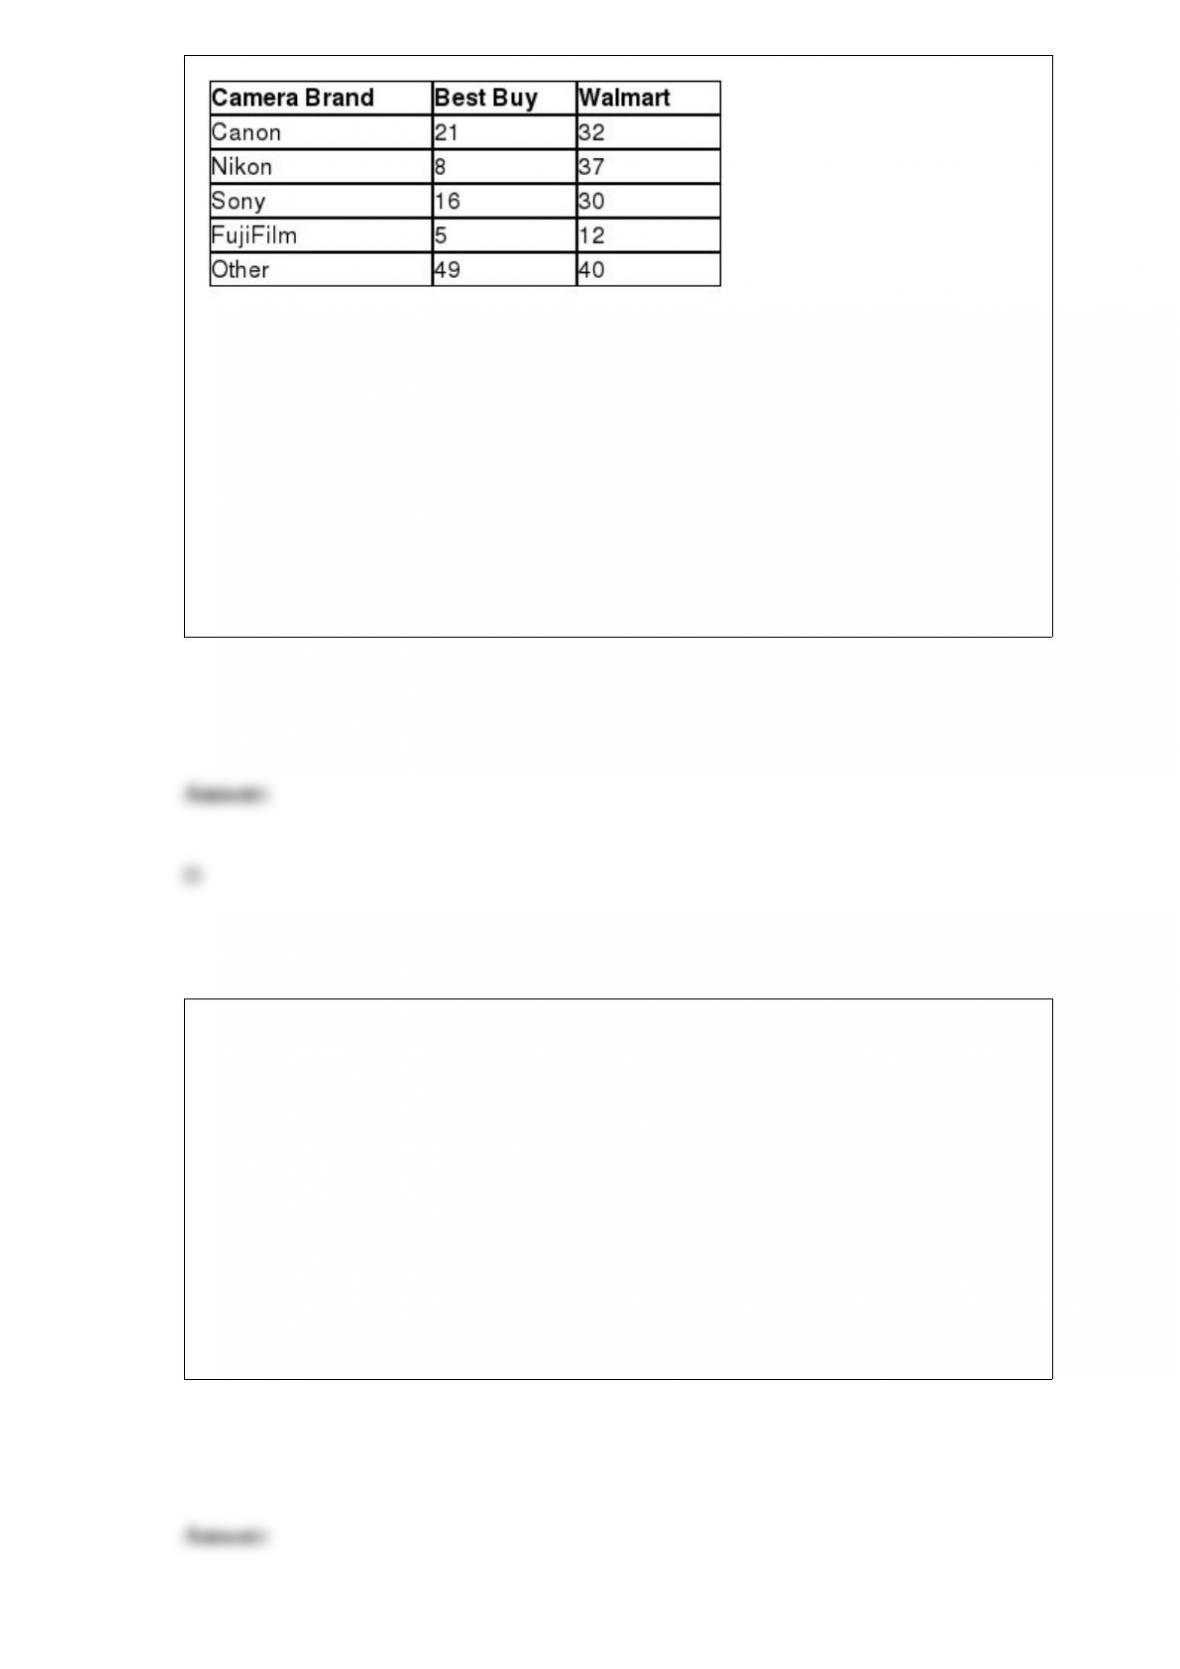
Given that the camera was purchased at Best Buy, the probability that is was a Canon is
________.
A) 0.108
B) 0.152
C) 0.170
D) 0.212
A company that bakes chocolate chip cookies averages 5.2 chocolate chips per cookie.
Assume that the number of chocolate chips per cookie follows the Poisson distribution.
What is the probability that a randomly selected cookie will contain two or more
chocolate chips?
A) 0.3569
B) 0.4401
C) 0.5469
D) 0.9658
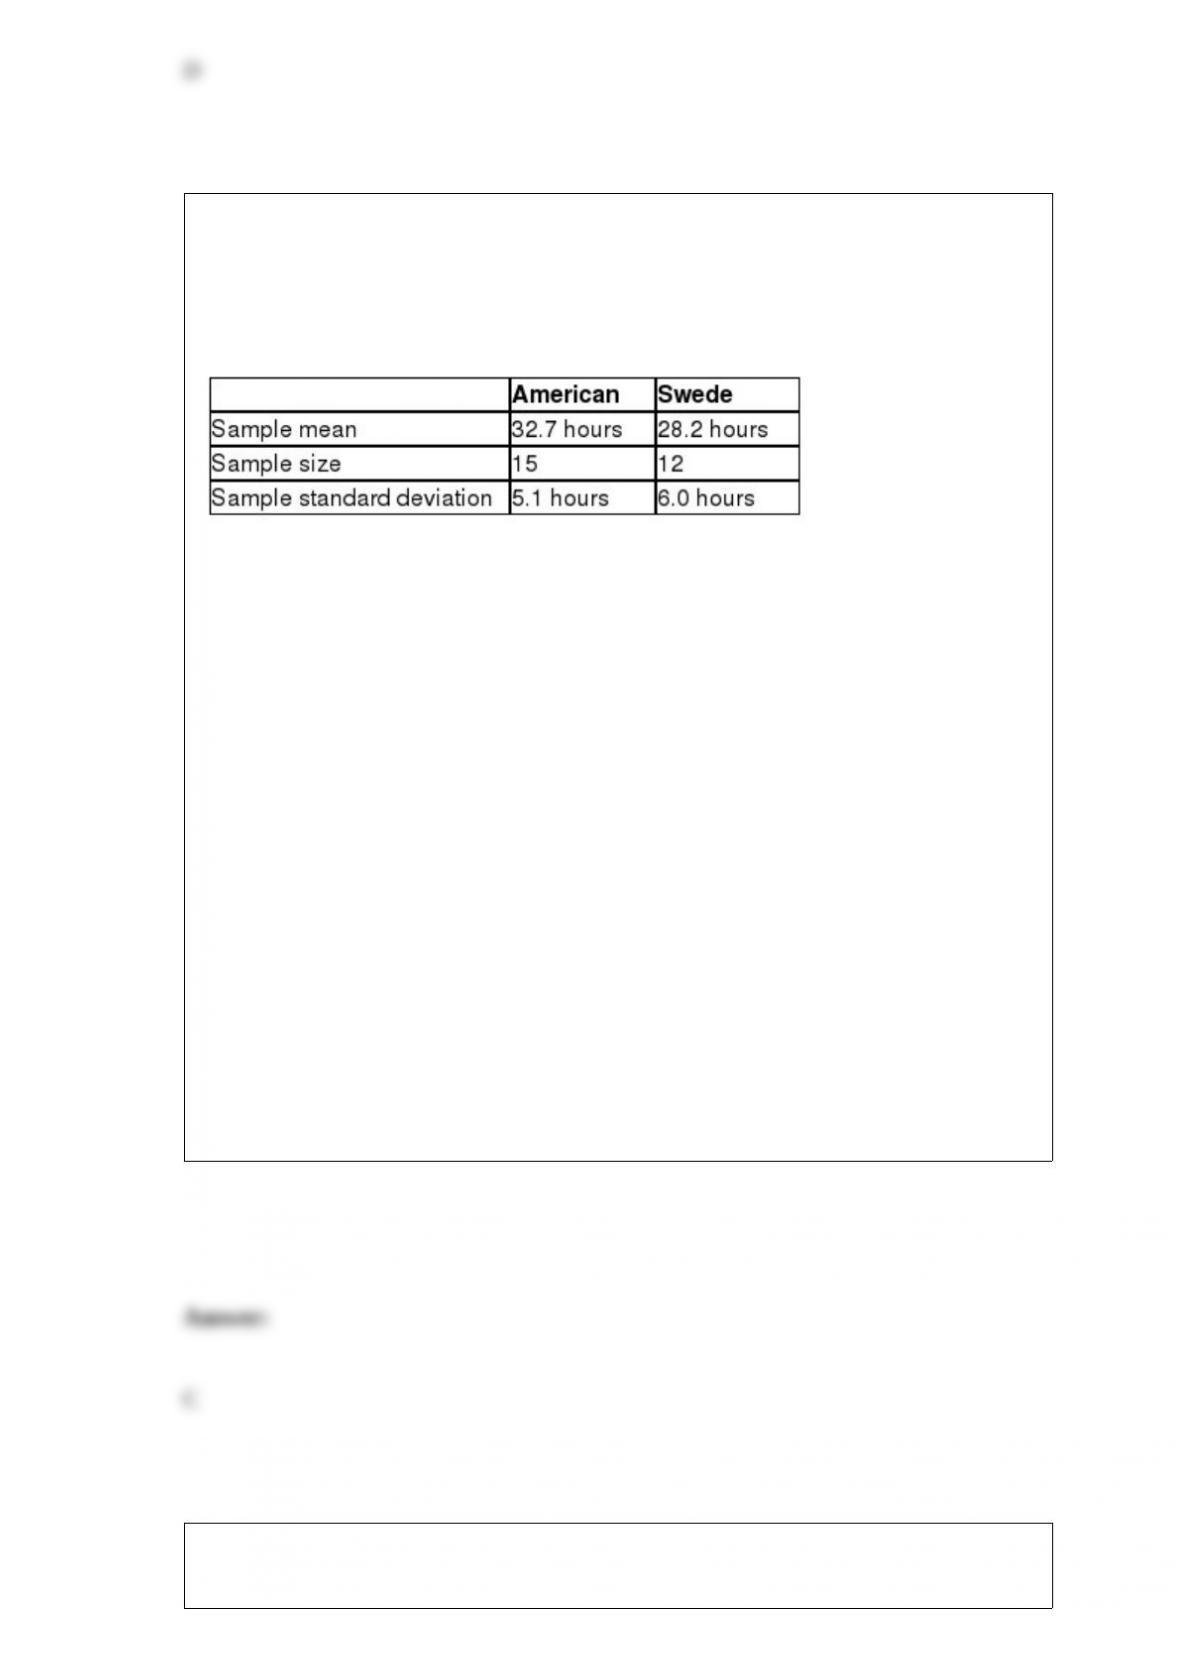
You have been assigned to test the hypothesis that the average number of hours per
week that an American works is higher than the average number of hours per week that
a Swede works. The following data summarizes the sample statistics for the number of
hours worked per week for workers in each country. Assume that the population
variances are unequal.
If Population 1 is defined as American workers and Population 2 is defined as Swedish
workers, and using α = 0.05, the conclusion for this hypothesis test would be that
because the test statistic is
____________________________________________________________________.
A) less than the critical value, you can conclude that the average number of hours per
week that an American works is less than the average number of hours per week that a
Swede works
B) less than the critical value, you can conclude that the average number of hours per
week that an American works is higher than the average number of hours per week that
a Swede works
C) more than the critical value, you can conclude that the average number of hours per
week that an American works is higher than the average number of hours per week that
a Swede works
D) more than the critical value, you cannot conclude that the average number of hours
per week that an American works is higher than the average number of hours per week
that a Swede works
________ adjusts the previous forecast with a portion of the previous period’s
forecasting error.

A) Simple moving average
B) Weighted moving average
C) Exponential smoothing
D) Multiplicative decomposition
Thirty-five percent of customers at a restaurant order an alcoholic drink and an
appetizer with dinner. Ten percent of customers do not order alcoholic drink or an
appetizer with dinner. Sixty-five percent of diners order an appetizer with dinner. The
percentage of customers who order an alcoholic drink but do not order an appetizer is
________.
A) 0.12
B) 0.25
C) 0.30
D) 0.35
“No shows” are the people with reservations who fail to arrive. The following table
shows the number of no shows each day at a hotel over the last 125 business days.
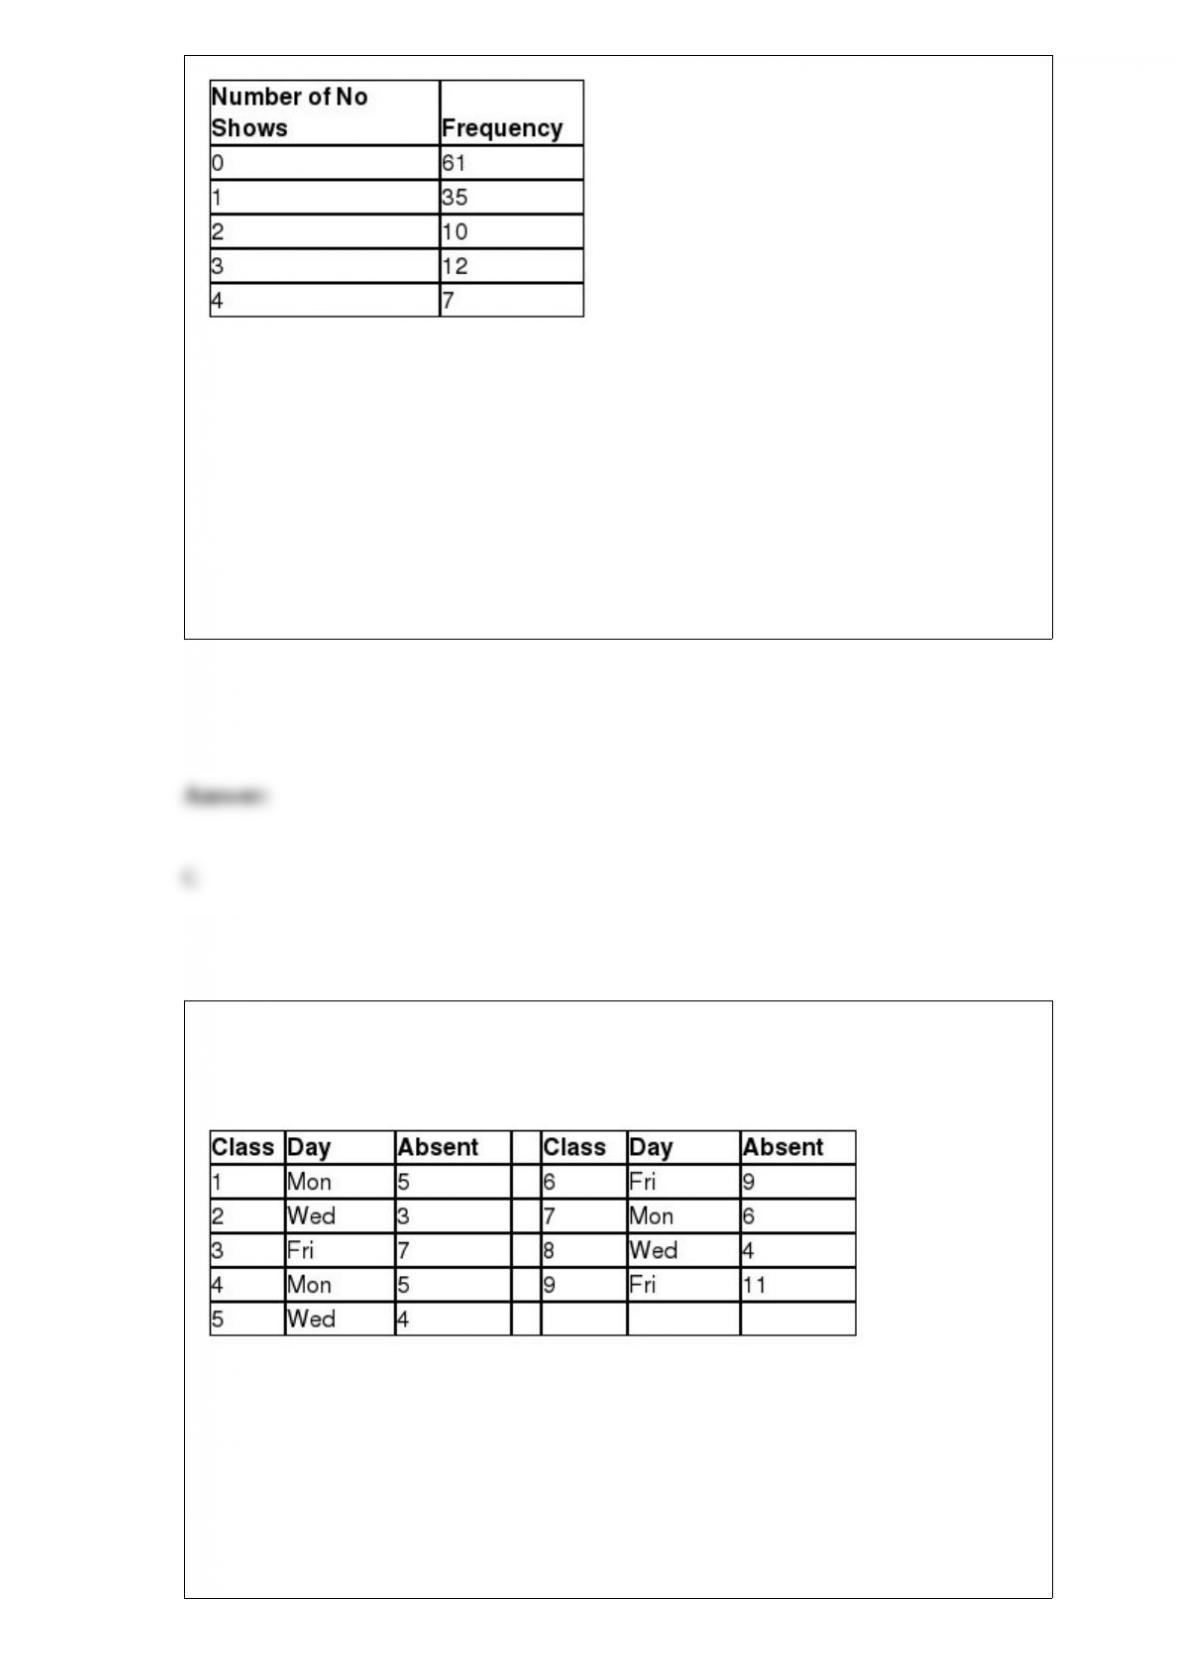
What is the standard deviation for the number of no shows per day?
A) 0.68
B) 0.96
C) 1.21
D) 1.55
A large statistics class meets on Monday, Wednesday, and Friday each week during the
semester. The following data shows the number of absent students for the last nine
classes.
The forecast of absent students for Class 10 using multiplicative decomposition is
________.
A) 6.0
B) 6.4

C) 7.2
D) 7.9
Expedia would like to test the hypothesis that the proportion of Southwest Airline
flights that arrive on-time is less than 0.90. A random sample of 140 United Airline
flights found that 119 arrived on-time. Expedia would like to set α = 0.05. The critical
value for this hypothesis test would be ________.
A) 1.28
B) 1.645
C) 2.05
D) 2.33
The following table shows the number of pieces of junk mail that arrives in my mailbox
each day.
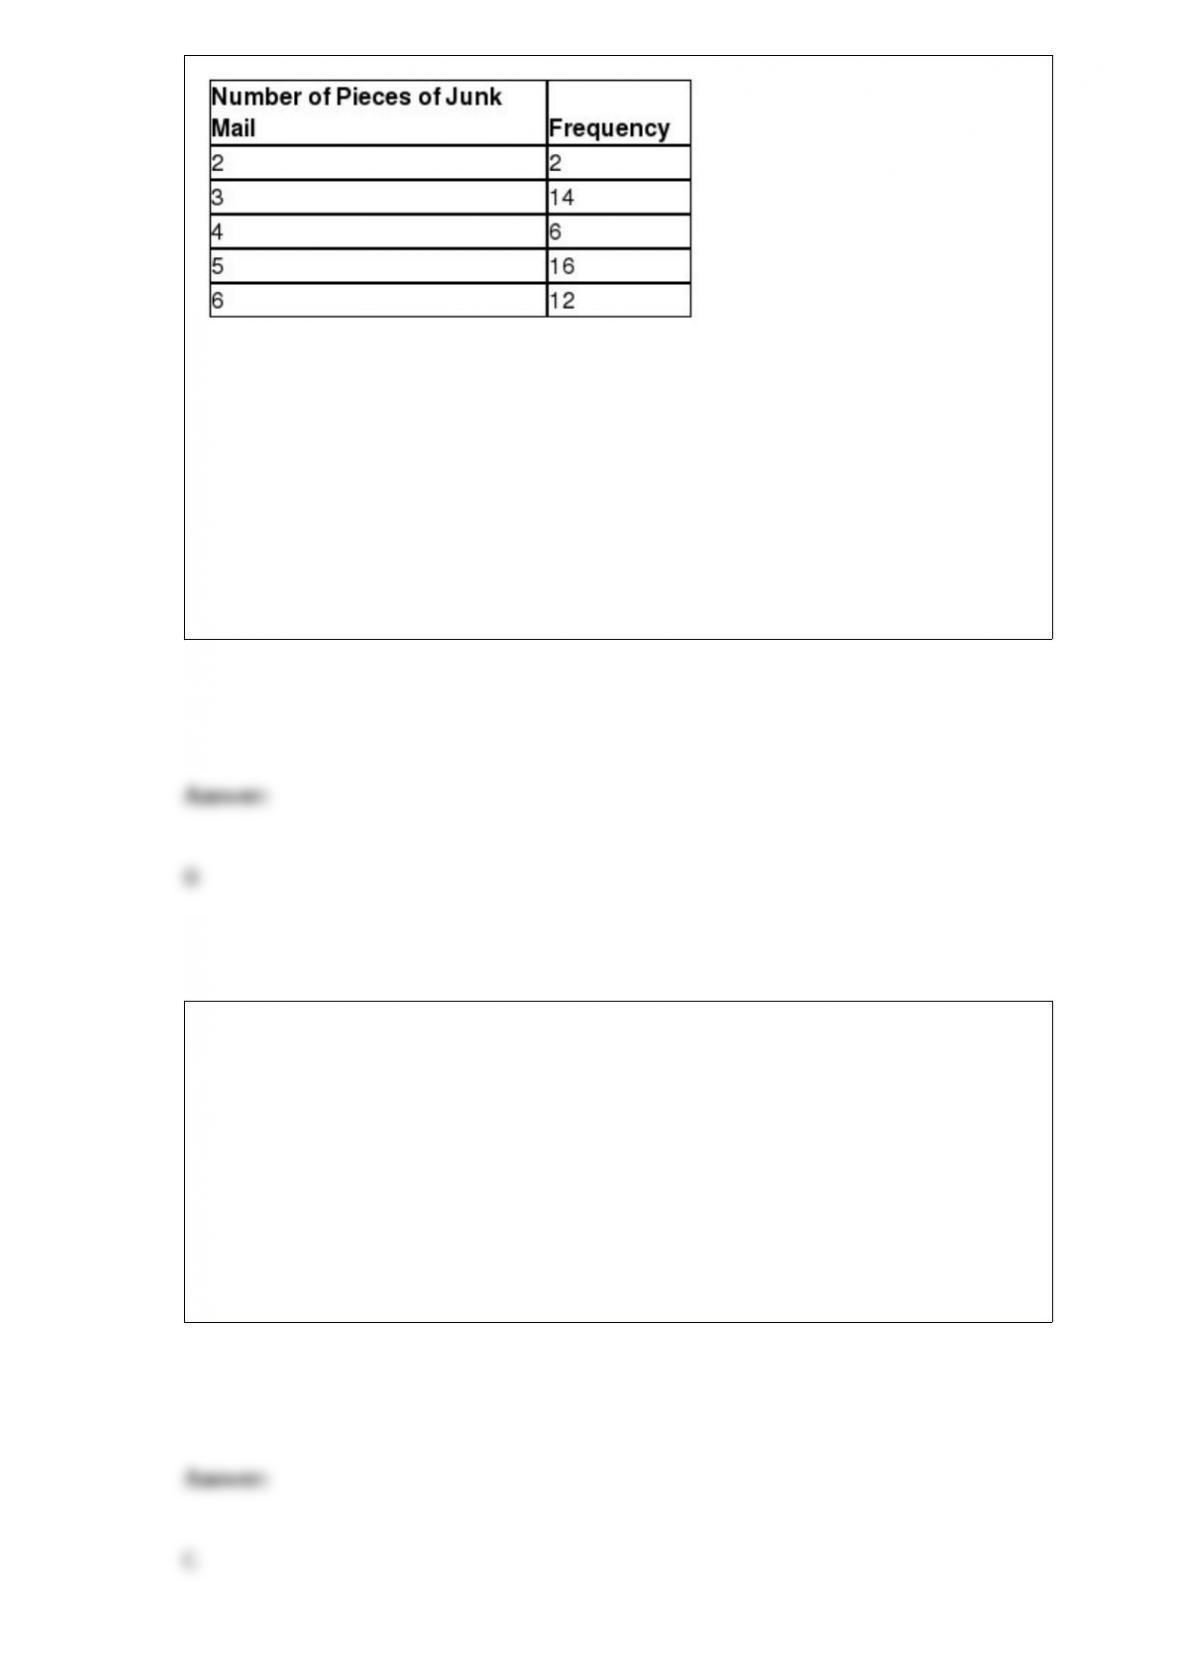
What is the standard deviation for the number of pieces of junk mail received per day?
A) 0.91
B) 1.24
C) 2.06
D) 2.57
A Type I error occurs when performing one-way ANOVA when we conclude that the
____________________.
A) population means are equal when, in fact, they are not equal.
B) sample means are equal when, in fact, they are not equal.
C) population means are not equal when, in fact, they are equal.
D) sample means are not equal when, in fact, they are equal.
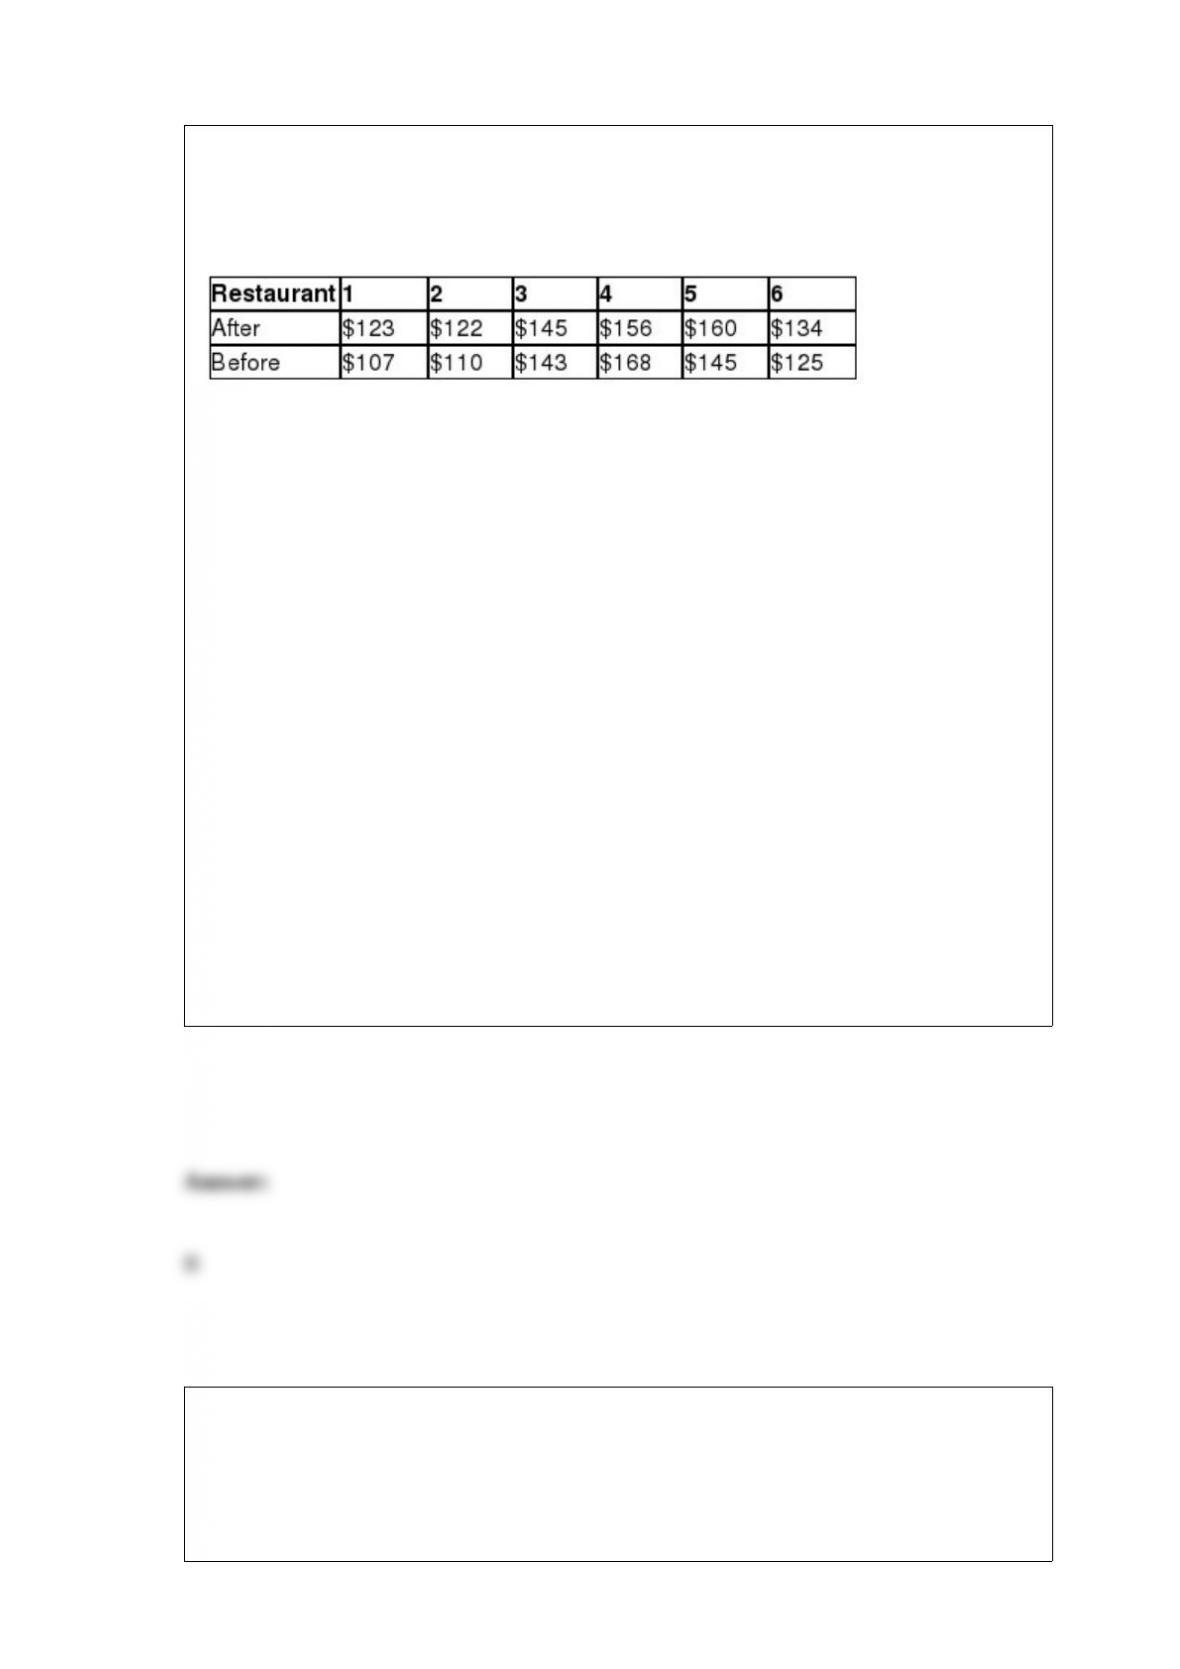
Suppose Burger King has run a major advertising campaign in the hopes of increasing
monthly sales. To investigate the effectiveness of this campaign, Burger King randomly
selected seven restaurants and recorded the monthly sales before and after the
advertising. The following data represents these sales figures in thousands of dollars.
If Population 1 is defined as sales after the advertising campaign and Population 2 is
defined as sales before the advertising campaign, and using α = 0.05, the conclusion for
this hypothesis test would be that because the test statistic is
___________________________________________.
A) less than the critical value, we can conclude that the average restaurant sales per
month after the advertising campaign are higher than the average restaurant sales per
month before the advertising campaign
B) less than the critical value, we cannot conclude that the average restaurant sales per
month after the advertising campaign are higher than the average restaurant sales per
month before the advertising campaign
C) more than the critical value, we can conclude that the average restaurant sales per
month after the advertising campaign are less than the average restaurant sales per
month before the advertising campaign
D) more than the critical value, we can conclude that the average restaurant sales per
month after the advertising campaign are higher than the average restaurant sales per
month before the advertising campaign
In Delaware, cars are inspected each year using state-operated inspection centers. The
Wilmington center has three drive-through lanes where cars are inspected in a sequence
of steps. The following data show the number of minutes that a random sample of
drivers spent waiting and having their cars inspected in the three lanes each day of the
week.

The state of Delaware would like to perform a randomized block ANOVA to test for a
difference in the average times the drivers spend in the three lanes using the weekday as
a blocking factor with α = 0.05. The sum of squares error for these observations is
________.
A) 102.8
B) 115.0
C) 130.1
D) 142.8
A golfer would like to test the hypothesis that the variance of his golf score equals 10.0.
A random sample of 28 rounds of golf had a sample standard deviation of 3.5. The test
statistic for this hypothesis test would be ________.
A) 12.57
B) 33.08
C) 40.75
D) 46.23
The ________ is used to find the probability that a continuous uniform random variable
will fall between two particular values.
A) uniform cumulative distribution function
B) uniform probability distribution
C) continuous uniform probability density function
D) uniform probability density function
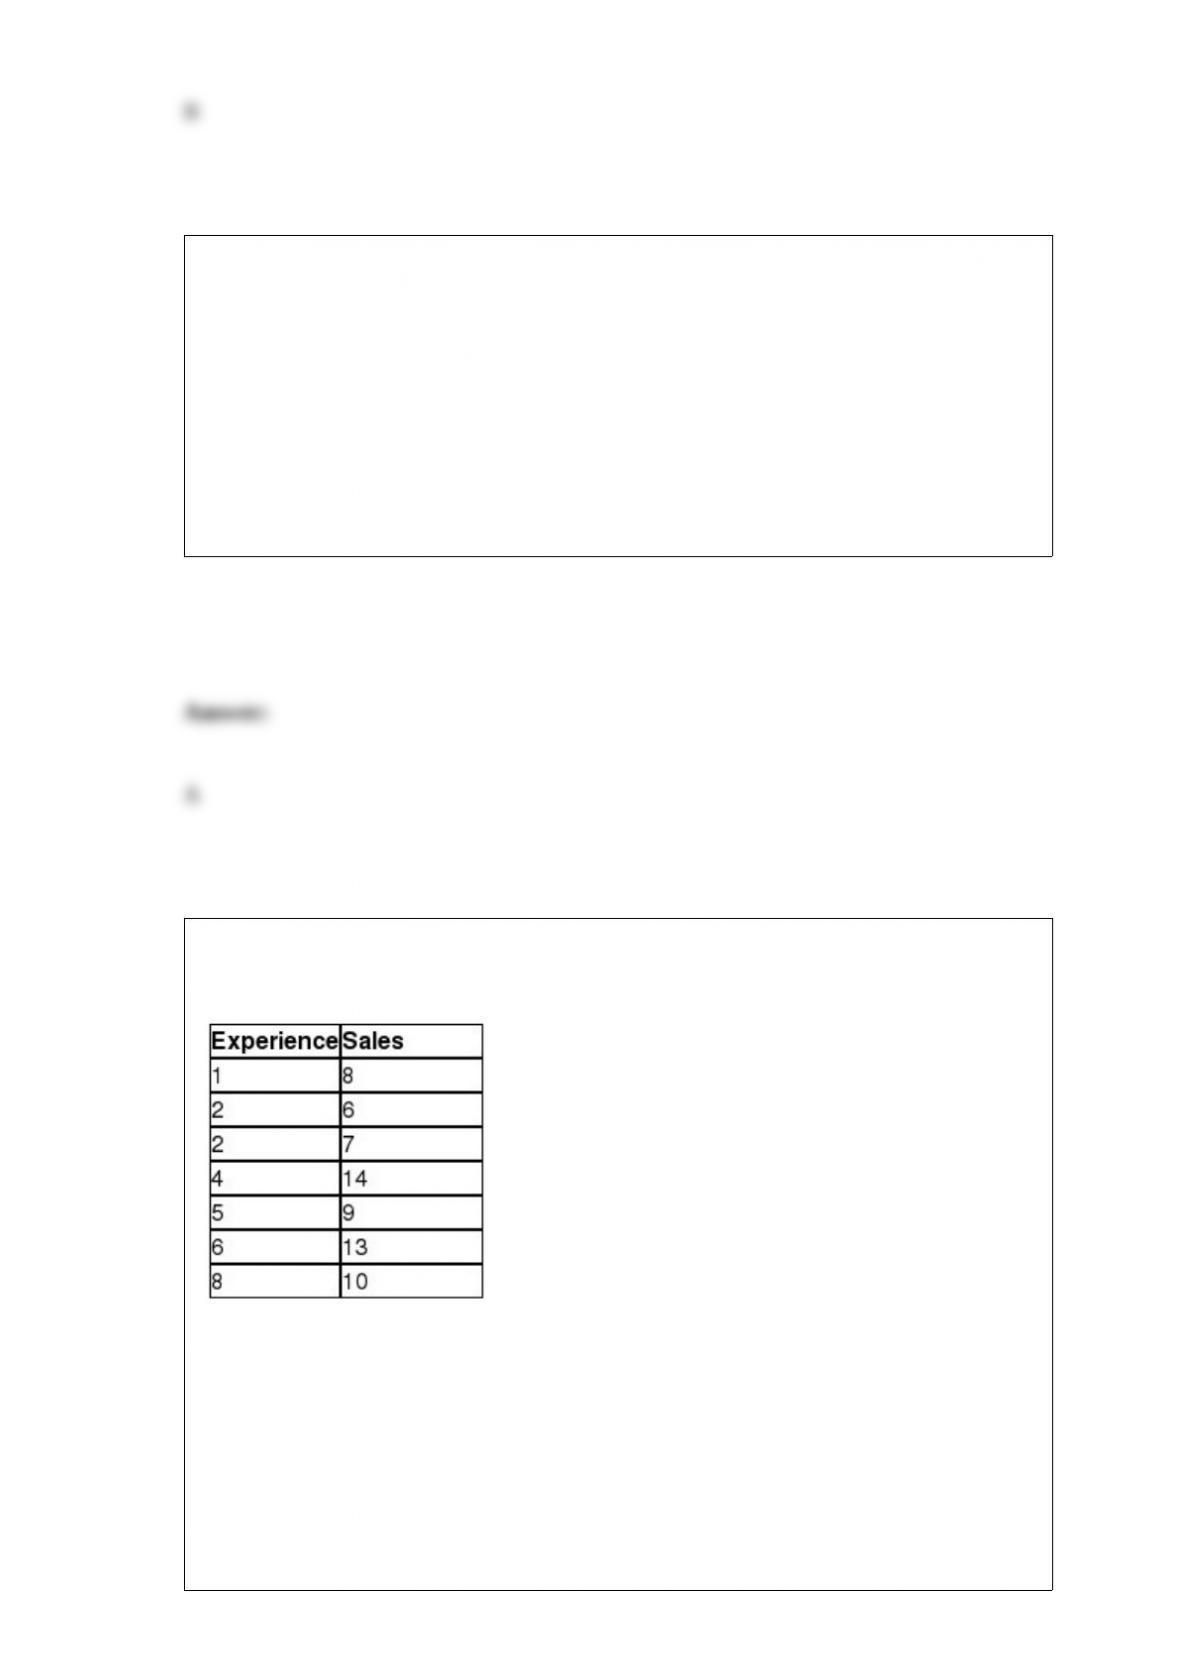
The table below shows the number of cars sold last month by seven employees at
Concord Motors and their number of years of sales experience.
Management would like to test if the population Spearman rank-order correlation
coefficient is different than zero. Using α = 0.05, which one of the following statements
is true?
A) Because the absolute value of the Spearman rank-order correlation coefficient is
greater than the absolute value of the critical value, we can conclude that the population
Spearman rank-order correlation coefficient is different than zero.

B) Because the absolute value of the Spearman rank-order correlation coefficient is
greater than the absolute value of the critical value, we cannot conclude that the
population Spearman rank-order correlation coefficient is different than zero.
C) Because the absolute value of the Spearman rank-order correlation coefficient is less
than the absolute value of the critical value, we cannot conclude that the population
Spearman rank-order correlation coefficient is different than zero.
D) Because the absolute value of the Spearman rank-order correlation coefficient is less
than the absolute value of the critical value, we can conclude that the population
Spearman rank-order correlation coefficient is different than zero.
The ________of Events A and B represents the number of instances in which both
Events A and B occur at the same time.
A) union
B) addition
C) complement
D) intersection
Expedia would like to test the hypothesis that the proportion of Southwest Airline
flights that arrive on-time is less than 0.90. A random sample of 140 United Airline
flights found that 119 arrived on-time. Expedia would like to set α = 0.05. The correct
hypothesis statement for this hypothesis test would be _________________________.

A)
B)
C)
D)
Assume that the number of customers who arrive at a water ice stand follows the
Poisson distribution with an average rate of 6.4 per 30 minutes. What is the probability
that more than one customer will arrive during the next 30 minutes?
A) 0.7006
B) 0.7524
C) 0.9081
D) 0.9877
Sheridan Motors is a car dealership that would like to investigate if there is a difference
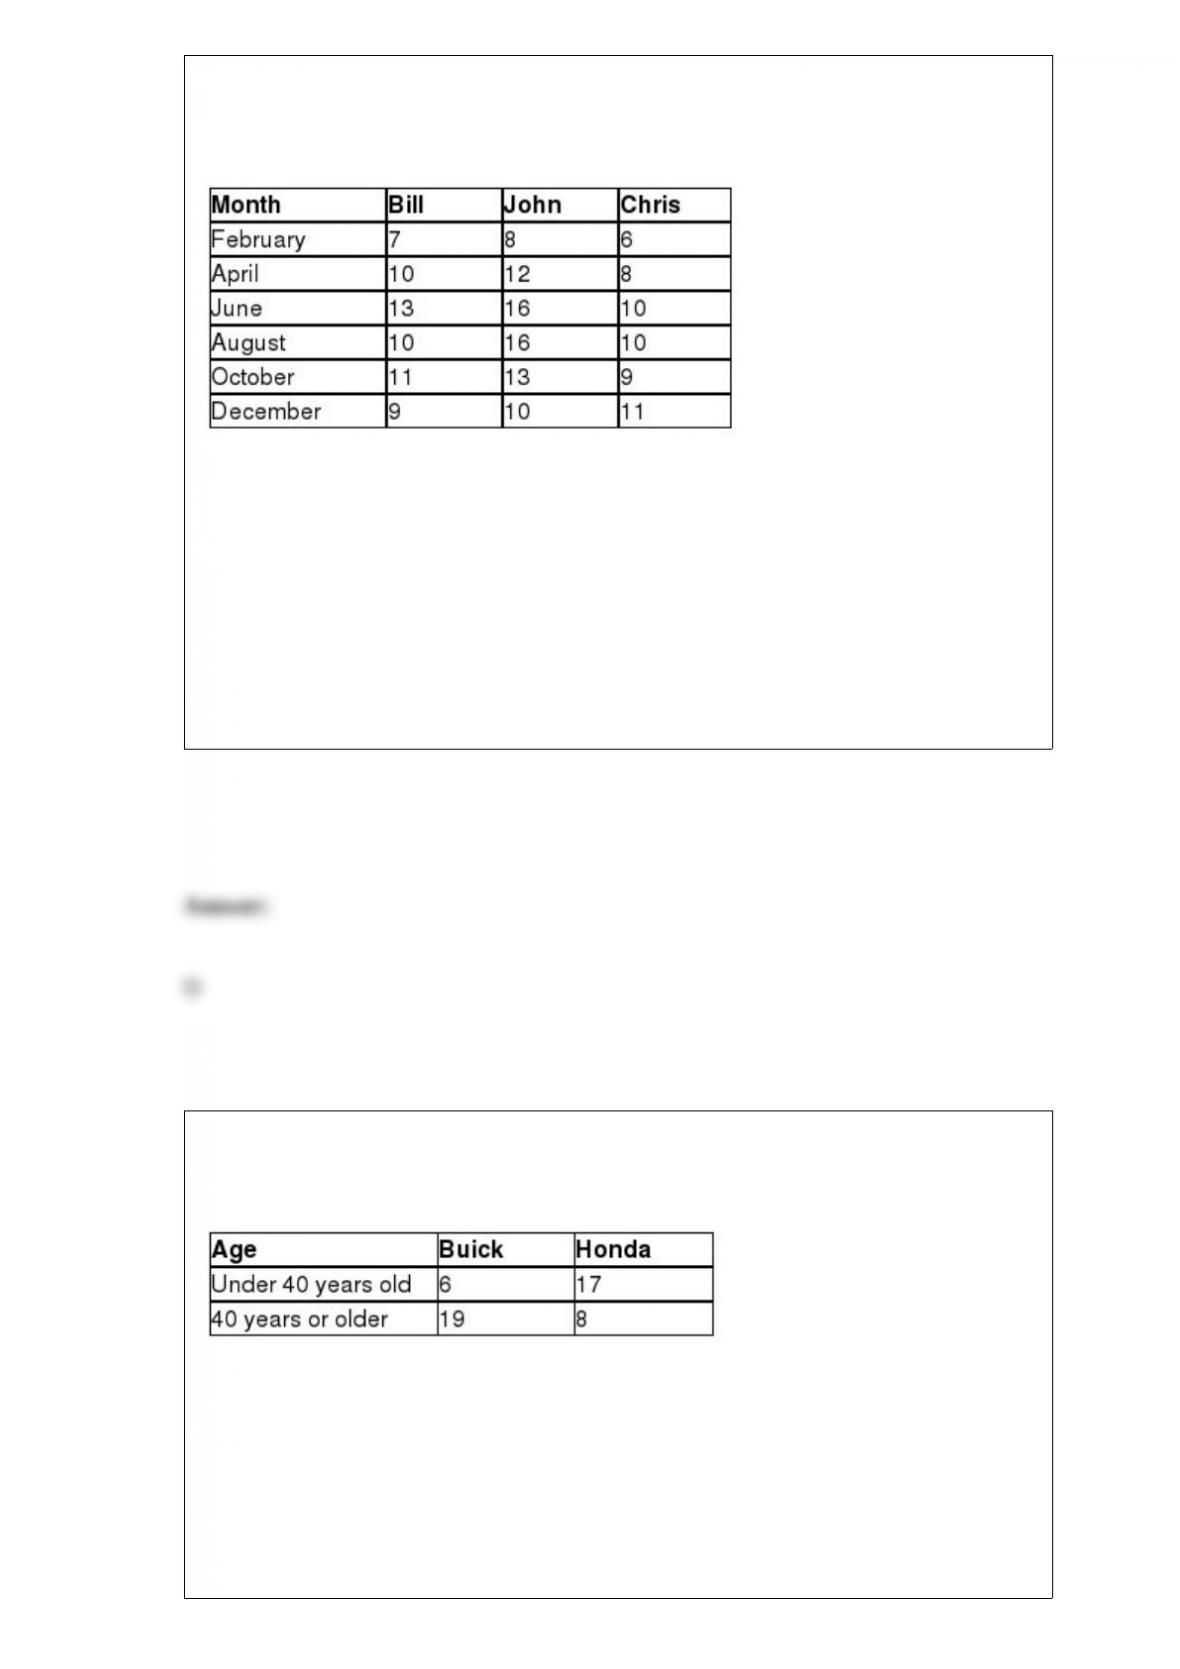
in the average number of car sales per month between three sales employees using a
randomized block ANOVA. The following data represent the number of car sales last
year for these employees for six different months.
The mean square between for these observations is ________.
A) 10.0
B) 11.6
C) 16.2
D) 19.5
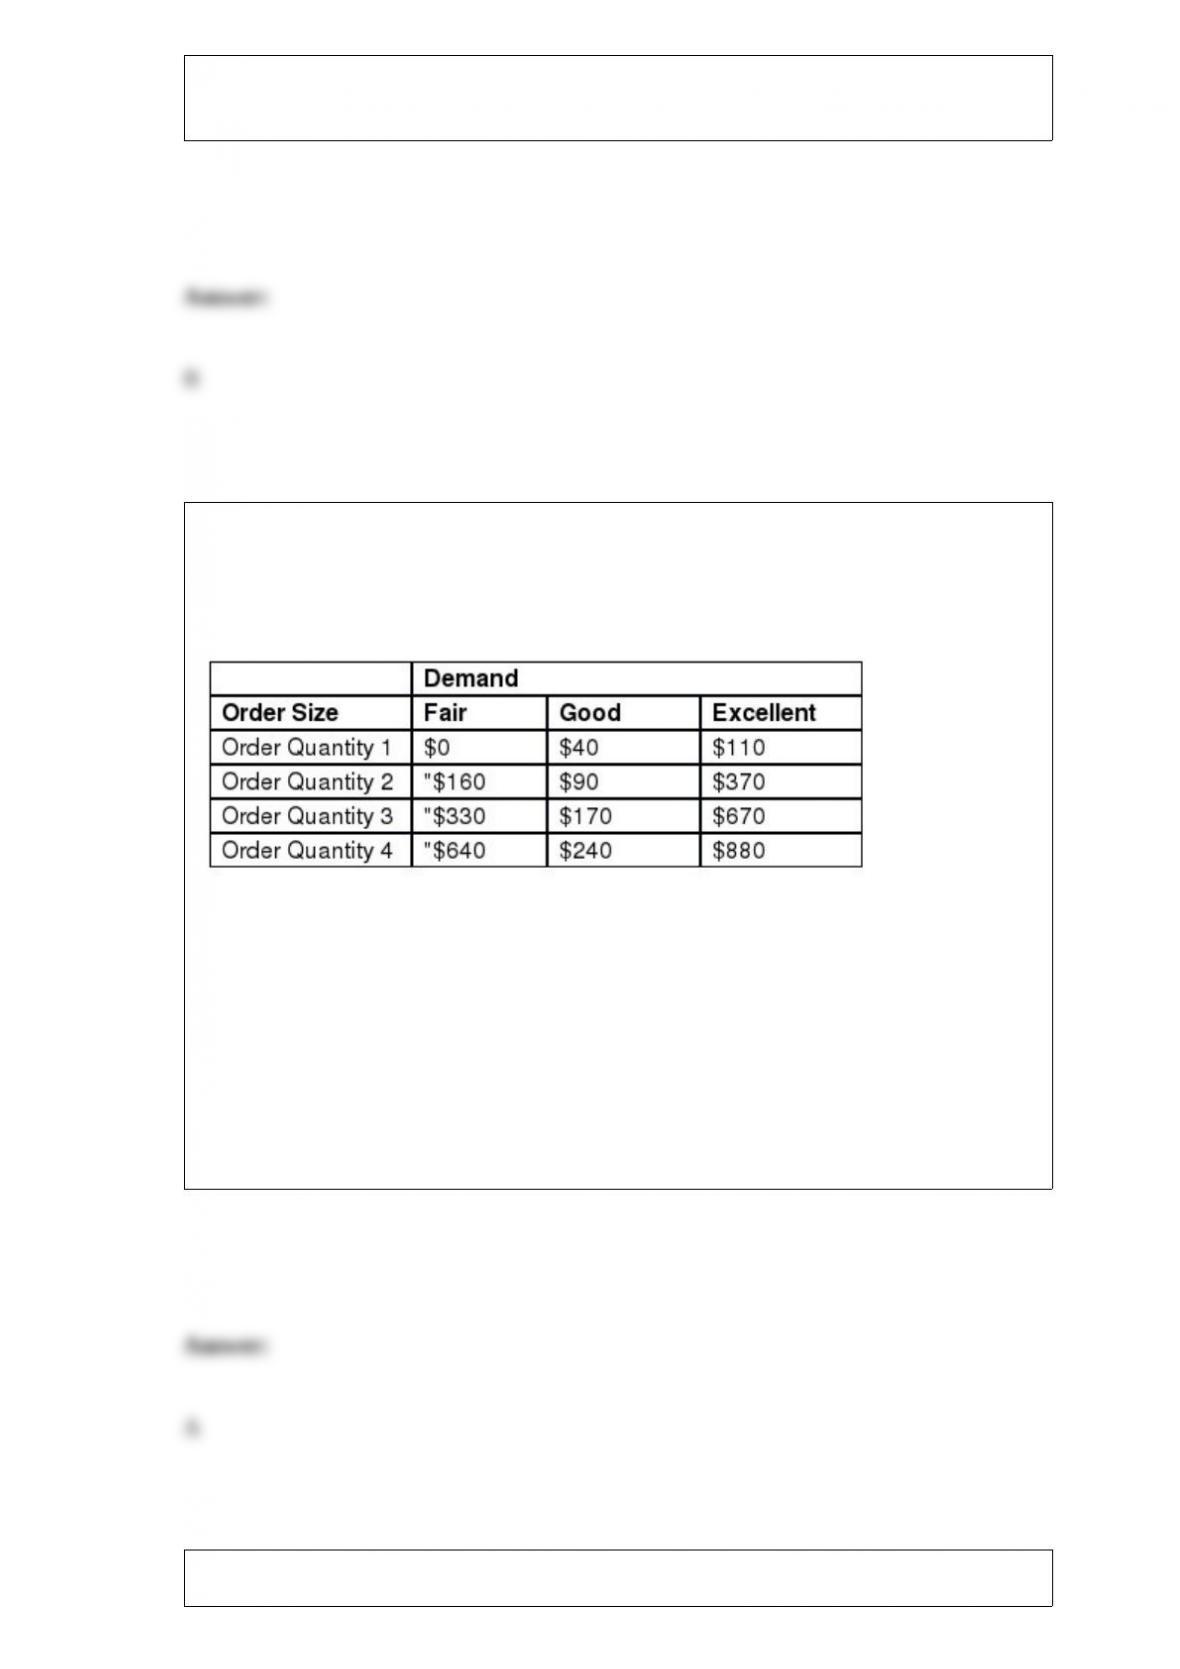
Porter Automotive is a car dealership that sells Buicks and Hondas. The following data
shows the number of buyers this month according to the brand of car they purchased as
well as their age group.
The percentage of buyers 40 years or older who purchased a Honda is _____.
A) 12%
B) 16%
C) 34%
D) 38%
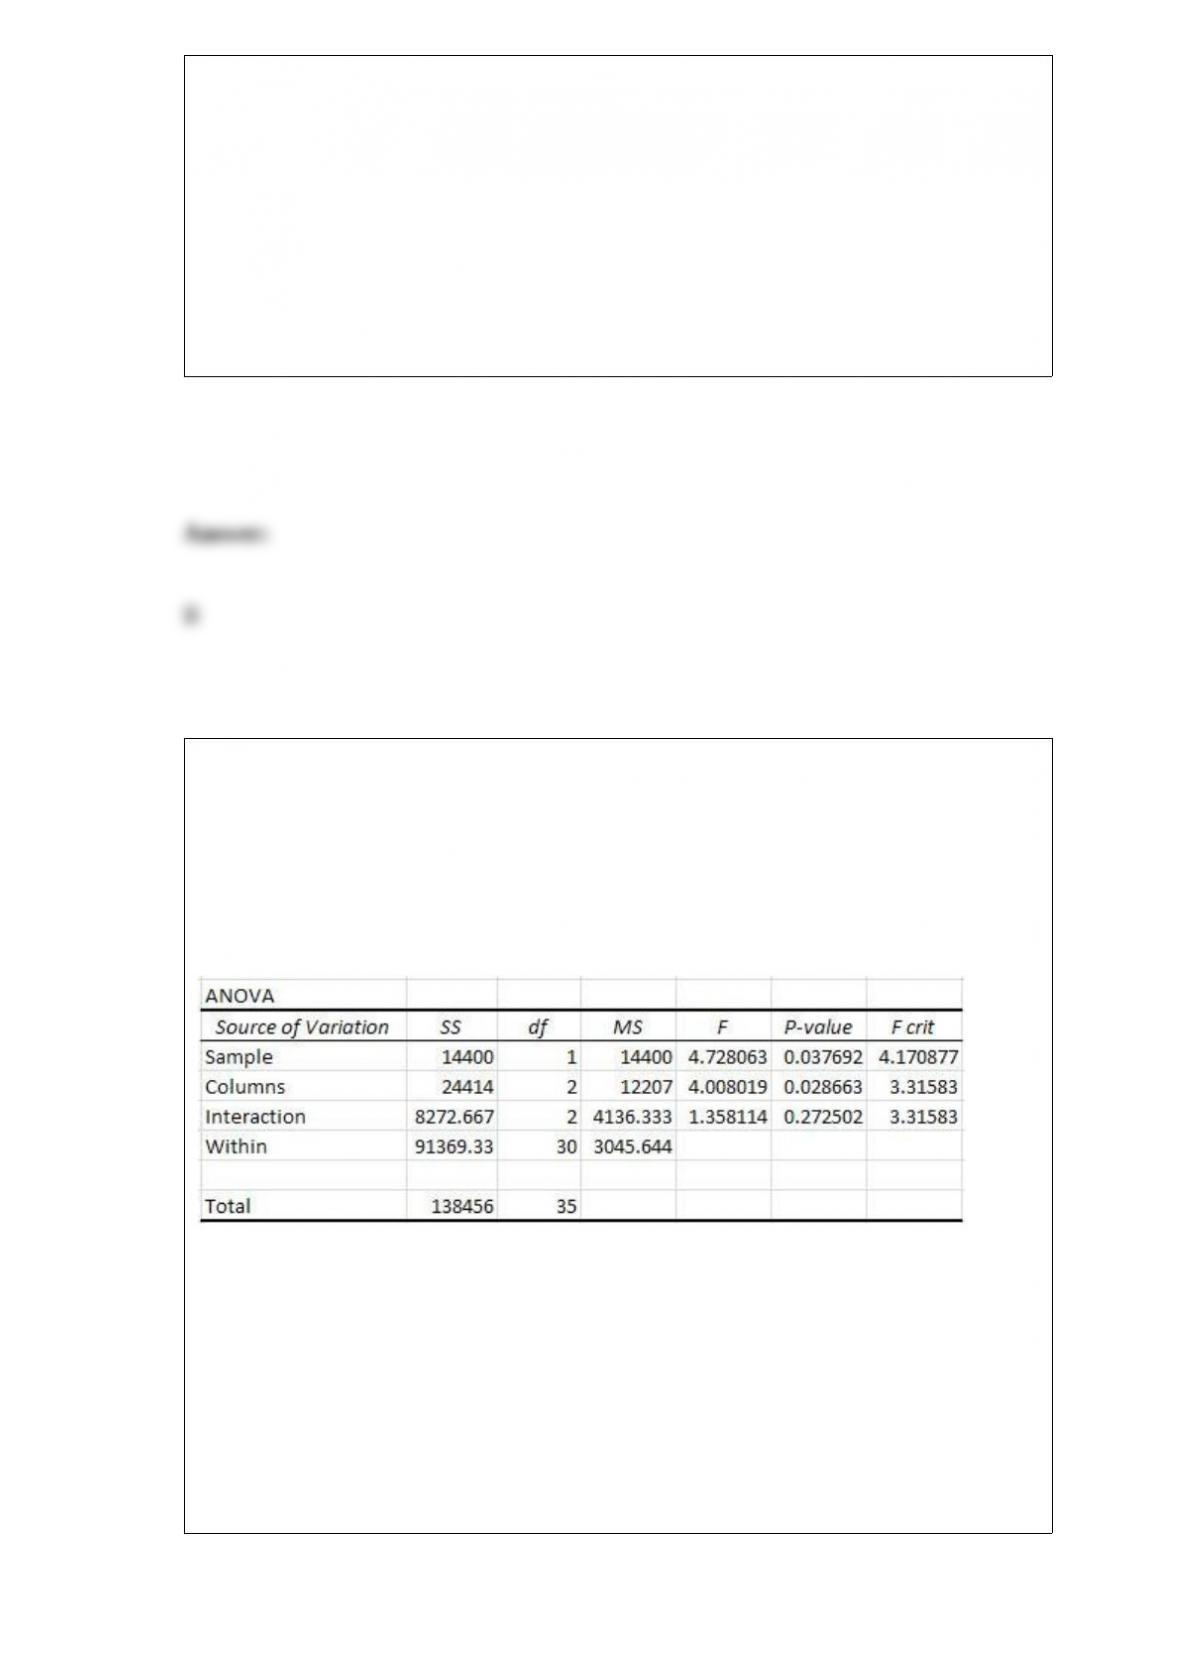
Debbie is a buyer for a retail chain and needs to decide what order quantity to place for
women’s coats for the upcoming winter season. Below is a payoff table, in thousands of
dollars, for various order quantities (1 = lowest, 4 = highest) and demand levels for the
winter coats.
If the Debbie uses the maximin criterion, which order size will she place?
A) Order Quantity 1
B) Order Quantity 2
C) Order Quantity 3
D) Order Quantity 4
Assume that the average talk time on an Apple iPhone is 20 hours and that this time
follows the exponential probability distribution. What is the probability that a randomly
selected iPhone will experience more than 23 hours of talk time?
A) 0.1969
B) 0.3166
C) 0.4258
D) 0.5916
Wells Fargo Bank would like to determine if a difference exists in the average credit
score between residents of the states of Texas, Alaska, and Iowa and also investigate if
age plays a role in credit score. The credit scores from a random sample of residents
from each state was recorded and residents were categorized as being under 40 years
old or 40 years and older. A two-way ANOVA was conducted using α = 0.05 with
Factor A assigned the state residence and Factor B assigned the age group. The results
are shown below.
The number of replications for this two-way ANOVA procedure is ________.
A) 1
B) 2
C) 6
D) 30
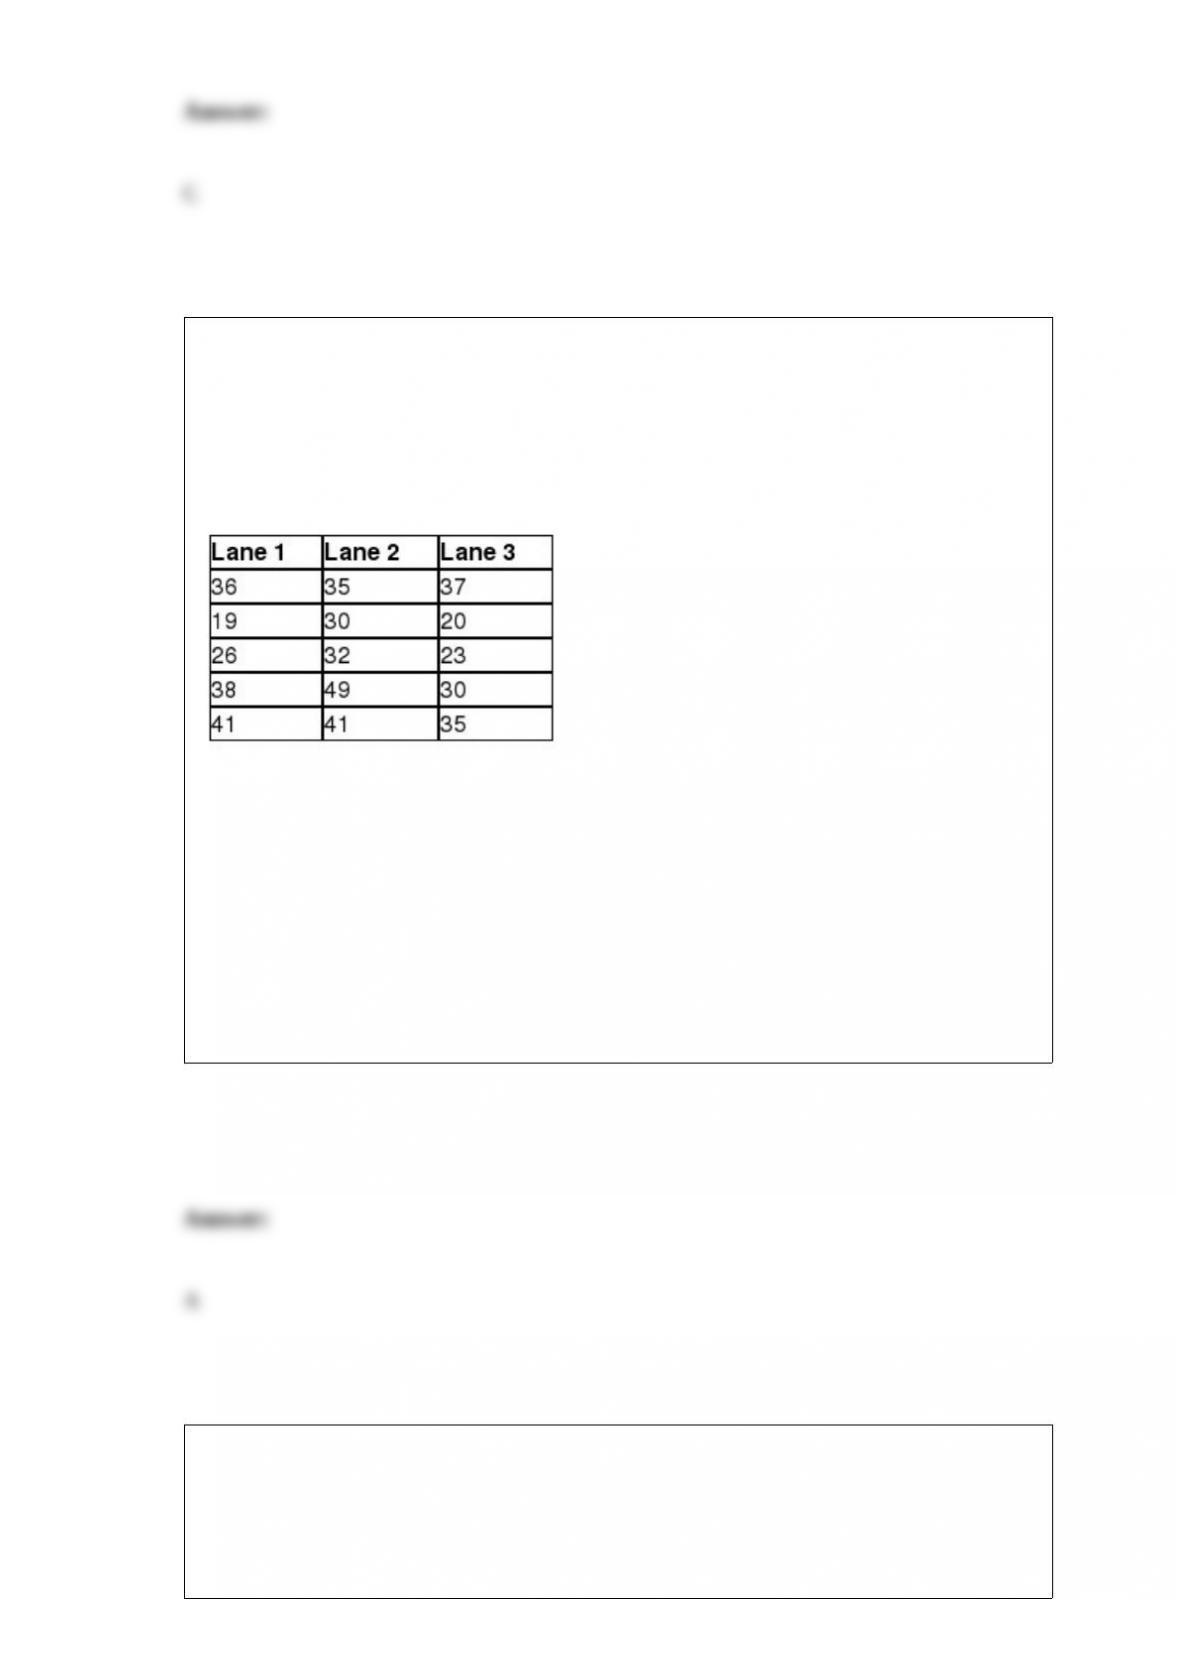
In Delaware, cars are inspected each year using state-operated inspection centers. The
Wilmington center has three drive-through lanes where cars are inspected in a sequence
of steps and would like to test to determine if a difference exists in the median wait time
between lanes. The following data show the number of minutes that a random sample of
drivers spent waiting and having their cars inspected in the three lanes each day of the
week.
The test statistic for this hypothesis test is ________.
A) 1.91
B) 3.70
C) 7.56
D) 9.22
Verizon Wireless would like to estimate the proportion of households that use cell
phones for their phone service without a land line. A random sample of 150 households
was selected and 48 relied strictly on cell phones for their service. The approximate
standard error of the proportion for this sample is ________.

A) 0.0225
B) 0.0381
C) 0.0419
D) 0.0580
Season’s Pizza offers a delivery special for a single topping pizza, drinks, and dessert
with the following choices:
” Pizza sizes four choices
” Pizza crusts four choices
” Pizza toppings nine choices
” Drinks five choices
” Desserts seven choices
How many unique orders can be placed for this delivery special?
Historically, voter turnout for political elections in Texas have been reported to be 54%.
You have been assigned by a polling company to test the hypothesis that voter turnout
during the most recent election was higher than 54%. You have collected a random
sample of 90 registered voters from this elections and found that 54 actually voted. Use

the p-value approach to test this hypothesis with α = 0.02.
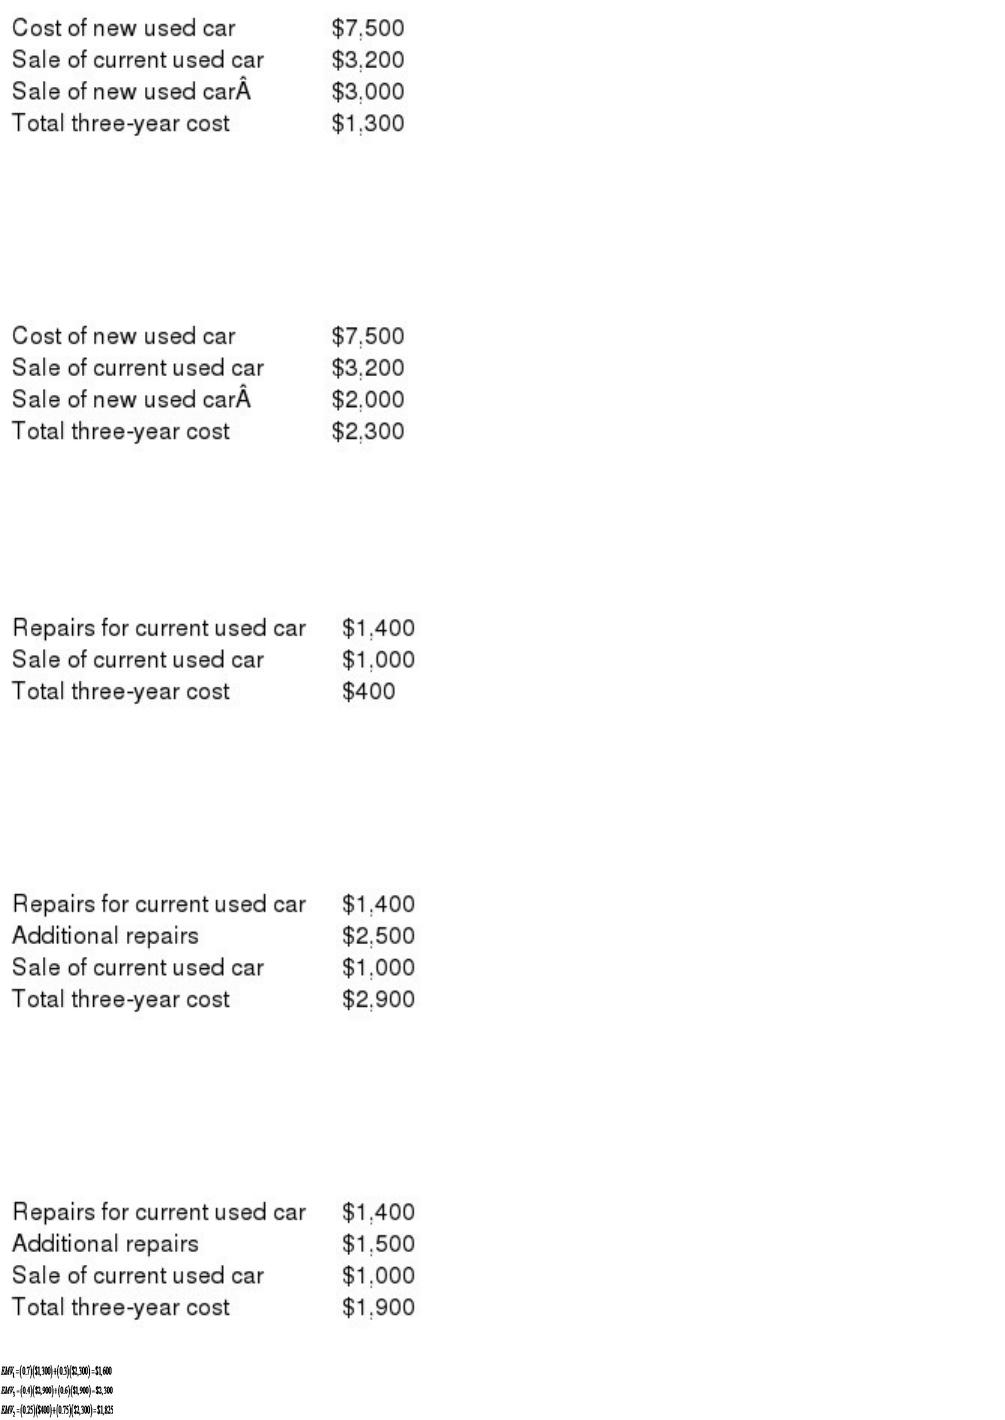
Brian owns a used car that needs repairs and is deciding whether to replace or repair it.
Brian’s goal is to minimize his total costs over the next three years. Brian plans on
attending graduate school as a full-time student in Chicago three years from now during
which he will not need a car. At this time, the car requires $1,400 in repairs. If Brian
repairs the car, he estimates there is a 25% probability that it will not need any repairs
during the next three years. If the car does need repairs during the next three years,
there is a 40% probability that these repairs will cost $2,500 and a 60% probability that
they will cost $1,500. After three years, Brian estimates that he can sell this used car for
$1,000.
Brian is also considering the option of selling his current used car for $3,200 and
purchase a newer used car for $7,500. Under this scenario, Brian feels there is a 70%
probability that he can sell this used car for $3,000 and a 30% probability that it will
sell for $2,000 three years from now. Brian is assuming that the new used car will not
require major repairs during the next three years.
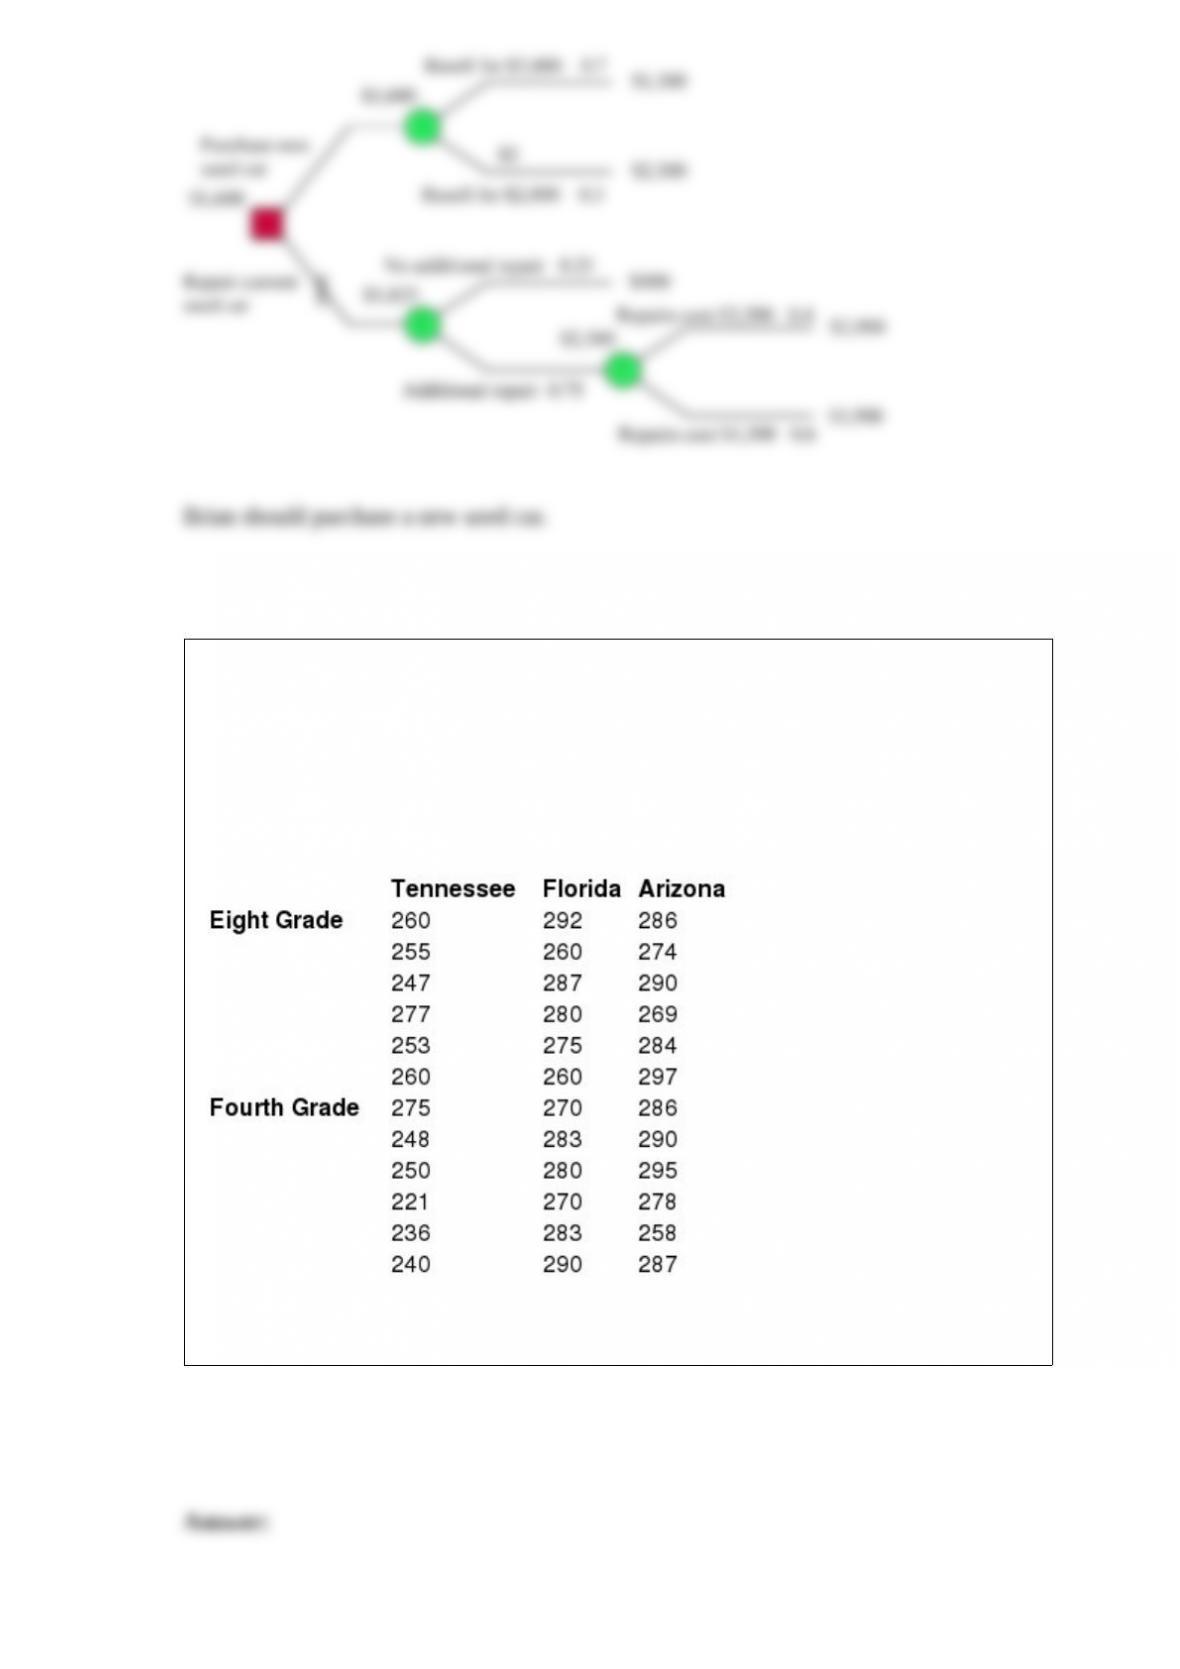
Construct a decision tree to determine if Brian should repair his current car or purchase
a new one.
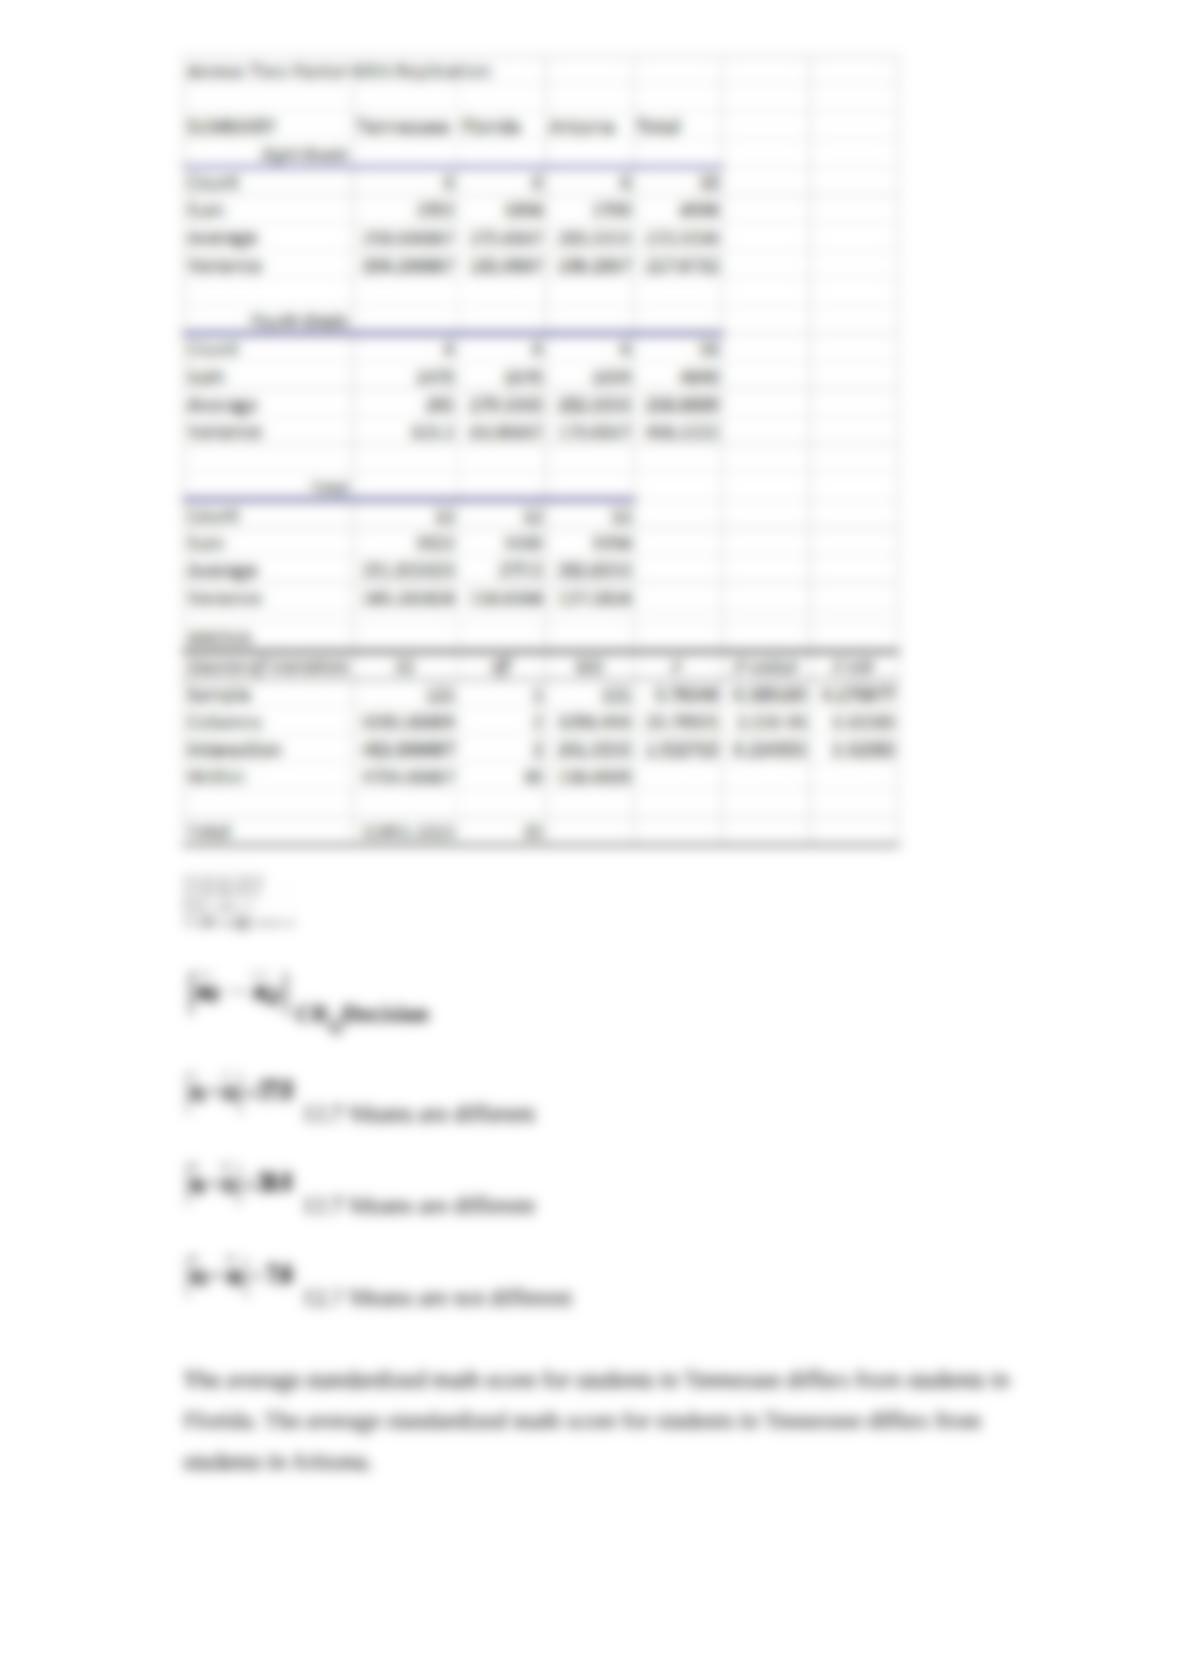
Note: The problems below use the following information:
The following table show the standardized math exam scores for a random sample of
students for three states. The sample included an equal number of eight-graders and
fourth-graders.
If appropriate, perform a multiple comparisons test to determine which states are
different in terms of average standardized math score using α = 0.05.
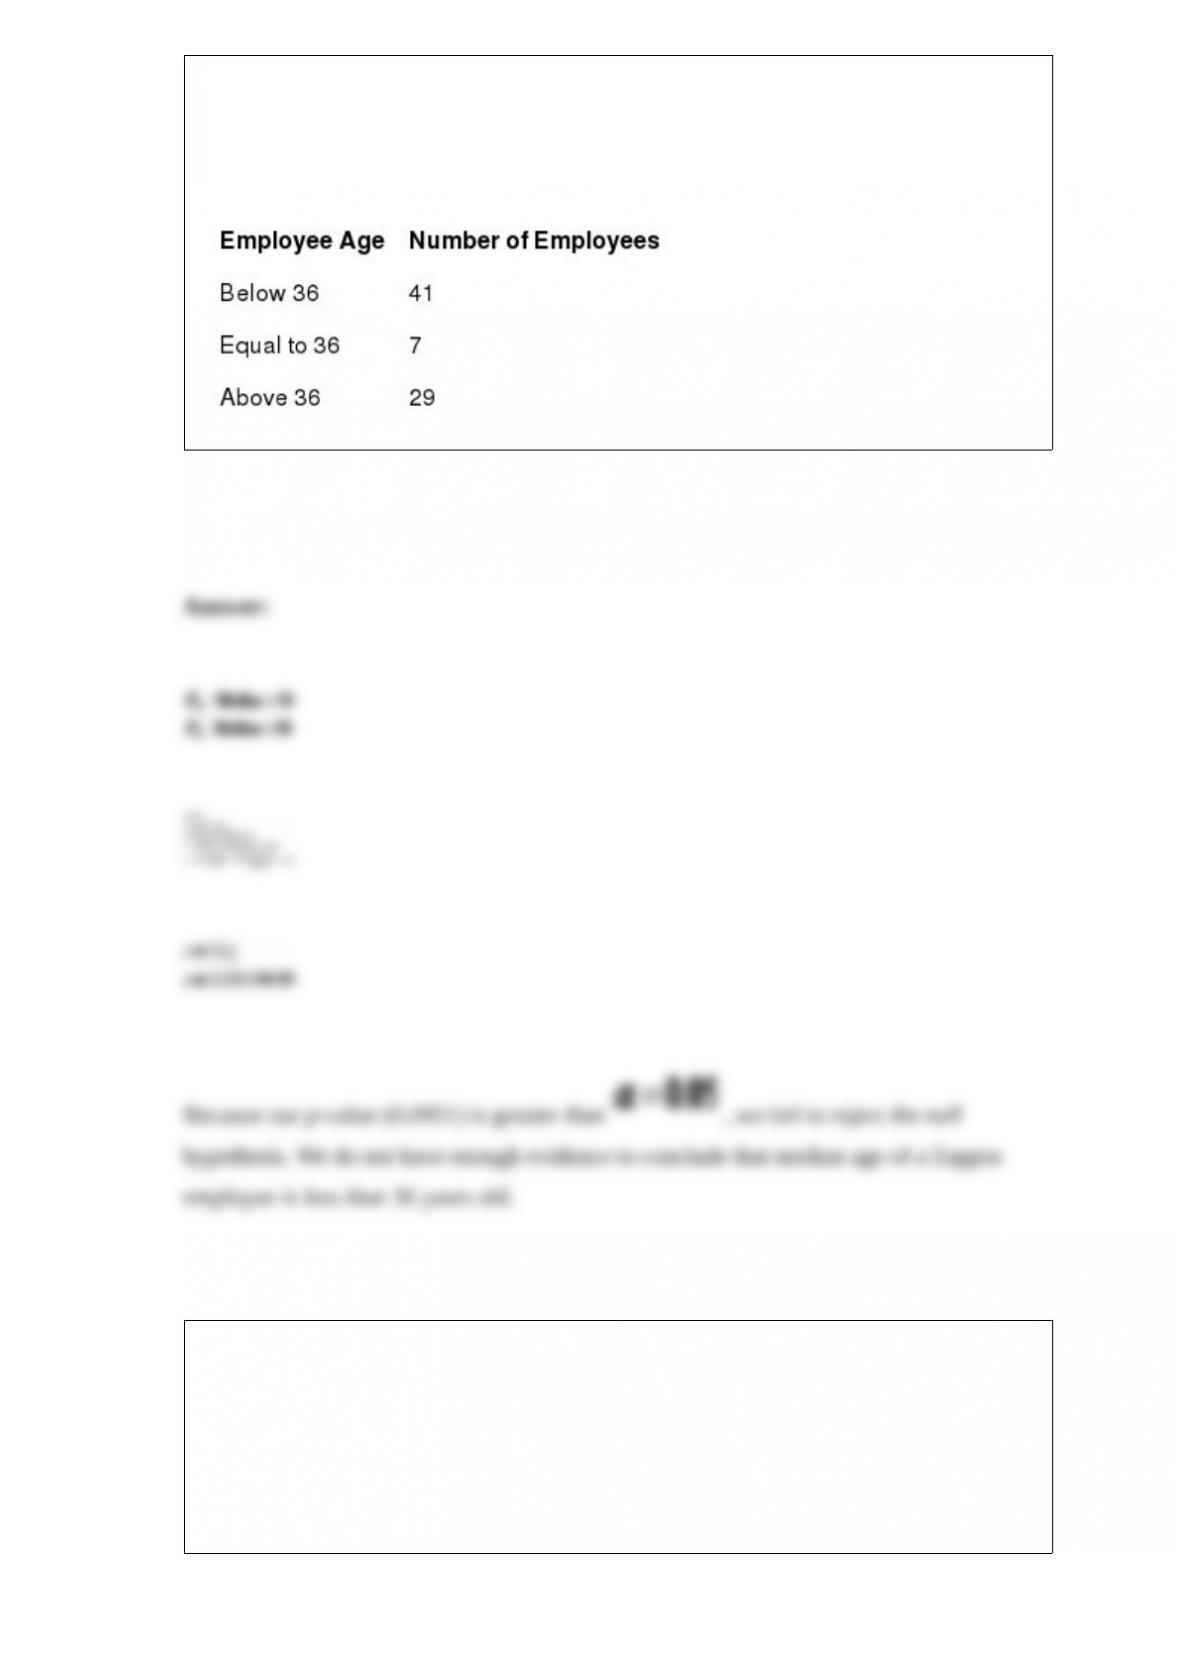
Zappos is an online retailer based in Nevada and employs 1,300 employees. One of
their competitors, Amazon.com, would like to test the hypothesis that the median age of
a Zappos employee is less than 36 years old. The following table summarizes the ages
of a random sample of Zappos employees. Test this hypothesis using α = 0.05.
A local Chamber of Commerce would like to test the hypothesis that the average
monthly rent for a one-bedroom apartment in York is different from the average rent of
a one-bedroom apartment in Lancaster. The following data summarizes the sample
statistics for one-bedroom apartment rents for both locations. Assume that the
population variances are equal.
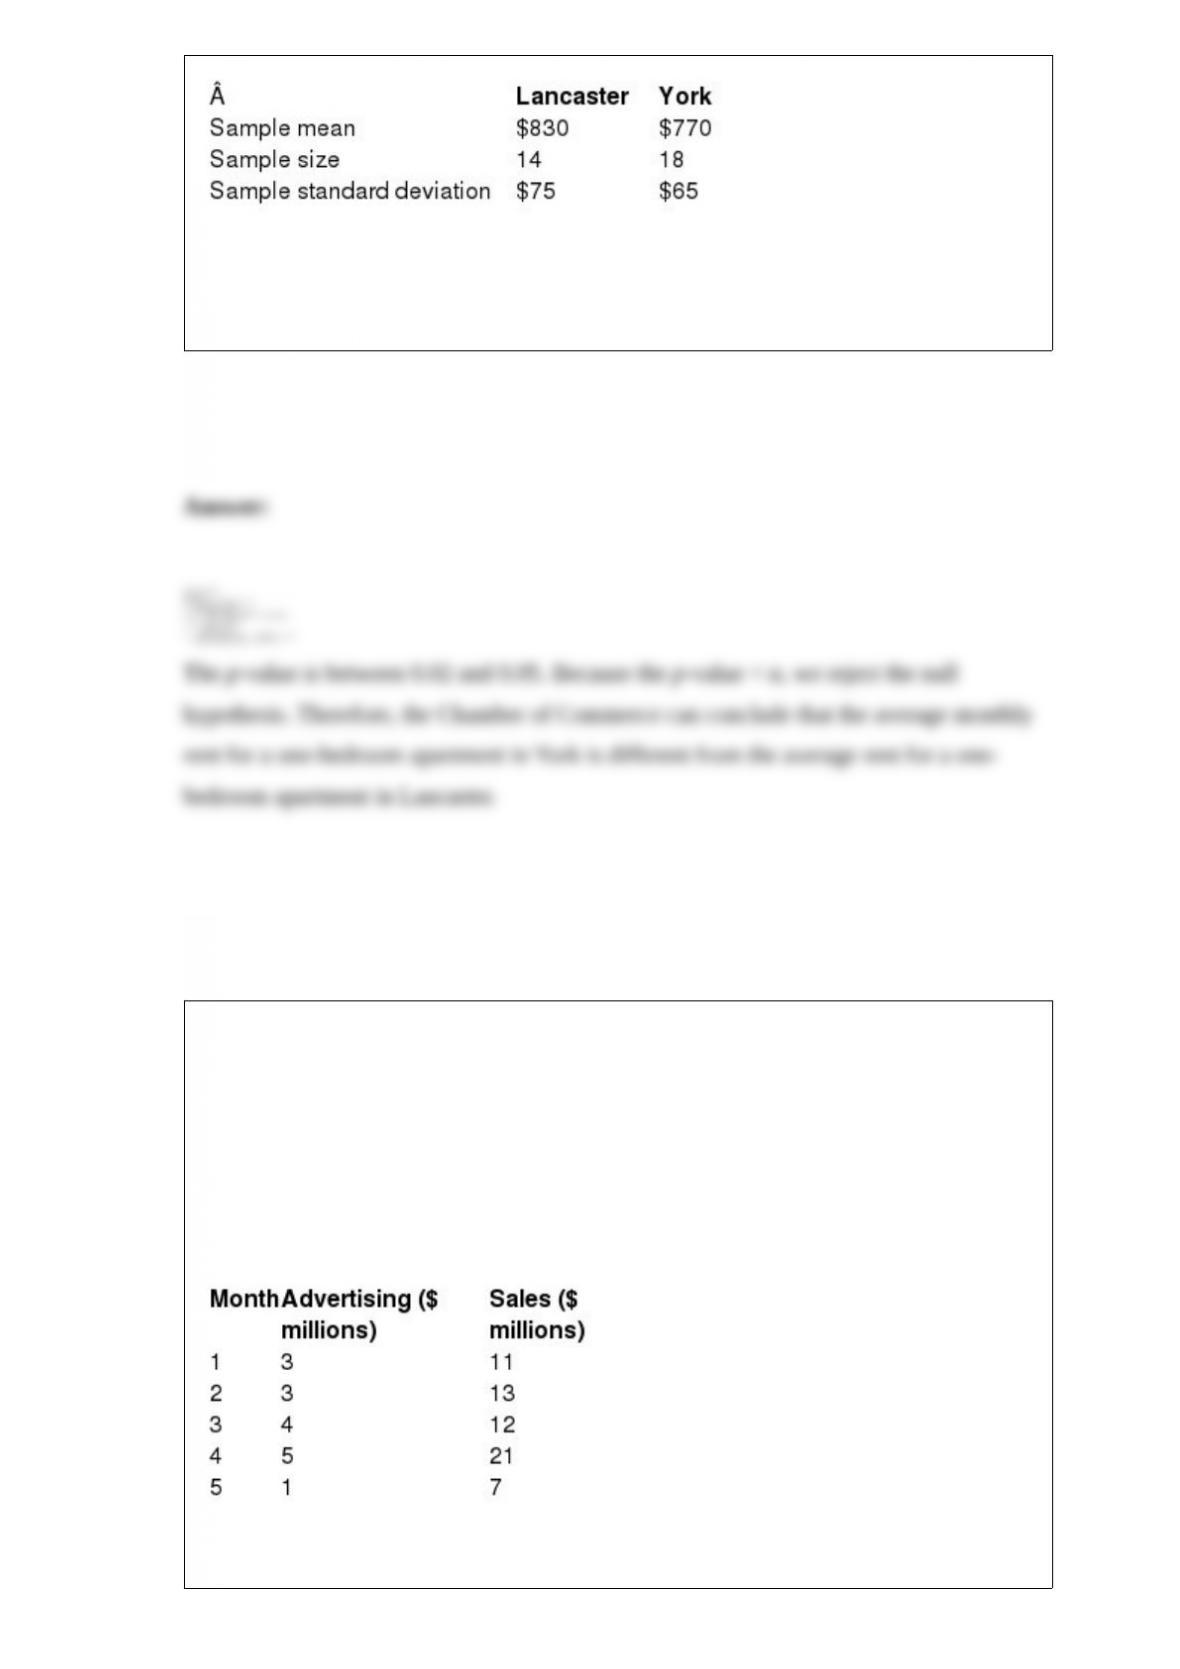
Define Population 1 as Lancaster apartments and Population 2 as York apartments and
use the p-value approach to test this hypothesis with α = 0.05.
Use the information below to answer the following question(s).
Steve Taylor is the owner of Home Plus, which is a chain of home improvement stores.
He would like to investigate the relationship between month advertising and monthly
sales. The table below shows the amount spent on advertising, in millions of dollars,
over several months along with the corresponding sales, also in millions of dollars.
Use the Home Plus data to perform a hypothesis test to determine if the population
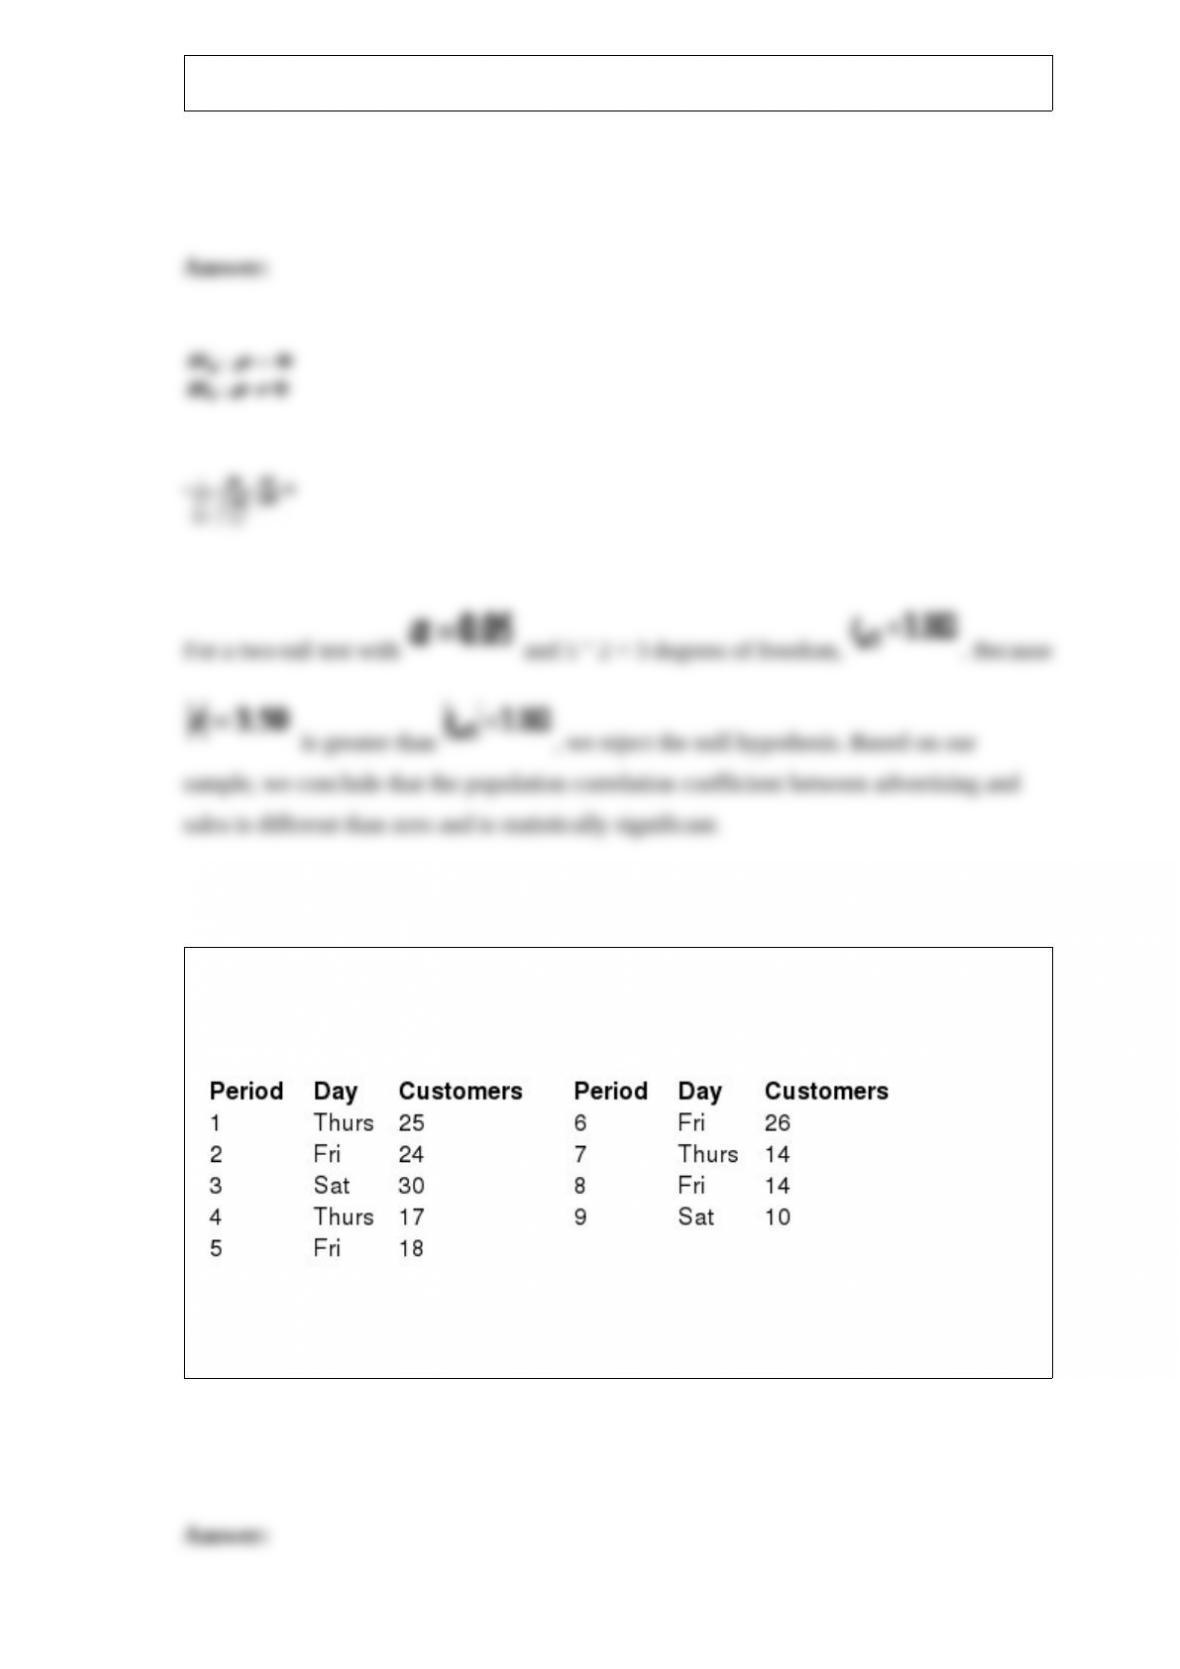
correlation coefficient is different than zero using α = 0.05.
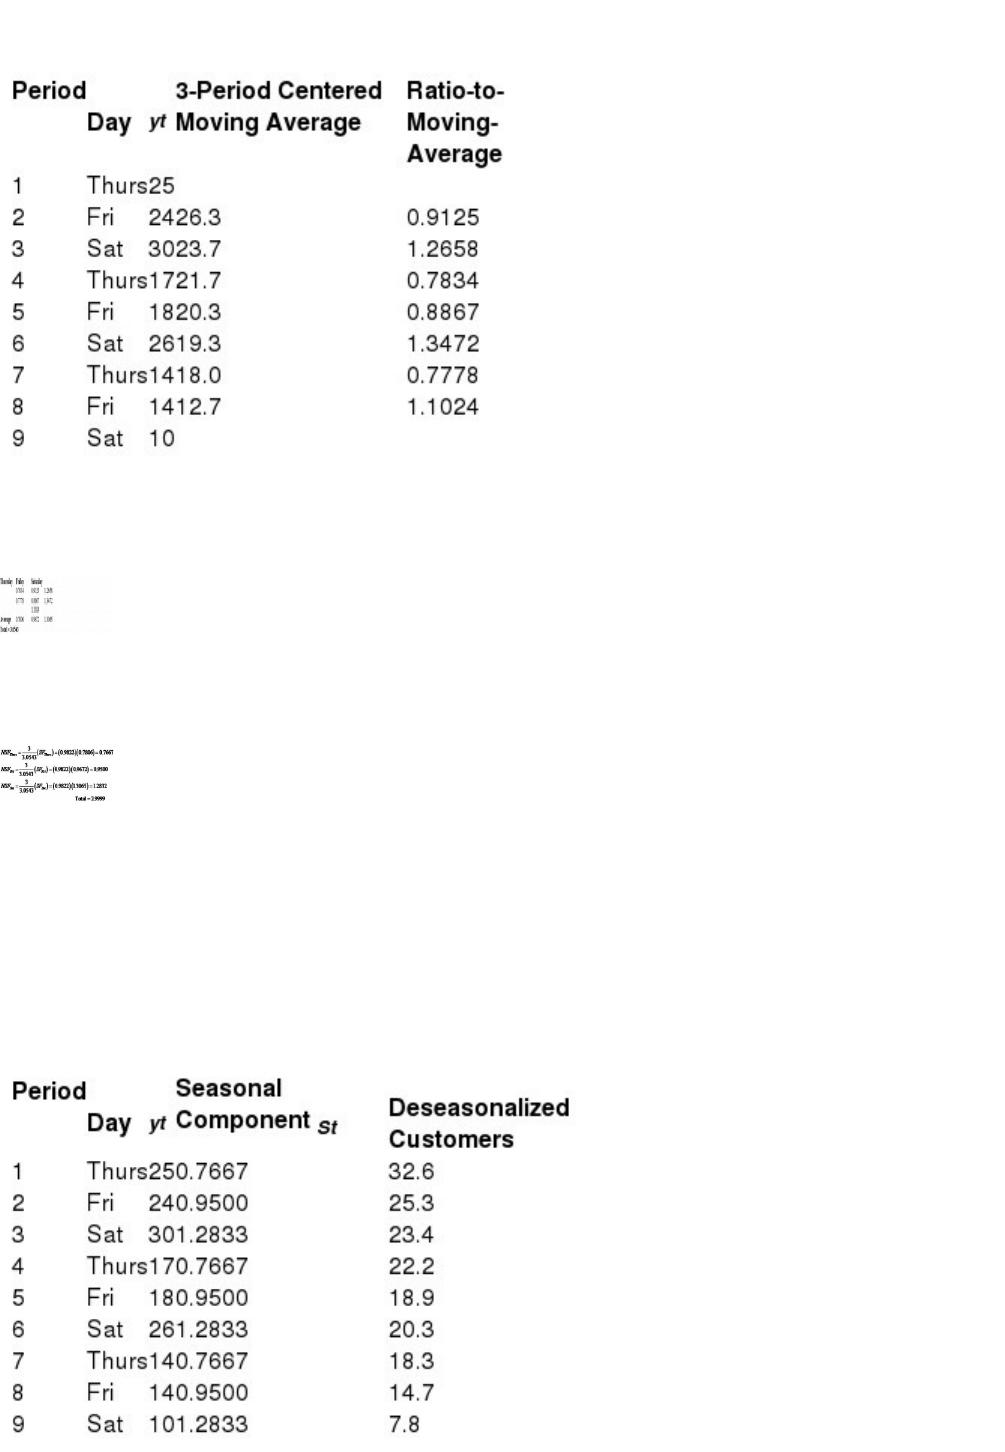
Katie is a waitress at the Princeton Restaurant and works on Thursday, Friday, and
Saturday nights. The following table shows the number of customers that she served
during the past nine nights on her schedule.
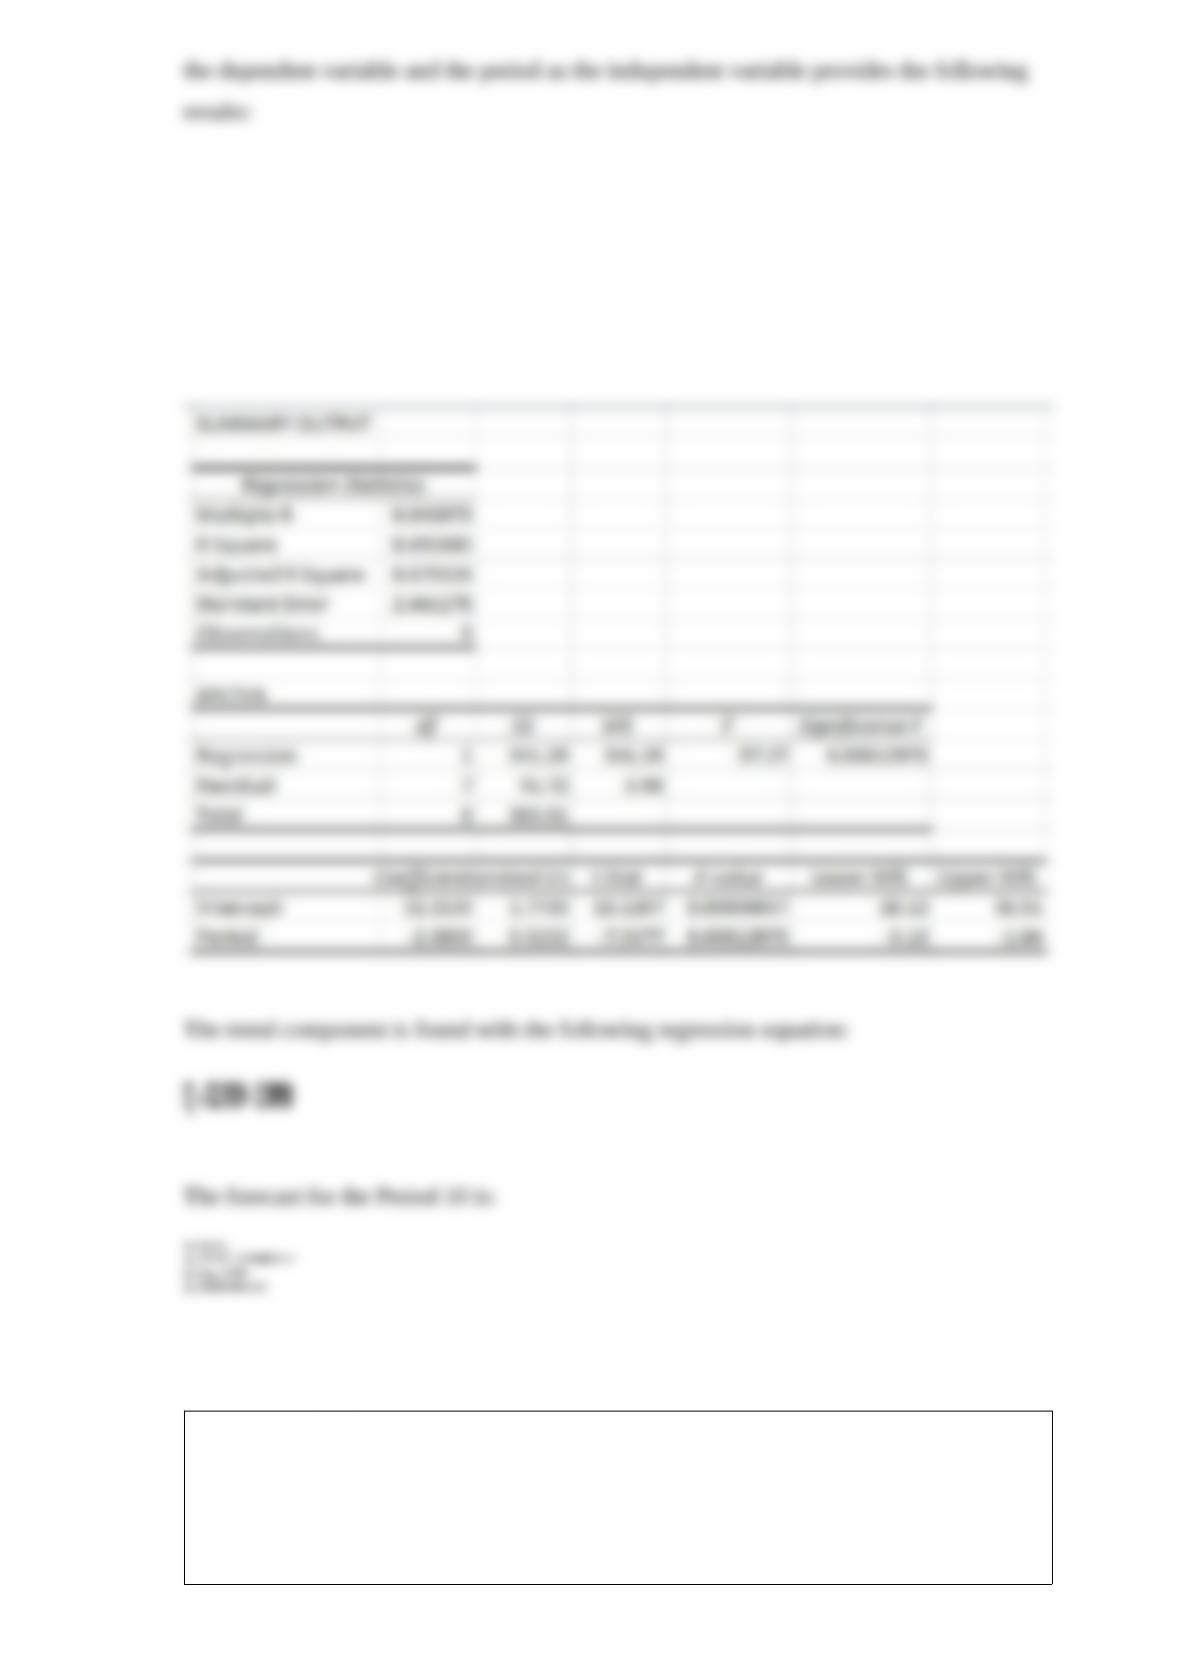
Use multiplicative decomposition to forecast the number of customers that Katie will
serve in Period 10.
Breyers is a major producer of ice cream and would like to test the hypothesis that the
variance for the number of ounces of ice cream that Americans consume per month is
more than 15. A random sample of 23 Americans was found to have a standard
deviation of 4.4 ounces for the quantity of ice cream consumed per month. Test this
hypothesis using α = 0.05.