
If a decision maker wishes to test whether four independent populations have the same
center and is unwilling to make the assumption that the populations are normally
distributed with equal variances, she can use the Kruskal-Wallis test.
In hypothesis testing, the null hypothesis should contain the equality sign.
In a university statistics course a correlation of -0.8 was found between numbers of
classes missed and course grade. This means that the fewer classes students missed, the
higher the grade.
Of the two types of statistical errors, the one that decision makers have most control
over is Type I error.
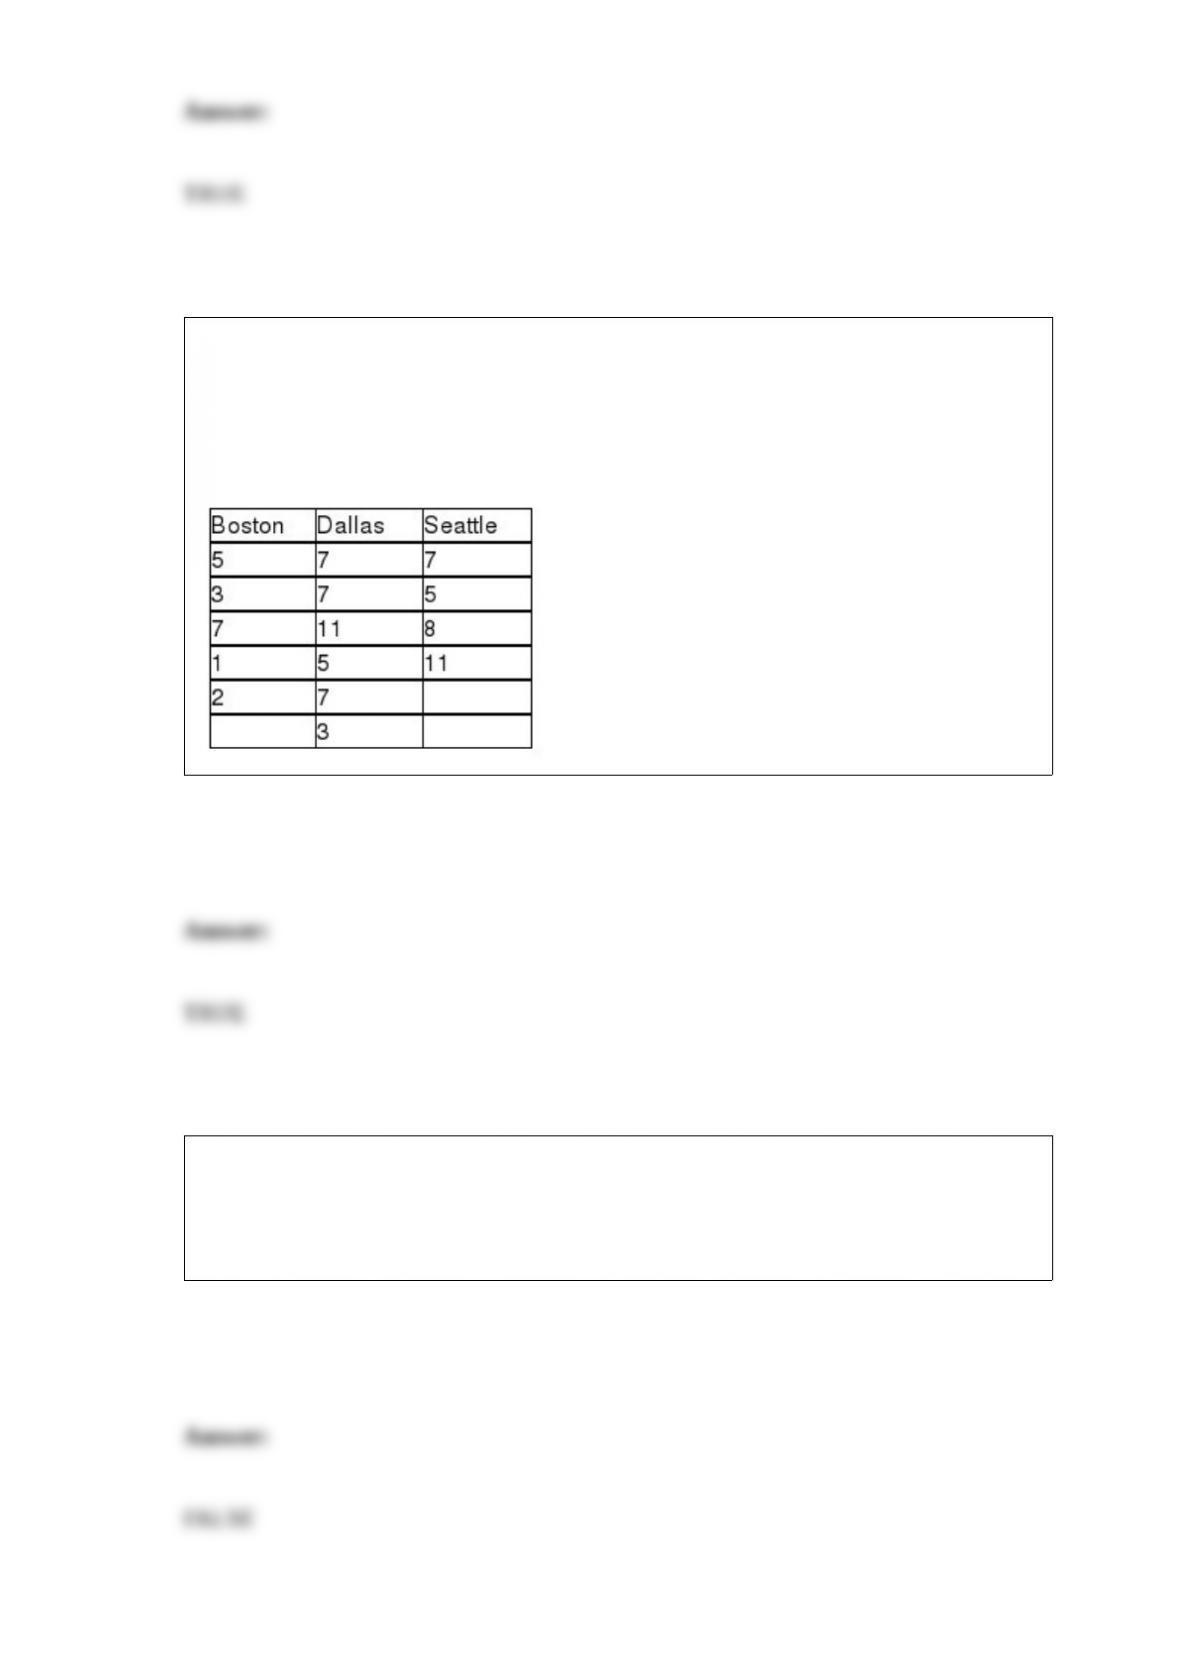
A national car rental agency is interested in determining whether the mean days that
customers rent cars is the same between three of its major cities. The following data
reflect the number of days people rented a car for a sample of people in each of three
cities. Assuming that a one-way analysis of variance is to be performed, the total sum of
squares is computed to be approximately 120.9.
A study was recently conducted to see whether the mean starting salaries for graduates
of engineering, business, healthcare, and computer information systems majors differ. A
random sample of 8 graduates was selected from each major. If the test is to be
conducted using an alpha = 0.05 level, the critical value will be F = 3.838.

The number of defects manufactured by workers in a small engine plant is an example
of a discrete random variable.
The logic behind the Mann-Whitney U test is that if the hypothesis is true that the
populations have equal central locations, then the sum of the ranks from each
population will be approximately equal.
In a situation where we know the population standard deviation but wish to estimate the
population mean using a 90 percent confidence interval, the critical value is z = 1.645.
Suppose the time it takes for a customer to be served at a fast-food chain business is
thought to be uniformly distributed between 3 and 8 minutes, then the probability that a
customer is served in less than 3 minutes is 0.

A pie chart is almost always constructed when the variable of interest is qualitative.
A continuous random variable approaches normality as the level of skewness increases.
Data collected on the Internet can generally be considered accurate since the data must
go through a screening process before they can be placed on the Internet.

An advertising company is interested in determining if there is a difference in the mean
sales that will be generated for a soft drink company based on which shelf the soft
drinks are located. There are four possible shelf levels. The ad company wants to
control for store size. The following data reflect the sales for one week at each
combination of shelf level and store size.
Based on the experimental design, the calculated F-test statistic value for testing
whether blocking on store size was effective is approximately 16.3.
Population parameters are descriptive numerical measures, such as an average, that
describe the entire population.
To show the relationship between amount of rainfall and the number of car accidents,
the best type of graph to use is a scatter diagram.

The state insurance commissioner believes that the mean automobile insurance claim
filed in her state exceeds $1,700. To test this claim, the agency has selected a random
sample of 20 claims and found a sample mean equal to $1,733 and a sample standard
deviation equal to $400. They plan to conduct the test using a 0.05 significance level.
Based on this, the null hypothesis should be rejected if > $1,854.66 approximately.
In curvilinear regression modeling, a composite model is one that contains either the
basic terms or the interactive terms but not both.
A correlation matrix shows the correlation between each independent variable and the
dependent variable but gives no information about the potential for multicollinearity
problems.
Assume a sample of size n = 12 has been collected. To perform a hypothesis test of a
population variance using a 0.05 level of significance, where the null hypothesis is:
H0: σ2 = 25
The upper tail critical value is 21.92.
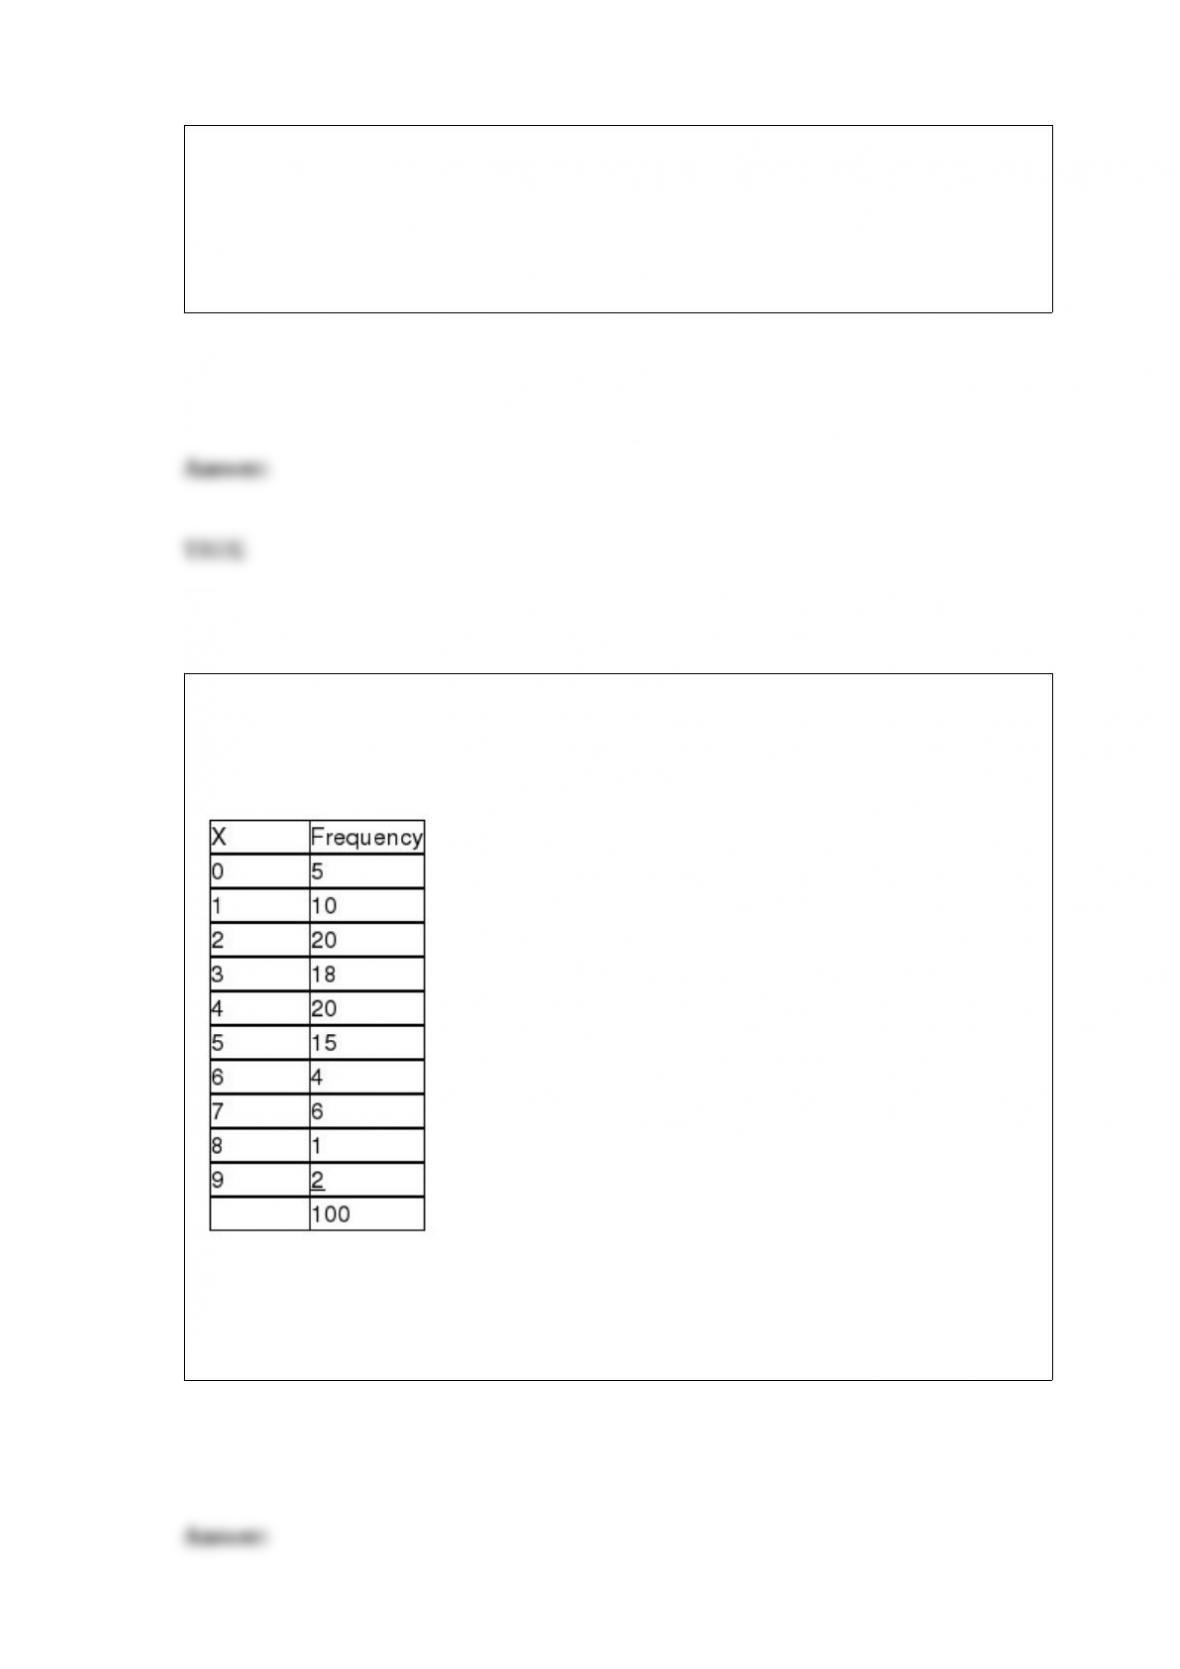
It is believed that the number of drivers who are ticketed for speeding on a particular
stretch of highway is a Poisson distribution with a mean of 3.5 per hour. A random
sample of 100 hours is selected with the following results:
Given this information, and without regard to whether there is a need to combine cells
due to expected cell frequencies, the critical value for testing whether the distribution is
Poisson with a mean of 3.5 per hour at an alpha level of .05 is x2 = 15.5073.
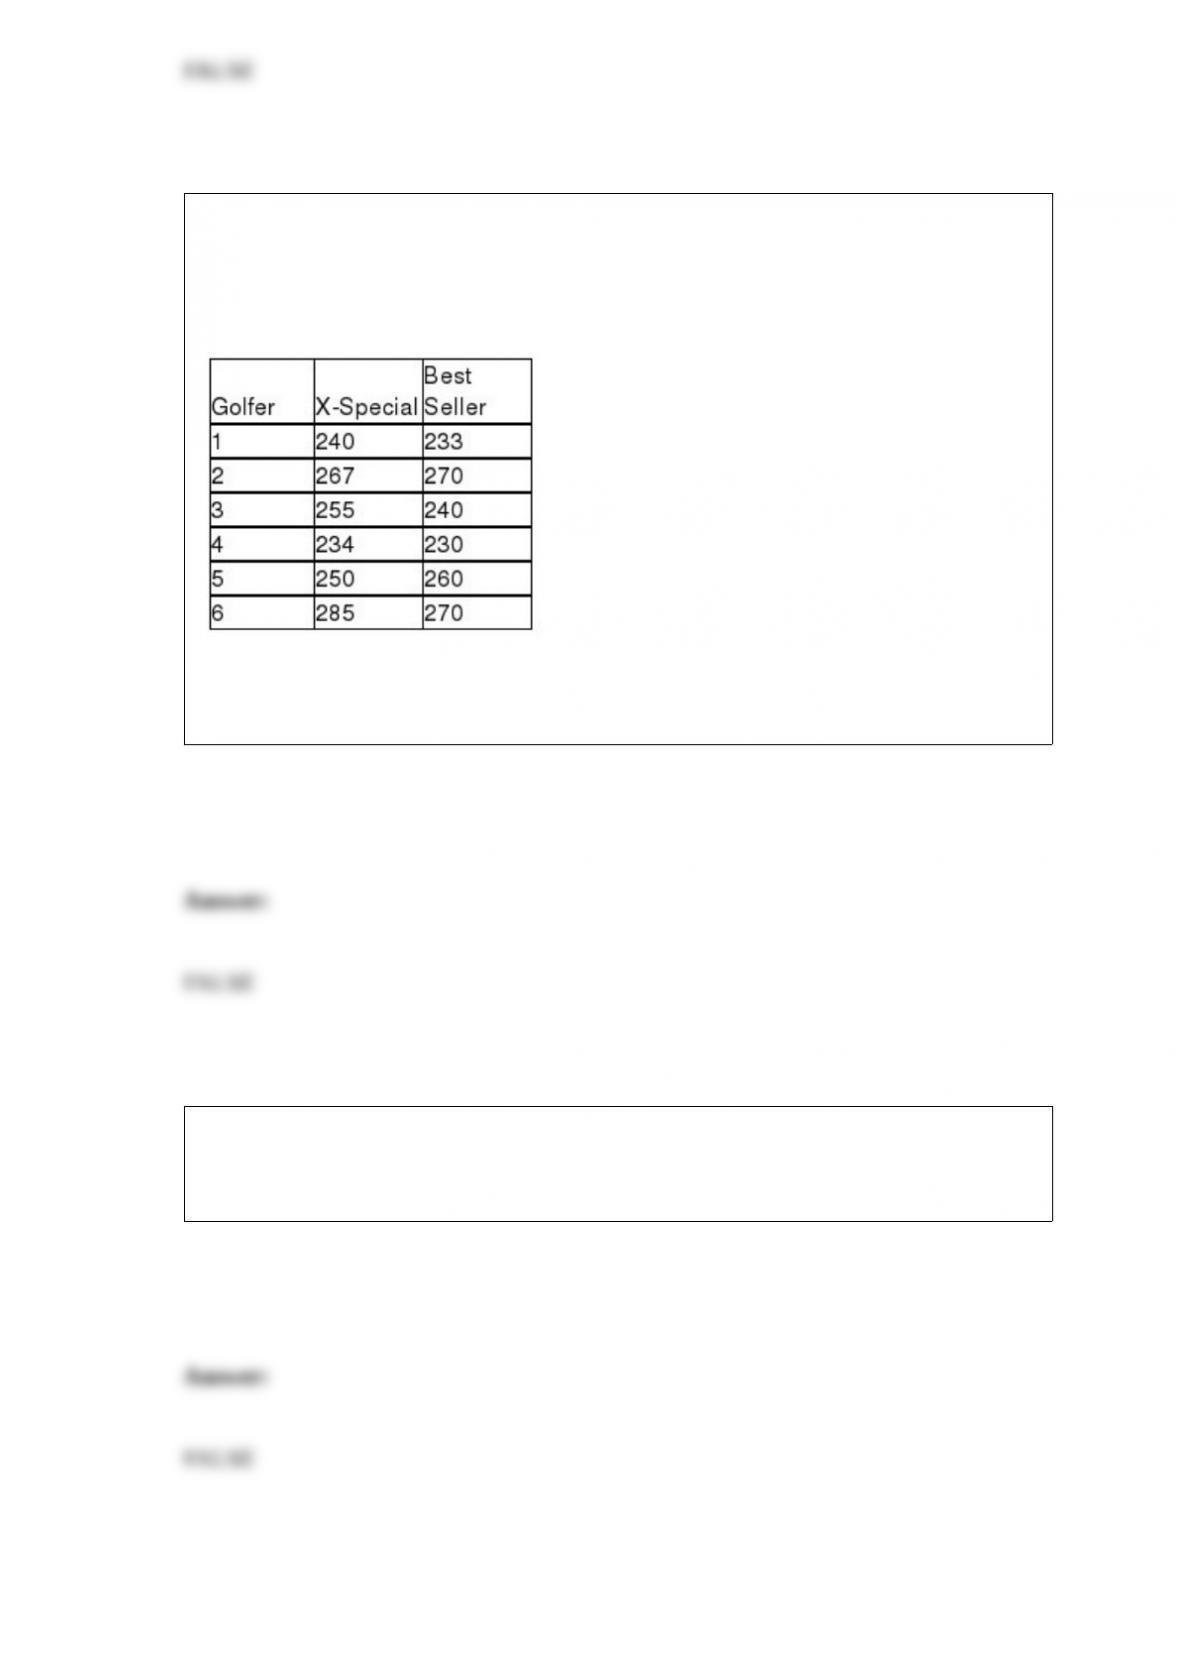
In order to determine whether the median distance for the X-Special golf ball exceeds
the median distance for the best-selling golf ball, six golfers were selected and asked to
hit each ball with their driver. The distance was recorded. The following data were
observed.
Based on these data, and testing at an alpha = 0.025 level, the critical value for the
Wilcoxon Matched Pairs Signed Rank test is 2.
An emergency room in a hospital wants to determine the sample size needed for
estimating their mean number of visits per day. If they want a 99 percent confidence
level the correct critical value to use is 2.33.

In conducting a one-way analysis of variance, if the null hypothesis is true then the
variance between groups (MSB) should be approximately equal to the variance within
groups (MSW).
In constructing a frequency distribution for the savings account balances for customers
at a bank, the following class boundaries might be acceptable if the minimum balance is
$5.00 and the maximum balance is $18,700:
$0.00 – $5,000
$5,000 – 10,000
$10,000 – $15,000
$15,000 – $20,000
A market research firm that surveys customers in a shopping mall by asking various
people to respond to a short survey about a new product is performing convenience
sampling.

One of the most important aspects of quality improvement is the idea of reducing the
variability in a product or service. For instance, a major bank has worked to reduce the
variability in the service time at the drive-through. The managers believe that the
standard deviation in service time should not exceed 30 seconds. To test whether this
goal is being achieved, a random sample of n = 25 cars is selected each week and the
service time for each car is measured. Last week, the mean time was 345 seconds with a
standard deviation equal to 38 seconds. Given this information, if the significance level
is 0.10, the critical value from the chi-square table is about 34.3.
One of the roles of managers who are overseeing the statistical process control analysis
is to set the control limits at the desired levels prior to collecting data from the process.
For a given significance level, increasing the sample size will tend to increase the
chi-square critical value used in testing the null hypothesis about a population variance.

You should not include more than one categorical variable in a multiple regression
because the use of two or more will cause misleading results.
An accounting firm has been hired by a large computer company to determine whether
the proportion of accounts receivables with errors in one division (Division 1) exceeds
that of the second division (Division 2). The managers believe that such a difference
may exist because of the lax standards employed by the first division. To conduct the
test, the accounting firm has selected random samples of accounts from each division
with the following results.
Based on this information and using a significance level equal to 0.05, the critical value
from the standard normal table is z = 1.645.
The Mann-Whitney U test is a nonparametric test that is used to test whether two
related populations have the same median.

When customers come to a bank, there are three primary locations they may select to go
to: teller, loan officer, or escrow department. Based on past experience, the following
probability distribution applies:
Seventy percent of customers are males. The probability that three consecutive
customers all go to a teller is approximately 0.22.
When estimating a confidence interval for the difference between 2 means using the
method where sample variances are pooled, which of the following assumptions is not
needed?
A) The populations are normally distributed.
B) The populations have equal variances.
C) The samples are independent.
D) The sample sizes are equal.

A package delivery service claims that no more than 5 percent of all packages arrive at
the address late. Assuming that the conditions for the binomial hold, if a sample of size
10 packages is randomly selected, and the 5 percent rate holds, what is the probability
that exactly 2 packages in the sample arrive late?
A) 0.0746
B) 0.9884
C) 0.2347
D) 0.0439
A company that makes shampoo wants to test whether the average amount of shampoo
per bottle is 16 ounces. The standard deviation is known to be 0.20 ounces. Assuming
that the hypothesis test is to be performed using 0.10 level of significance and a random
sample of n = 64 bottles, how large could the sample mean be before they would reject
the null hypothesis?
A) 16.2 ounces
B) 16.049 ounces
C) 15.8 ounces
D) 16.041 ounces

The U.S. Post Office is interested in estimating the mean weight of packages shipped
using the overnight service. They plan to sample 300 packages. A pilot sample taken
last year showed that the standard deviation in weight was about 0.15 pound. If they are
interested in an estimate that has 95 percent confidence, what margin of error can they
expect?
A) Approximately 0.017 pound
B) About 0.0003 pound
C) About 1.96
D) Can’t be determined without knowing the population mean.
Which of the following is true about the difference between stem and leaf diagrams and
histograms?
A) There is no difference.
B) The stem and leaf diagram shows more information by showing the individual
values.
C) The histogram shows the shape center and spread of the distribution while the stem
and leaf does not.
D) The stem and leaf diagram shows less information than a histogram.
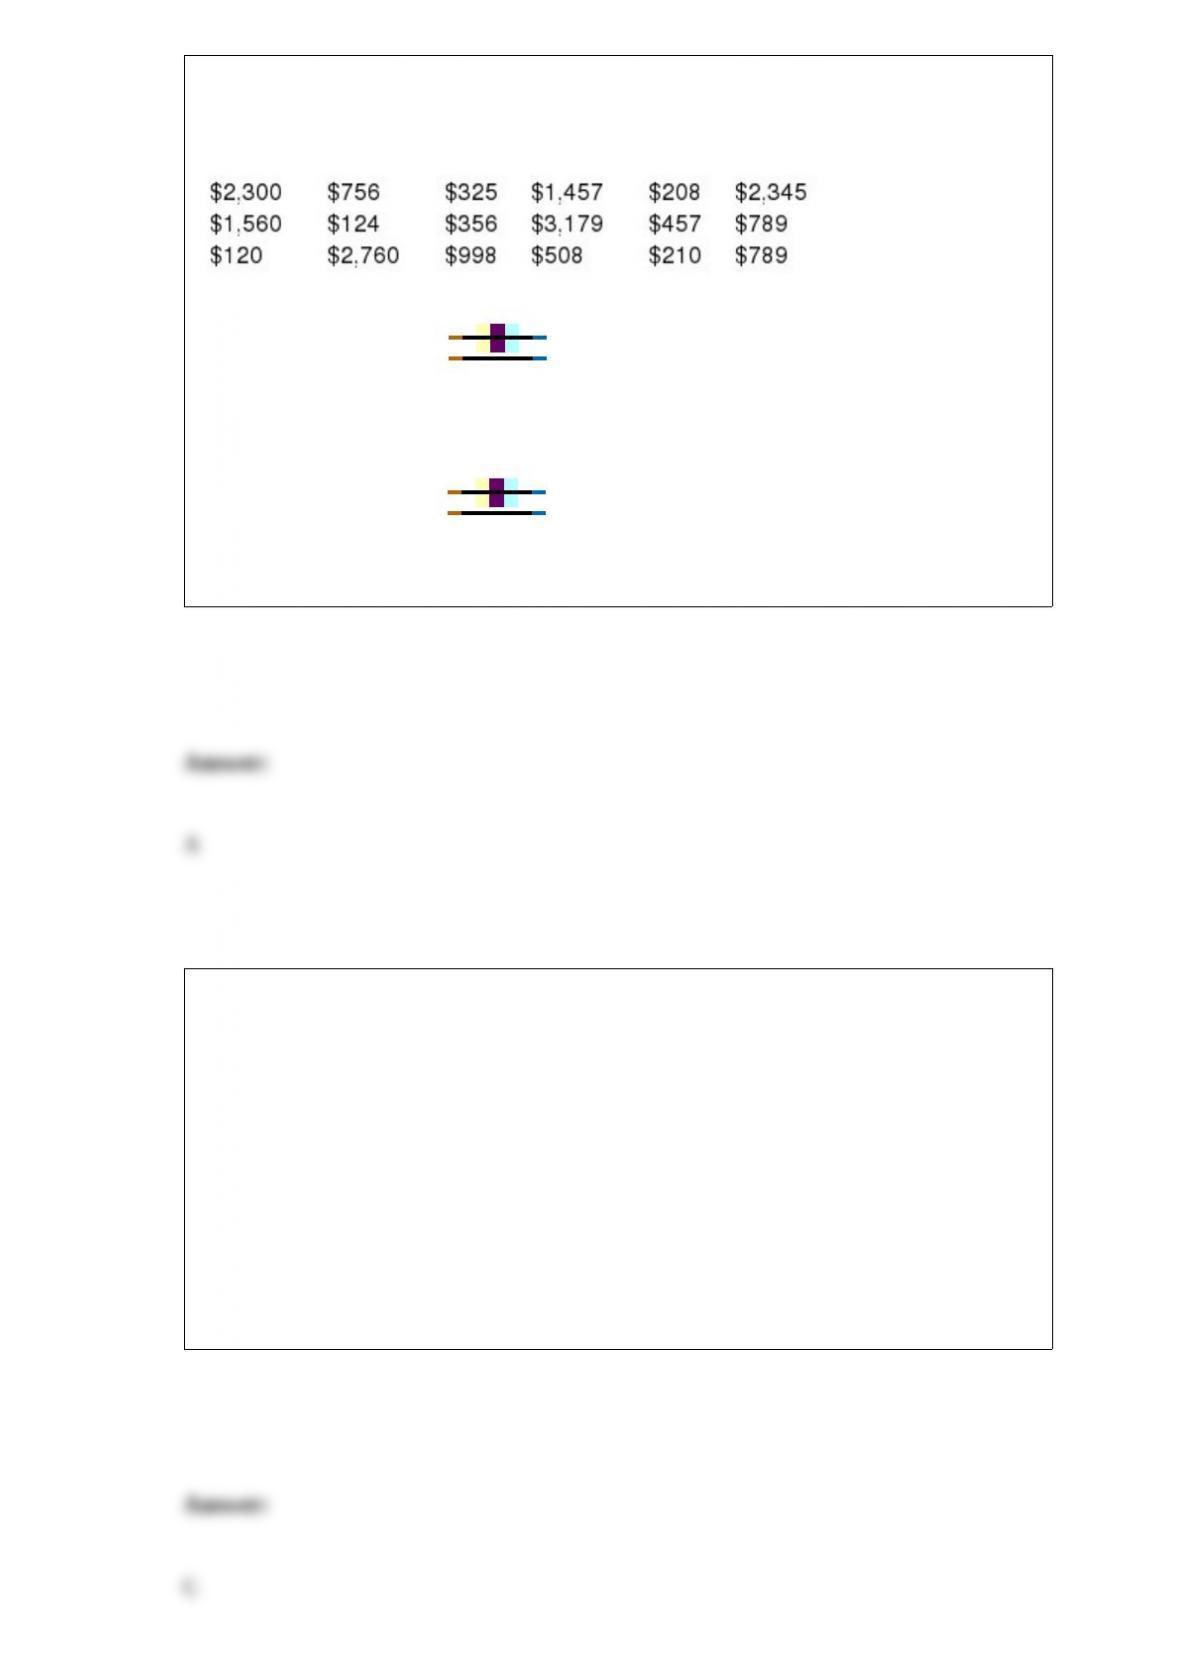
The following data represent a random sample of bank balances for a population of
checking account customers at a large eastern bank. Based on these data, what is the 95
percent confidence interval estimate for the true population mean?
A) Approximately $1,069 $484.41
B) About $839.40 to $1,298.60
C) Approximately $1,069 2.1098
D) None of the above
Recently a study of fans attending the New York Mets baseball games was conducted
and 500 fans were surveyed. In forming a frequency distribution of the number of miles
fans traveled from home to the stadium, it was found that 247 fans traveled between 0
and 5 miles. Based on this information what was the relative frequency for this class?
A) 0.247
B) 0.30
C) 0.494
D) Can’t be determined without more information.

Given the following null and alternative hypotheses
H0 : μ1 ≥ μ2
HA : μ1 < μ2
Together with the following sample information
Assuming that the populations are normally distributed with equal variances, test at the
0.10 level of significance whether you would reject the null hypothesis based on the
sample information. Use the test statistic approach.
A) Because the calculated value of t = -1.415 is less than the critical value of t=-1.3104,
reject the null hypothesis. Based on these sample data, at the α = 0.10 level of
significance there is sufficient evidence to conclude that the mean for population 1 is
less than the mean for population 2.
B) Because the calculated value of t = -1.329 is less than the critical value of t=-1.3104,
reject the null hypothesis. Based on these sample data, at the α = 0.10 level of
significance there is sufficient evidence to conclude that the mean for population 1 is
less than the mean for population 2.
C) Because the calculated value of t = -0.429 is not less than the critical value of
t=-1.3104, do not reject the null hypothesis. Based on these sample data, at the α = 0.10
level of significance there is not sufficient evidence to conclude that the mean for
population 1 is less than the mean for population 2.
D) Because the calculated value of t = -0.021 is not less than the critical value of
t=-1.3104, do not reject the null hypothesis. Based on these sample data, at the α = 0.10
level of significance there is not sufficient evidence to conclude that the mean for
population 1 is less than the mean for population 2.

The National Football League has performed a study in which the total yards gained by
teams in games was used as an independent variable to explain the variation in total
points scored by teams during games. The points scored ranged from 0 to 57 and the
yards gained ranged from 187 to 569. The following regression model was determined:
= 12.3 + .12x
Given this model, which of the following statements is true?
A) The average points scored for teams who gain zero yards during a game is -12.3
points.
B) The average yards gained will increase by .12 for every additional point scored.
C) The average change in points scored for each increase of one yard will be 0.12
D) The average number of points scored per game is 12.3
Considering the following printout from a two-factor ANOVA design, how many levels
of factor A (Sample) were there in this study?
A) 4
B) 3
C) 2
D) 6
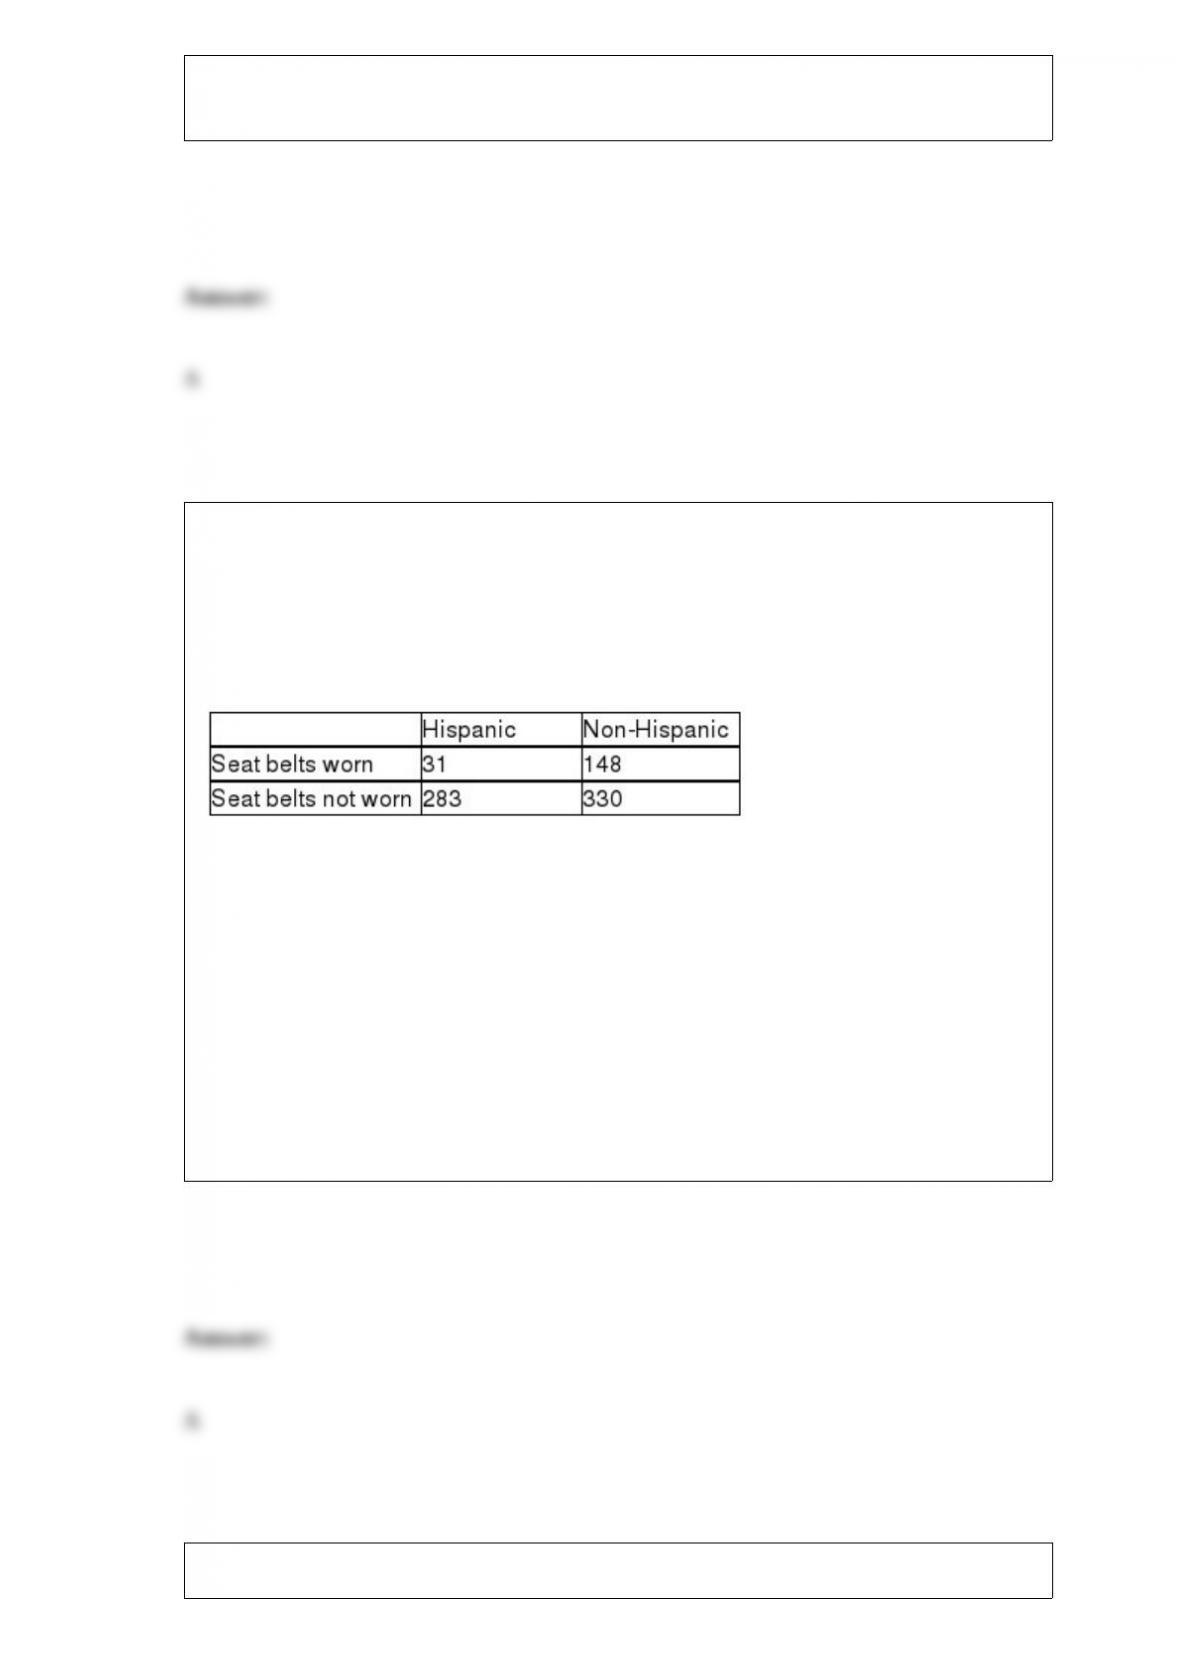
A study published in the American Journal of Public Health was conducted to
determine whether the use of seat belts in motor vehicles depends on ethnic status in
San Diego County. A sample of 792 children treated for injuries sustained from motor
vehicle accidents was obtained, and each child was classified according to (1) ethnic
status (Hispanic or non-Hispanic) and (2) seat belt usage (worn or not worn) during the
accident. The number of children in each category is given in the table below.
Referring to these data, which test would be used to properly analyze the data in this
experiment?
A) x2 test for independence in a two-way contingency table
B) x2 test for equal proportions in a one-way table
C) ANOVA F-test for interaction in a 2 2 factorial design
D) x2 goodness-of-fit test
Princess Cruises recently offered a 16-day voyage from Beijing to Bangkok during the
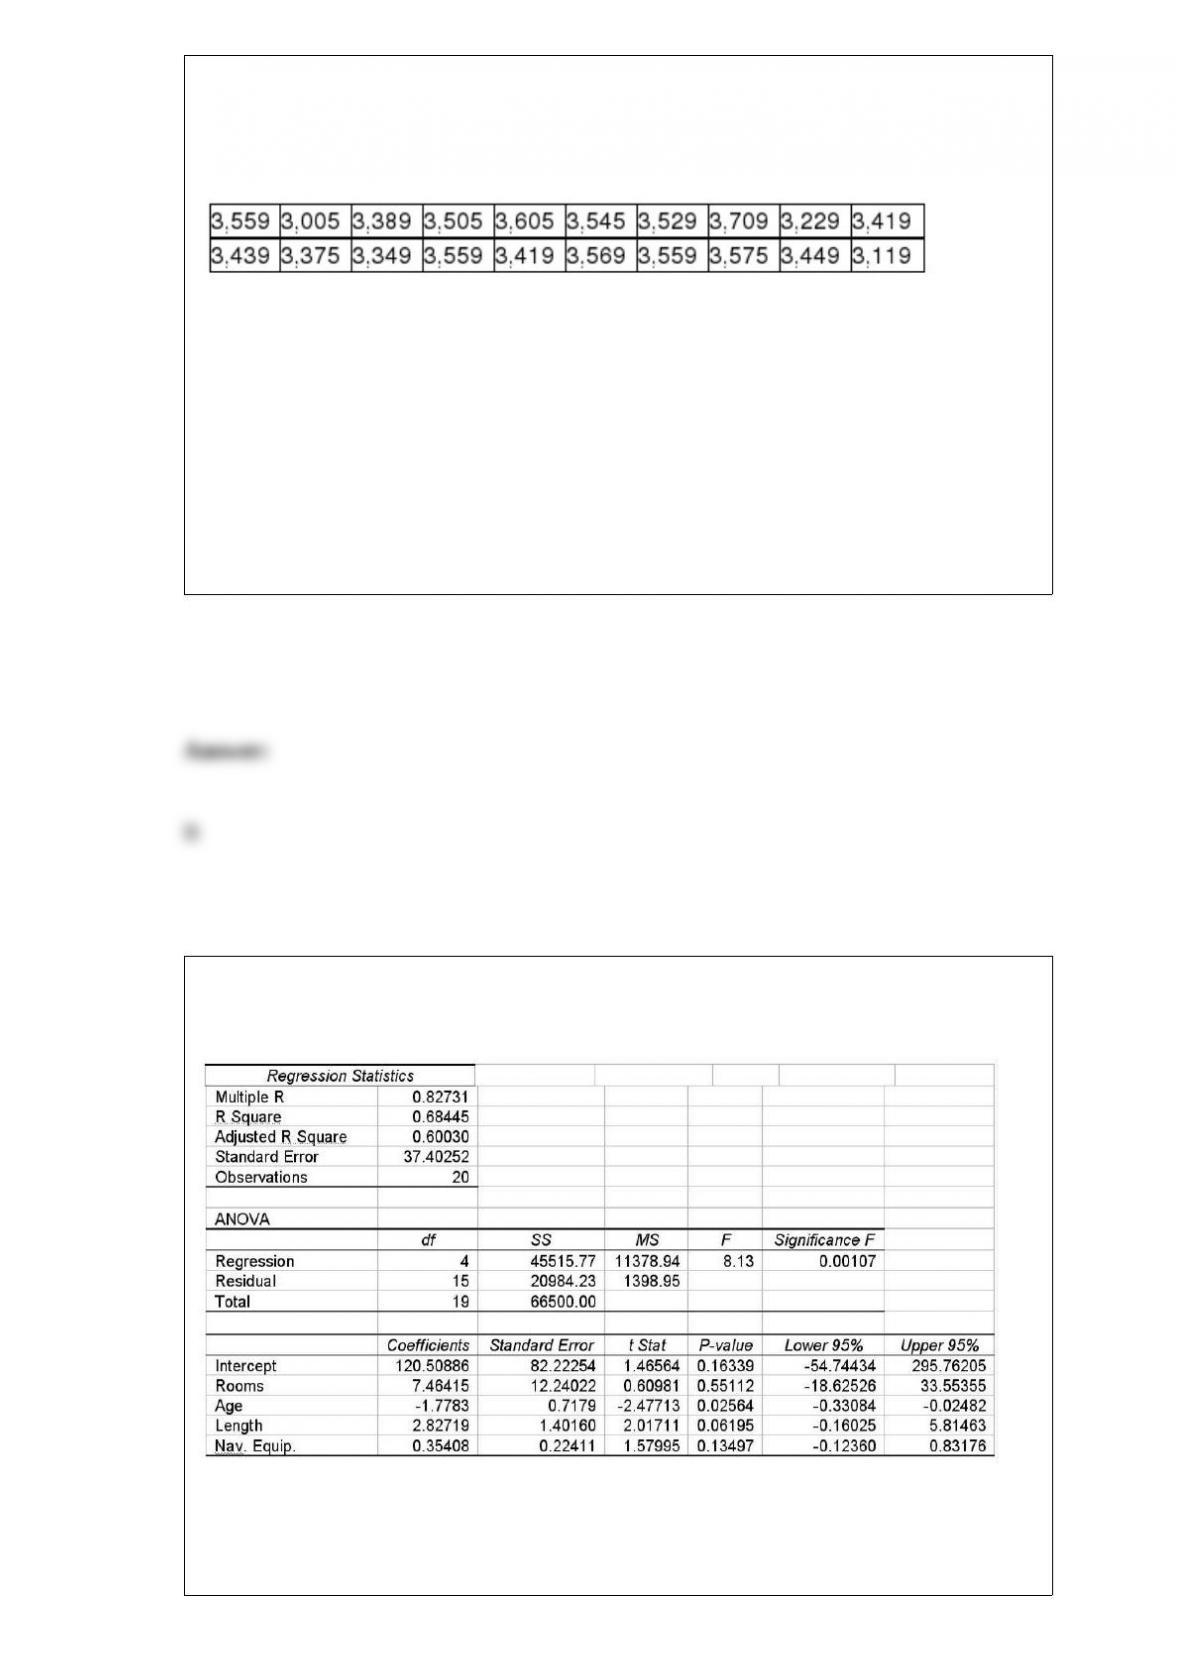
time period from May to August. The announced price, excluding airfare, for a room
with an ocean view or a balcony was listed as $3,475. Cruise fares usually are quite
variable due to discounting by the cruise line and travel agents. A sample of 20
passengers who purchased this cruise paid the following amounts (in dollars):
Calculate the sample mean cruise fare.
A) 3715.24
B) 3445.30
C) 4581.81
D) 6314.24
A multiple regression is shown for a data set of yachts where the dependent variable is
the price in thousands of dollars.
Given this information, which is correct regarding the test of the overall model using
the 0.10 level of significance?

A) The overall model does not have significant ability to predict the price of a yacht
because p-value = .163 is greater than 0.10
B) The overall model has significant ability to predict the price of a yacht because
p-value = 0.163 is greater than 0.10
C) The overall model does not have significant ability to predict the price of a yacht
because p-value = .001 is less than 0.10
D) The overall model has significant ability to predict the price of a yacht because
p-value = .001 is less than 0.10
Suppose nine items are randomly sampled from a normally distributed population with
a mean of 100 and a standard deviation of 20. The nine randomly sampled values are:
Calculate the probability of getting a sample mean that is smaller than the sample mean
for these nine sampled values.
A) 0.1411
B) 0.1612
C) 0.1512
D) 0.2266

A line chart is most appropriate for:
A) cross-sectional data.
B) nominal level data.
C) ordinal level data.
D) time-series data.
The American College Health Association produced the National College Health
Assessment (Andy Gardiner, “Surfacing from Depression,” February 6, 2006). The
assessment indicates that the percentage of U.S. college students who report having
been diagnosed with depression has risen from 2000. The assessment surveyed 47,202
students at 74 campuses. It discovered that 10.3% and 14.9% of students indicated that
they had been diagnosed with depression in 2000 and 2004, respectively. Assume that
half of the students surveyed were surveyed in 2004.
Indicate the margin of error for estimating p1 – p2 with 1 – 2.
A) 0.04156
B) 0.00121
C) 0.03418
D) 0.00597

Many people believe that they can tell the difference between Coke and Pepsi. Other
people say that the two brands can’t be distinguished. To test this, a random sample of
20 adults was selected to participate in a test. After being blindfolded, each person was
given a small taste of either Coke or Pepsi and asked to indicate which brand soft drink
it was. If people really can’t tell the difference, the probability that fewer than 6 people
will guess correctly is:
A) 0.0148
B) approximately 0.02
C) 0.0307
D) 0.0514
There are a number of highly touted search engines for finding things of interest on the
Internet. Recently a consumer rating system ranked two search engines ahead of the
others. Now, a computer user’s magazine wishes to make the final determination
regarding which one is actually better at finding particular information. To do this, each
search engine was used in an attempt to locate specific information using specified
keywords. Both search engines were subjected to 100 queries. Search engine 1
successfully located the information 88 times and search engine 2 located the
information 80 times. Using a significance level equal to 0.05, what is the null
hypothesis to be tested?
A) H0 : μ1 = μ2
B) H0 : p1 ≠ p2
C) H0 : 1 = 2
D) H0 : p1 = p2

Consider the situation in which a human resources manager wishes to determine
whether the median number of days of sick leave per year is greater for female
employees than for male employees. The following data represent random samples of
males and females:
If the manager is unwilling to assume that the populations are normally distributed,
which of the following is the correct conclusion to reach if the test is conducted using
a .05 level of significance?
A) Reject the null hypothesis
B) Conclude that females do have a higher median than males
C) Do not reject the null hypothesis
D) Conclude that males have a higher median than females
Recently, an automobile insurance company performed a study of a random sample of

15 of its customers to determine if there is a positive relationship between the number
of miles driven and the age of the driver. The sample correlation coefficient is r = .38.
Given this information, and assuming that the test is to be performed at the .05 level of
significance, which of the following is the correct test statistic?
A) t = 1.4812
B) t = 1.7709
C) z = 2.114
D) t = 1.74
A stock portfolio contains 20 stocks. Of these stocks, 10 are considered “large-cap”
stocks, 5 are “mid-cap,” and 5 are ‘small cap.” The portfolio manager has been asked by
his client to develop a report that highlights 7 randomly selected stocks. When she
presents her report to the client, all 7 of the stocks are large-cap stocks. The client is
very suspicious that the manager has not randomly selected the stocks. She believes that
the chances of all 7 of the stocks being large cap must be very low. Compute the
probability of all 7 being large cap.
A) 0.0015
B) 0.0008
C) 0.0121
D) 0.0309

The State Department of Weights and Measures is responsible for making sure that
commercial weighing and measuring devices, such as scales, are accurate so customers
and businesses are not cheated. Periodically, employees of the department go to
businesses and test their scales. For example, a dairy bottles milk in 1-gallon containers.
Suppose that if the filling process is working correctly, the mean volume of all gallon
containers is 1.00 gallon with a standard deviation equal to 0.10 gallon. The
department’s test process requires that they select a random sample of n = 9 containers.
If the sample mean is less than 0.97 gallon, the department will fine the dairy. Based on
this information, suppose that the dairy wants no more than a 0.05 chance of being
fined, which of the following options exist if they can’t alter the filling standard
deviation?
A) They can convince the state to decrease the sample size.
B) They can change the mean fill level to approximately 1.025 gallons.
C) They could lower the mean fill level to a level lower than 1 gallon.
D) There is actually nothing that they can do if they can’t modify the standard deviation.
Statistics are measures computed from the entire population of data.
A golf course in California has determined that the mean time it takes for a foursome to
complete an 18 hole round of golf is 4 hours 35 minutes (275 minutes) with a standard
deviation of 14 minutes. The time distribution is also thought to be approximately
normal. Every month, the head pro at the course randomly selects a sample of 8
foursomes and monitors the time it takes them to play. Suppose the mean time that was

observed for the sample last month was 4 hours 44 minutes (284 minutes). What is the
probability of seeing a sample mean this high or higher?
A) Approximately 0.4649
B) About 0.9649
C) Approximately 0.0351
D) About 0.9298
Which of the following statements is false?
A) Increasing the sample size will always reduce the size of the sampling error when
the sample mean is used to estimate the population mean.
B) Increasing the sample size will reduce the potential for extreme sampling error.
C) Sampling error can occur when differs from μ due to the fact that the sample was
not a perfect reflection of the population.
D) There is no way to prevent sampling error short of taking a census of the entire
population.
Which of the following statements is incorrect?
A) The expected value of a discrete probability distribution is the long-run average
value assuming the experiment will be repeated many times.
B) The standard deviation of a discrete probability distribution measures the average
deviation of the random variable from the mean.
C) The distribution is considered uniform if all the probabilities are equal.
D) The mean of the probability distribution is equal to the square root of the variance.
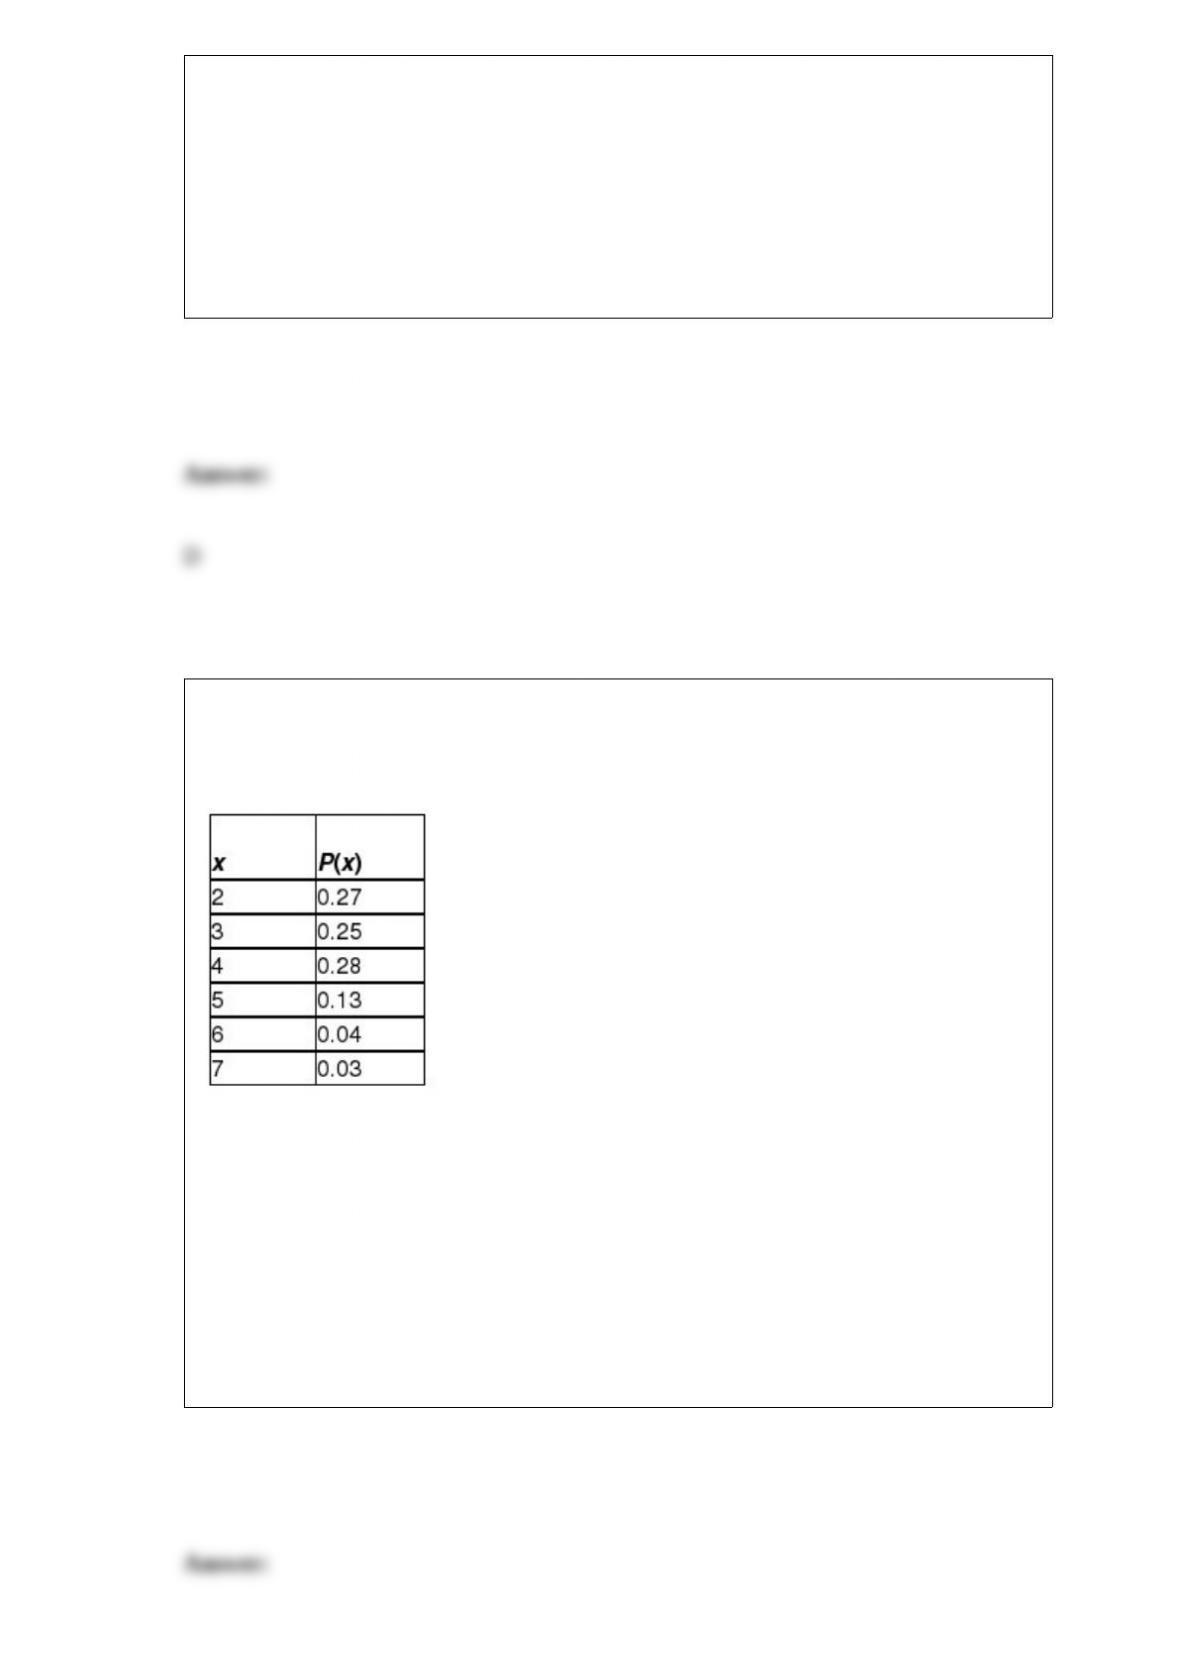
The U.S. Census Bureau (Annual Social & Economic Supplement) collects
demographics concerning the number of people in families per household. Assume the
distribution of the number of people per household is shown in the following table:
Calculate the expected number of people in families per household in the United States.
A) 2.71
B) 3.33
C) 3.51
D) 4.33

A population has a proportion equal to 0.30. Calculate the following probabilities with
n = 100. Find P( ≤ 0.35).
A) 0.7244
B) 0.8621
C) 0.7124
D) 0.6126
Another term used for statistical sampling is:
A) probability sampling.
B) convenience sampling.
C) ratio sampling.
D) numerical sampling.

A special roulette wheel, which has an equal number of red and black spots, has come
up red four times in a row. Assuming that the roulette wheel is fair, what concept allows
a player to know that the probability the next spin of the wheel will come up black is
0.5?
A) Concept of independent events
B) Concept of mutually exclusive events
C) Concept of dependent events
D) Concept of mutually inclusive events