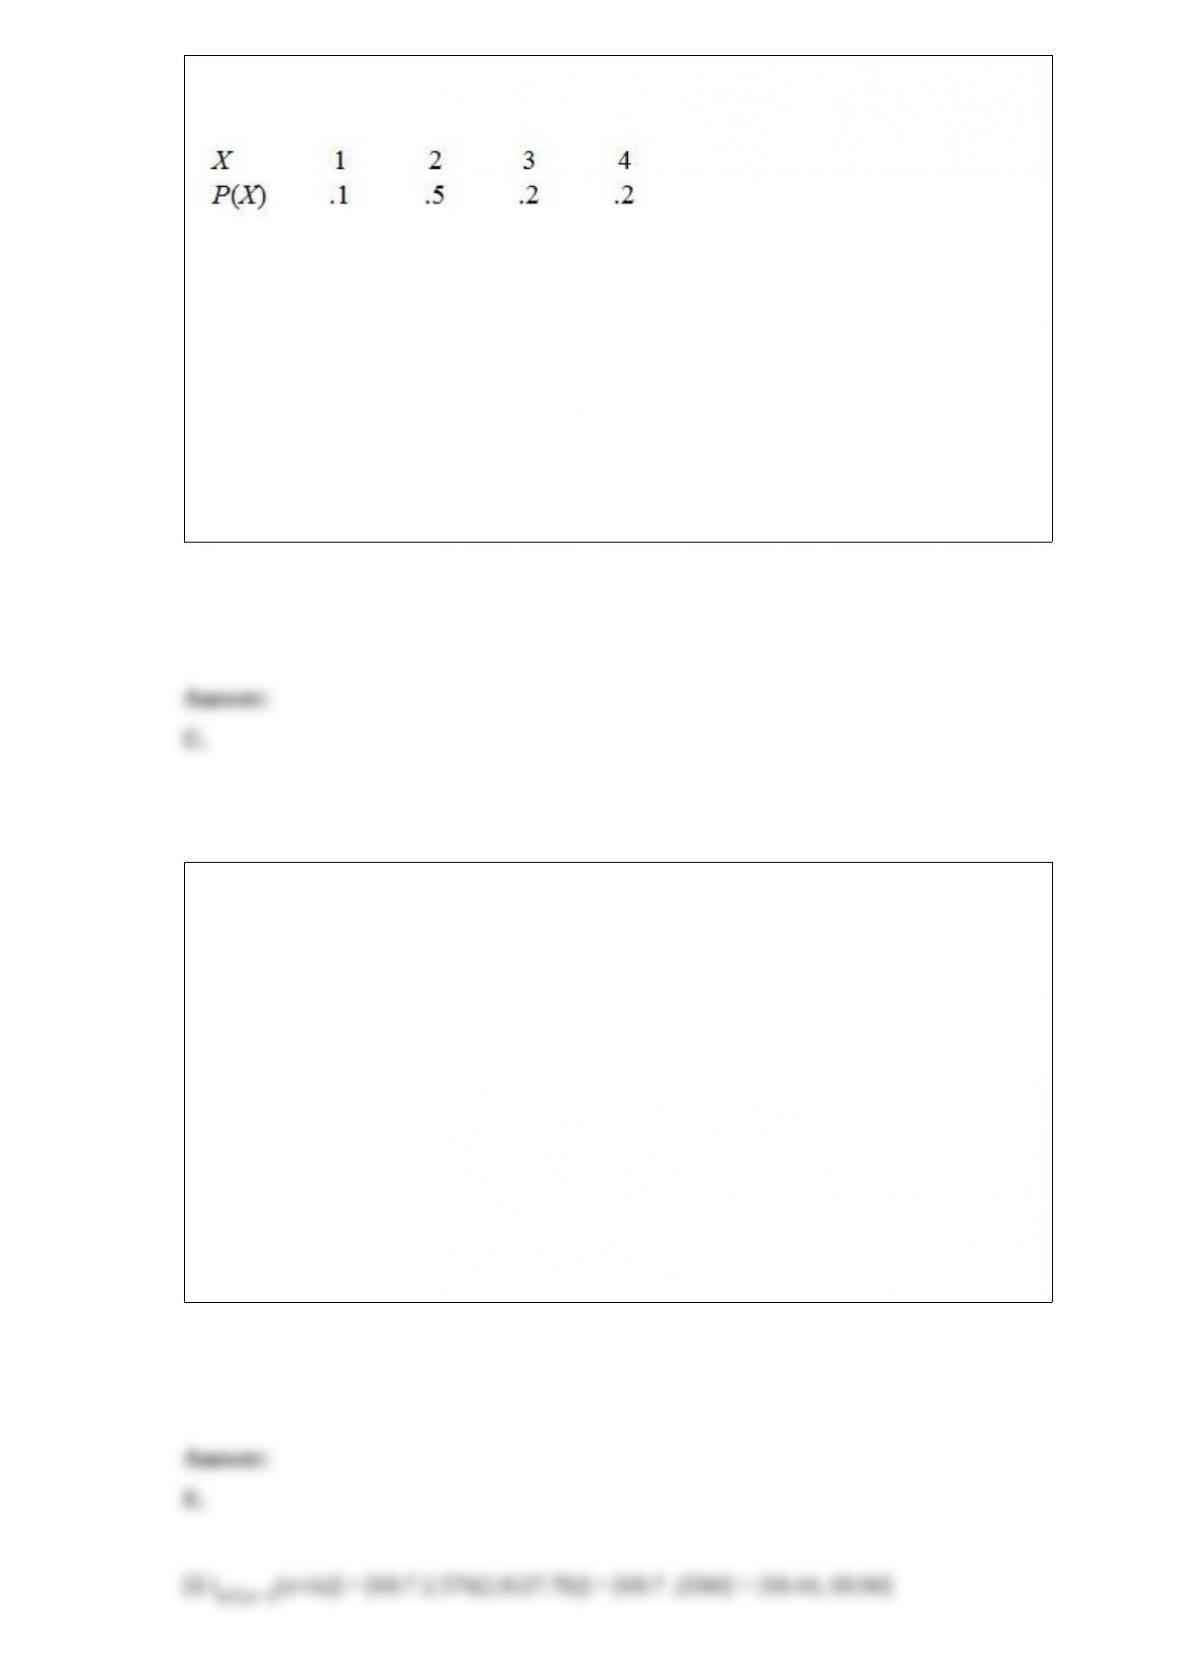
X has the following probability distribution P(X).
Compute the variance value of X.
A. 1.58
B. .955
C. .912
D. .625
The U.S. Department of Health and Human Services collected sample data for 772
males between the ages of 18 and 24. That sample group has a mean height of 69.7
inches with a standard deviation of 2.8 inches. Find the 99 percent confidence interval
for the mean height of all males between the ages of 18 and 24.
A. [63.19, 76.21]
B. [62.49, 76.91]
C. [69.65, 69.75]
D. [69.47, 69.93]
E. [69.44, 69.96]
When grouping a large sample of measurements into classes, the ______________ is a
better tool than the ___________.
A. histogram, stem-and-leaf display
B. box plot, histogram
C. stem-and-leaf display, scatter plot
D. scatter plot, box plot
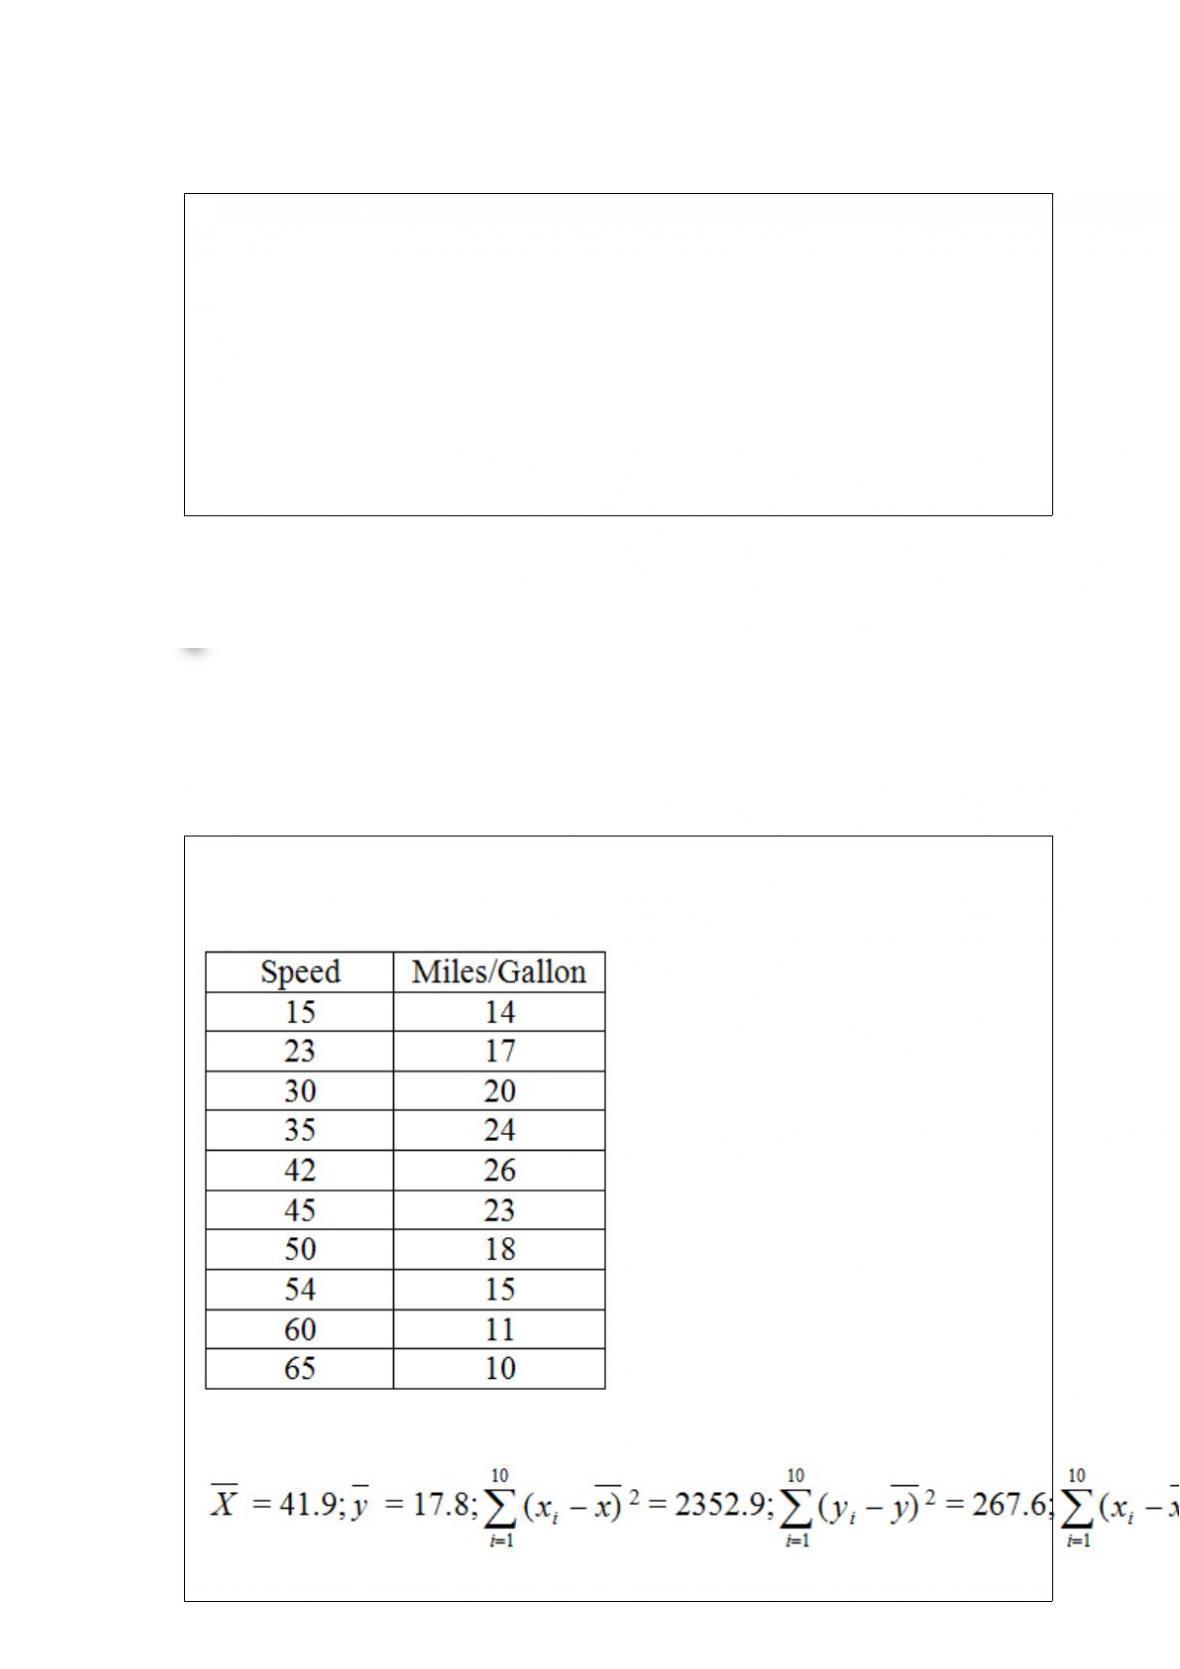
Researchers wish to study fuel consumption rates based on speed. The data from 10
cars are below.
It can be shown that for these data:
Calculate the sample correlation coefficient.
A. 0.12
B. −0.12
C. −0.36
D. −0.34
E. 0.34
An insurance company estimates 45 percent of its claims have errors. The insurance
company wants to estimate with 99 percent confidence the proportion of claims with
errors. What sample size is needed if they wish to be within 5 percent of the actual?
A. 664
B. 657
C. 163
D. 1084
A random sample of size 36 is taken from a population with mean 50 and standard
deviation 5. Find P( < 51.5).

A. .9641
B. .0359
C. .1389
D. .9999
The number of defectives in 10 different samples of 50 observations each is the
following: 5, 1, 1, 2, 3, 3, 1, 4, 2, 3. What is the estimate of the population proportion of
defectives?
A. .25
B. .50
C. .05
D. .42
Four employees who work as drive-through attendants at a local fast-food restaurant are
being evaluated. As part of a quality improvement initiative and employee evaluation,
these workers were observed over three days. One of the statistics collected was the
proportion of time the employee forgot to include a napkin in the bag. Related
information is given in the table.
You just purchased a dinner and found that there is no napkin in your bag. What is the
probability that Cheryl prepared your order?
A. 0.378
B. 0.091
C. 0.083
D. 0.500
E. 0.020
What is the probability that a standard normal random variable will be between 0.3 and
3.2?
A. .6179
B. .3814
C. .3808
D. .9993

When computing a confidence interval for the difference between two means, the width
of the (1 − α) confidence interval based on the Tukey procedure will be __________ the
width of the (1 − α) individual confidence interval based on the t statistic.
A. greater than
B. less than
C. the same as
D. sometimes greater than, sometimes less than
In a decision-making situation, the maximum amount of money that should be spent to
obtain perfect information is called the ______________________________.
A. expected monetary value
B. expected value of perfect information
C. expected value of sample information
D. expected net gain of sampling
A statistical quality control process for cereal production measures the weight of a
cereal box. The population standard deviation is known to be .06 ounces. In order to
achieve 97 percent confidence with a margin of error of .02 ounces, how large a sample
should be used?
A. 32

B. 43
C. 7
D. 664
A report on high school graduation stated that 85 percent of high school students
graduate. Suppose 3 high school students are randomly selected from different schools.
What is the probability that none graduates?
A. 0.019
B. 0.003
C. 0.614
D. 0.057
E. 0.150
For a binomial process, the probability of success is 40 percent and the number of trials
is 5. Find P(X > 4).
A. .0102
B. .0778
C. .0870
D. .3370
The grade a student received on an examination was transformed to a z value, which
was negative. Therefore, we know that he scored
A. higher than 16 percent of the class.
B. higher than 45 percent of the class.
C. above the first quartile.
D. below the mean.
E. lower than 16 percent of the class.
As the sample size increases, the variability of the sampling distribution of the mean
______________.
A. increases
B. stays the same
C. is variable
D. decreases
The two types of quantitative variables are
A. ordinal and ratio.
B. interval and ordinal.
C. nominative and ordinal.
D. interval and ratio.
E. nominative and interval.
For a manufacturing process, = 10 inches, = .4 inches, and the subgroup sample size
is 6 units. Calculate the standard control limits for the R chart
A. 0 and .846
B. 0 and .802
C. 0 and .77
D. 0 and 1.0
E. −.09 and .89

An apple juice producer buys all his apples from a conglomerate of apple growers in
one northwestern state. The amount of juice obtained from each of these apples is
approximately normally distributed with a mean of 2.25 ounces and a standard
deviation of 0.15 ounce. What is the probability that a randomly selected apple will
contain more than 2.50 ounces?
A. .9525
B. .4525
C. .0475
D. .5474
_________ uses traditional or newer graphics to present visual summaries of business
information.
A. Predictive analytics
B. Data mining
C. Association learning
D. Descriptive analytics

The number of weekly sales calls by a sample of 25 pharmaceutical salespersons is
below.
24, 56, 43, 35, 37, 27, 29, 44, 34, 28, 33, 28, 46, 31, 38, 41, 48, 38, 27, 29, 37, 33, 31,
40, 50
What is the shape of the distribution of the data?
A. skewed with tail to the right
B. skewed with tail to the left
C. normal
D. bimodal
Find z when the area to the left of z is .05.
A. 1.645
B. 1.00
C. −1.645
D. −1.96

The life of a light bulb is exponentially distributed with a mean of 1,000 hours. What is
the probability that the bulb will last more than 1,200 hours?
A. .3012
B. .3679
C. .4345
D. .6988
A random sample of size 36 is taken from a population with mean 50 and standard
deviation 5. Find P( > 49).
A. .8331
B. .1151
C. .8849
D. .1389
An environmental group at a local college is conducting independent tests to determine
the distance a particular make of automobile will travel while consuming only 1 gallon
of gas. They test a sample of five cars and obtain a mean of 28.2 miles. How many cars
should the environmental group test if they wish to estimate μ, mean miles per 1 gallon,
to within 0.5 miles and be 99 percent confident? Assume a population standard

deviation of 2.7 miles.
A. 25
B. 124
C. 194
D. 618
E. 619
During the past six months, 73.2 percent of US households purchased sugar. Assume
that these expenditures are approximately normally distributed with a mean of $8.22
and a standard deviation of $1.10. 99 percent of the households spent less than what
amount?
A. $5.66
B. $10.78
C. $6.81
D. $9.63
_________ is the set of international standards on quality management and quality

assurance systems. It establishes processes for assuring that goods and services offered
by the company meet a consistent level of quality acceptable to customers.
A. Control Charting
B. SQC
C. ISO 9000
D. ASQC
Stepwise regression uses a series of ___________ tests during each iteration in order to
determine which independent variables should be brought into the regression model.
A. C
B. chi-square
C. t or F
D. VIF
The _________ regression method is used when the response variable is a qualitative or
a categorical variable.
A. quadratic
B. logistic
C. multiple

D. simple
The ___________ the r2 and the __________ the s (standard error), the stronger the
relationship between the dependent variable and the independent variable.
A. higher, lower
B. lower, higher
C. lower, lower
D. higher, higher
A recent study conducted by the state government attempts to determine whether the
voting public supports a further increase in cigarette taxes. The opinion poll recently
sampled 1,500 voting age citizens. 1,020 of the sampled citizens were in favor of an
increase in cigarette taxes. The state government would like to decide if there is enough
evidence to establish whether the proportion of citizens supporting an increase in
cigarette taxes is significantly greater than .66. Identify the null hypothesis.
A. p ≠ .66
B. p > .66
C. p ≤ .66
It has been reported that the average time to download the home page from a
government website was 0.9 seconds. Suppose that the download times were normally
distributed with a standard deviation of 0.3 seconds. If random samples of 36 download
times are selected, calculate the standard deviation of the sampling distribution of the
sample mean.
A. 0.3
B. 0.15
C. 0.9
D. 0.05
When sample size is 16, find t.10.
Two coffee-vending machines are studied to determine whether they distribute the same
amounts. Samples are taken and the number of ounces is recorded for each machine.

Machine A Machine B
6.10 5.99
5.95 6.01
5.98 5.98
6.01 5.96
6.00 6.08
5.95 5.89
6.02 6.01
6.04 6.00
5.99 5.97
6.06 6.00
What is the appropriate null hypothesis for the claim that they distribute the same
amount of coffee?
A. H0: μDA ≥ μDB
B. H0: μDA = μDB
C. H0: μDA ≤ μDB
D. H0: μDA ≠ μDB
Two NFL scouts are in the process of recruiting seven college senior football players
(receivers). After a careful review and evaluation, both scouts ranked the seven
receivers in terms of their professional career prospects. The rankings are given below.
Player (Receiver) Rankings of Scout 1 Rankings of Scout 2
1 3 3
2 2 1
3 1 2
4 4 6
5 5 4
6 7 7
7 6 5
At α = .05, does it appear that the two scouts have similar opinions about the
professional football career prospects of the seven players (positive correlation vs. no
correlation)?
A. Reject the null hypothesis.
B. Do not reject the null hypothesis.
A local tire dealer wants to predict the number of tires sold each month. He believes
that the number of tires sold is a linear function of the amount of money invested in
advertising. He randomly selects 6 months of data consisting of tire sales (in thousands
of tires) and advertising expenditures (in thousands of dollars). Based on the data set
with 6 observations, the simple linear regression model yielded the following results.
Find the rejection point for the t statistic at α = .05 and test H0: β1 ≤ 0 vs. Ha: β1 > 0.
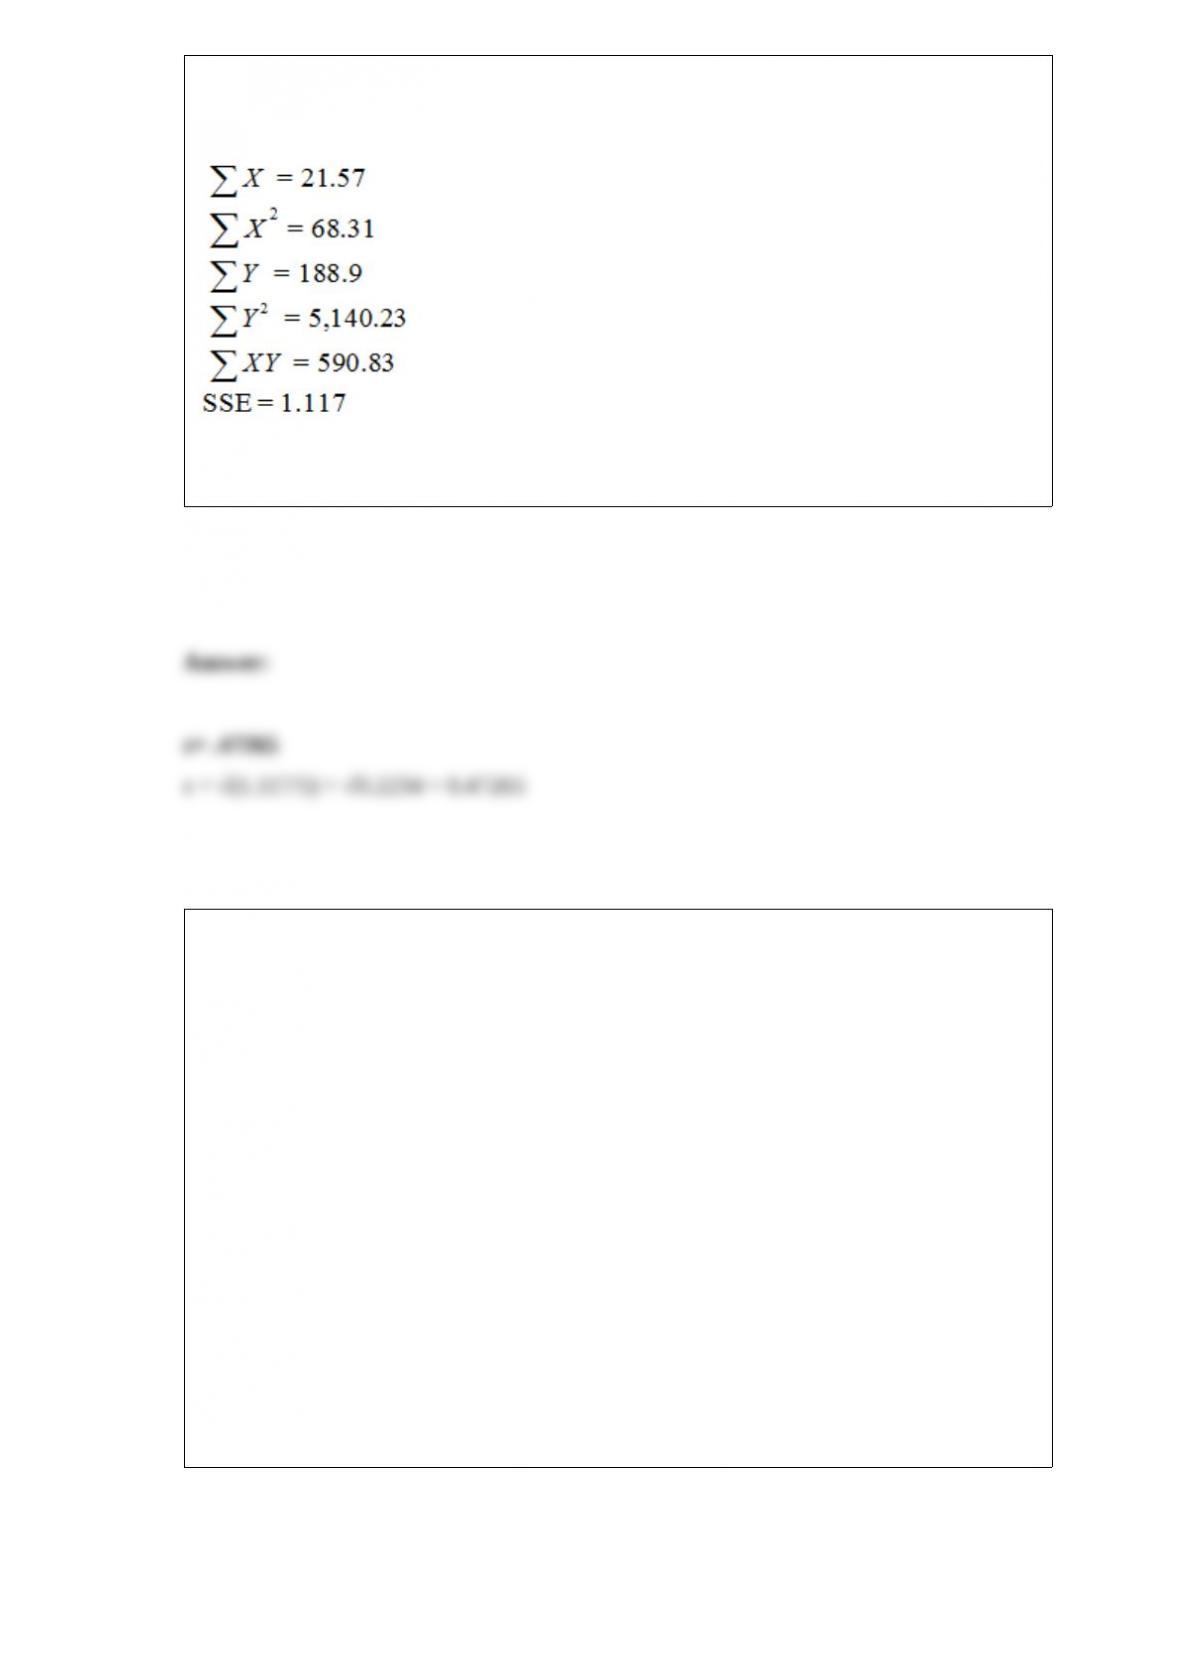
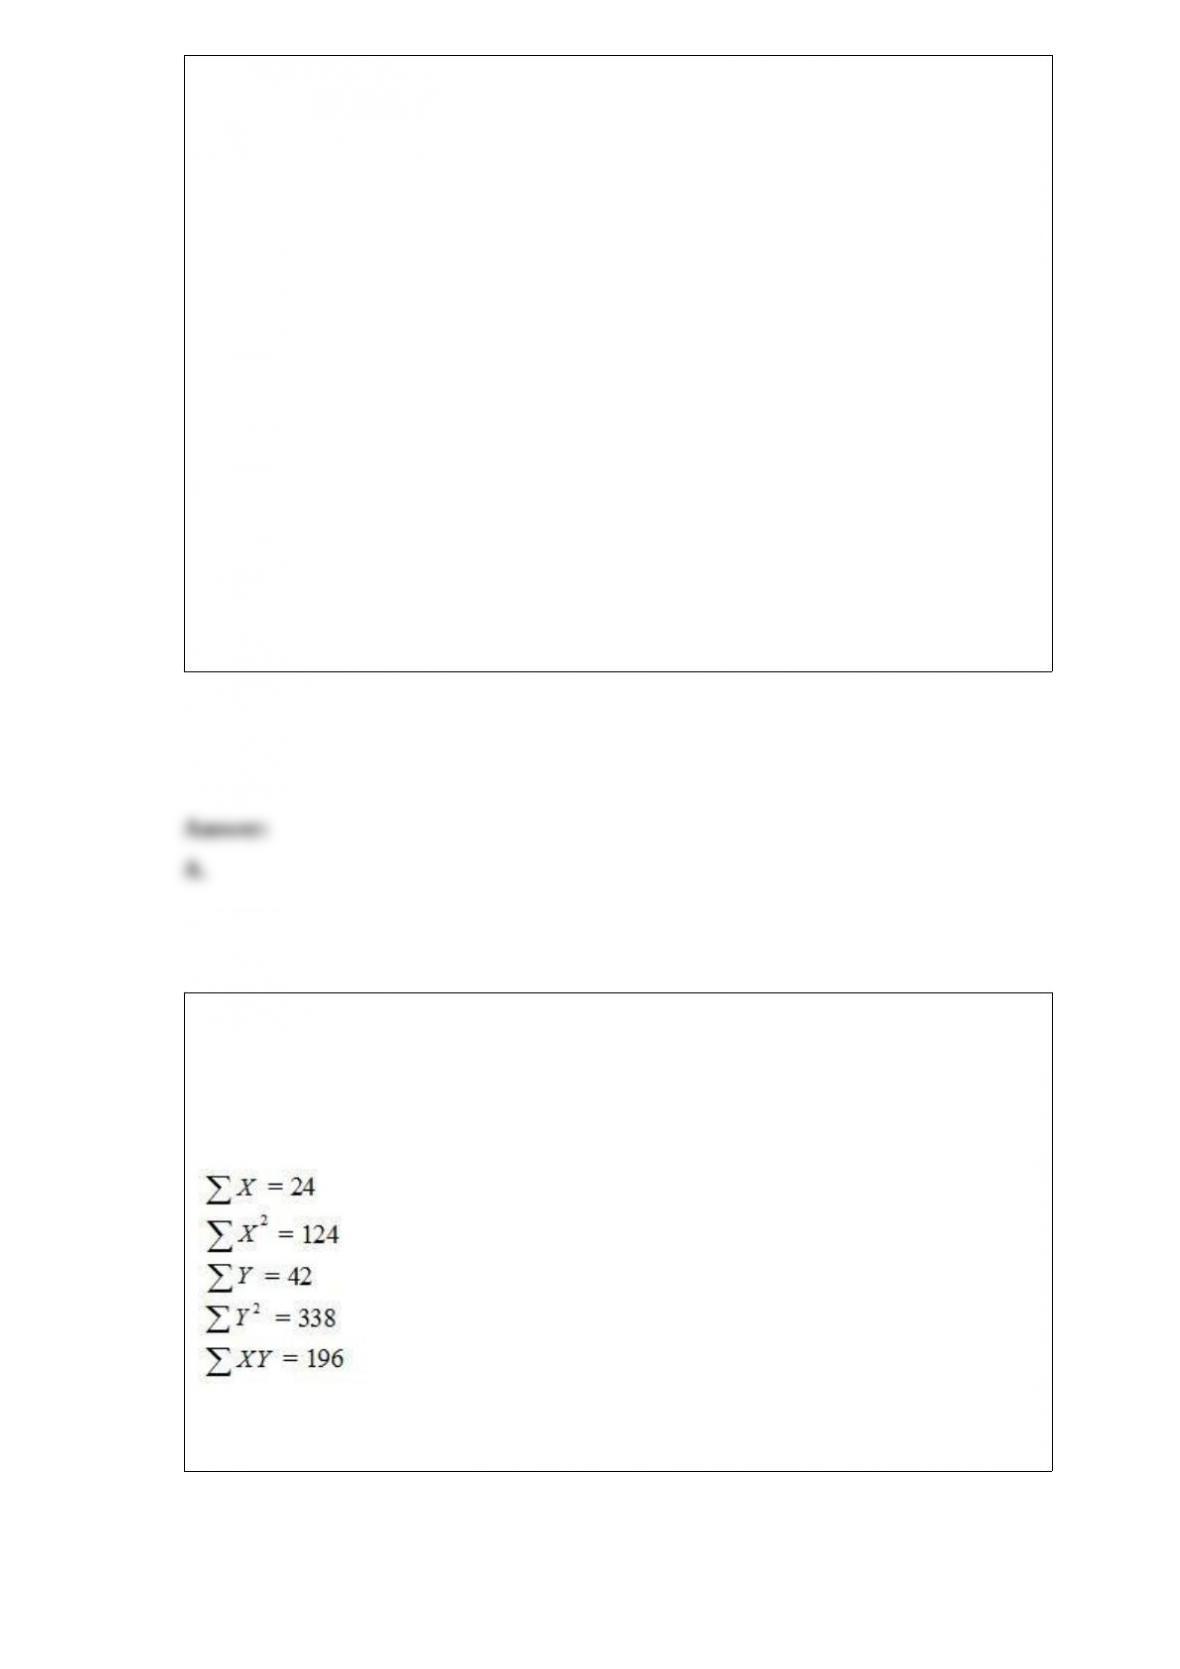
A data set with 7 observations yielded the following. Use the simple linear regression
model.
Calculate the standard error.
A fast food company uses two management-training methods. Method 1 is a traditional
method of training, and Method 2 is a new and innovative method. The company has
just hired 31 new management trainees. 15 of the trainees are randomly selected and
assigned to the first method, and the remaining 16 trainees are assigned to the second
training method. After three months of training, the management trainees take a
standardized test. The test was designed to evaluate their performance and learning
from training. The sample mean score and sample standard deviation of the two
methods are given below. The management wants to determine if the company should
implement the new training method.
Mean Standard deviation
Method 1 69 3.4
Method 2 72 3.8
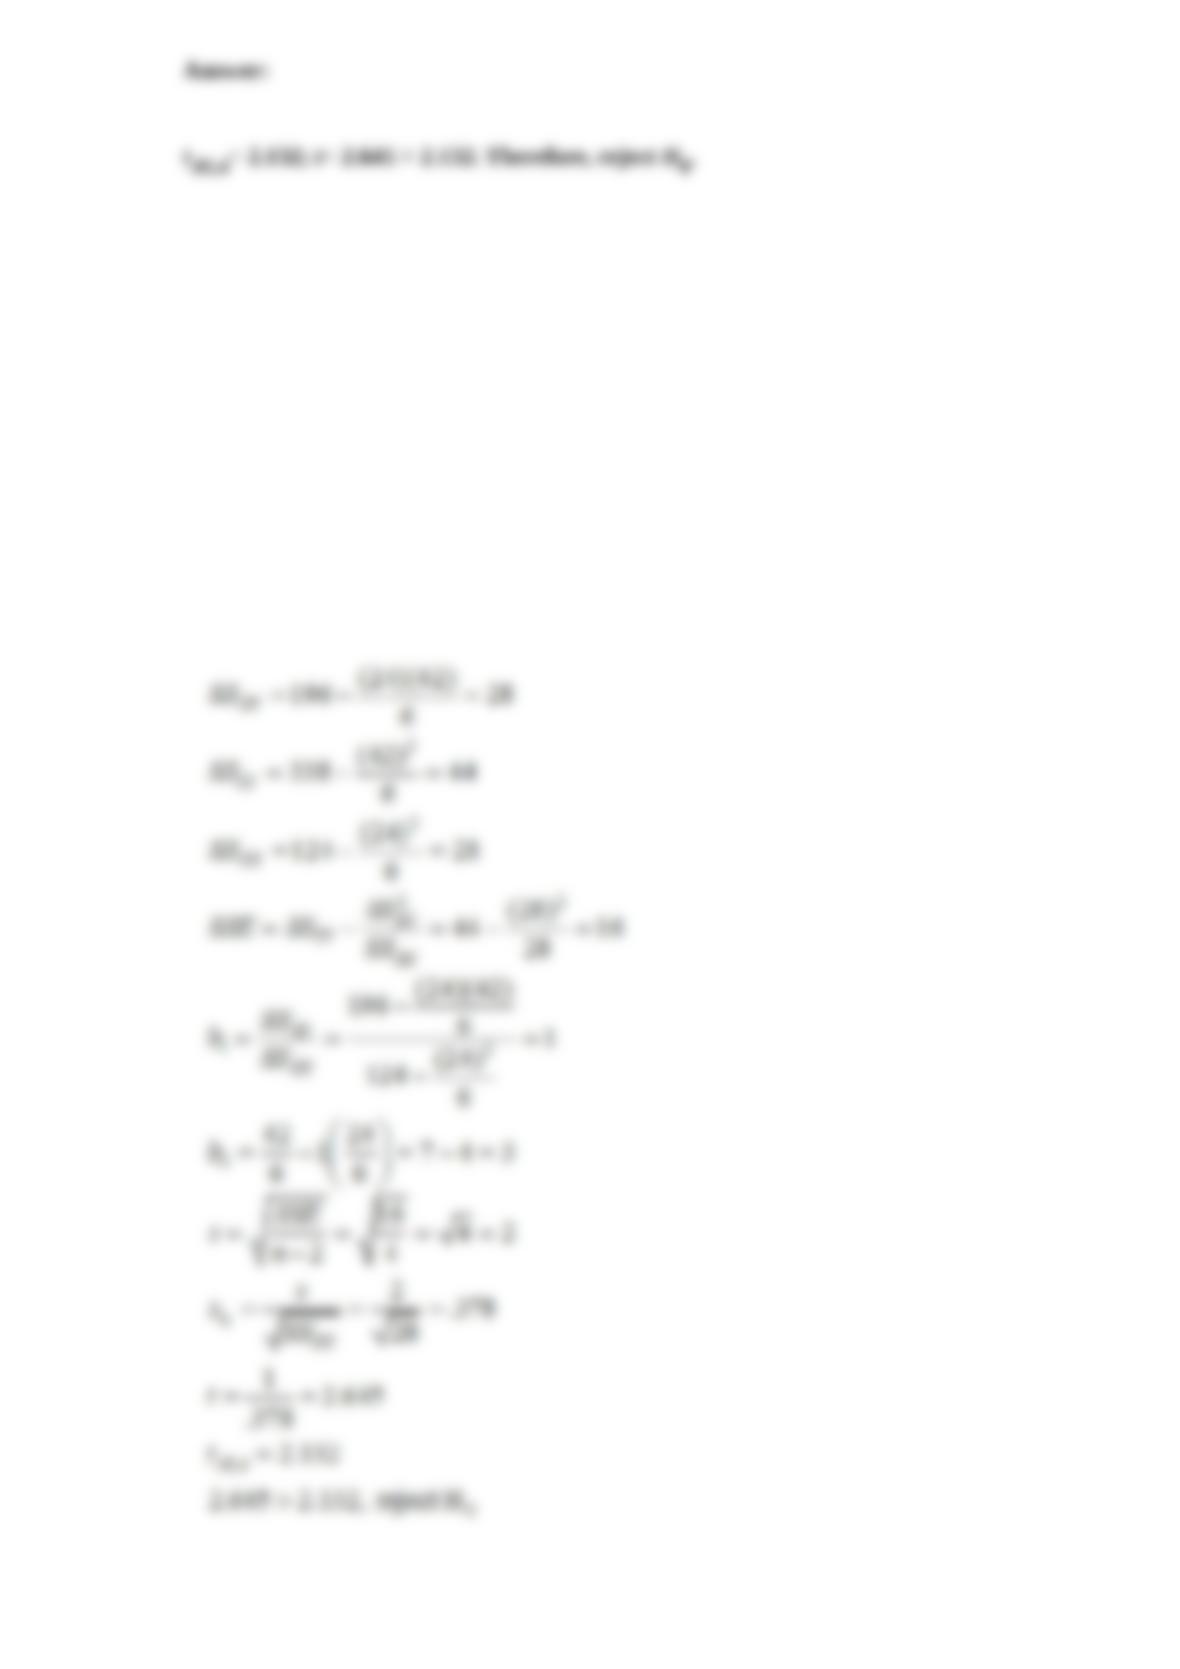
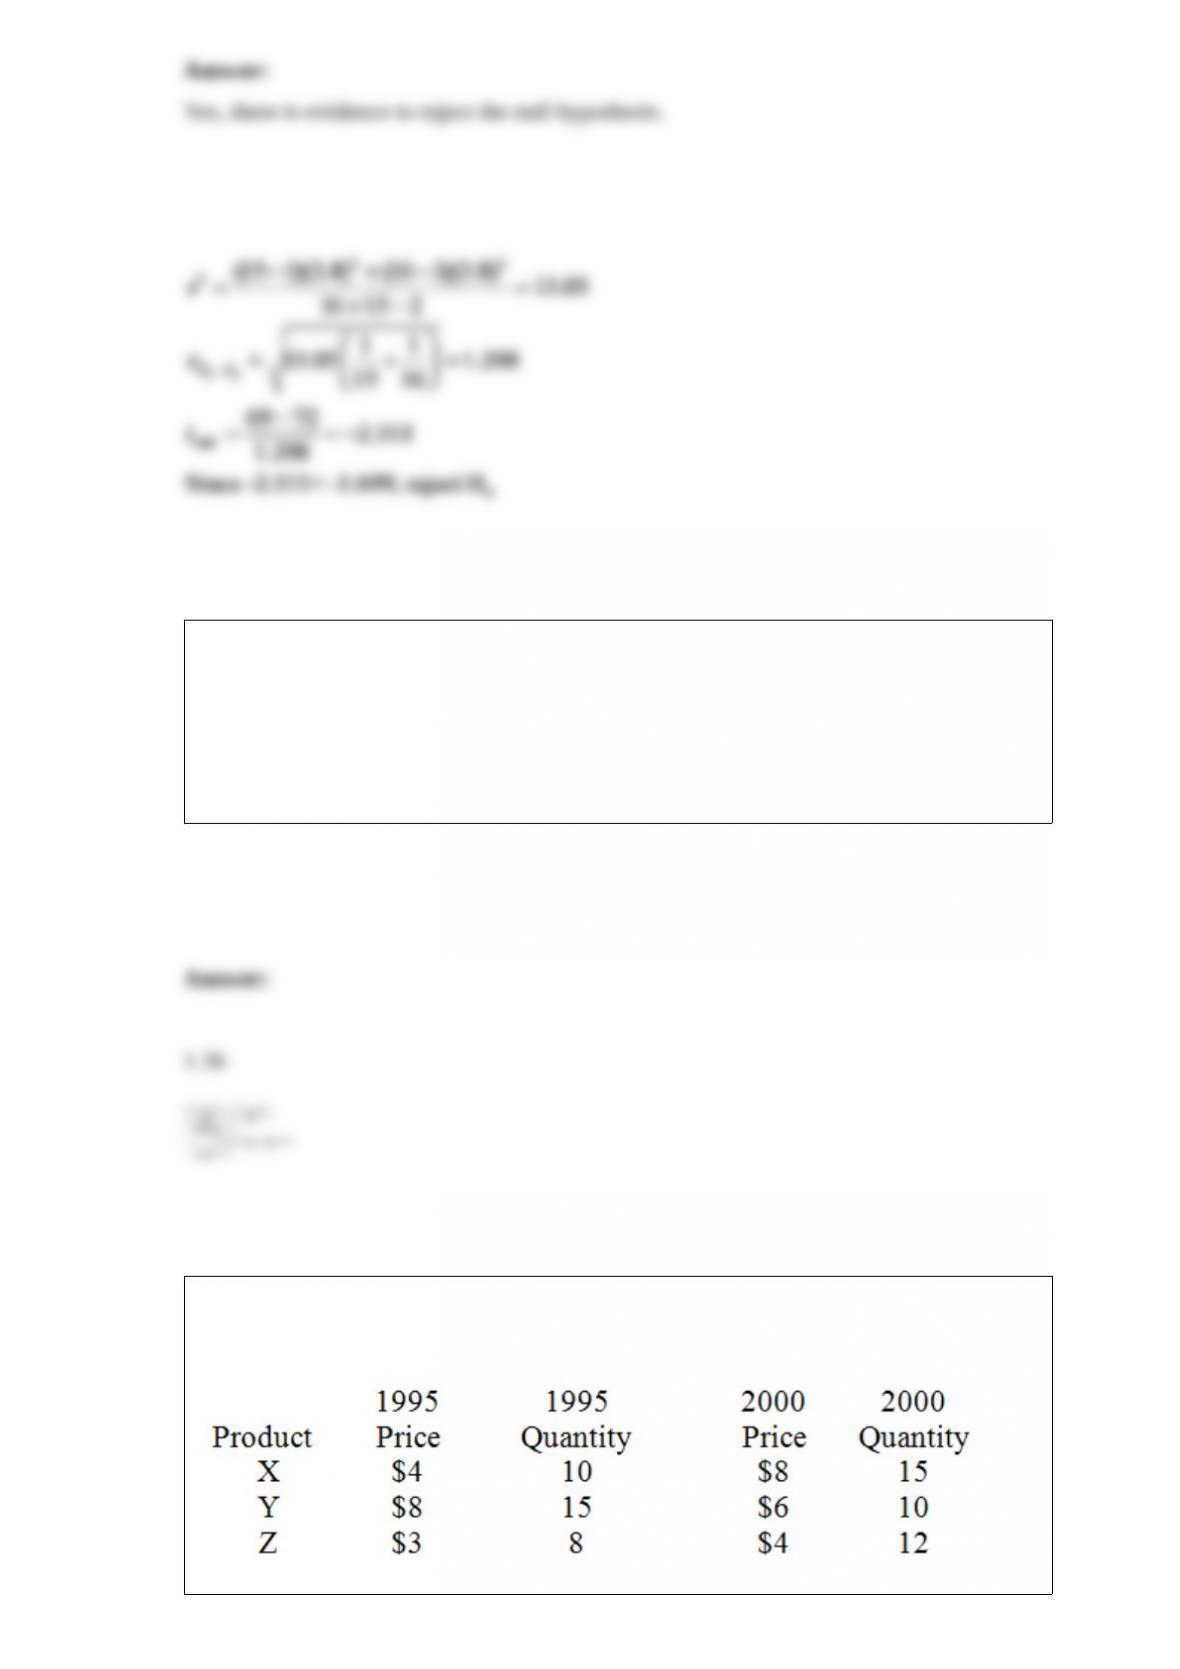
Is there evidence at α = .05 to conclude that the new training method is more effective
than the traditional training method?
In an opinion survey, a random sample of 1,000 adults from the United States and 1,000
adults from Germany were asked whether they supported the death penalty. 590
American adults and 560 German adults indicated that they supported the death penalty.
The researcher wants to know whether there is sufficient evidence to conclude that the
proportion of adults who support the death penalty is higher in the United States than in
Germany. What is the sample value of the test statistic?
The following data on prices and quantities for the years 1995 and 2000 are given for
three products.
Calculate the 2000 Laspeyres index.
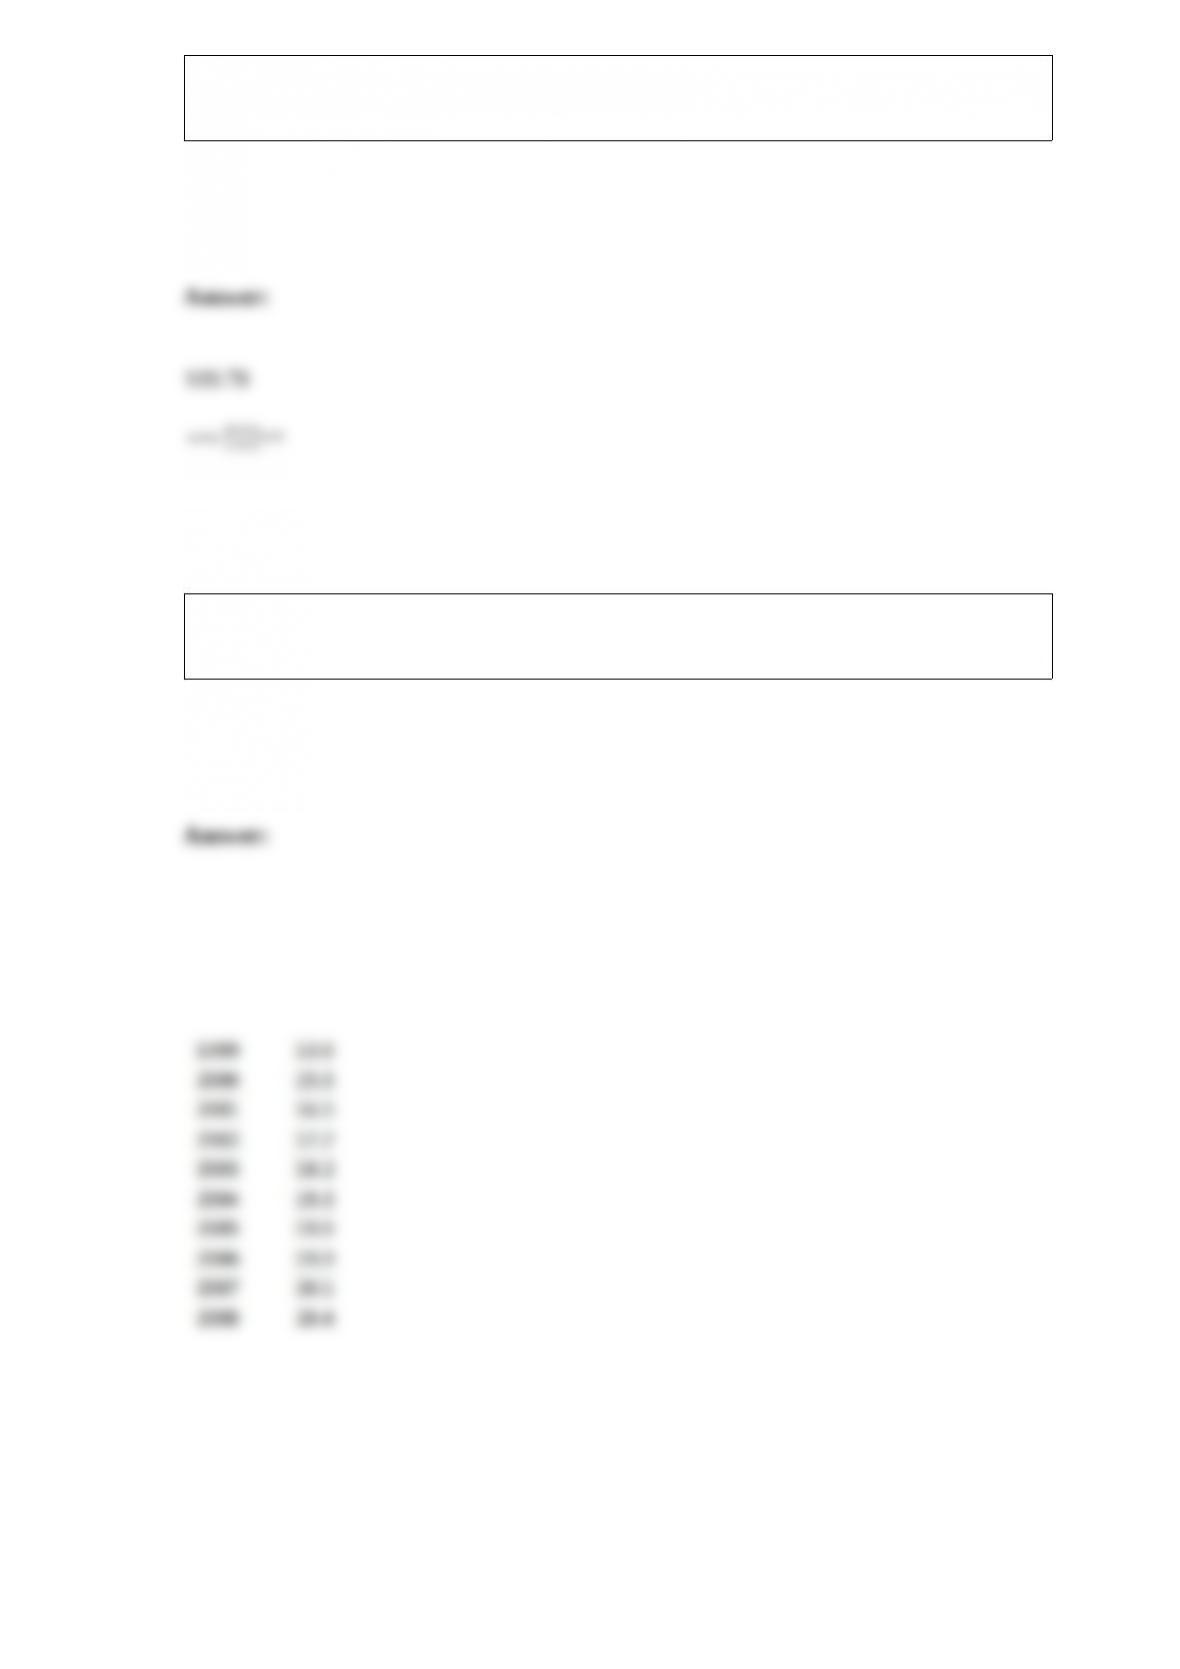
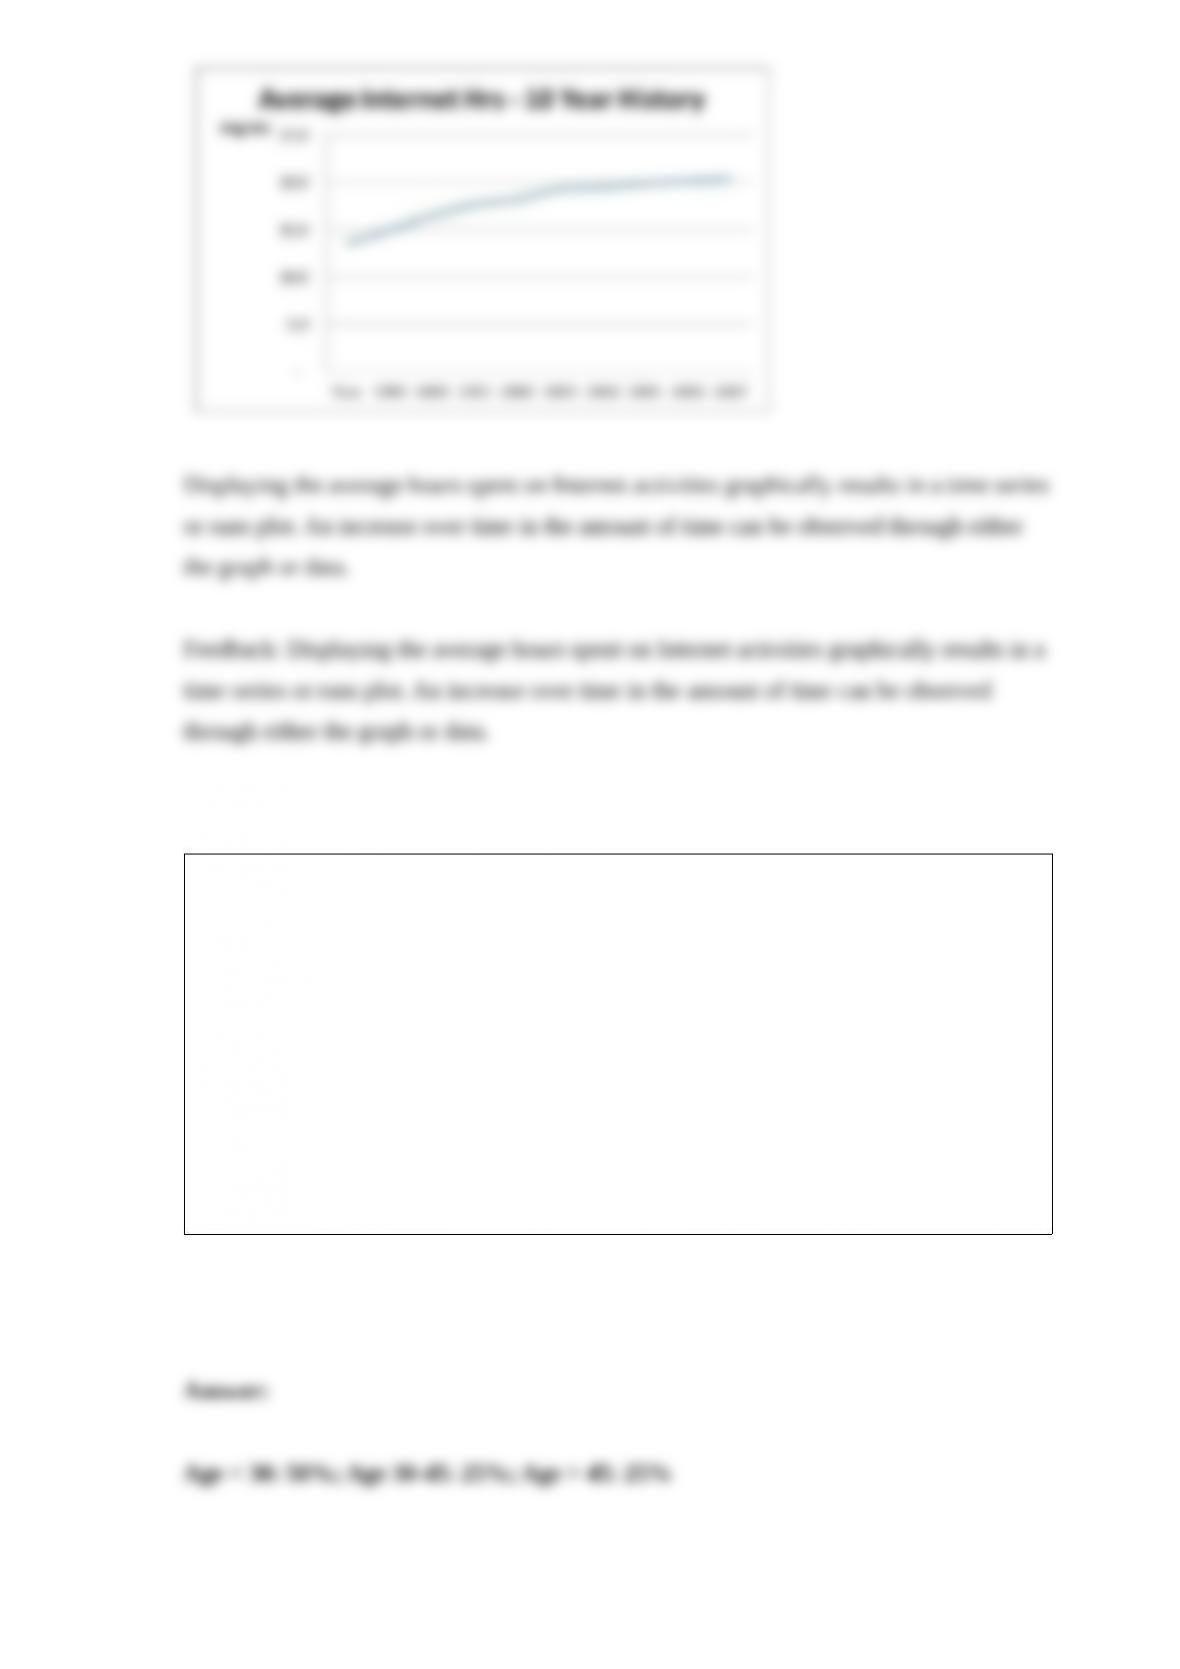
Using the following data table of the average hours per week spent on Internet activities
by 15- to 18-year-olds for the years 1999 to 2008, construct the runs plot and interpret.
A survey was conducted on the age and gender of the purchasers of a specific
automotive model. The results are below.
Age < 30 Age 30-45 Age > 45 Total
Male 60 20 40 120
Female 40 30 10 80
Total 100 50 50 200
For each column total, calculate the corresponding percentage.
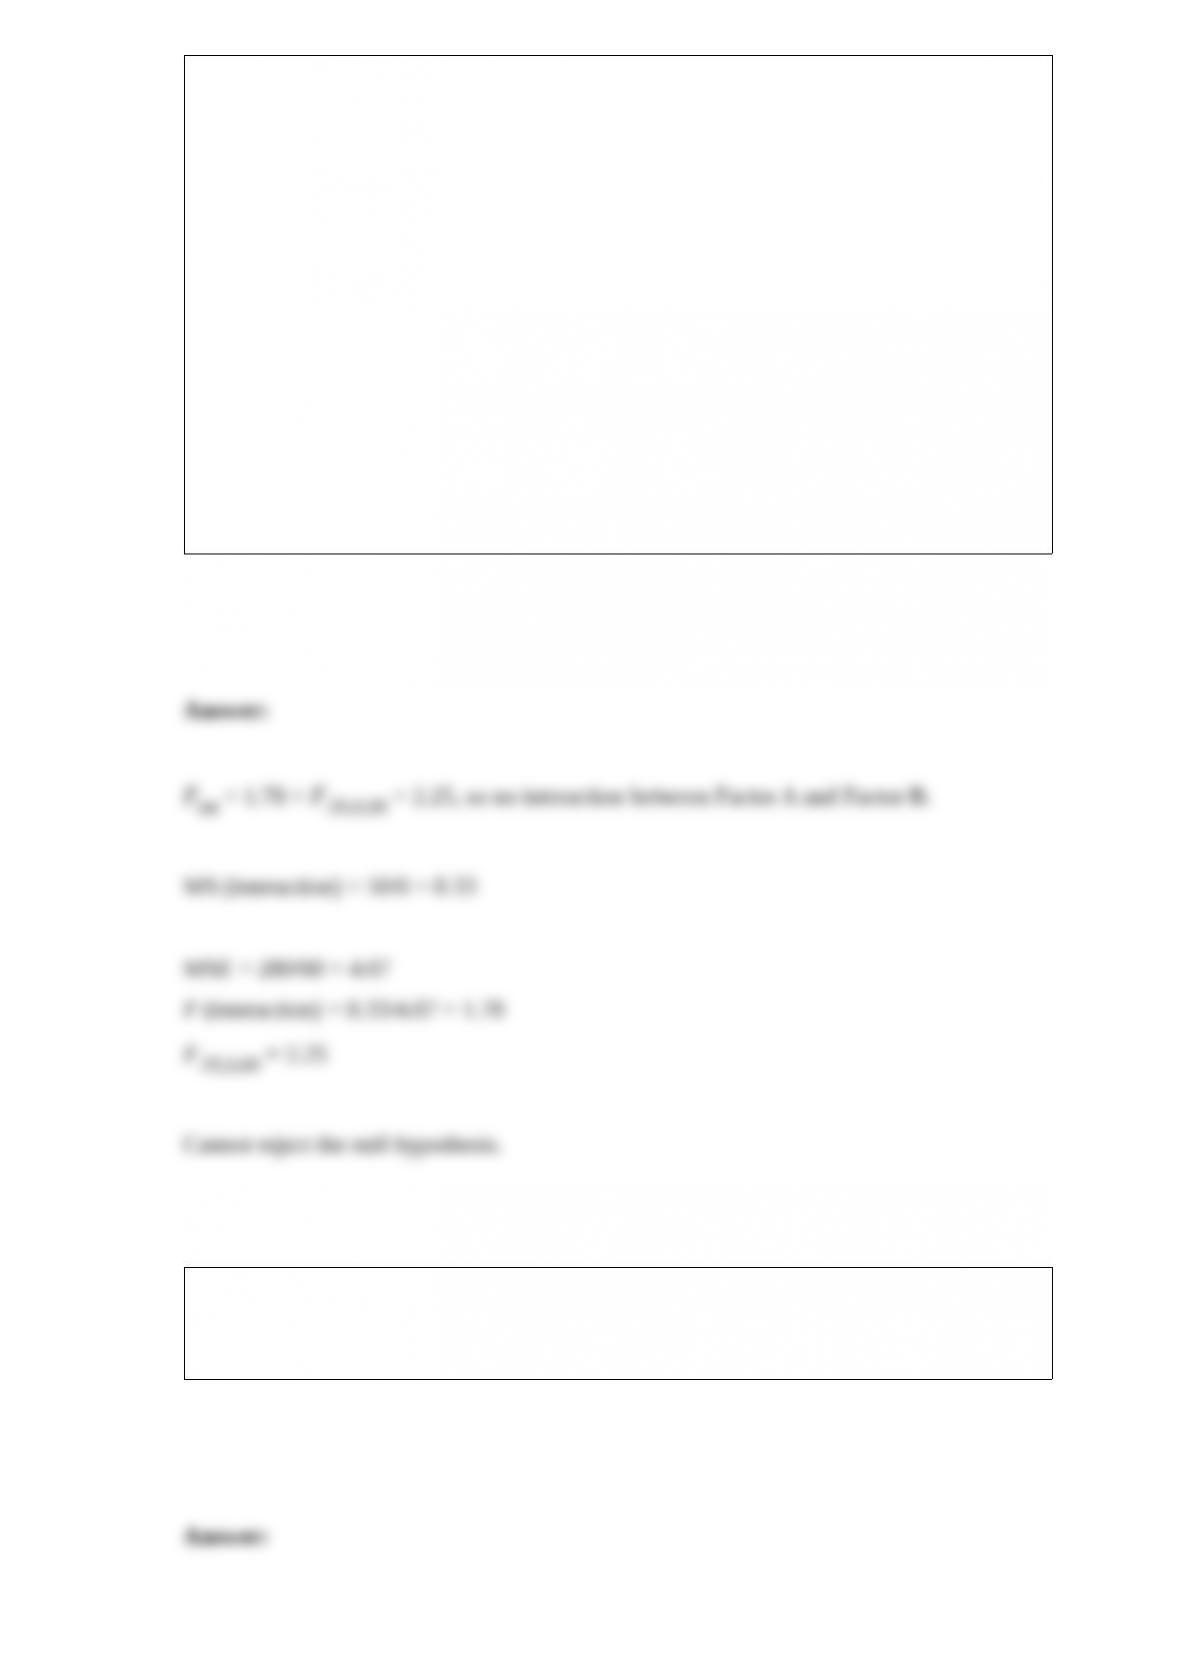
Consider a two-way analysis of variance experiment with treatment factors A and B,
with factor A having four levels and factor B having three levels. The results are
summarized below.
Source of Variation df SS
Factor A 71
Factor B 63
Interaction 50
Error 280
Total 71 446
Compute the mean squares and F to test the null hypothesis that no interaction exists
between factor A and B at α = .05.
What is the F statistic for testing H0: σ12 ≤ σ22, HA: σ22> σ12 at α = .05, where n1 = 16,
n2 = 19, s12 = .03, and s22 = .02?
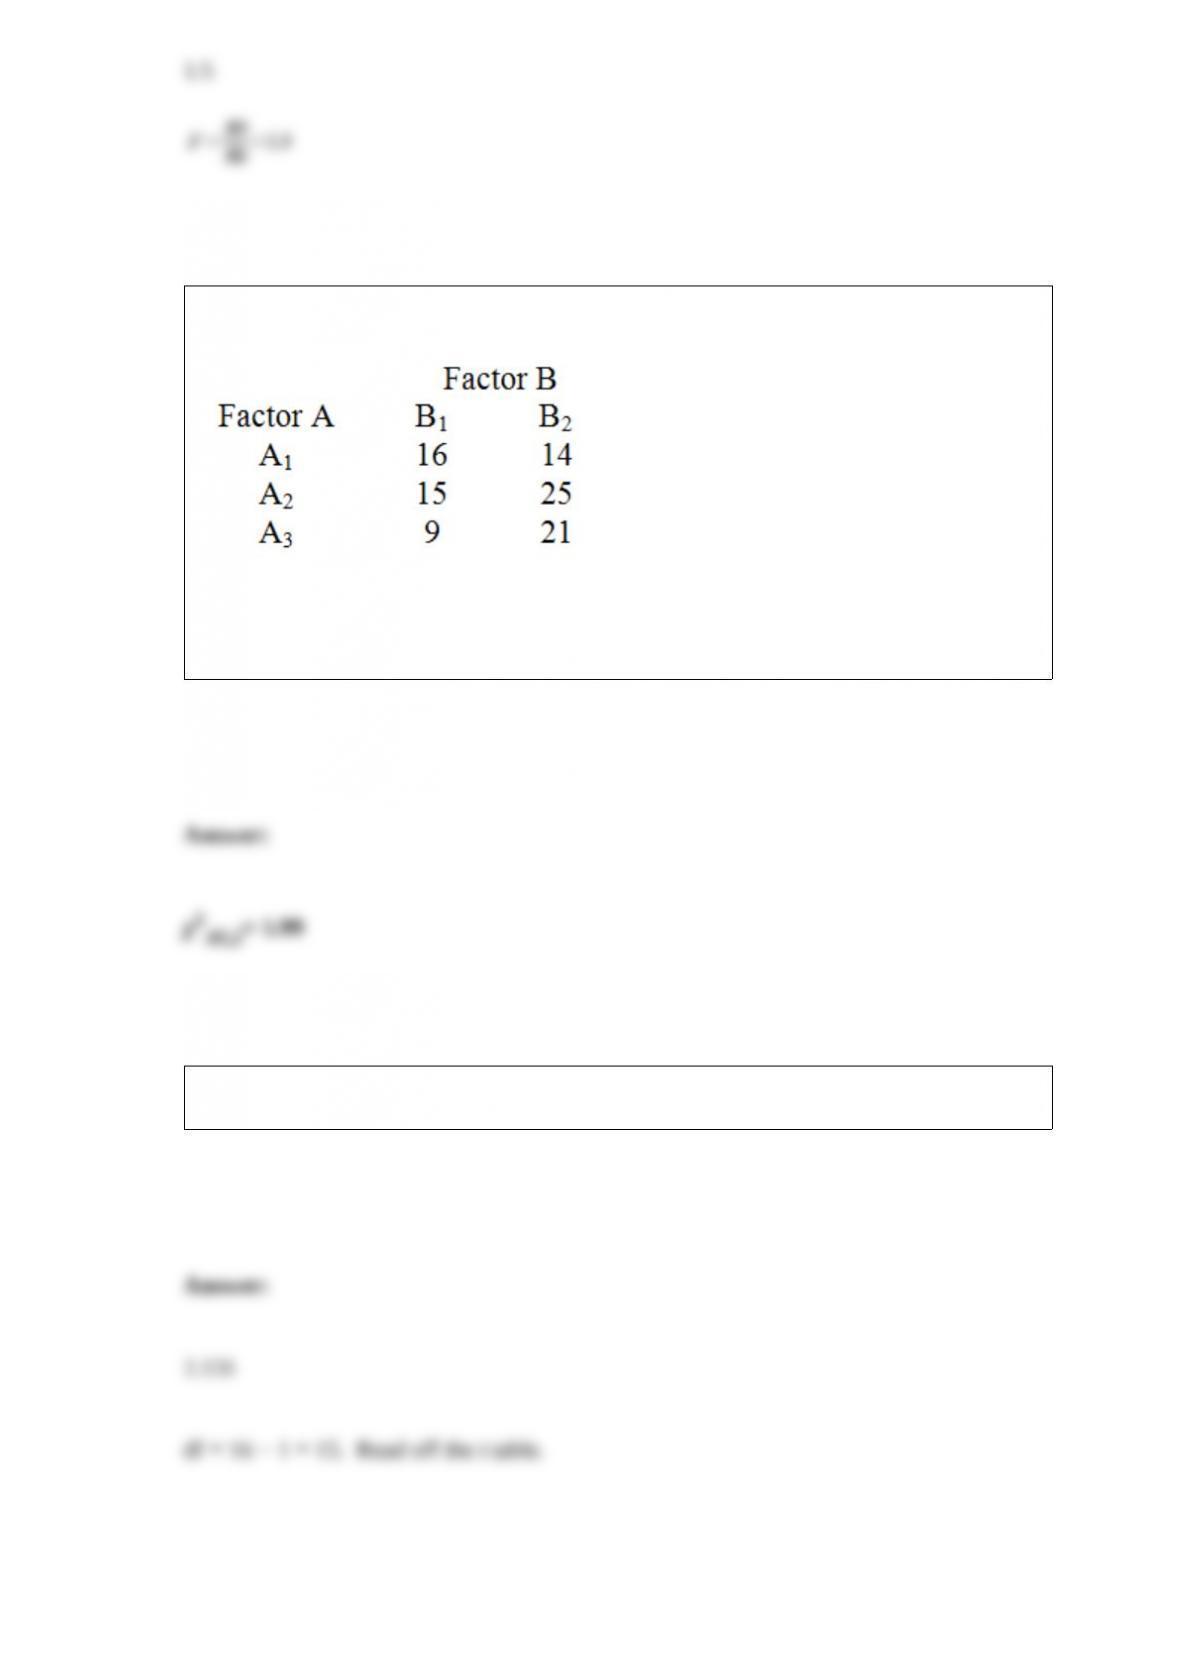
Consider the 3 x 2 contingency table below.
At α = .05, determine the tabular value of the chi-square statistic used to test for the
independence of Factors A and B.
When sample size is 16, find t.025.
Find a 95 percent confidence interval for the difference between the proportions of
older and younger drivers who have tickets, where 1 = .275, 2 = .25, n1 = 1000, and
n2 = 1000.
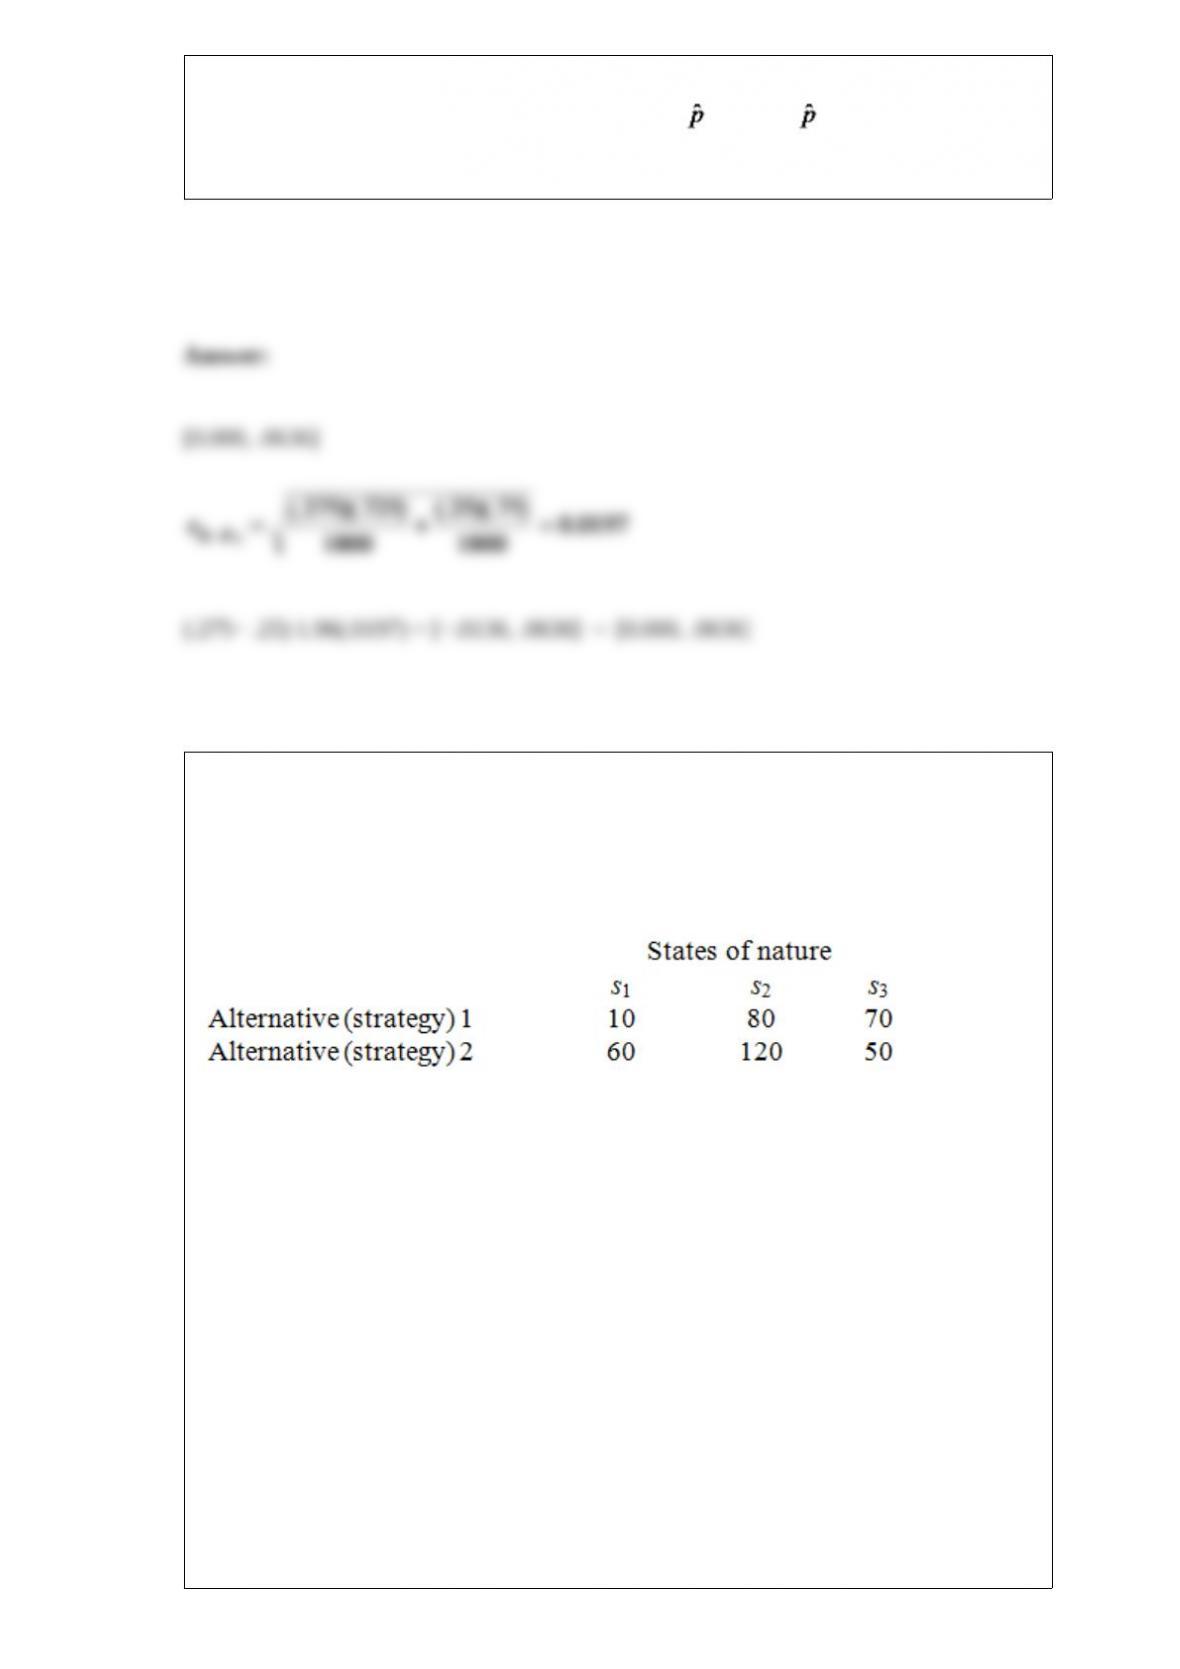
Alternatives 1 and 2 in the following payoff table represent the two possible
manufacturing strategies that the EKA manufacturing company can adopt. The level of
demand affects the success of both strategies. The states of nature (SI) represent the
levels of demand for the company products. S1, S2, and S3 characterize high, medium,
and low demand, respectively. The payoff values are in thousands of dollars.
The management believes that weather conditions significantly affect the level of
demand. 48 monthly sales reports are randomly selected. These monthly sales reports
show 15 months with high demand, 28 months with medium demand, and 5 months
with low demand. 12 of the 15 months with high demand had favorable weather
conditions. 14 of the 28 months with medium demand had favorable weather
conditions. Only 1 of the 5 months with low demand had favorable weather conditions.
Based on this information, the prior probabilities have been revised. If the weather
conditions are favorable, P(S1) = .4286, P(S2) = .5357, and P(S3) = .0357; and if the
weather conditions are poor, P(S1) = .1364, P(S2) = .6818, and P(S3) = .1818. It is also
determined that the probability of favorable weather is 0.56 and the probability of poor
weather is 0.44.
Determine the expected value of sample information. What is the maximum amount
that the company is willing to pay for the weather information and the additional
analysis?
In a major midwestern university, 55 percent of all undergraduates are female, 25
percent of all undergraduates belong to a Greek organization (fraternity or sorority), and
40 percent of all males belong to a Greek organization. Are the events “female/male”
and “belongs to a Greek organization” independent?
A. Yes, independent.
B. No, not independent.