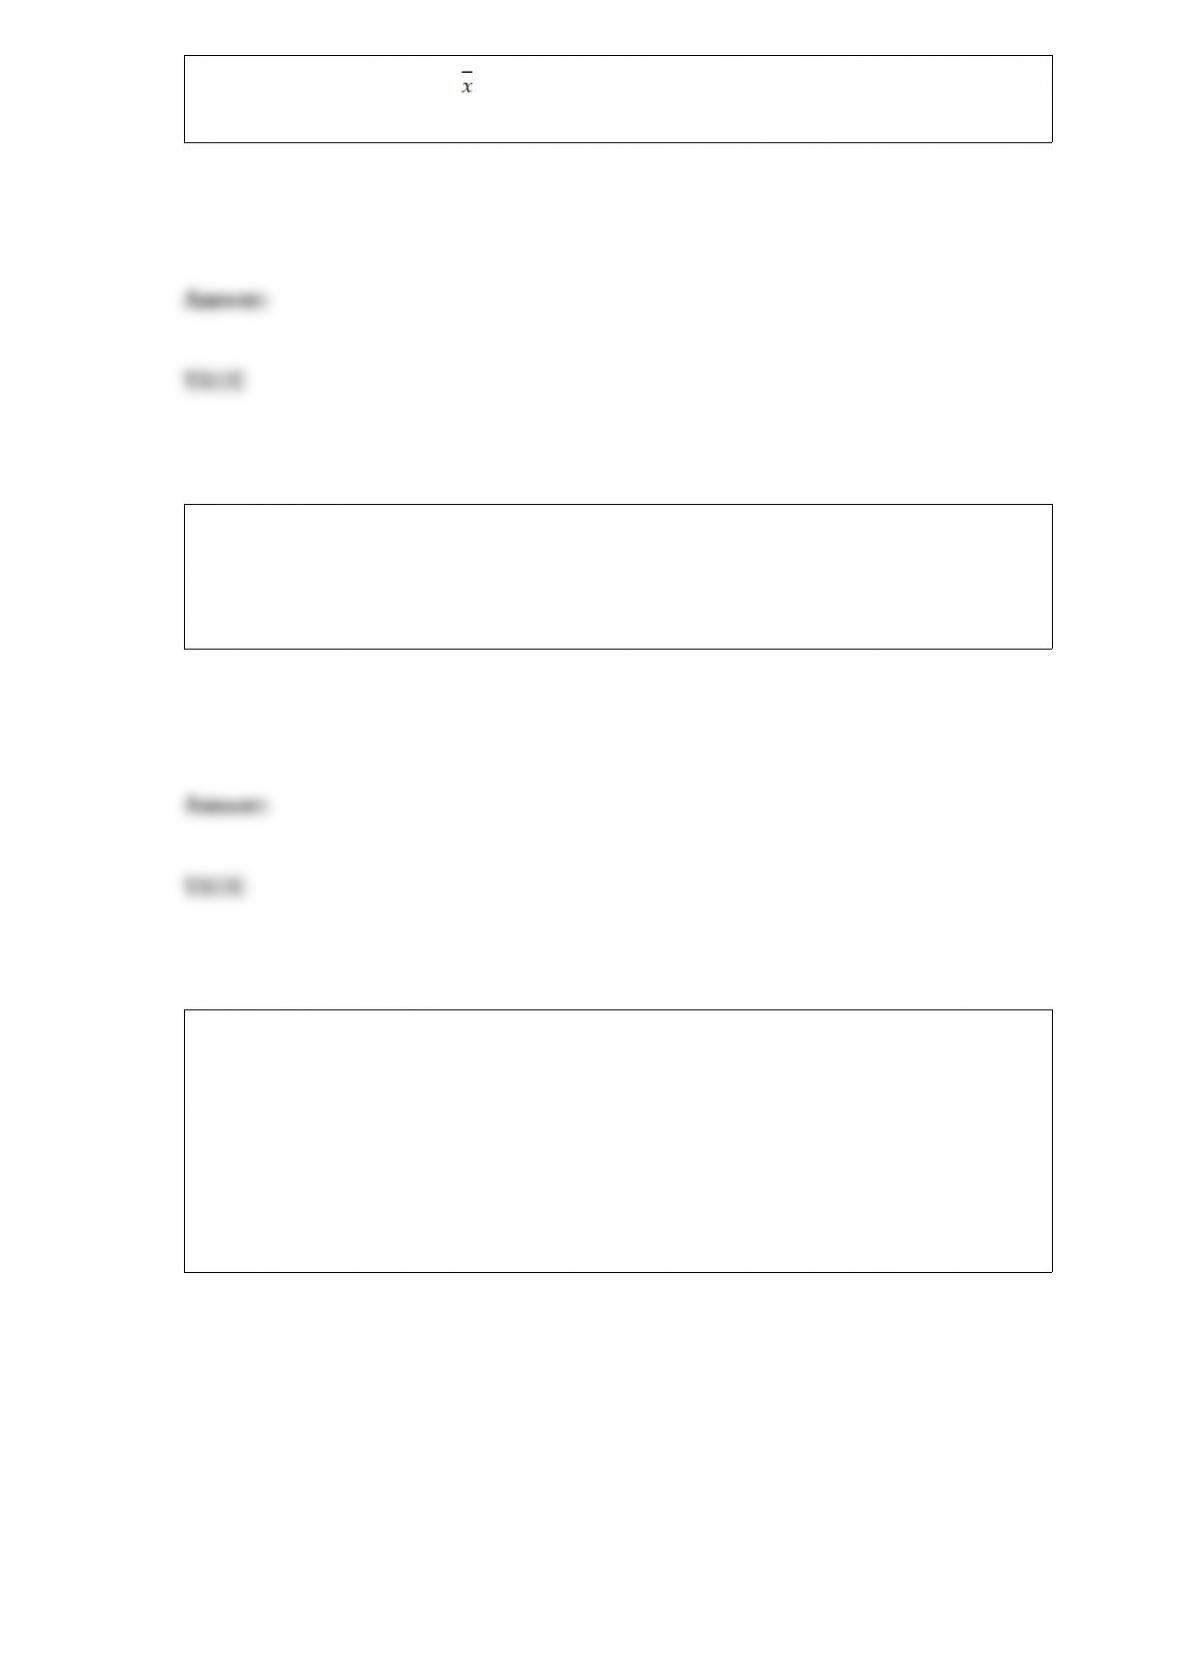
A sampling distribution for is the distribution of all possible sample means that could
be computed from the possible samples of a given sample size.
In a two-factor ANOVA design with replication, if the null hypothesis pertaining to
interaction between factors A and B is rejected, then it is recommended that the
hypothesis tests for factor A and factor B individually should not be conducted because
the conclusions might be misleading.
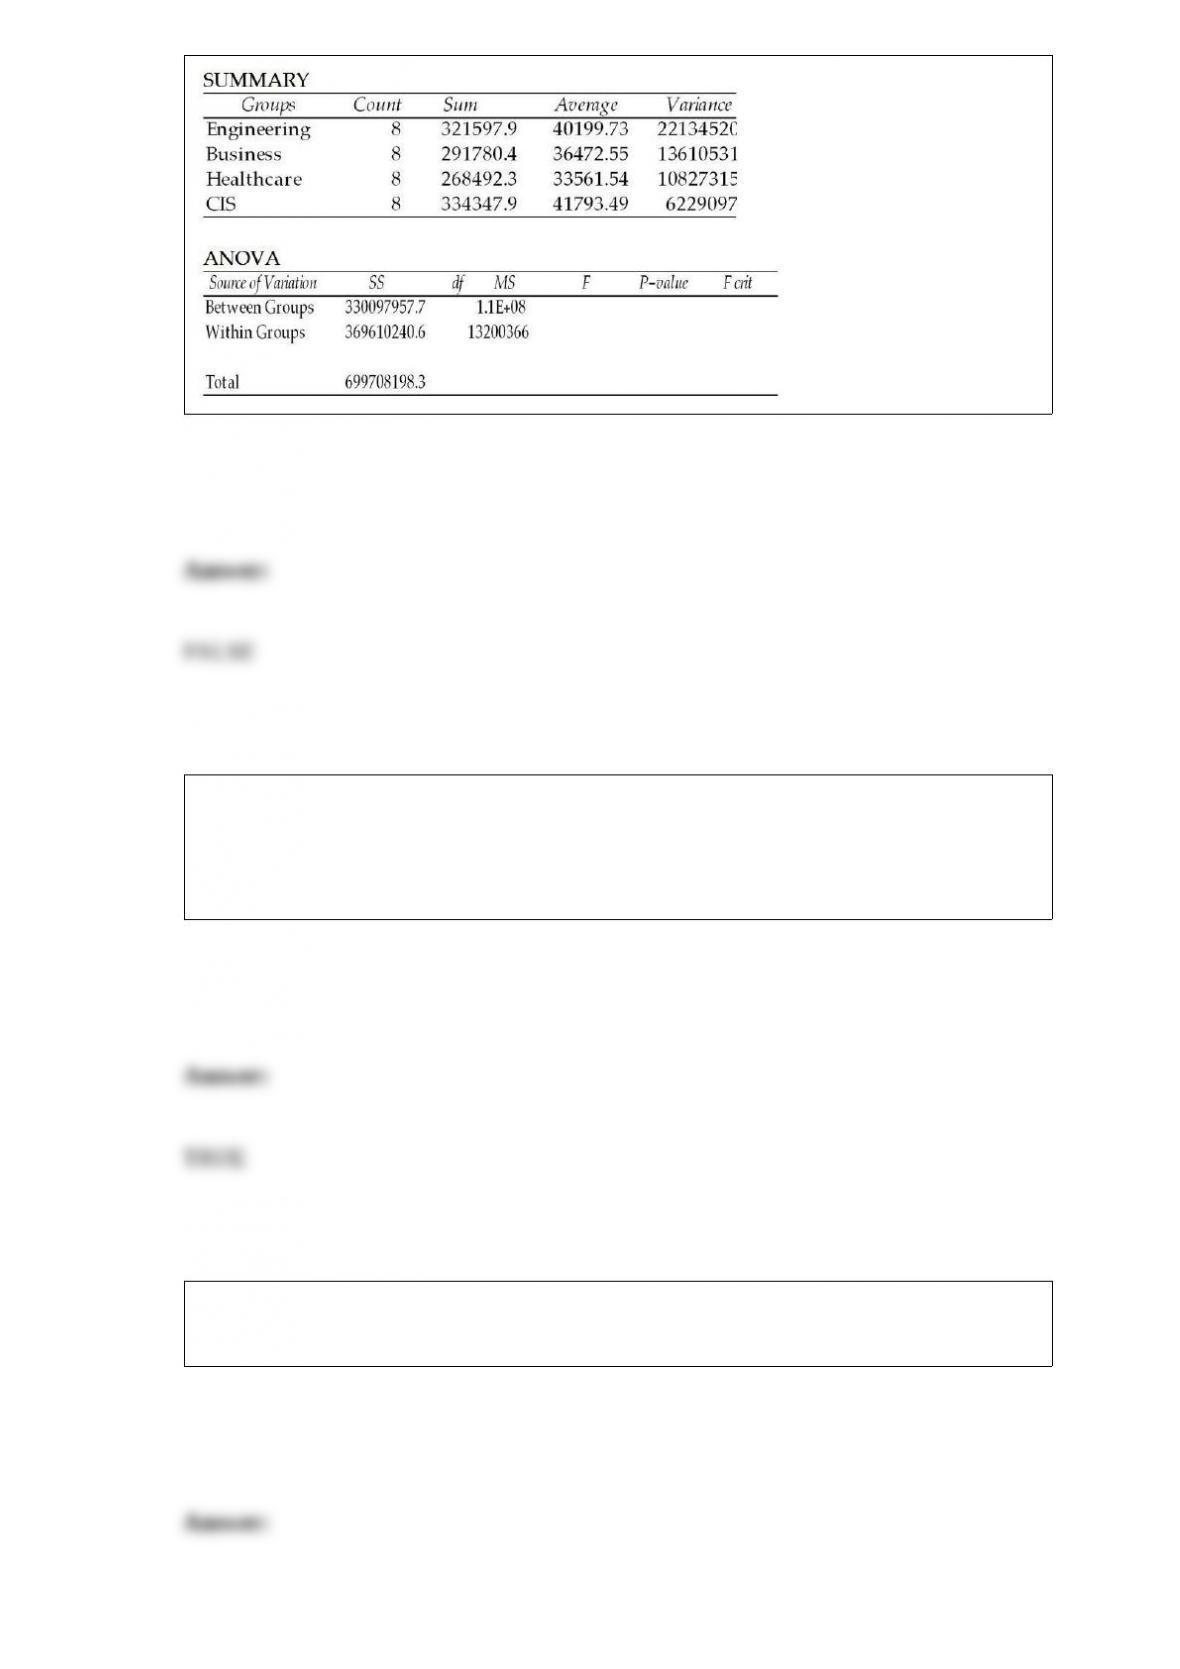
A study was recently conducted to see whether the mean starting salaries for graduates
of engineering, business, healthcare, and computer information systems majors differ. A
random sample of 8 graduates was selected from each major. The following chart shows
some of the results of the ANOVA computations; however, some of the output is
missing. Given what is available, the proper conclusion to reach based on the sample
data is that the population means could be equal using a 0.05 level of significance.
ANOVA: Single Factor
The regional sales manager for a medical supply company recently collected data on the
reasons why customers returned the merchandise for a refund. She actually formed a
frequency distribution for this variable. It would now be acceptable to construct a bar
chart to graphically display the results.
The time-series component that implies a long-term upward or downward pattern is
called the trend component.
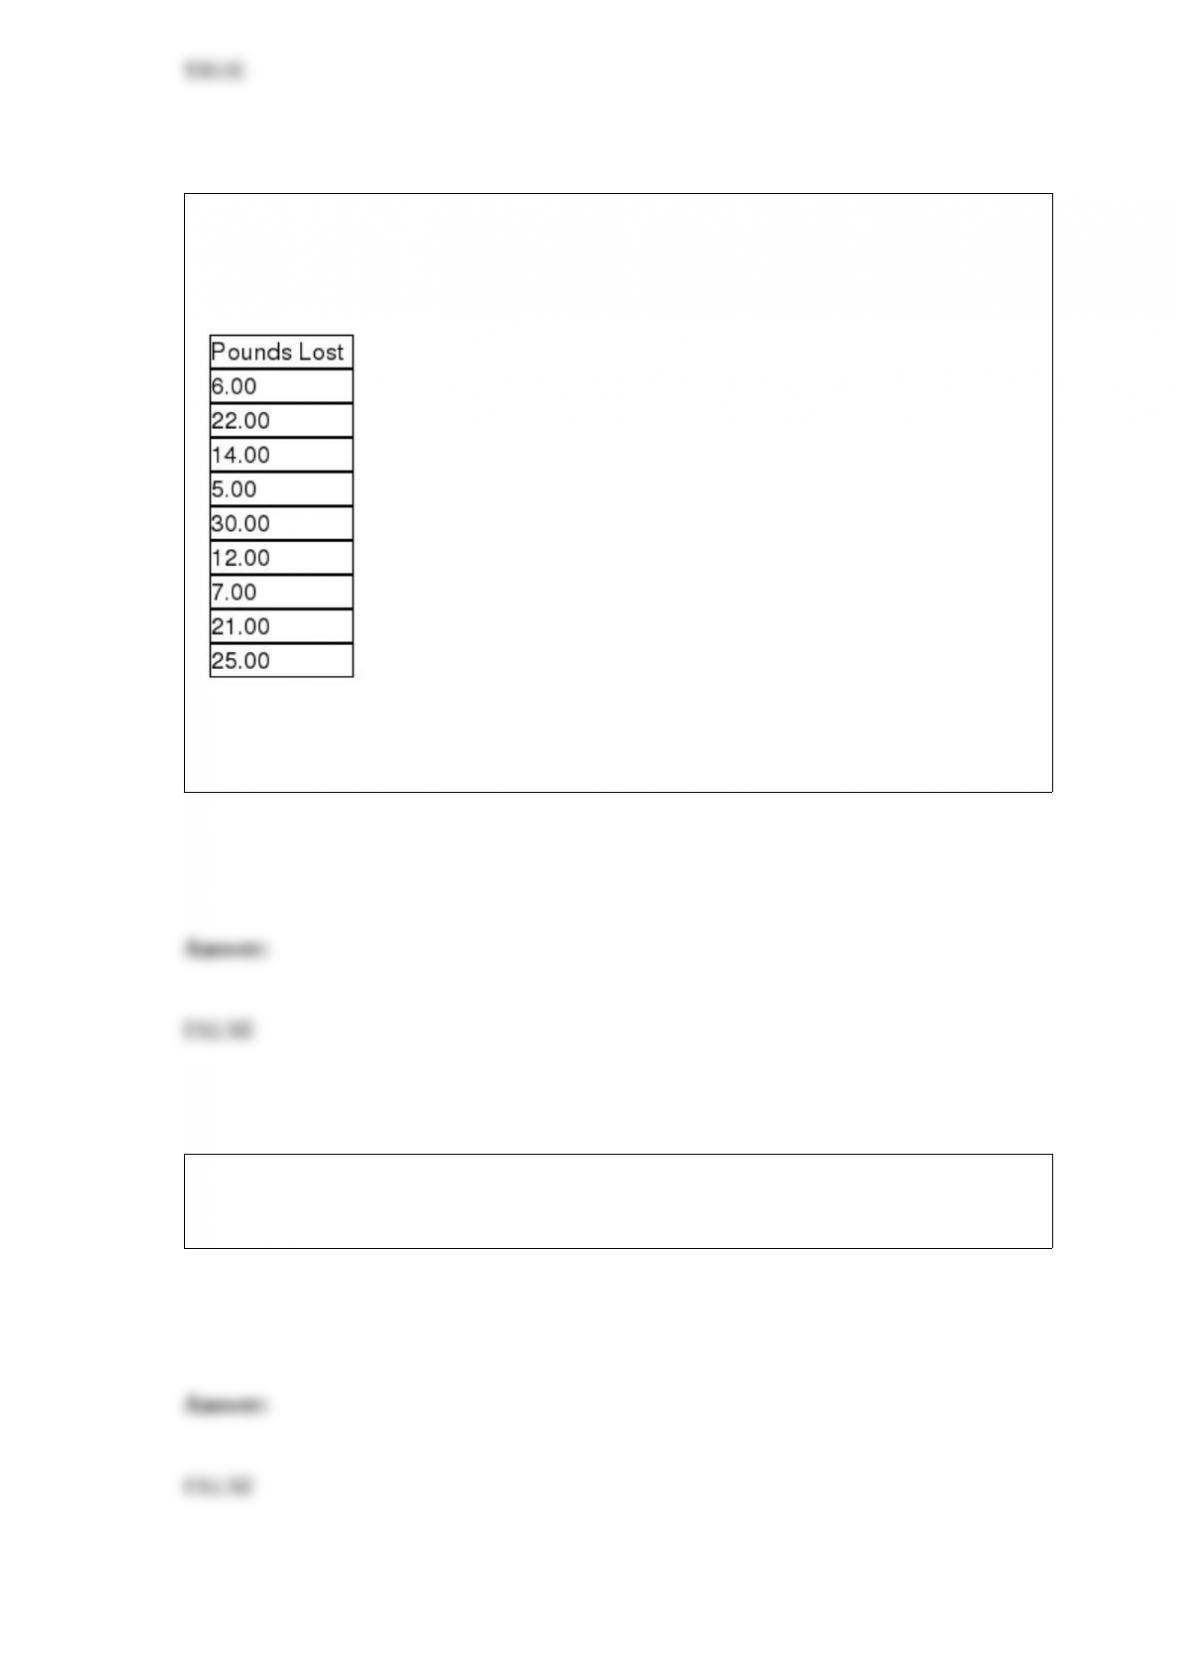
Managers for a company that produces a weight loss product claim that the median
weight lost over six weeks for people who use this product will be at least 20 pounds.
The following data were collected from a sample of nine people who used the product.
In order to test the manager’s claim, they will need to assume that the population is
normally distributed.
A set of data is considered to be symmetric if the 3rd quartile is three times larger than
the 1st quartile.
If a sample is selected using random sampling methods, the primary reason that the
sample mean might be different from the corresponding population mean is that the
sample might be biased.
The general idea is that interaction between two factors means that the effect due to one
of the factors is not uniform across all levels of the other factor.
In a simple regression model, if the regression model is deemed to be statistically
significant, it means that the regression slope coefficient is significantly greater than
zero.
The NCAA is interested in estimating the difference in mean number of daily training
hours for men and women athletes on college campuses. It wants 95 percent confidence
and will select a sample of 10 men and 10 women for the study. The variances are
assumed equal and the populations normally distributed. The sample results are:
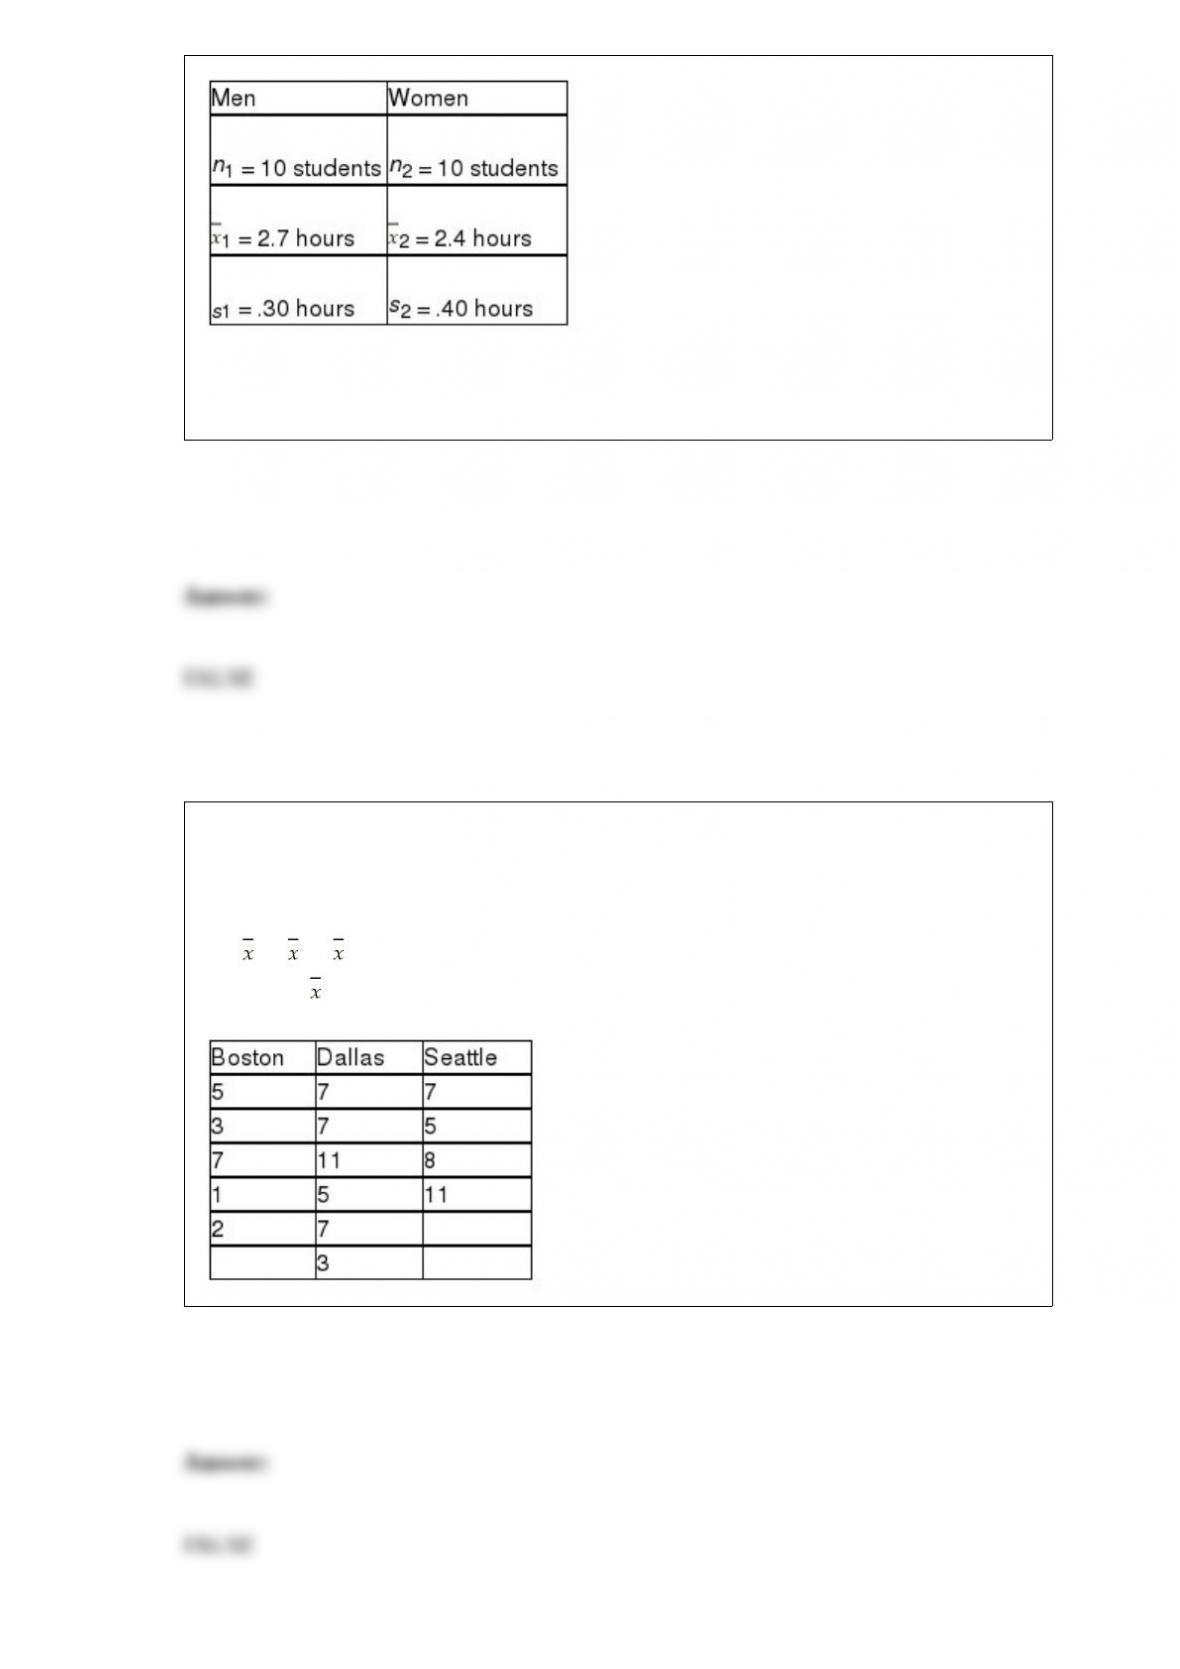
Based on these sample data, the estimate for the standard deviation of the sampling
distribution is found by taking the square root of the sum of the two sample variances.
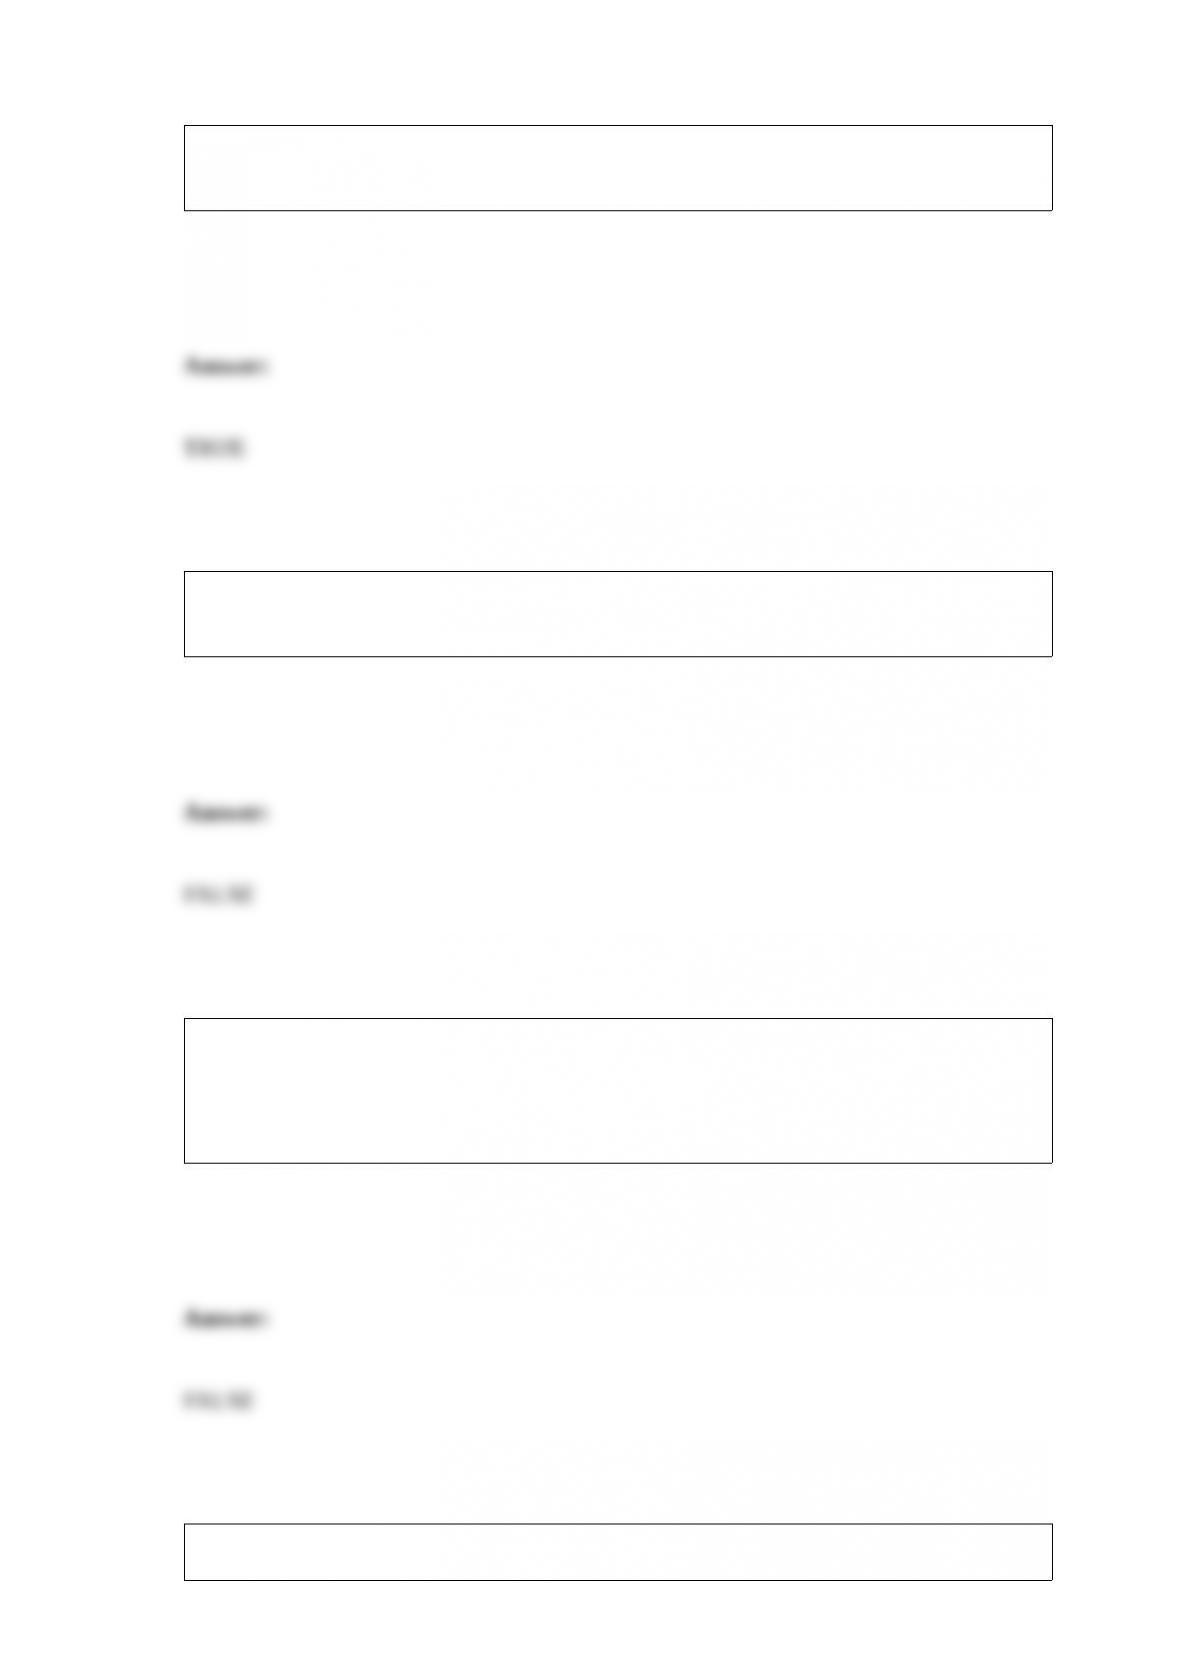
A national car rental agency is interested in determining whether the mean days that
customers rent cars is the same between three of its major cities. The following data
reflect the number of days people rented a car for a sample of people in each of three
cities. Given this information, the correct null and alternative hypotheses are:
H0 : 1 = 2 = 3
Ha : not all jare equal.
A point estimate is equally likely to be higher or lower than the population mean if the
sampling is done using a statistical sampling procedure.
Two variables have a correlation coefficient that is very close to zero. This means that
there is no relationship between the two variables.
The Adams Shoe Company believes that the mean size for men’s shoes is now more
than 10 inches. To test this, it has selected a random sample of n = 100 men. Assuming
that the test is to be conducted using a .05 level of significance, a p-value of .07 would
lead the company to conclude that its belief is correct.
An ogive is a graph of a joint frequency distribution.

The method used in regression analysis for incorporating a categorical variable into the
model is by organizing the categorical variable into one or more dummy variables.
The Hawkins Company randomly samples 10 items from every large batch before the
batch is packaged and shipped. According to the contract specifications, 5 percent of the
items shipped can be defective. If the inspectors find 1 or fewer defects in the sample of
10, they ship the batch without further inspection. If they find 2 or more, the entire
batch is inspected. Based on this sampling plan, the probability that a batch that meets
the contract requirements will end up being 100 percent inspected is approximately .
0746.
A p-chart would potentially be used to monitor the diameters of bolts made by a bolt
manufacturing plant.

All other factors held constant, the higher the confidence level, the closer the point
estimate for the population mean will be to the true population mean.
When determining sample size for a proportion, using p = 0.5 will produce the smallest
possible value for n.
Companies frequently use charts and graphs in their regular communications with
stockholders and investors; this shows the use of descriptive statistics.
A regression model that is deemed to have a regression slope coefficient that could be
equal to zero should not be used for prediction since there is no established linear
relationship between the x and y variable.
In a study of 30 customers’ utility bills in which the monthly bill was the dependent
variable and the number of square feet in the house is the independent variable, the
resulting regression model is = 23.40 + 0.04x. Given this model, for a customer with a
2,000 square foot house and a monthly utility bill equal to $100.00, the residual from
the regression model is approximately -$3.40.
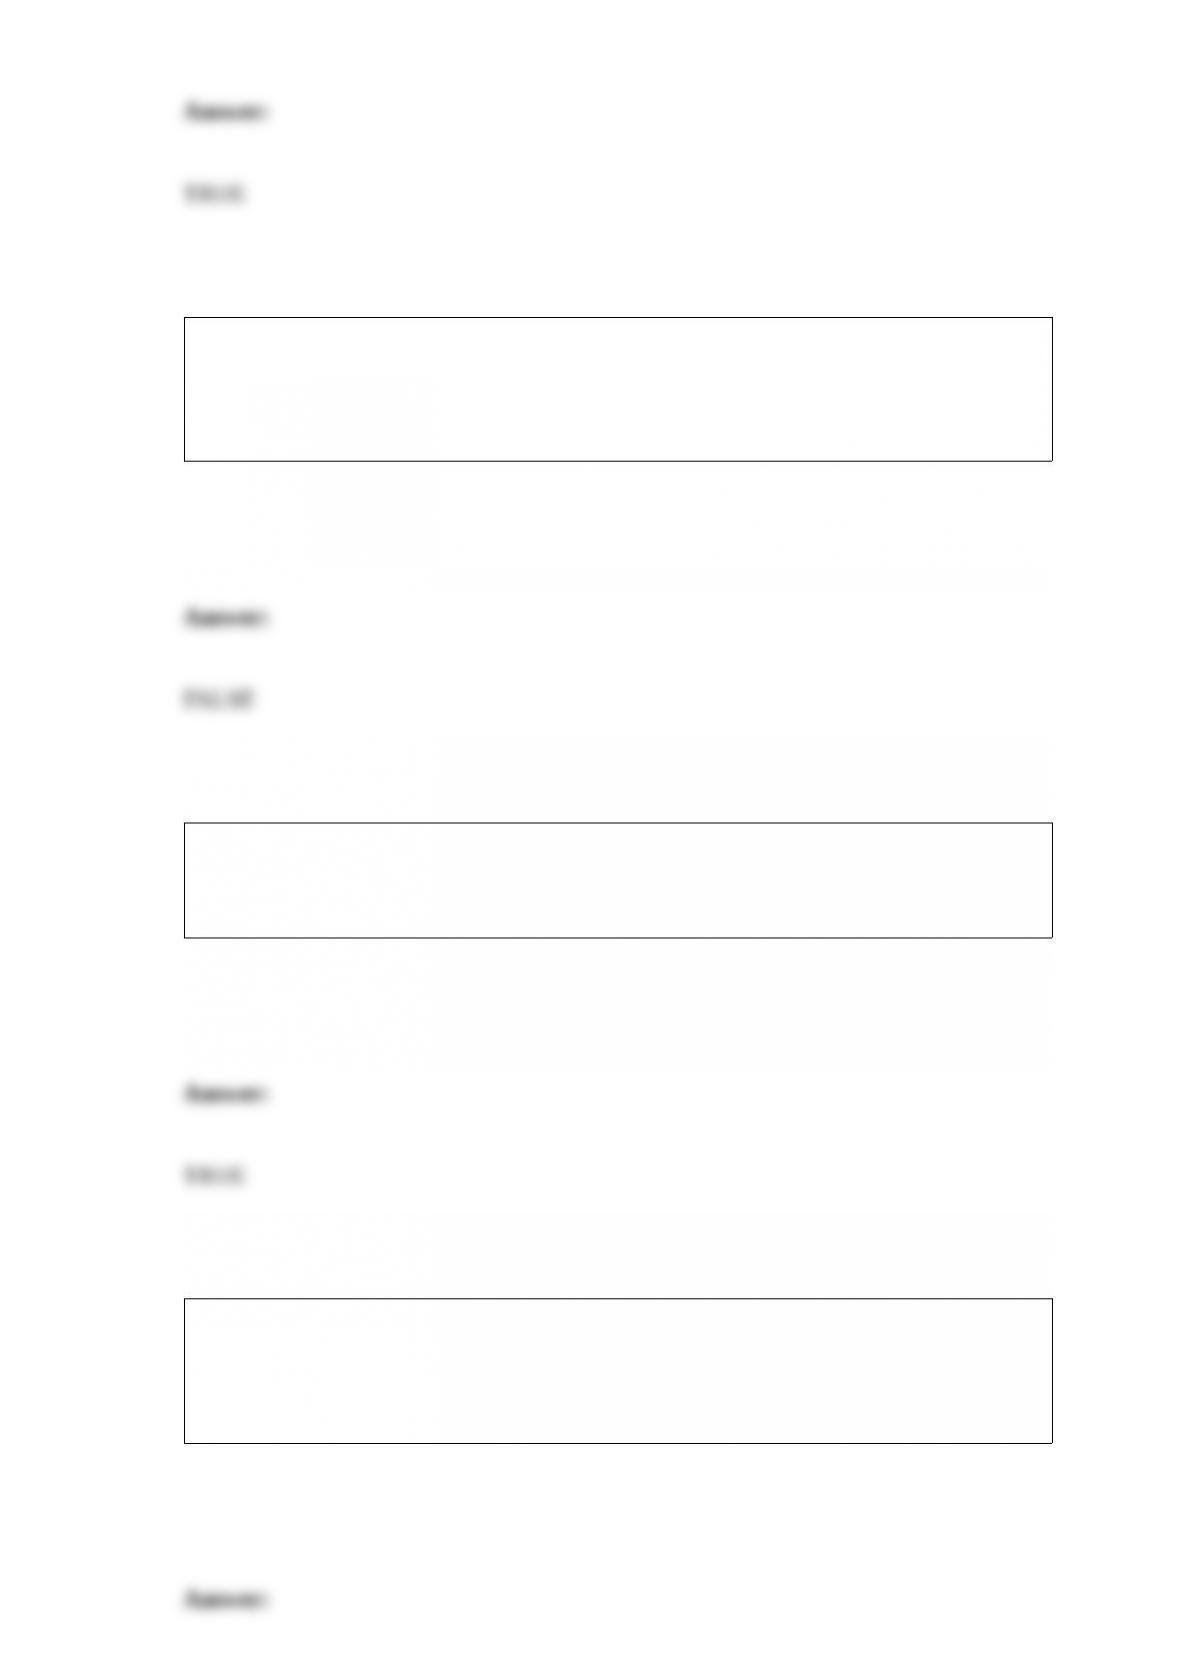
A major manufacturer of home electronics is interested in determining whether
customers have a preference between two new speaker designs for their home
entertainment centers. To test this, the design department manager has selected a
random sample of customers and shown them the first design. A second sample of
customers is shown design 2. The manager then asks each customer whether they prefer
the new design they were shown over the one they currently own. The following results
were observed:
Based on these data and a significance level equal to 0.05, the test statistic is
approximately -4.22 and thus the null hypothesis should be rejected.

The forecasting interval is the unit of time for which forecasts are made.
An electronics repair shop has determined that the time between failures for a particular
electronic component part is exponentially distributed with a mean time between
failures of 200 hours. Based on this information, the probability that a part will fail
between 20 and 100 hours is approximately 0.30.
Each week American Stores receives a shipment from a supplier. The contract specifies
that the maximum allowable percent defective is 5 percent. When the shipment arrives,
a sample of 20 parts is randomly selected. If 2 or more of the sampled parts are
defective, the shipment is rejected and returned to the supplier. Assume that a shipment
arrives that actually has 4 percent defective parts and the distribution of defective parts
is described by a binomial distribution. The probability that the shipment is accepted is
approximately 0.81
In a study involving car owners, one question asked the owner for the number of miles
driven last year. A second question asked the owner for the age of the vehicle. A
histogram would be useful for analyzing the relationship between miles driven and the
age of the vehicle.
After developing a frequency distribution for a quantitative variable, a histogram can be
developed with the horizontal axis representing the values of the variable and the
vertical axis representing the frequency of occurrence in each class or group.
The makers of Crustfree Bread in Boston have a quality standard that allows no more
than 3 burned loaves per batch on average. Recently, the manager inspected a batch and
found 5 burned loaves. She did not appear to be upset at the production meeting. This is
because the chance of exactly 5 burned loaves occurring is 0.1008.
In comparing two distributions with the same mean, the coefficient of variation is the
only way to assess which distribution has the greatest relative variability.
In a hypothesis test, increasing the sample size will generally result in a smaller chance
of making a Type I error since sampling error is likely to be reduced.
In a forward selection stepwise regression process, the first variable to be selected will
be the variable that can, by itself, do the most to explain the variation in the dependent
variable. This will be the variable that provided the highest possible R-square value by
itself.
One of the advantages of data check sheets is that as the data are being recorded, they
are also being displayed in a useful format.
Although the concept of sampling distributions is an important concept in statistics, it is
very unlikely that a decision maker will actually construct a sampling distribution in
any practical business situation.
A probability distribution with an expected value greater than the expected value of a
second probability distribution will also have a higher standard deviation.
Standard stepwise regression
A) is the same as forward selection.
B) involves trying more regressions that the best subsets method.
C) always finds the best regression model.
D) combines attributes of both forward selection and backward elimination.
The company that makes a new weight loss pill claims that people who use this pill
according to instructions will lose an average of 20 pounds during a four-month period.
They say the claim is based on a study of 300 people. Which of the following statistical
methods was most likely used to arrive at the company’s conclusion?
A) Estimation
B) Hypothesis testing
C) Histograms
D) Bar charts
Recently, a department store chain was interested in determining if there was a
difference in the mean number of customers who enter the three stores in Seattle. The
analysts set up a study in which the number of people entering the stores was counted
depending on whether the day of the week was Saturday, Sunday, or a weekday. The
following data were collected:
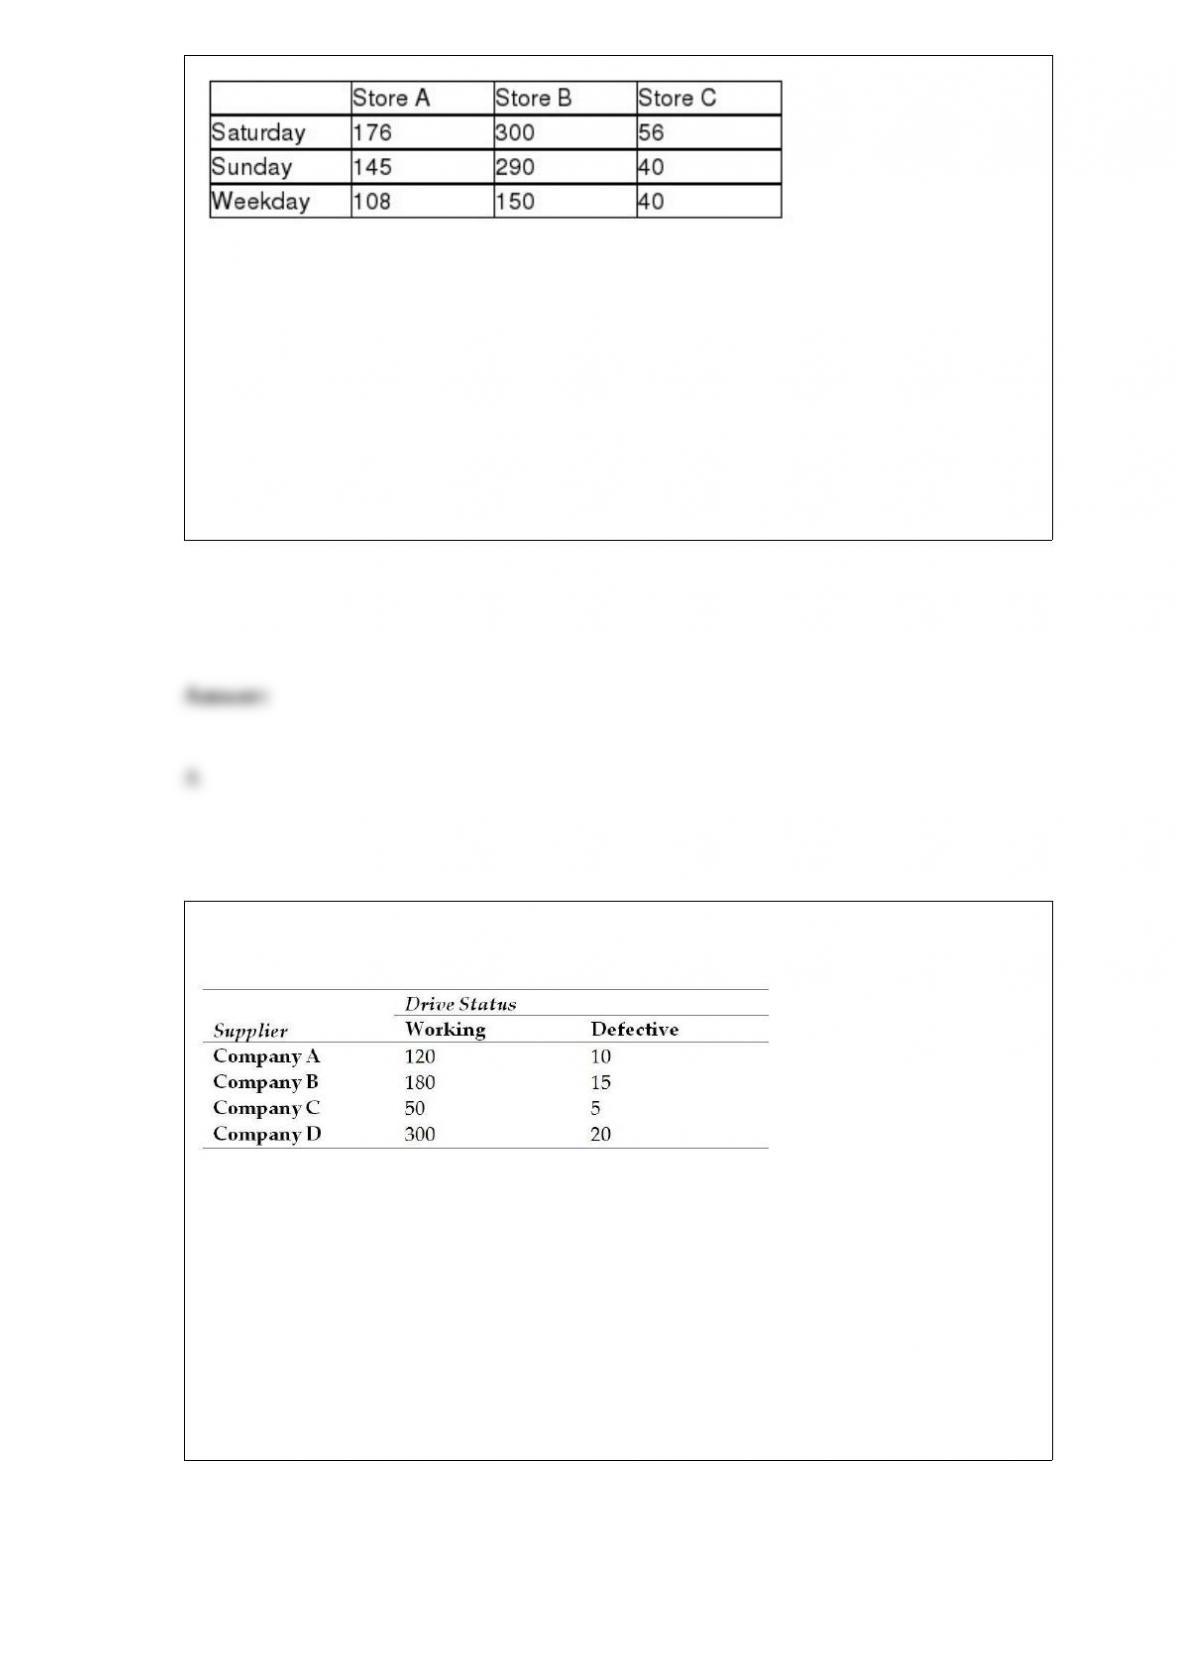
Given this format, which of the following is true?
A) The day of the week would be considered the blocking factor in the study.
B) There are six treatments.
C) This is a balanced design since the number of rows and columns is equal.
D) All of the above are true.
Suppose a quality manager for Dell Computers has collected the following data on the
quality status of disk drives by supplier. She inspected a total of 700 disk drives.
What is the probability of a defect given that company B supplied the disk drive?
A) 0.077
B) 0.28
C) 0.021
D) 0.76

When a survey uses the responses strongly disagree, disagree, neutral, agree, strongly
agree, this is an example of:
A) nominal data.
B) ordinal data.
C) interval data.
D) ratio data.
Hono Golf is a manufacturer of golf products in Taiwan and China. One of the golf
accessories it produces at its plant in Tainan Hsing, Taiwan, is plastic golf tees. The
injector molder produces golf tees that are designed to have an average height of 66
mm. To determine if this specification is met, random samples are taken from the
production floor. One sample is contained in the file labeled THeight. Determine if the
process is not producing the tees to specification. Use a significance level of 0.01.
A) Since t = 2.1953 < 2.8073 do not reject H0. There is not sufficient evidence to
conclude that the average height of the plastic tees is different from 66 mm.
B) Since t = 2.1953 < 2.8073 reject H0. There is sufficient evidence to conclude that the
average height of the plastic tees is different from 66 mm.
C) Since t = 1.2814 < 1.9211 do not reject H0. There is not sufficient evidence to
conclude that the average height of the plastic tees is different from 66 mm.
D) Since t = 1.2814 < 1.9211 reject H0. There is sufficient evidence to conclude that the
average height of the plastic tees is different from 66 mm.

Beacon Hill Trees & Shrubs currently has an inventory of 10 fruit trees, 8 pine trees,
and 14 maple trees. It plans to give 4 trees away at next Saturday’s lawn and garden
show in the city park. The 4 winners can select which type of tree they want. Assume
they select randomly.
What is the probability that no fruit trees and 2 of each of the others will be selected?
A) 0.0058
B) 0.0218
C) 0.0355
D) 0.0709
An animal shelter wants to estimate the mean number of animals housed daily and they
know the standard deviation. If they want to find a 98 percent confidence interval the
critical value to use is:
A) 1.645
B) 1.98
C) 2.33
D) 2.575
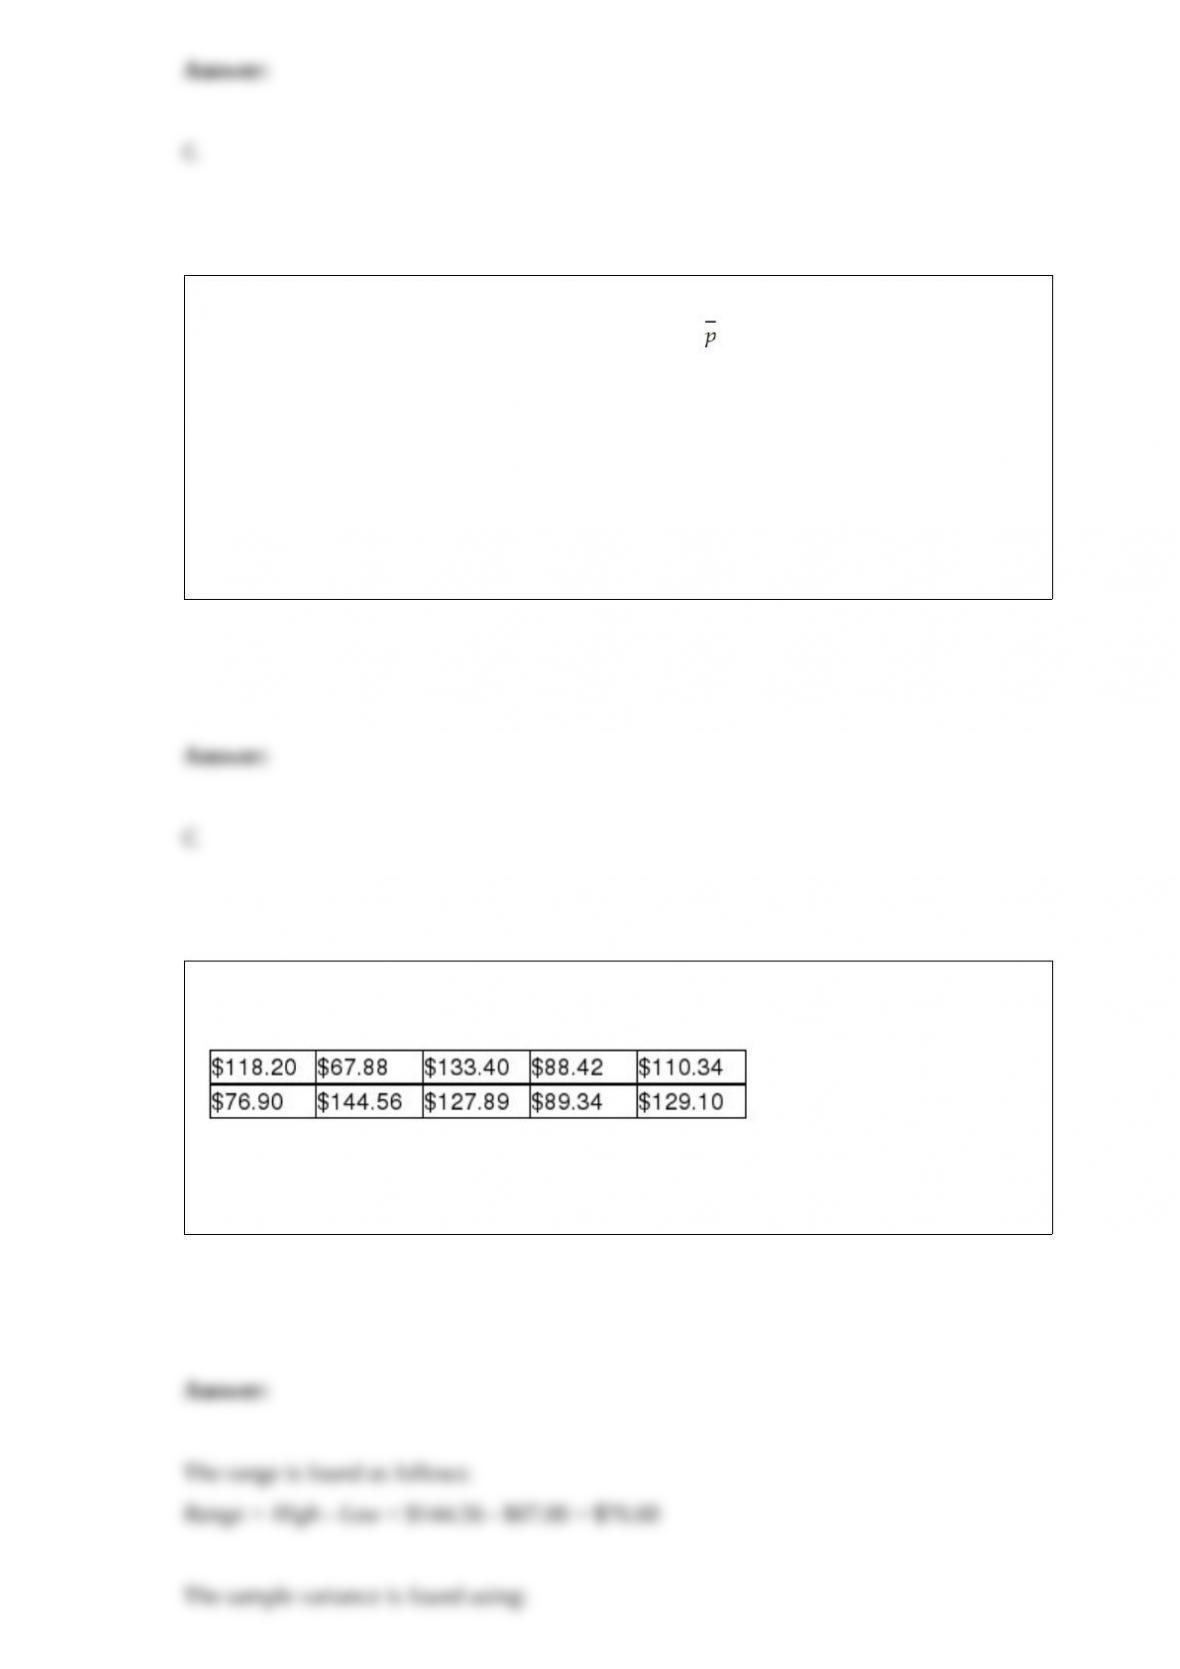
Compute the 90% confidence interval estimate for the population proportion, p, based
on a sample size of 100 when the sample proportion, is equal to 0.40.
A) 0.3880, 0.0412)
B) (0.3930, 0.4070)
C) (0.3194, 0.4806)
D) (0.3886, 0.4114)
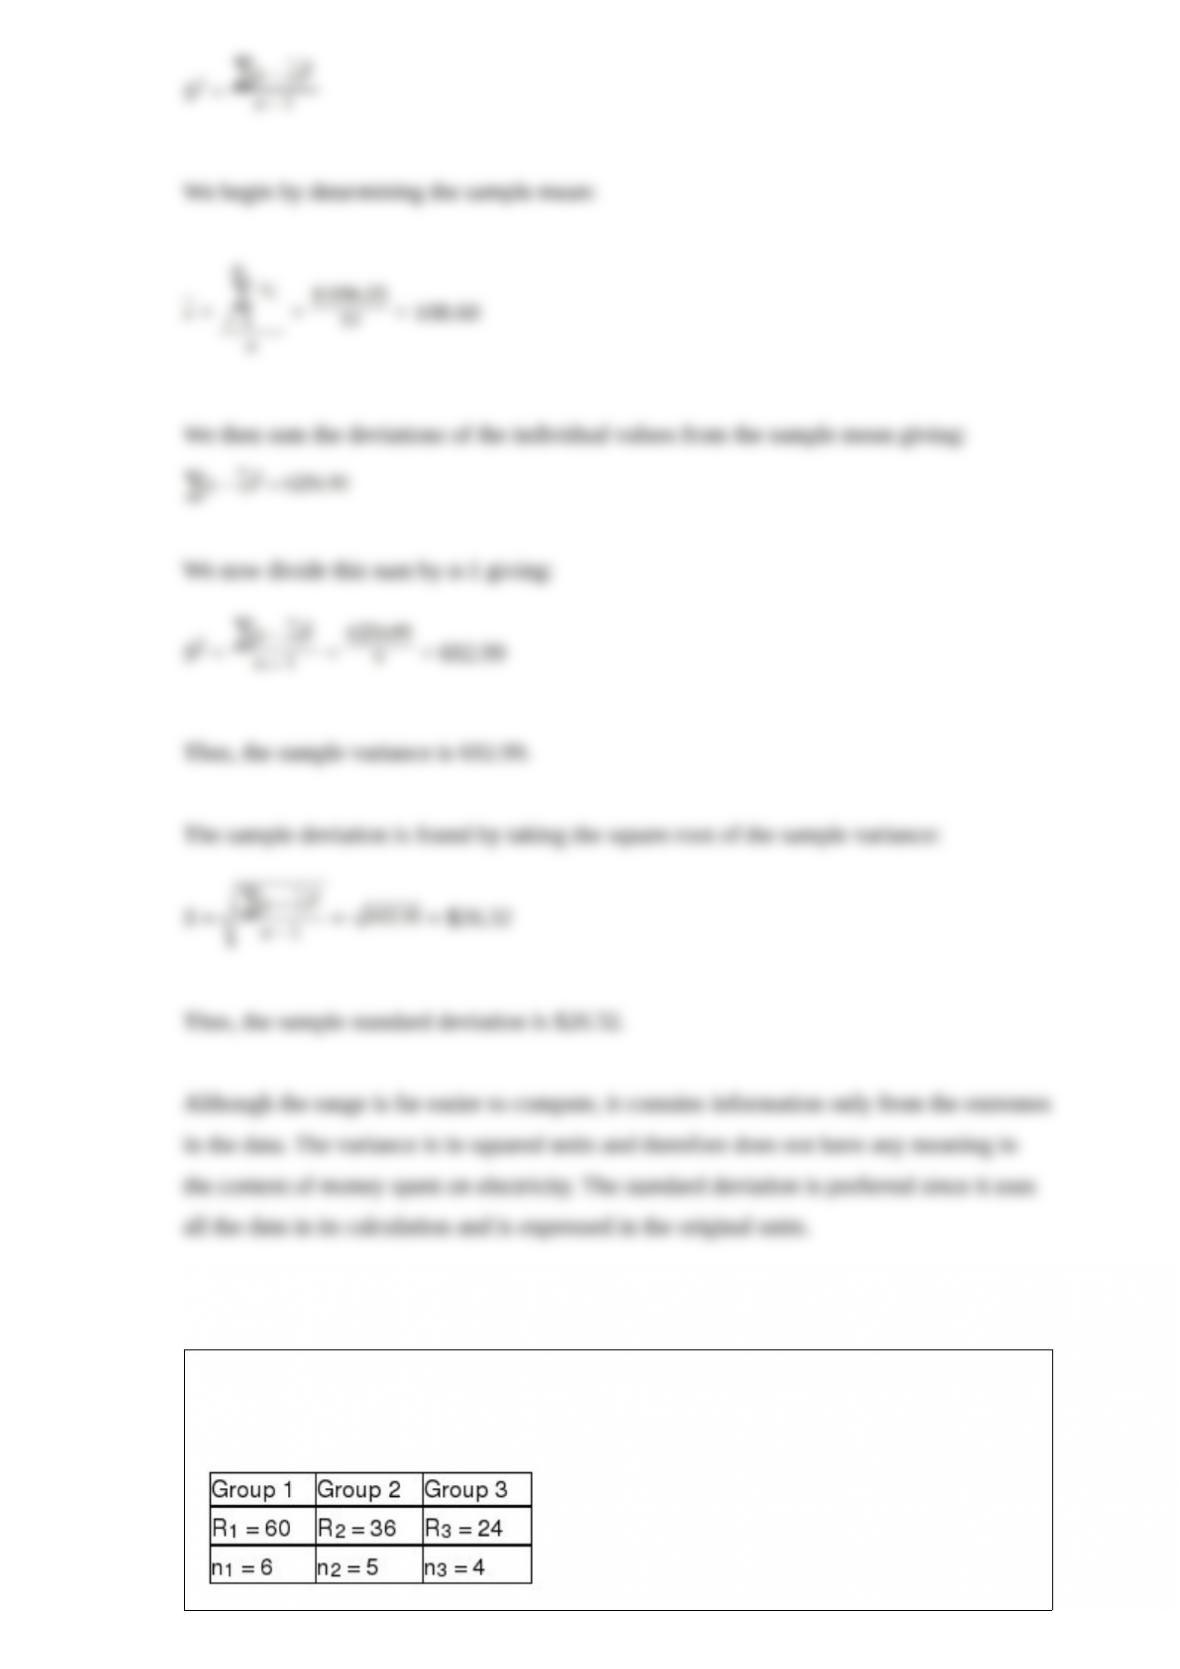
The following sample data reflect electricity bills for ten households in San Diego in
March.
Compute the range, variance, and standard deviation for these sample data. Discuss
which of these three measures you would prefer to use as a measure of variation.
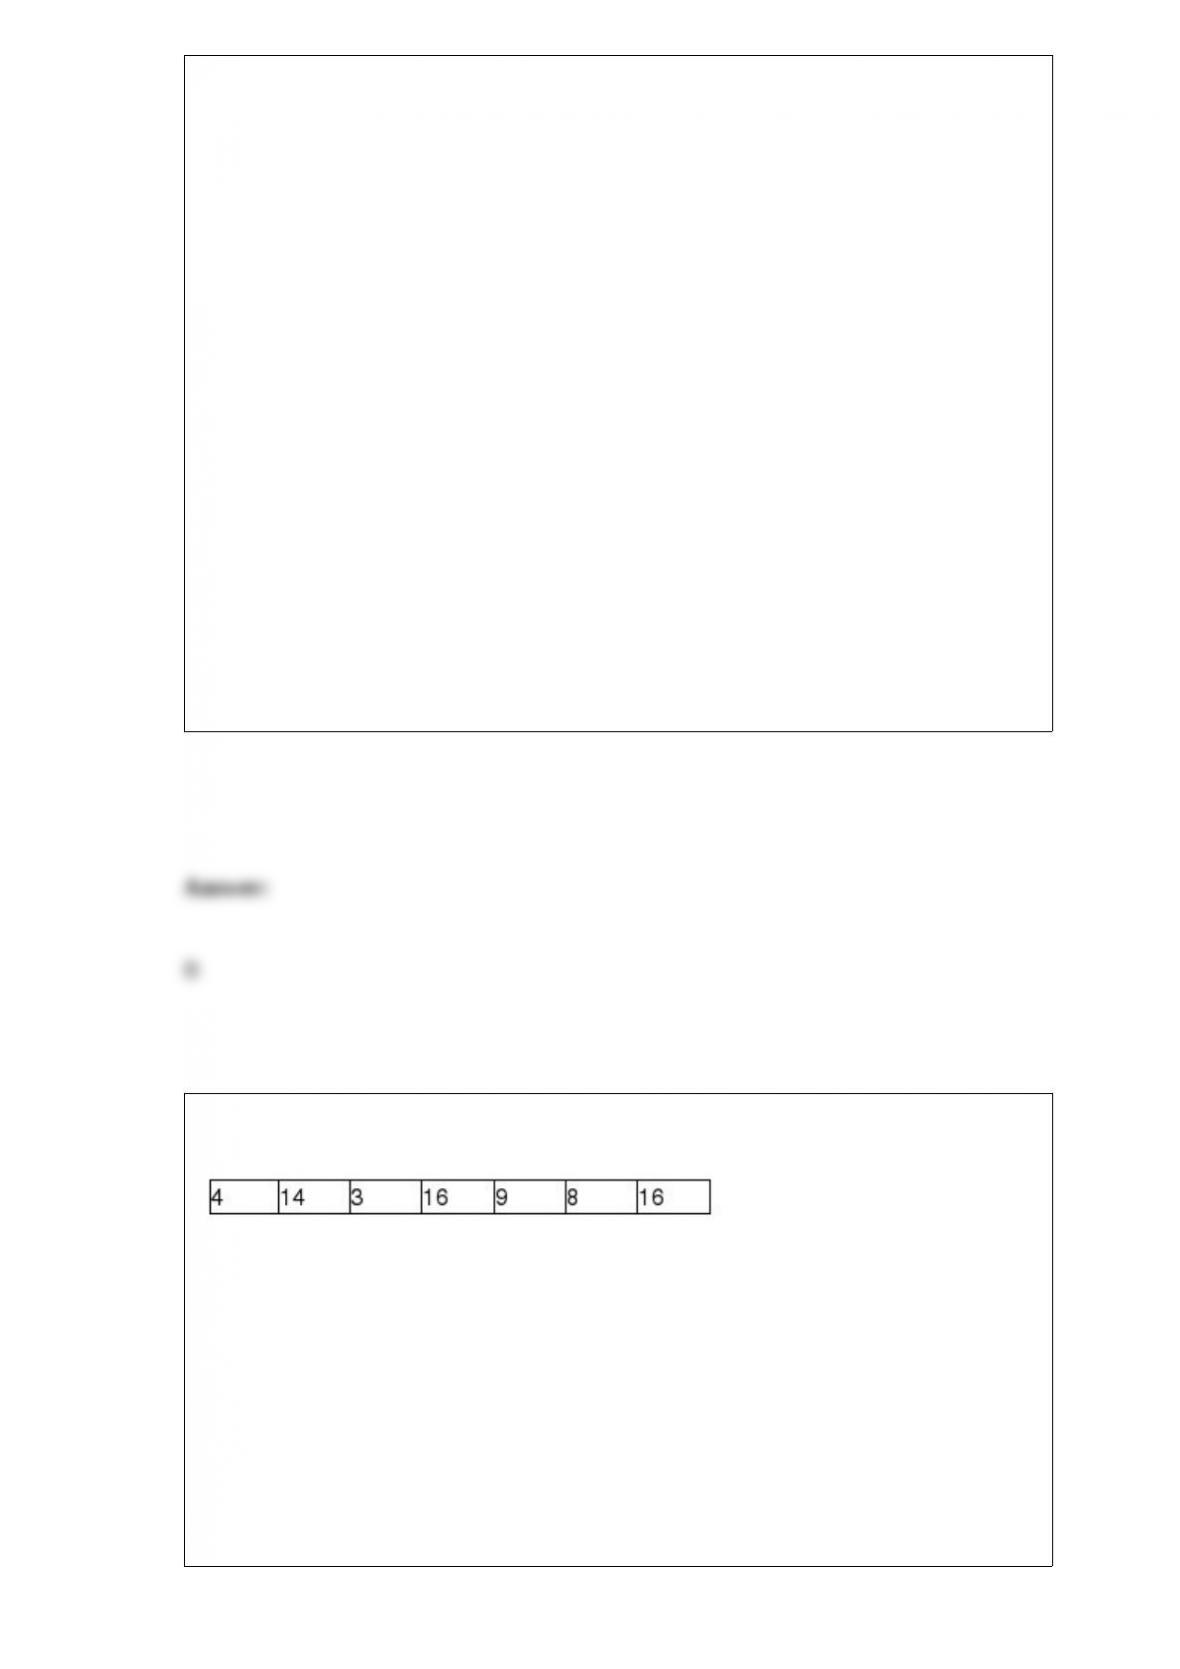
Assume that a Kruskal-Wallis test is being conducted to determine whether or not the
medians of three populations are equal. The sum of rankings and the sample size for
each group are below.

What is the critical value for this test using a 0.10 level of significance?
A) 6.2514
B) 5.9915
C) 7.8147
D) 4.6052
When conducting a one-tailed hypothesis test of a population variance using a sample
size of n = 24 and a 0.10 level of significance, the critical value is:
A) 32.0069
B) 35.1725
C) 33.1962
D) 36.4150
Under what circumstances is it necessary to use the coefficient of variation to compare
relative variability between two or more distributions?
A) When the means of the distributions are equal

B) When the means of the distributions are not equal
C) When the standard deviations of the distributions are not equal
D) When the standard deviations of the distributions are equal
There are a number of highly touted search engines for finding things of interest on the
Internet. Recently, a consumer rating system ranked two search engines ahead of the
others. Now, a computer user’s magazine wishes to make the final determination
regarding which one is actually better at finding particular information. To do this, each
search engine was used in an attempt to locate specific information using specified
keywords. Both search engines were subjected to 100 queries. Search engine 1
successfully located the information 88 times and search engine 2 located the
information 80 times. Using a significance level equal to 0.05, what is the critical value
for the hypothesis test?
A) z = 196
B) z = 1.645
C) t = 2.0456
D) z = 2.575
Which of the following statements is true?
A) Dummy variables are used to incorporate categorical variables into a regression

model.
B) You should use one fewer dummy variables than are categories for the qualitative
variable in question.
C) It is appropriate to compute a correlation coefficient for the relationship between a
dependent variable and a dummy variable.
D) All of the above are true.
The Carter Department Store has data on the sales volume by department for the past
200 days. The data are in an Excel spreadsheet where column A represents the
department name and column B represents the sales for each day in that department. In
order to construct a bar chart that illustrates the difference in total sales by department
for the 200 days, a required step in Excel will be to:
A) determine the total sales by department.
B) use the frequency function to count the number of occurrences by department.
C) group the data into 5 to 20 classes.
D) determine the class widths.
One of the primary advantages of using the median as a measure of the center for a set
of data is that the median is not affected by extreme values in the data.

A study was recently done in which the brand preference for breakfast cereal was
analyzed against the gender of the shopper. The study consisted of 200 male shoppers
and 300 female shoppers. Three different cereal brands were considered: A, B, and C. A
total of 250 female shoppers preferred brand A, 25 female shoppers preferred brand C.
The number of female shoppers that preferred brand B was:
A) 25.
B) 100.
C) 75.
D) 50.
An analyst plans to test whether the standard deviation for the time it takes bank tellers
to provide service to customers exceeds the standard of 1.5 minutes. The correct null
and alternative hypotheses for this test are:
A) H0 : σ > 1.5
HA : σ ≥ 1.5
B) H0 : σ ≤ 1.5
HA : σ > 1.5
C) H0 : σ2 ≤ 2.25
HA : σ2 > 2.25

D) H0 : σ2 > 2.25
HA : σ2 ≤ 2.25
A population of 10 items contains 3 that are red and 7 that are green. What is the
probability that in a random sample of 3 items selected without replacement, 2 red and
1 green items are selected?
A) 0.175
B) 0.086
C) 0.124
D) 0.211
A start-up cell phone applications company is interested in determining whether
house-hold incomes are different for subscribers to three different service providers. A
random sample of 25 subscribers to each of the three service providers was taken, and
the annual household income for each subscriber was recorded. The partially completed
ANOVA table for the analysis is shown here:
Complete the ANOVA table by filling in the missing sums of squares, the degrees of
freedom for each source, the mean square, and the calculated F-test statistic.
A) Between Groups df = 2, Within Groups df = 74, SSW = 6,322,592,933, MSB =
1,474,542,579,
MSW = 87,813,791, F = 16.79
B) Between Groups df = 2, Within Groups df = 72, SSW = 6,322,592,933, MSB =
1,474,542,579,
MSW = 87,813,791, F = 16.79.
C) Between Groups df = 2, Within Groups df = 72, SSW = 6,322,592,933, MSB =
1,474,542,579,
MSW = 87,813,791, F = 9.73
D) Between Groups df = 2, Within Groups df = 72, SSW = 6,322,592,933, MSB =
87,813,791,
MSW = 87,813,791, F = 16.79
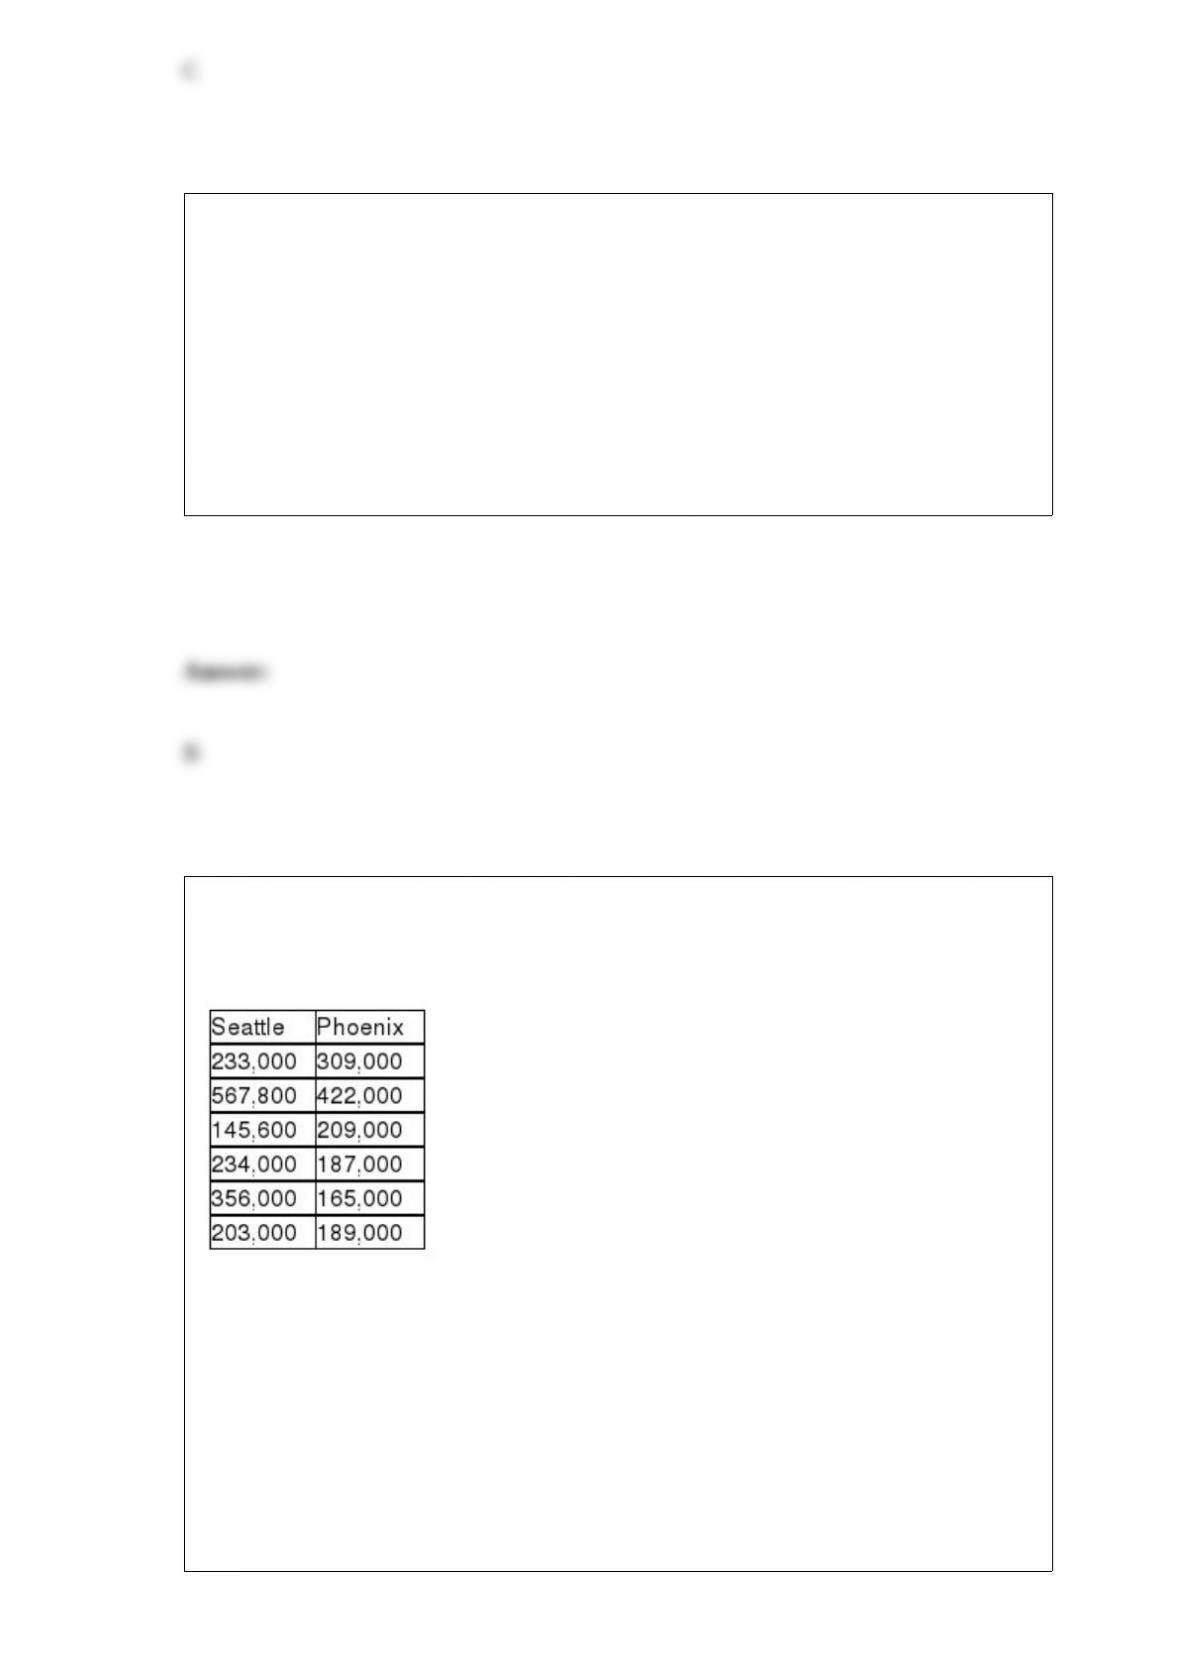
A small company has 7 employees. The numbers of years these employees have worked
for this company are shown as follows:
Based upon this information, the median number of years that employees have been
with this company is:
A) 9 years.
B) 16 years.
C) 10 years.
D) 14 years.

If a binomial distribution applies with a sample size of n = 20, find the expected value,
n = 20, p = 0.20.
A) 2
B) 3
C) 4
D) 5
The method of probability assessment that is least likely to be used by business decision
makers is:
A) subjective assessment.
B) relative frequency of occurrence.
C) classical assessment.
D) None of the above is used by decision makers.
If a binomial distribution applies with a sample size of n = 20, find the probability of at
least 7 successes if the probability of a success is 0.25.
A) 0.1814
B) 0.2142
C) 0.2333
D) 0.3123
Consider the situation in which a study was recently conducted to determine whether
the median price of houses is the same in Seattle and Phoenix. The following data were
collected.
Given these data, if a Mann-Whitney U test is to be used, the test statistic is:
A) 22
B) 14
C) approximately 1.96
D) 34
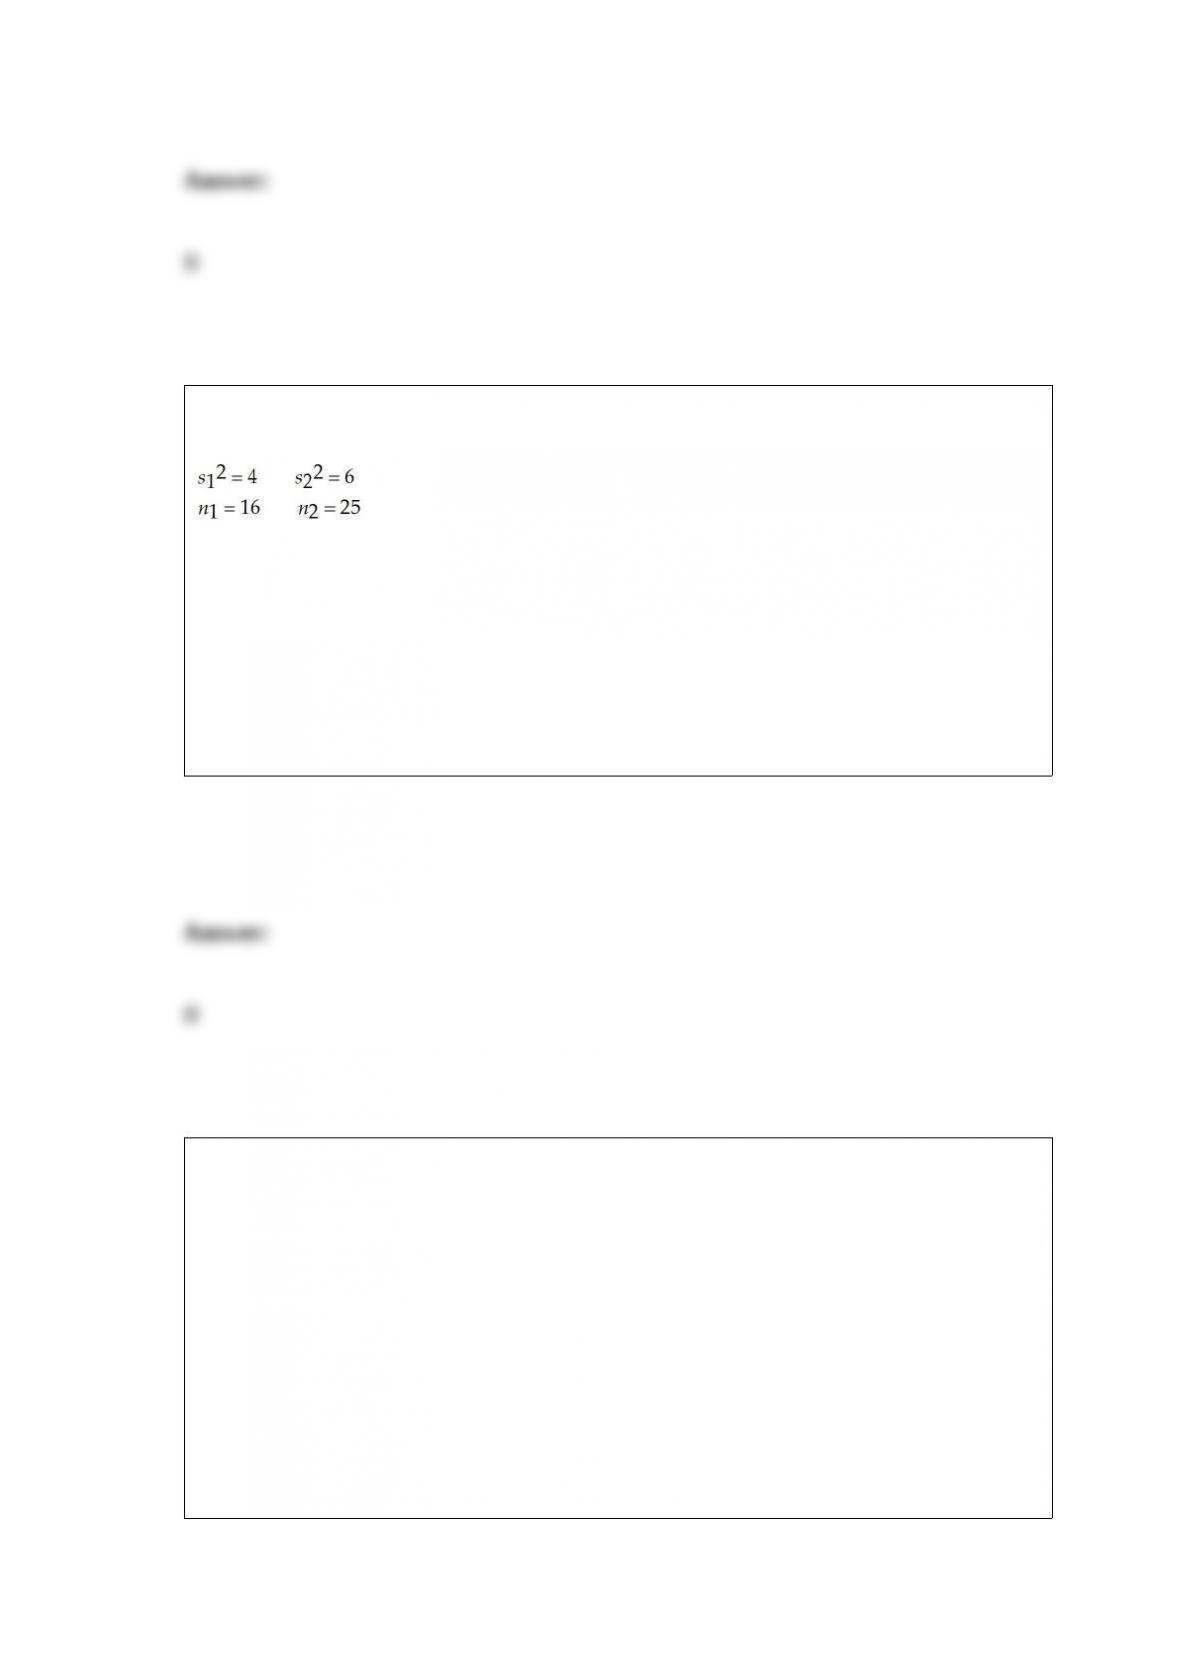
Given the following information, calculate the degrees of freedom that should be used
in the pooled-standard deviation t-test.
A) df = 41
B) df = 39
C) df = 16
D) df = 25
The manager of a computer help desk operation has collected enough data to conclude
that the distribution of time per call is normally distributed with a mean equal to 8.21
minutes and a standard deviation of 2.14 minutes. Based on this, what is the probability
that a call will last longer than 13 minutes?
A) About 0.0125
B) Approximately 0.4875
C) About 0.5125
D) About 0.9875

In developing a confidence interval estimate for the population mean, the t-distribution
is used to obtain the critical value when:
A) the sample contains some extreme values that skew the results.
B) the population standard deviation is unknown.
C) the sampling that is being used is not a statistical sample.
D) the confidence level is low.
A major issue facing many states is whether to legalize casino gambling. Suppose the
governor of one state believes that more than 55% of the state’s registered voters would
favor some form of legal casino gambling. However, before backing a proposal to allow
such gambling, the governor has instructed his aides to conduct a statistical test on the
issue. To do this, the aides have hired a consulting firm to survey a simple random
sample of 300 voters in the state. Of these 300 voters, 175 actually favored legalized
gambling.
State the appropriate null and alternative hypotheses.
A) H0 : p = 0.58 Ha: p ≠ 0.58
B) H0 : p ≤ 0.55 Ha: p > 0.55
C) H0 : p = 0.55 Ha: p ≠ 0.55
D) H0 : p ≤ 0.58 Ha : p > 0.58

General Electric Corporation tracks employee turnover annually. It currently has a data
set that contains turnover for the past 20 years. What type of data does it have?
A) Time-series data
B) Cross-sectional data
C) Nominal data
D) Ordinal data
Interaction exists in a multiple regression model when:
A) one independent variable affects the relationship between another independent
variable and the dependent variable.
B) multicollinearity is present in a regression model.
C) the regression model is overall insignificant.
D) a polynomial model used.
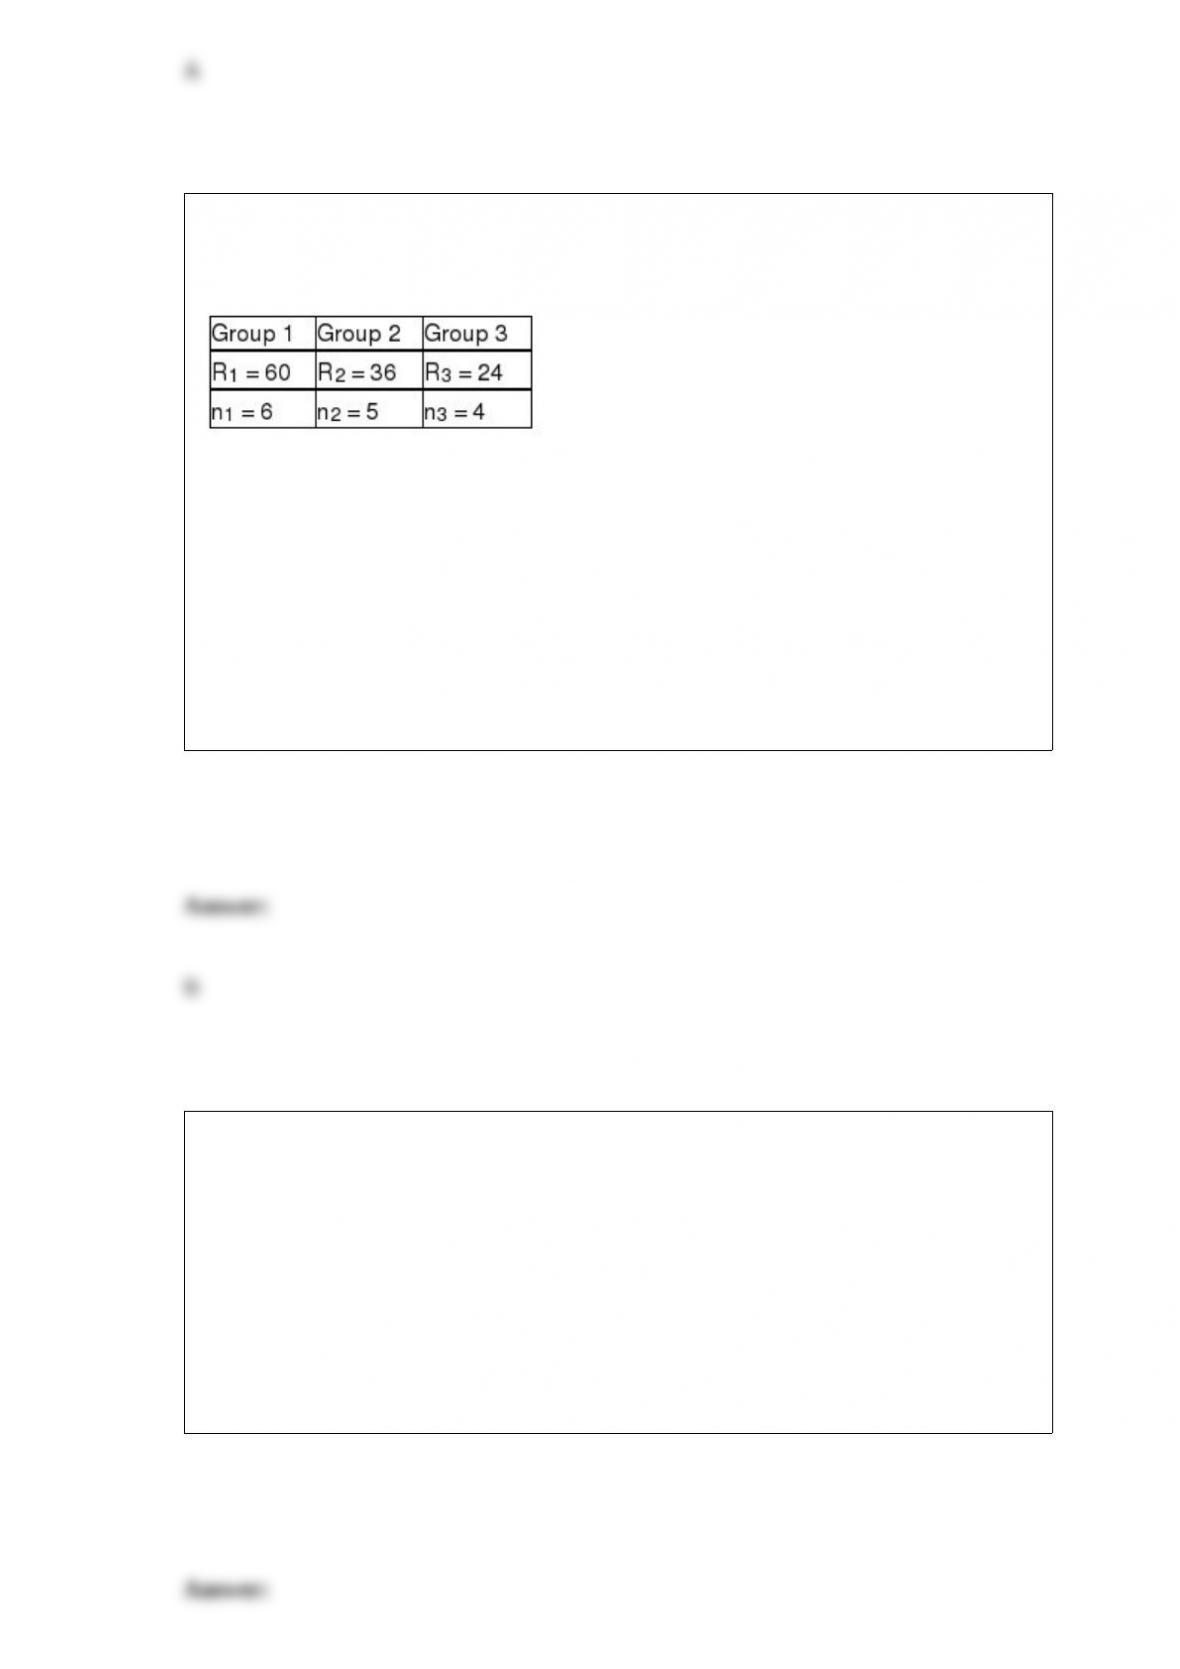
Assume that a Kruskal-Wallis test is being conducted to determine whether or not the
medians of three populations are equal. The sum of rankings and the sample size for
each group are below.
What is the value of the test statistic?
A) 7.8147
B) 2.16
C) 48.68
D) 12.59
If a binomial distribution applies with a sample size of n = 20, find the standard
deviation, n = 20, p = 0.20.
A) 1.7889
B) 2.1889
C) 2.7889
D) 3.1221