
Autocorrelation in a regression forecasting model can be detected by the Ftest.
Both the Poisson and the binomial distributions are discrete distributions and both have
a given number of trials.
The area of the rectangle depicting a uniform distribution is always equal to the mean of
the distribution.
A risk-taker decision maker will bail out of risky scenario only if the compensation to
bail out is more than the expected monetary payoff from the risky scenario.

Data points that lie apart from the rest of the points are called deviants. .
Computations of the variance and standard deviation using grouped data are potentially
only approximation of the actual variance and standard deviation.
The average of the squared deviations about the arithmetic mean is called the variance.

Two general types of control charts are (1) control charts for manufactured items and
(2) control charts for services.
Stepwise regression is one of the ways to prevent the problem of multicollinearity.
The standard error of the estimate, denoted se, is the square root of the sum of the
squares of the vertical distances between the actual Y values and the predicted values of
Y.
The variance of a discrete distribution increases if we add a positive constant to each
one of its value.

In testing a hypothesis about a population variance, the chi-square test is fairly robust to
the assumption the population is normally distributed.
An event that cannot be broken down into other events is called a certainty outcome.
To compare the means of two populations which cannot be assumed to be normally
distributed and only ordinal-level data is available from two independent samples,
instead of the t-test for independent samples we should use the Mann-Whitney Utest.

A population list, map, directory, or other source used to represent the population from
which a sample is taken is called a frame.
The height of the rectangle depicting a uniform distribution is the probability of each
outcome and it same for all of the possible outcomes
Sampling errors cannot by determined objectively for nonrandom sampling techniques.
A scatter diagram is a graphical mechanism for examining the relationship between two
variables.
Measurements occur when a standard process is used to assign numbers to attributes or
characteristics of a variable.
If a 90% confidence interval for the difference in the two population means contains
zero, then the null hypothesis of zero difference between the two population means
cannot be rejected at a 0.10 level of significance.
The standard normal distribution is also called a finite distribution because its mean is
zero and standard deviation one, always.
In a binomial distribution, p, the probability of getting a successful outcome on any
single trial, increases proportionately with every success.
For the Poisson distribution the mean and the variance are the same.
In a multiple regression analysis with N observations and k independent variables, the
degrees of freedom for the residual error is given by (N “ k).

The decision rule in a chi-square goodness-of-fit test is to reject the null hypothesis if
the computed chi-square is greater than the table chi-square.
A normal distribution with a mean of zero and a standard deviation of 1 is called a null
distribution.
To determine whether the overall regression model is significant, the F-test is used.
The amount of time a patient waits in a doctor’s office is an example of a continuous
random variable
A linear regression model can be used to explore the possibility that a quadratic
relationship may exist between two variables by suitably transforming the independent
variable.
When a researcher fails to reject a false null hypothesis, a Type II error has been
committed.
When a trucking firm uses the number of shipments for January of the previous year as
the forecast for January next year, it is using a nave forecasting model.
In experimental design, classification variables are independent variables.
To determine if there is a difference in the speed of a wireless router from two different
manufacturers a network manager will draw independent samples of wireless routers
from the two manufacturers and compare the difference in the sample means for the
connection speed.
In a chi-square goodness-of-fit test, actual frequencies are also called calculated
frequencies.
A c chart used for statistical quality control is a chart that shows the count of defects in
the process output.
In a decision analysis problem, variables (such as general macroeconomic conditions)
which are not under the decision maker’s control are called prior probabilities.
If two events are mutually exclusive, then the two events are also independent.

The sampling distribution of R, the number of runs, in the one-sample runs test for
randomness of the observations in a large sample (i.e., the number of observations with
each of two possible characteristics is greater than 20) is approximately normal if H0is
true.
Aluminum castings are processed in lots of five each. A sample of two castings is
randomly selected from each lot for inspection. A particular lot contains one defective
casting; and x is the number of defective castings in the sample. P(x=1) is _______.
a) 0.2
b) 0.4
c) 0.6
d) 0.8
e) 1.0
On discovering an improperly adjusted drill press, Jack Joyner, Director of Quality
Control, ordered an inspection of every fifth casting drilled during the evening shift.
Less than 1% of the castings were defective; so, Jack released the evening shift’s
production to assembly. This is an example of _______________.
a) nonparametric statistics

b) nominal data
c) descriptive statistics
d) inferential statistics
e) judgmental statistics
Nominal and ordinal data are sometimes referred to as quantitative data.
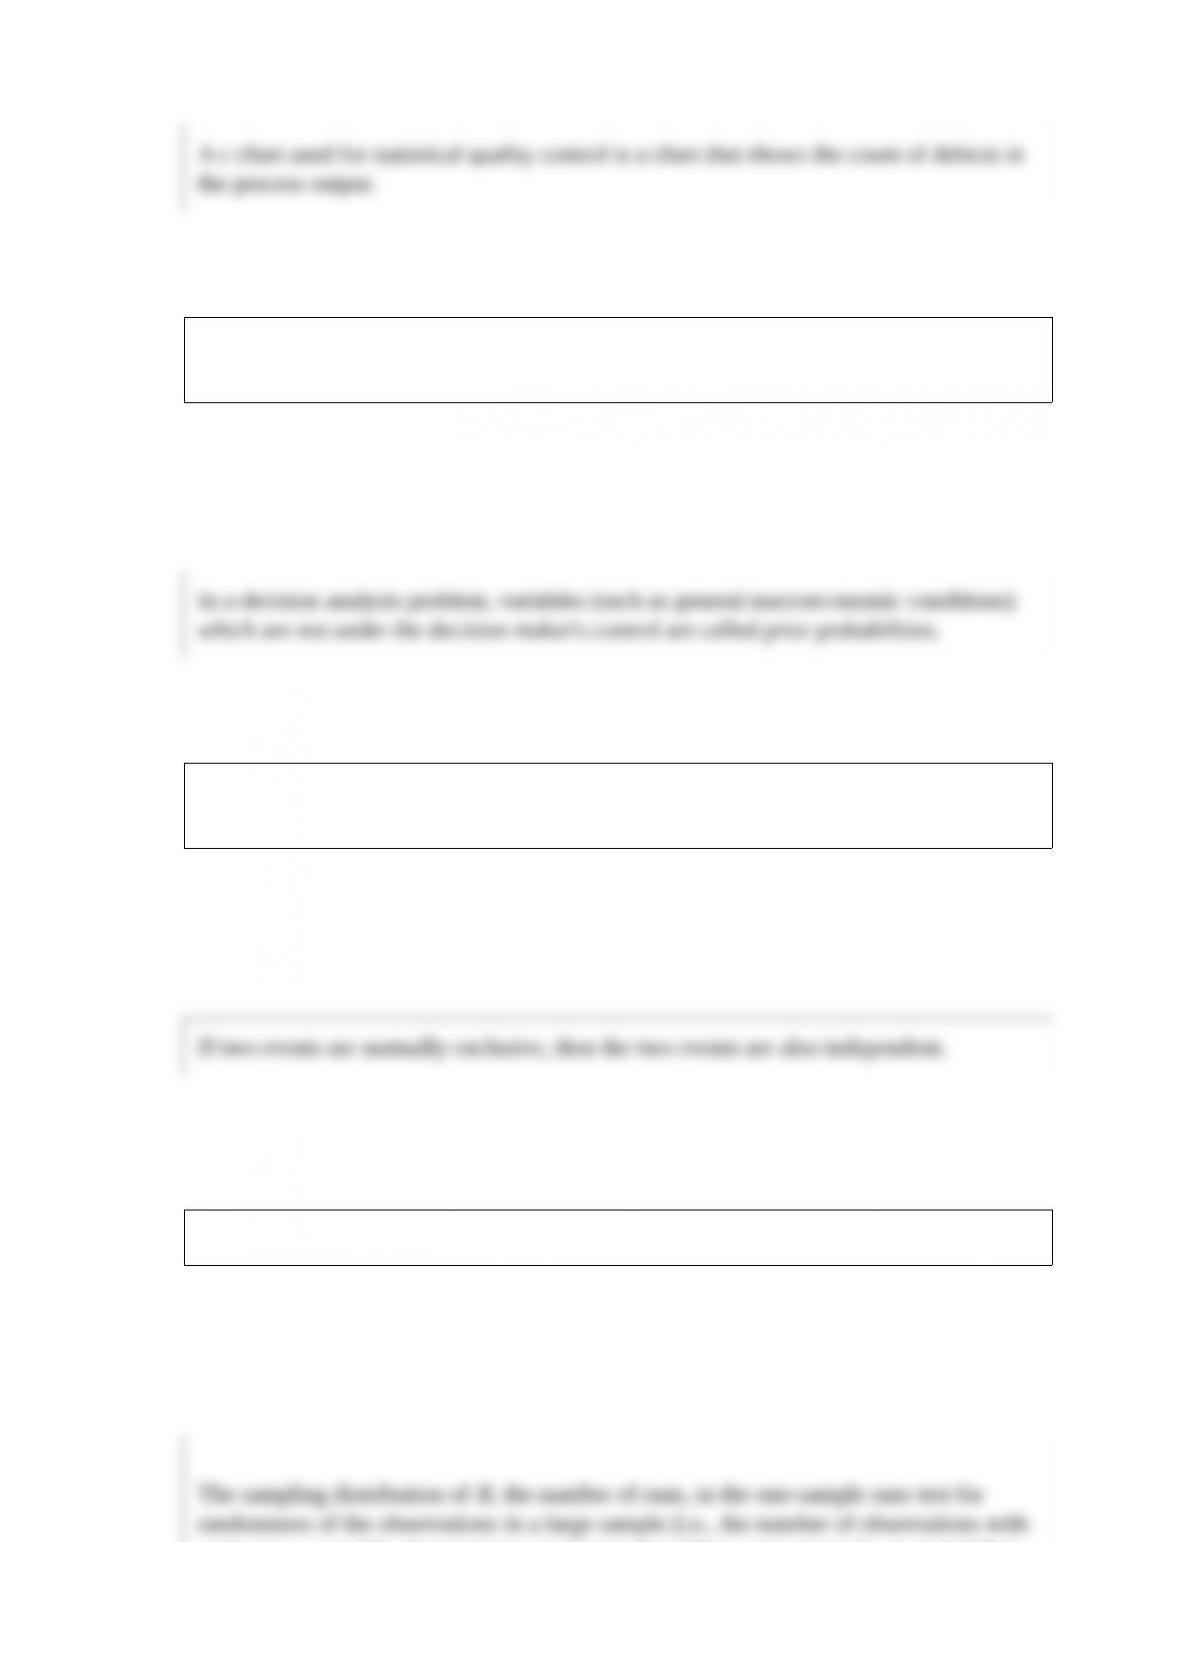
Consider the following decision table with rewards in $ millions.
Using the maximax criterion, the appropriate choice would be __________.
a) d1
b) d2
c) d3
d) d4
e) d5
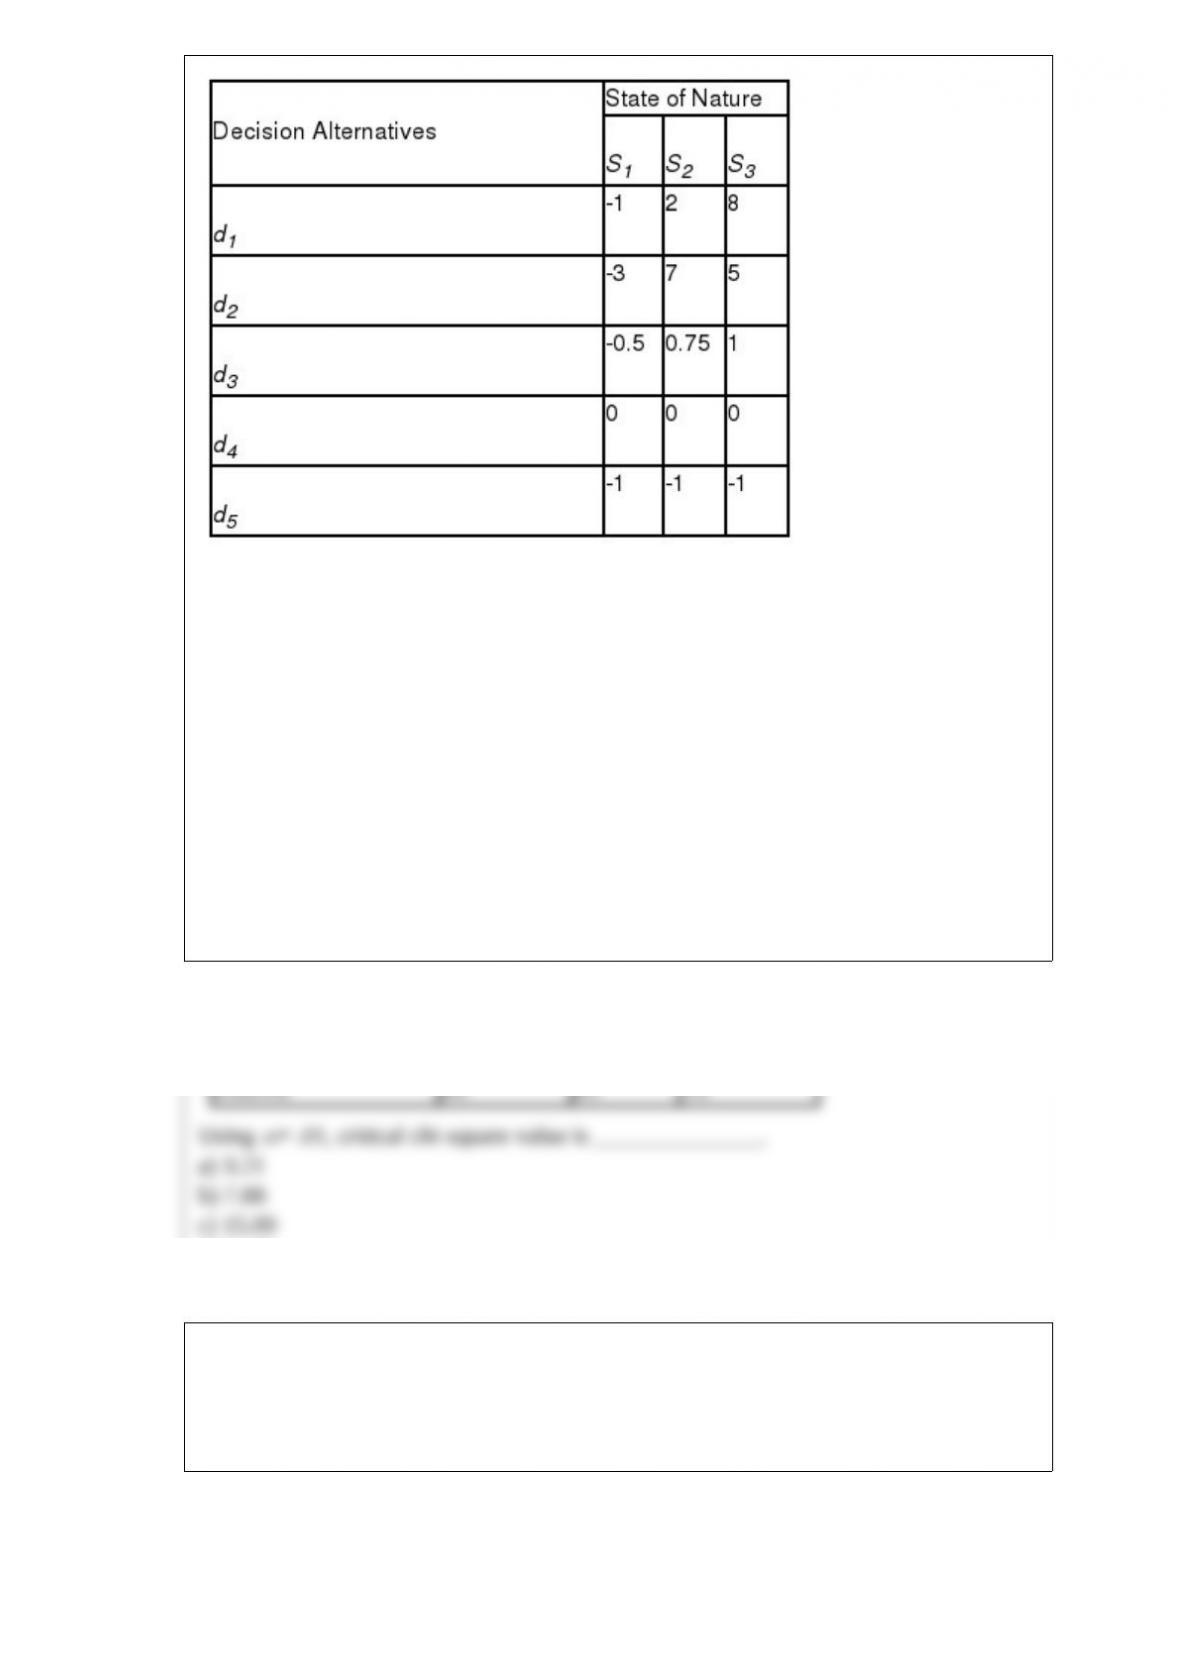
Anita Cruz recently assumed responsibility for a large investment portfolio. She
wonders whether industry sector influences investment objective. Her staff prepared the
following contingency table from a random sample of 200 common stocks.
Using
= .01, critical chi-square value is ______________.
a) 9.21
b) 7.88
c) 15.09
d) 16.81
e) 18.81
If x, the time (in minutes) to complete an change job at certain auto service station, is
uniformly distributed over the interval 20 to 30, inclusively (20 x 30), then the
probability that an oil change job is completed in less than 17 minutes, i.e., P(x< 17) is
__________________.
a) 0.500
b) 0.300
c) 0.000
d) 0.250
e) 1.000
A cost accountant is developing a regression model to predict the total cost of
producing a batch of printed circuit boards as a linear function of batch size (the
number of boards produced in one lot or batch). The slope of the accountant’s model is

______.
a) batch size
b) unit variable cost
c) fixed cost
d) total cost
e) total variable cost
During a recent sporting event, a quarter is tossed to determine which team picks the
starting side. Suppose the referee says the coin will be tossed 3 times and the best two
out of three wins If team A calls “heads’, what is the probability that exactly two heads
are observed in three tosses?
a) .313
b) .375
c) .625
d) .875
e) .500
A multiple regression analysis produced the following tables.
Using
= 0.05 to test the null hypothesis H0:
1=
2= 0, the critical F value is ____.
a) 4.24
b) 3.39
c) 5.57
d) 3.35
e) 2.35
A researcher is testing a hypothesis of a single mean. The critical zvalue for
= .05 and a two”tailed test is +1.96. The observed zvalue from sample data is “1.85.
The decision made by the researcher based on this information is to _____ the null
hypothesis.
a) reject
b) fail to reject
c) redefine
d) change the alternate hypothesis into
e) restate the null hypothesis
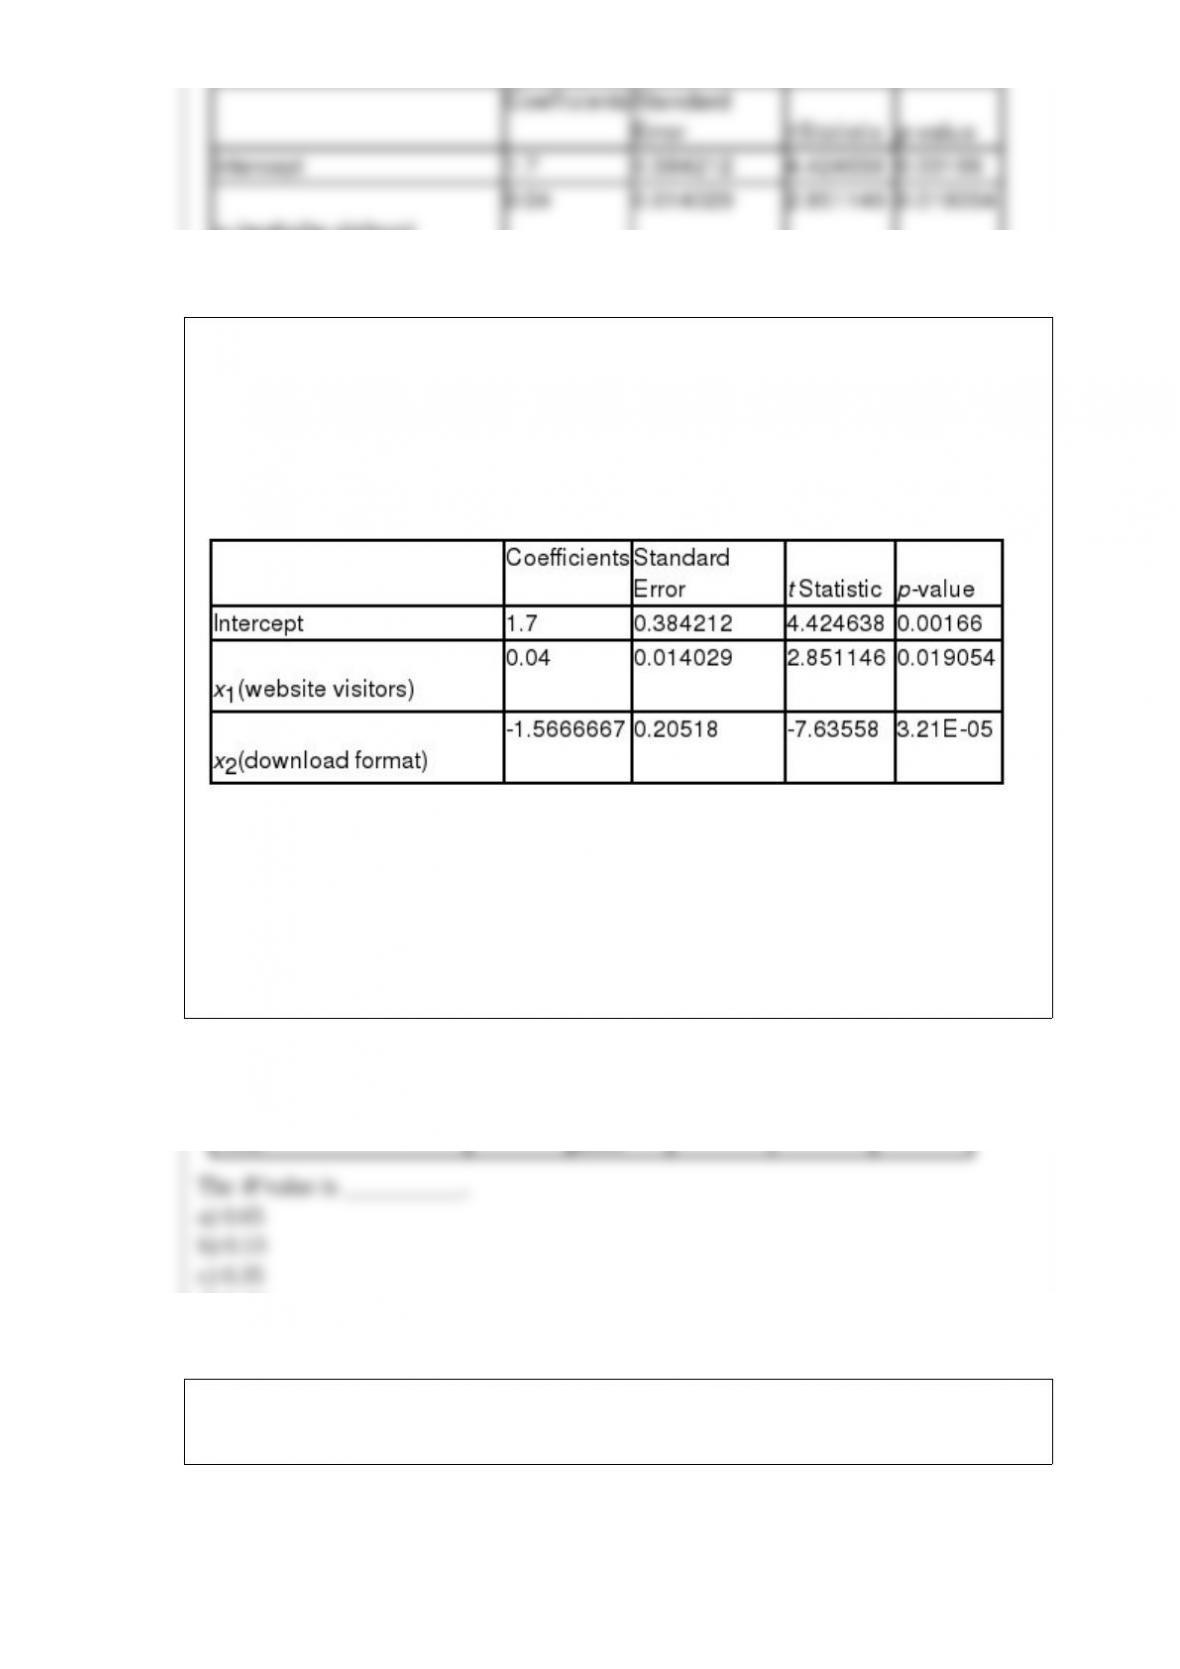
Alan Bissell, a market analyst for City Sound Online Mart, is analyzing sales from
heavy metal song downloads. Alan’s dependent variable is annual heavy metal song
download sales (in $1,000,000’s), and his independent variables are website visitors (in
1,000’s) and type of download format requested (0 = MP3, 1 = other). Regression
analysis of the data yielded the following tables.
For an MP3 sales with 10,000 website visitors, Alan’s model predicts annual sales of
heavy metal dong downloads of ________________.
a) $2,100,000
b) $524,507
c) $533,333
d) $729,683
e) $21,000,000
The following ANOVA table is from a multiple regression analysis.
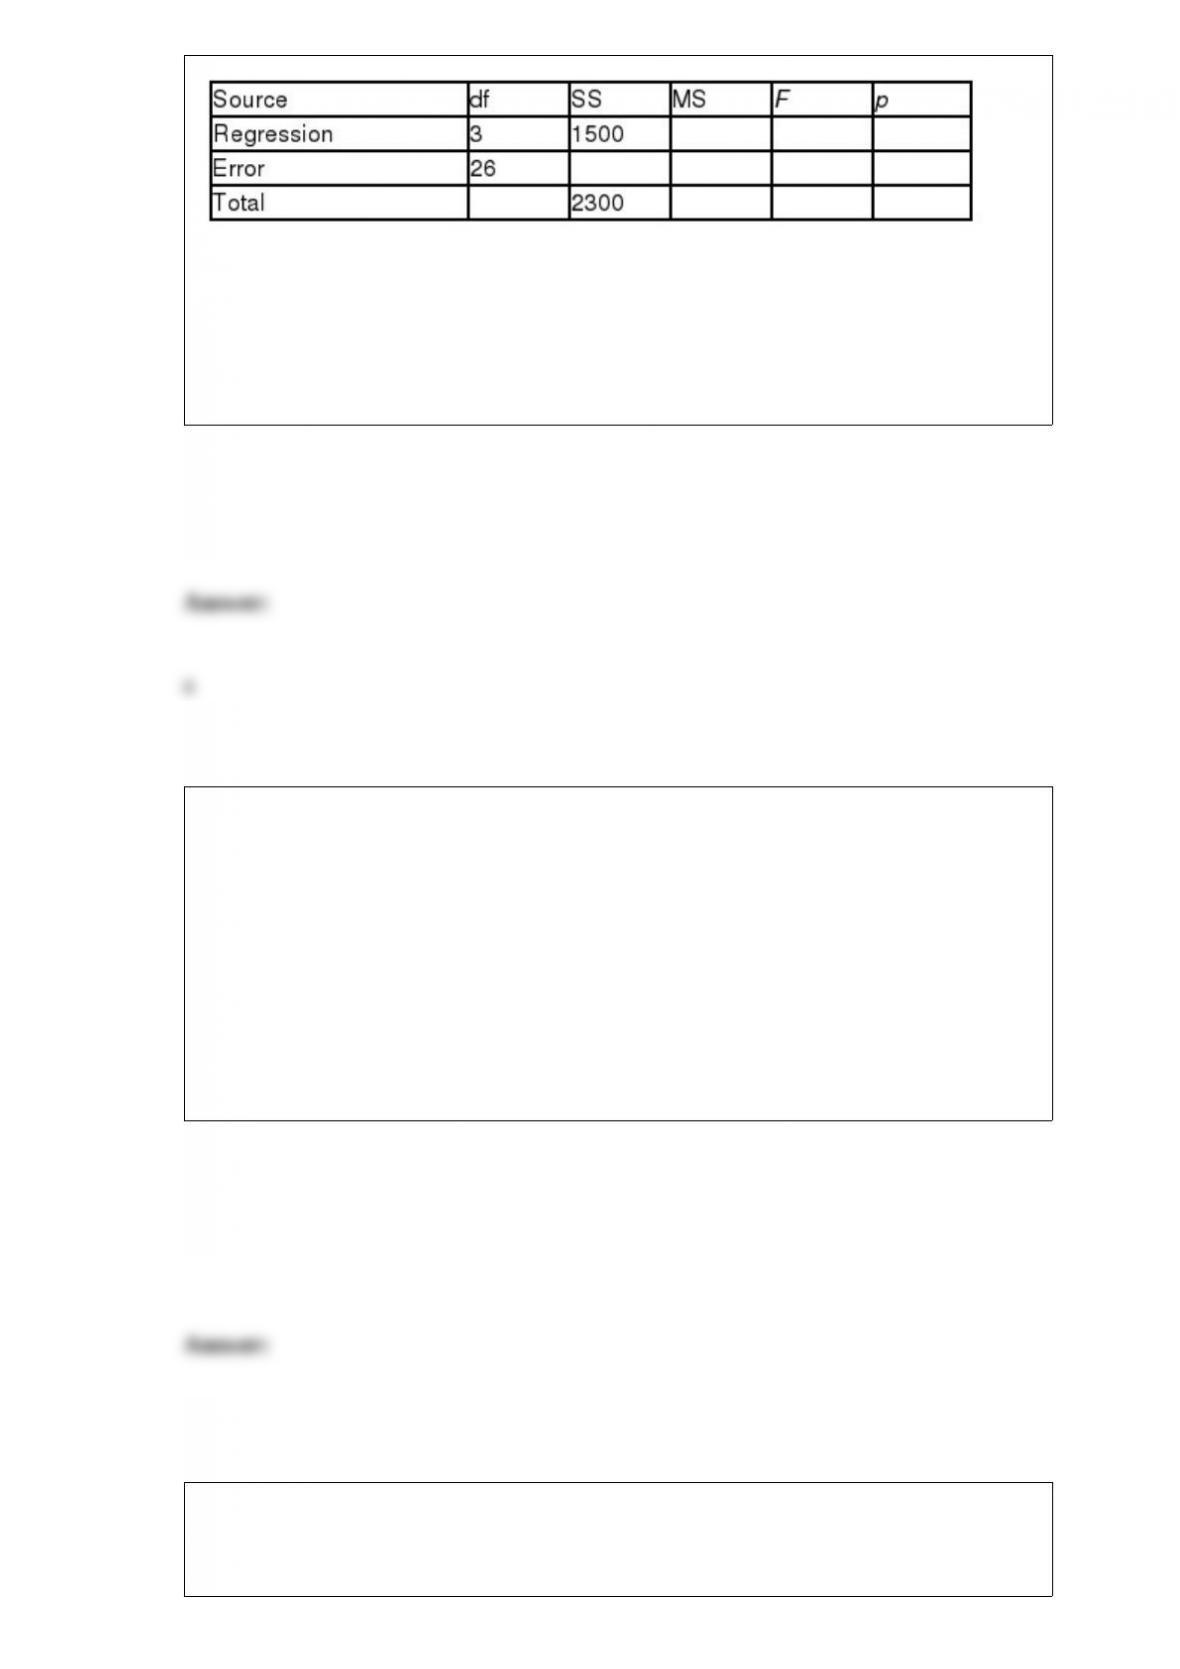
The R2value is __________.
a) 0.65
b) 0.53
c) 0.35
d) 0.43
e) 1.37
Suppose you are testing the null hypothesis that a population mean is less than or equal
to 46, against the alternative hypothesis that the population mean is greater than 46. The
sample size is 25 and alpha =.05. If the sample mean is 50 and the population standard
deviation is 8, the observed zvalue is _______.
a) 2.5
b) -2.5
c) 6.25
d) -6.25
e) 12.5
In performing hypothesis tests about the population mean, if the population standard
deviation is not known, a ttest can be used to test the mean if _________________.

a) n is small
b) the sample is random
c) the population mean is known
d) the population is normally distributed
e) the population is chi-square distributed
A commuter travels many miles to work each morning. She has timed this trip 5 times
during the last month. The time (in minutes) required to make this trip was 38, 33, 36,
47, and 41. What is the variance for this sample data?
a) 28.5
b) 11
c) 22.8
d) 5.34
e) 4.77
Elwin Osbourne, CIO at GFS, Inc., is studying employee use of GFS e-mail for
non-business communications. A random sample of 200 e-mail messages was selected.
Thirty of the messages were not business related. The point estimate for this population

proportion is _______.
a) 0.150
b) 0.300
c) 0.182
d) 0.667
e) 0.786
Contingency tables should not be used with expected cell frequencies _______.
a) less than the number of rows
b) less than the number of columns
c) less than 5
d) less than 30
e) less than 50
Which of the following operations is meaningful for processing nominal data?
a) Addition
b) Multiplication
c) Ranking
d) Counting
e) Division
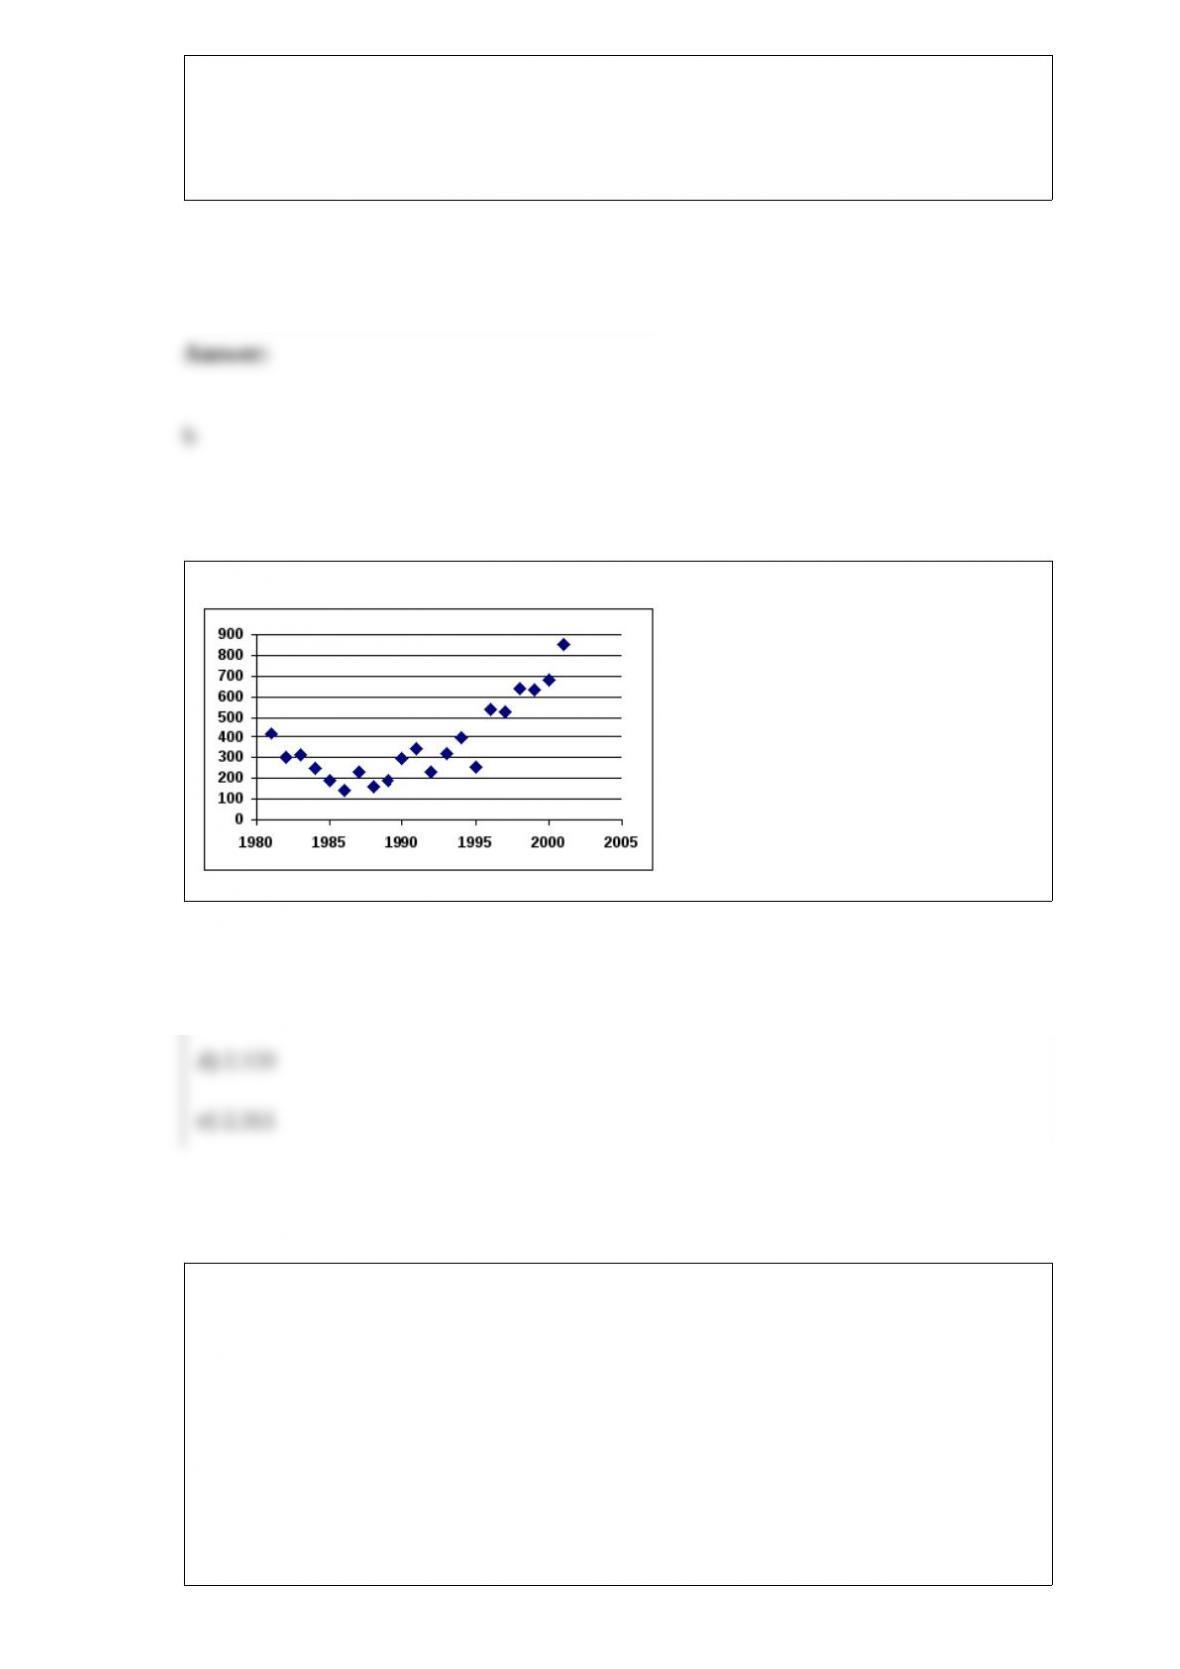
The following graph of time-series data suggests a _______________ trend.
a) linear
b) quadratic
c) cosine
d) tangential
e) flat
The local oil changing business is very busy on Saturday mornings and is considering
expanding. A national study of similar businesses reported the mean number of
customers waiting to have their oil changed on Saturday morning is 3.6. Suppose the
local oil changing business owner, wants to perform a hypothesis test. The null
hypothesis is the population mean is 3.6 and the alternative hypothesis that the
population mean is not equal to 3.6. The owner takes a random sample of 16 Saturday
mornings during the past year and determines the sample mean is 4.2 and the sample
standard deviation is 1.4. It can be assumed that the population is normally distributed
and the level of significance is 0.05. The table “t” value for this problem is _______.
a) 1.753
b) 2.947
c) 2.120
d) 2.131
e) 2.311
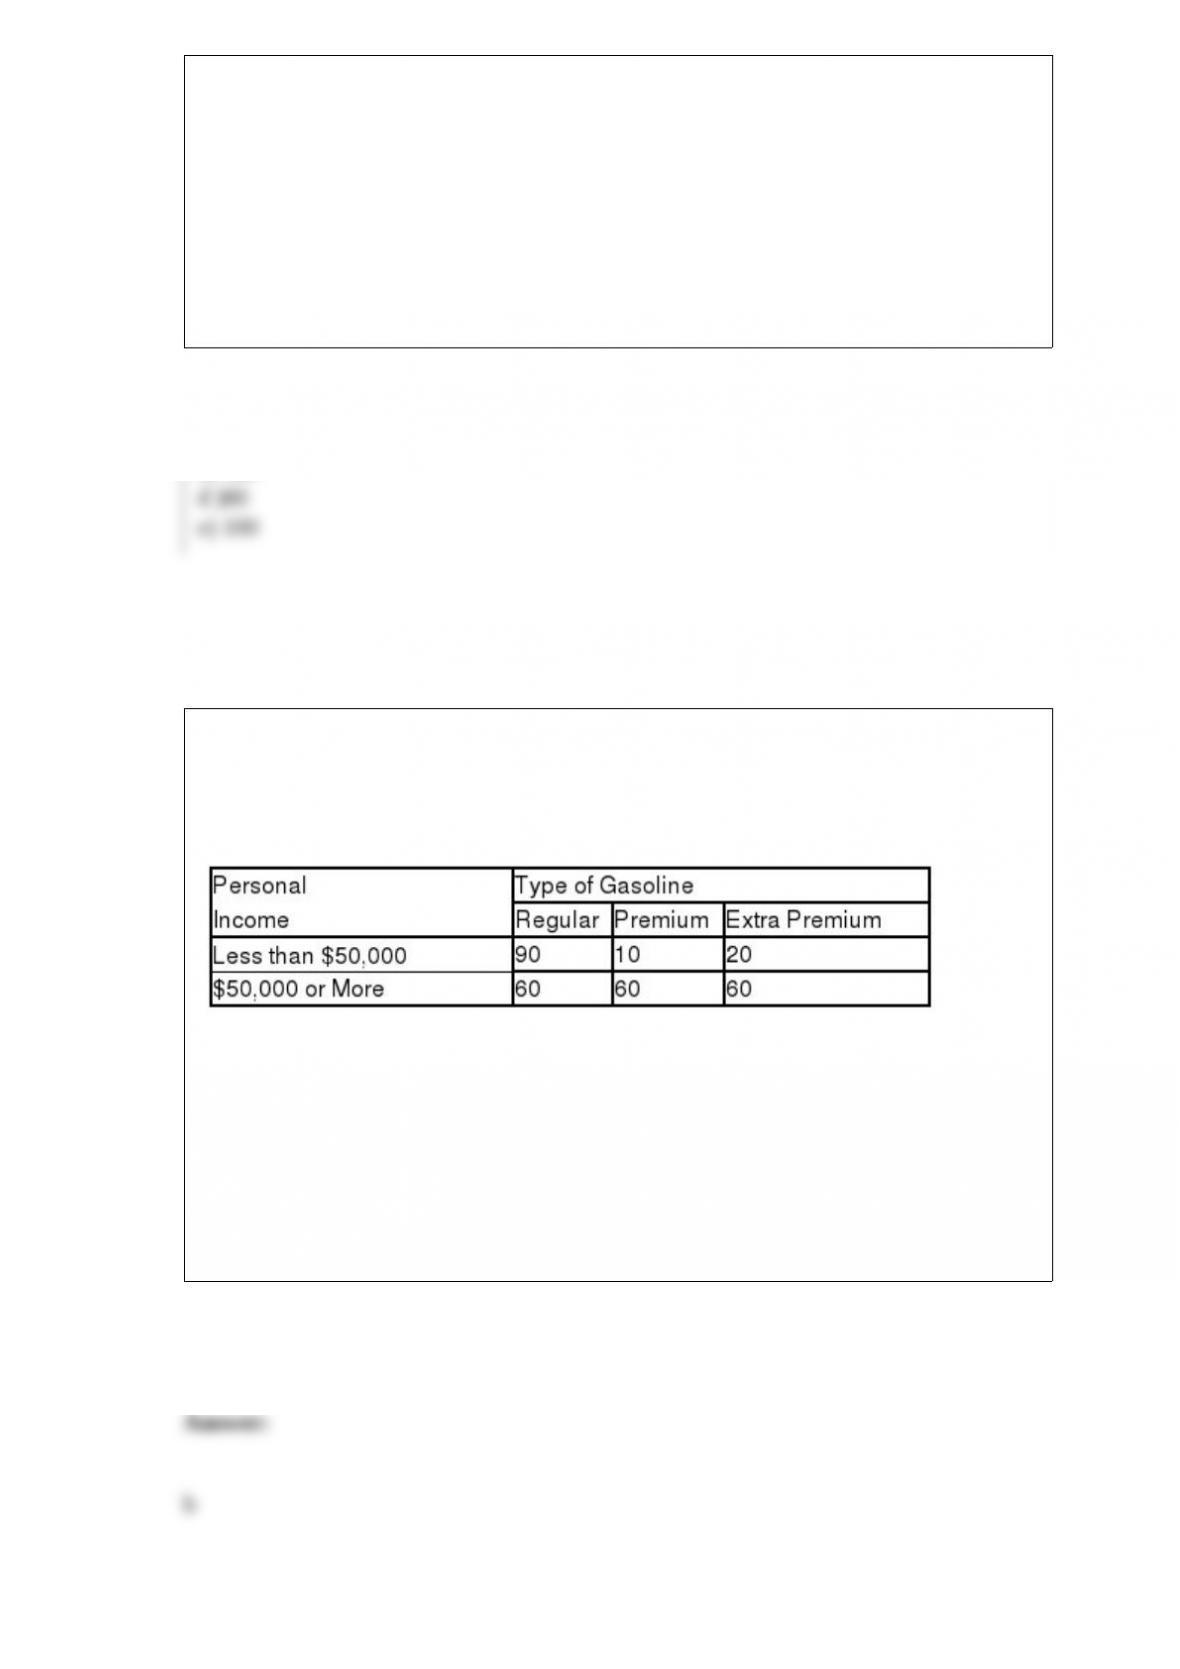
A gasoline distributor wonders whether an individual’s income level influences the
grade of gasoline purchased. The following is a contingency table from a random
sample of 300 individuals.
The estimate of the expected number of individuals with income less than $30,000 who
purchase regular gasoline when income and type of gasoline are independent is
_______.
a) 60
b) 90
c) 120
d )80
e) 100
Using data from a group to generalize to a larger group involves the use of _______.
a) descriptive statistics
b) inferential statistics
c) population derivation
d) sample persuasion
e) relative level data
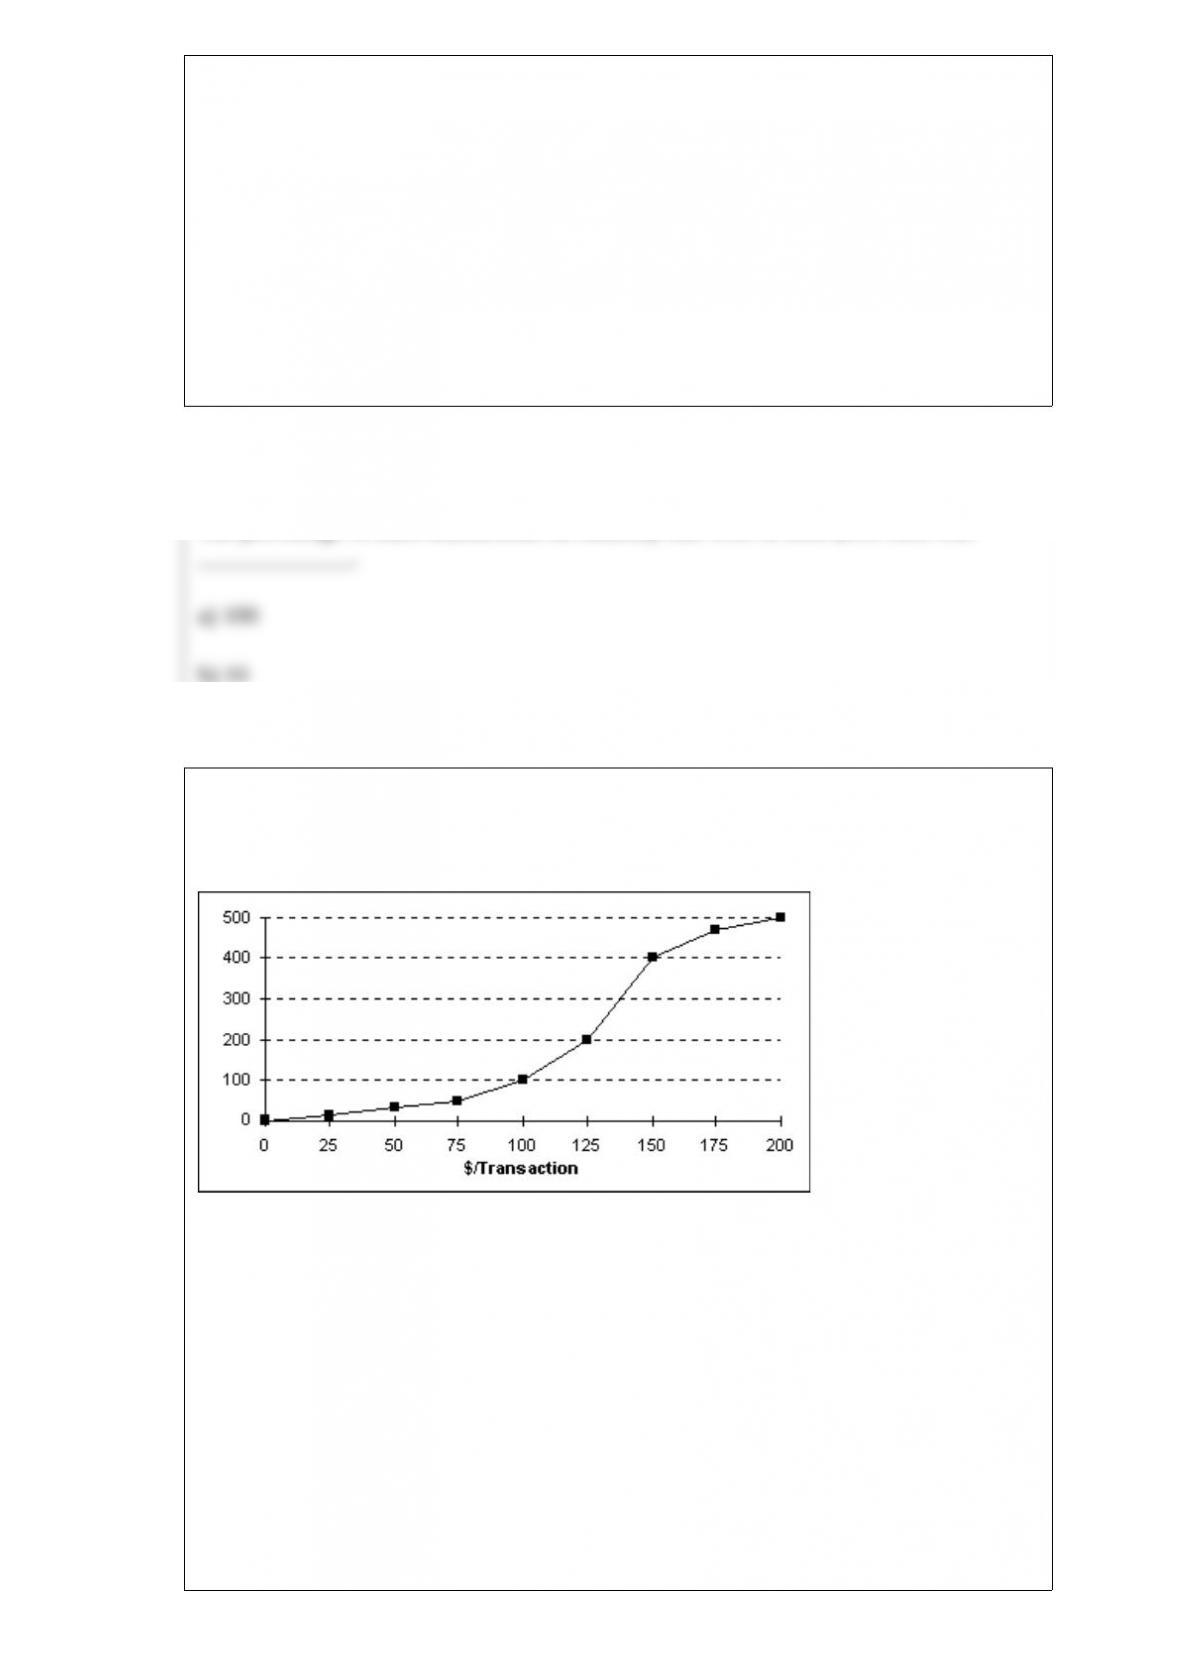
Each day, the office staff at Oasis Quick Shop prepares a frequency distribution and an
ogive of sales transactions by dollar value of the transactions. Saturday’s cumulative
frequency ogive follows.
The percentage of sales transactions on Saturday that were at least $100 each was
_____________.
a) 100
b) 10
c) 80
d) 20
e) 15
A market analyst is developing a regression model to predict monthly household
expenditures on groceries as a function of family size, household income, and
household neighborhood (urban, suburban, and rural). The response variable in this
model is _____.
a) family size
b) expenditures on groceries
c) household income
d) suburban
e) household neighborhood
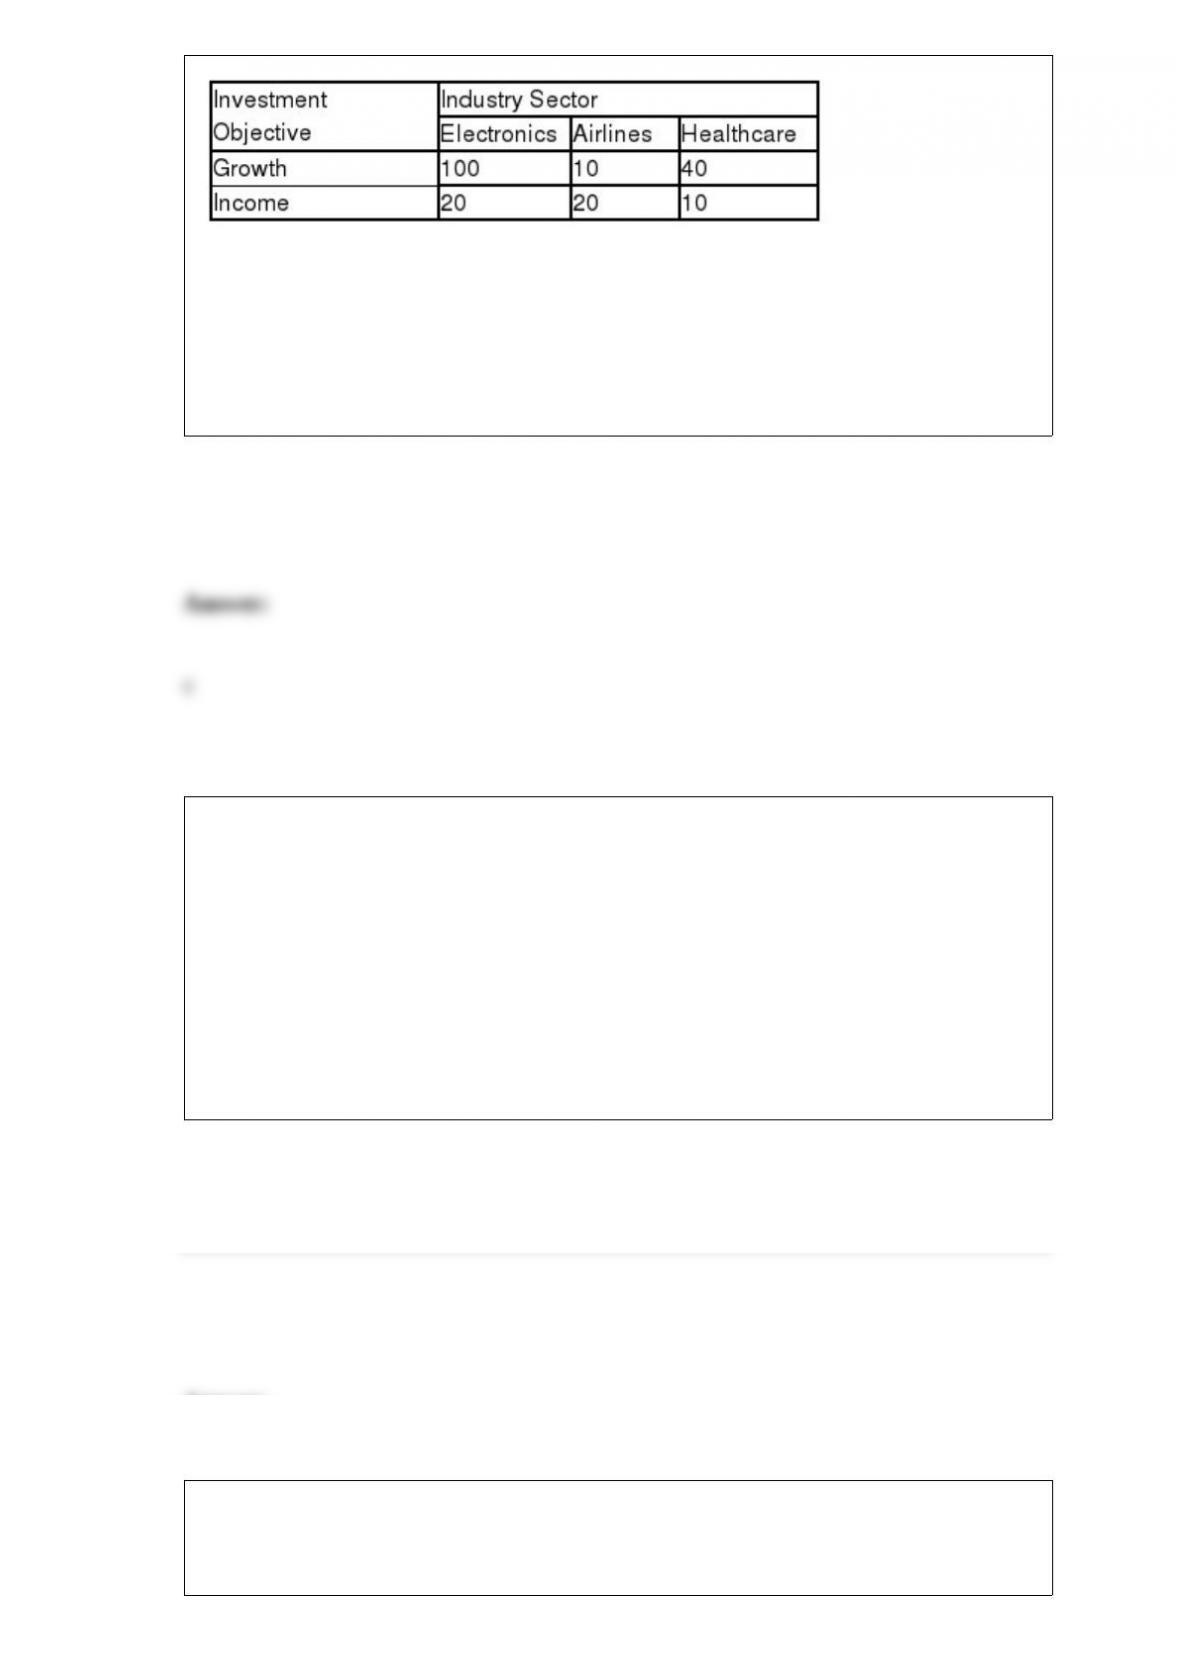
A multiple regression analysis produced the following tables.
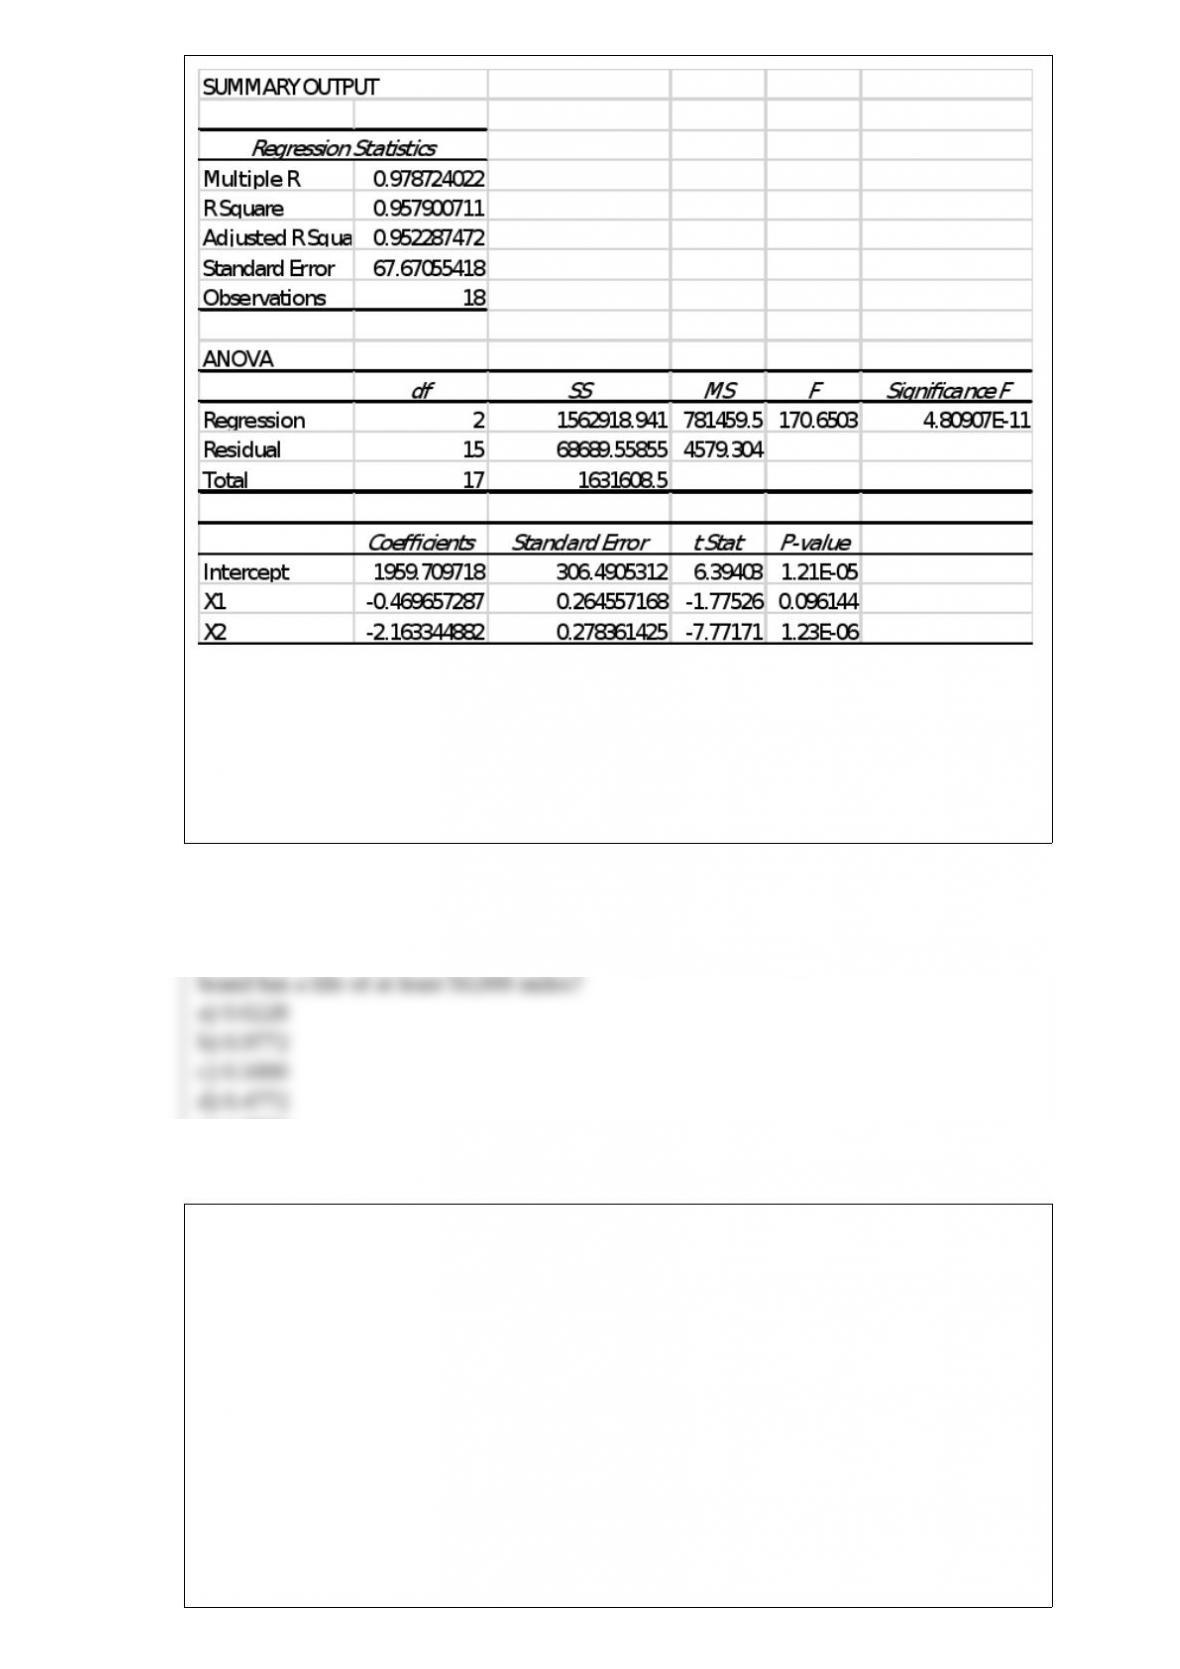
For x1= 360 and x2= 220, the predicted value of y is ____________.
a) 1314.70
b) 1959.71
c) 1077.58
d) 2635.19
e) 2265.57
Suppose a research uses the Mann-Whitney test to determine if there is a difference in
the volume of text messages sent by a high school student living in a rural area versus
an urban area during the month of December. Eight rural high school students and 9
urban high school students were included in the study. If, among all 17, the U statistic is
29, n1=8 and n2= 9 what is the the conclusion at =0.05 is __________α
a) reject the hypothesis that the number of text messages sent in December is identical
b) do not reject the hypothesis that the number of text messages sent in December is
identical.
c) reject the hypothesis that the average number of text messages is identical.
d) do not reject the hypothesis that the average number of text messages is identical.

e) accept the hypothesis that the number of text messages sent in December identical.
Sure Stone Tire Company has established that the useful life of a particular brand of its
automobile tires is normally distributed with a mean of 40,000 miles and a standard
deviation of 5000 miles. What is the probability that a randomly selected tire of this
brand has a life of at least 50,000 miles?
a) 0.0228
b) 0.9772
c) 0.5000
d) 0.4772
e) 1.0000
Many “Before and after” types of experiments should be analyzed using _______.
a) chi-square goodness of fit test
b) Kruskal-Wallis test
c) Mann-Whitney U test
d) Wilcoxon test
e) Friedman test

A person has decided to code a particular set of sales data. A value of 0 is assigned if
the sales occurred on a weekday, and a value of 1 means it happened on a weekend.
This is an example of _______.
a) interval level data
b) ordinal level data
c) nominal level data
d) ratio level data
e) relative level data
The executives of CareFree Insurance, Inc. feel that “a majority of our employees
perceive a participatory management style at CareFree.” A random sample of 200
CareFree employees is selected to test this hypothesis at the 0.05 level of significance.
Eighty employees rate the management as participatory. The appropriate decision is
__________.
a) fail to reject the null hypothesis
b) reject the null hypothesis
c) reduce the sample size
d) increase the sample size
e) do nothing

Cindy Ho, VP of Finance at Discrete Components, Inc. (DCI), theorizes that the
discount level offered to credit customers affects the average collection period on credit
sales. Accordingly, she has designed an experiment to test her theory using four sales
discount rates (0%, 2%, 4%, and 6%). First, she classified DCI’s credit customers into
three categories by total assets (small, medium, and large). Then, she randomly
assigned four customers from each category to a sales discount rate. Cindy’s null
hypothesis is ________.
a)
1
2
3
4
b)
1
2
3
4
c)
d)
1
2
3
4
e)
1
2≥
3
4