
1) Income mobility:
A.contributes to greater wealth inequality in the United States.
B.is less in the United States than in most developing nations.
C.is the movement of individuals and households from one income quintile to another
over time.
D.makes lifetime income inequality among income receivers in the United States
greater than income inequality in any single year.
2) In the taste-for-discrimination model:
A.discriminatory employers behave as if employing nonpreferred-race workers adds to
costs.
B.individual workers are judged by the characteristics of the groups to which they
belong.
C.prejudiced white employers will never hire African-American workers.
D.women and minorities are confined to a limited number of occupations.
3)
Refer to the above graph. If the firm is producing at Q1, the area 0BEQ1 represents:
A.Total costs
B.Total variable costs
C.Total fixed costs
D.Average variable costs
4) If Z is an inferior good, an increase in money income will shift the:
A.supply curve for Z to the left.
B.supply curve for Z to the right.
C.demand curve for Z to the left.
D.demand curve for Z to the right.
5) At its profit-maximizing output, a pure nondiscriminating monopolist achieves:

A.neither productive efficiency nor allocative efficiency.
B.both productive efficiency and allocative efficiency.
C.productive efficiency but not allocative efficiency.
D.allocative efficiency but not productive efficiency.
6) The strength of the demand for a resource depends on the following factors, except:
A.Supply of the resource
B.Productivity of the resource
C.Price of the product the resource helps to produce
D.Demand for the product the resource helps to produce
7) The table shows the total costs for a purely competitive firm.
Refer to the above table. If the product sells for $1,200 a unit, the firm’s
profit-maximizing output is:
A.2
B.3
C.4
D.5
8)
Refer to the diagram. Arrows (1) and (2) represent:
A.goods and resources respectively.
B.money incomes and output respectively.
C.output and money incomes respectively.
D.resources and goods respectively.

9)
The production possibilities curves suggest that:
A.West Mudville should specialize in, and export, baseball bats.
B.West Mudville should specialize in, and export, both baseballs and baseball bats.
C.East Mudville should specialize in, and export, baseball bats.
D.workers will try to immigrate from West Mudville to East Mudville.
10) If the price elasticity of demand for a product is unity, a decrease in price will:
A.have no effect upon the amount purchased.
B.increase the quantity demanded and increase total revenue.
C.increase the quantity demanded but decrease total revenue.
D.increase the quantity demanded, but total revenue will be unchanged.
11) What are the results from the establishment of the European Union?
12) How does the market for insurance promote economy growth and investment?
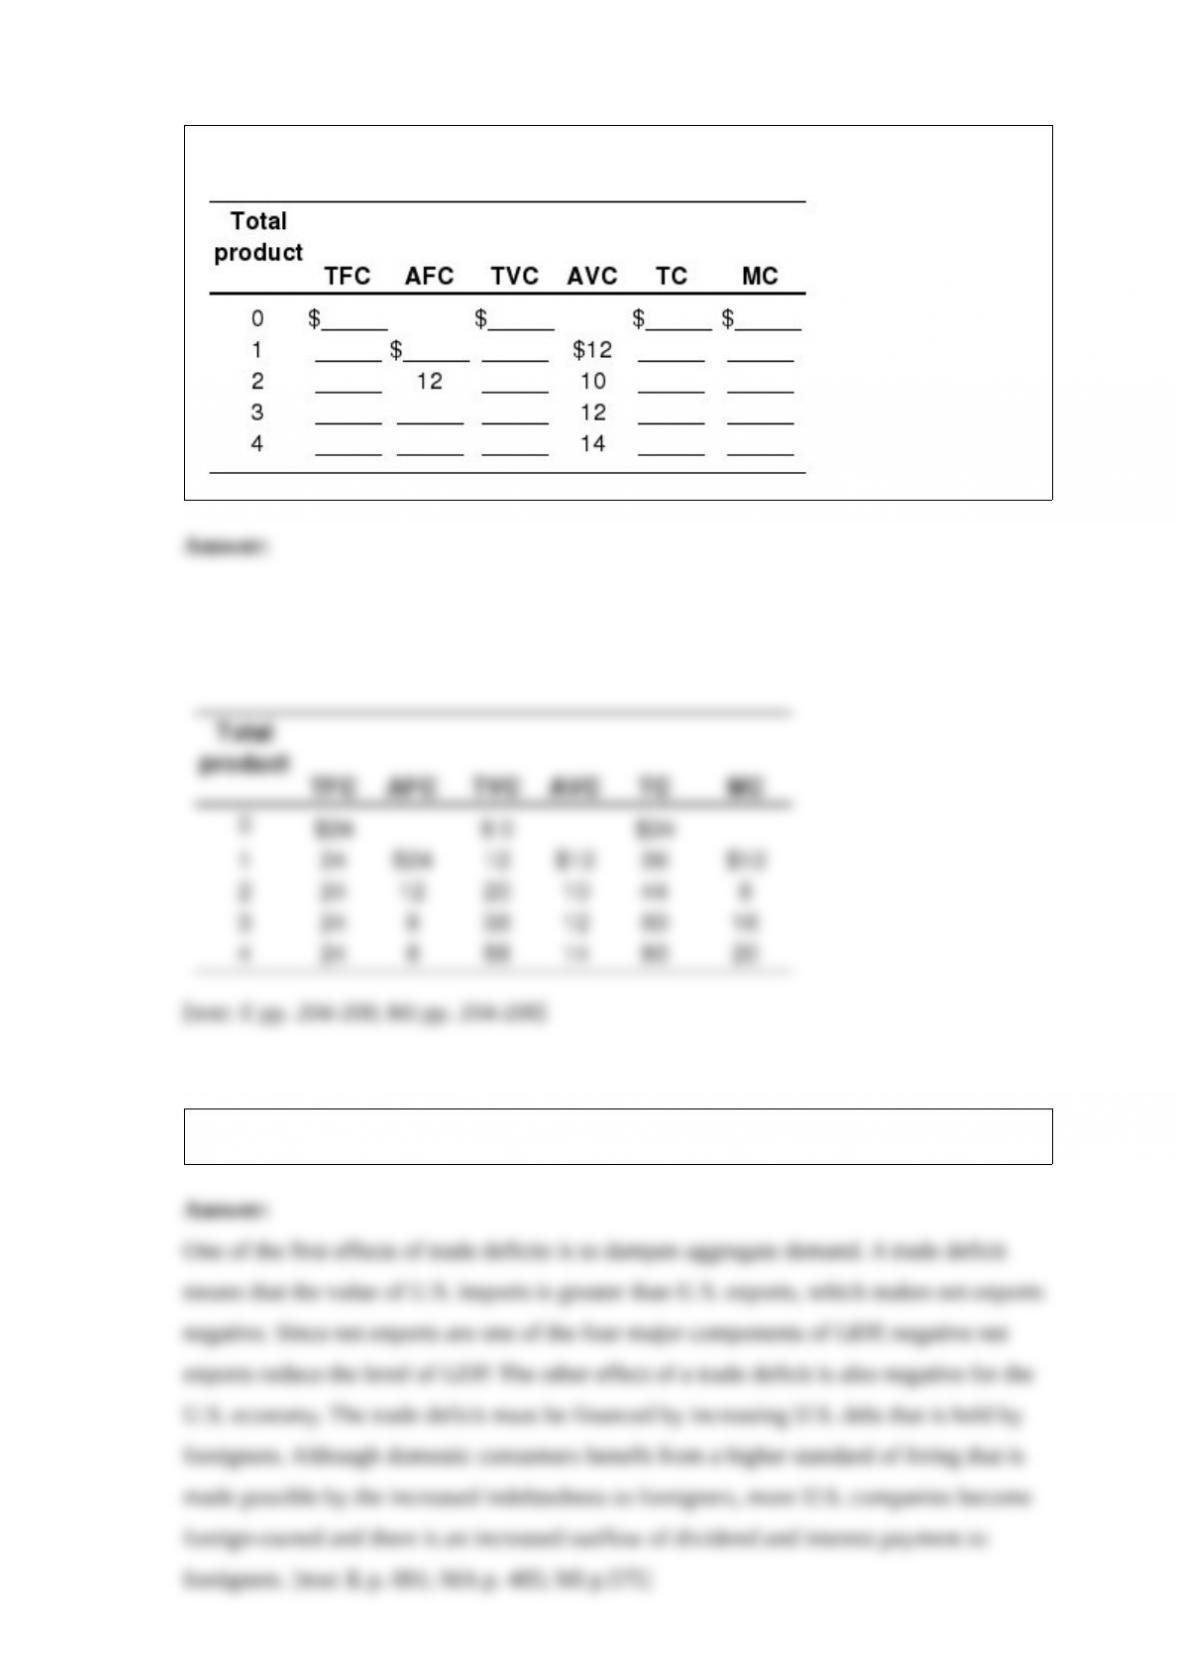
13) Complete the following short-run cost table using the information provided.
14) What effects do U.S. trade deficits have on the U.S. economy?
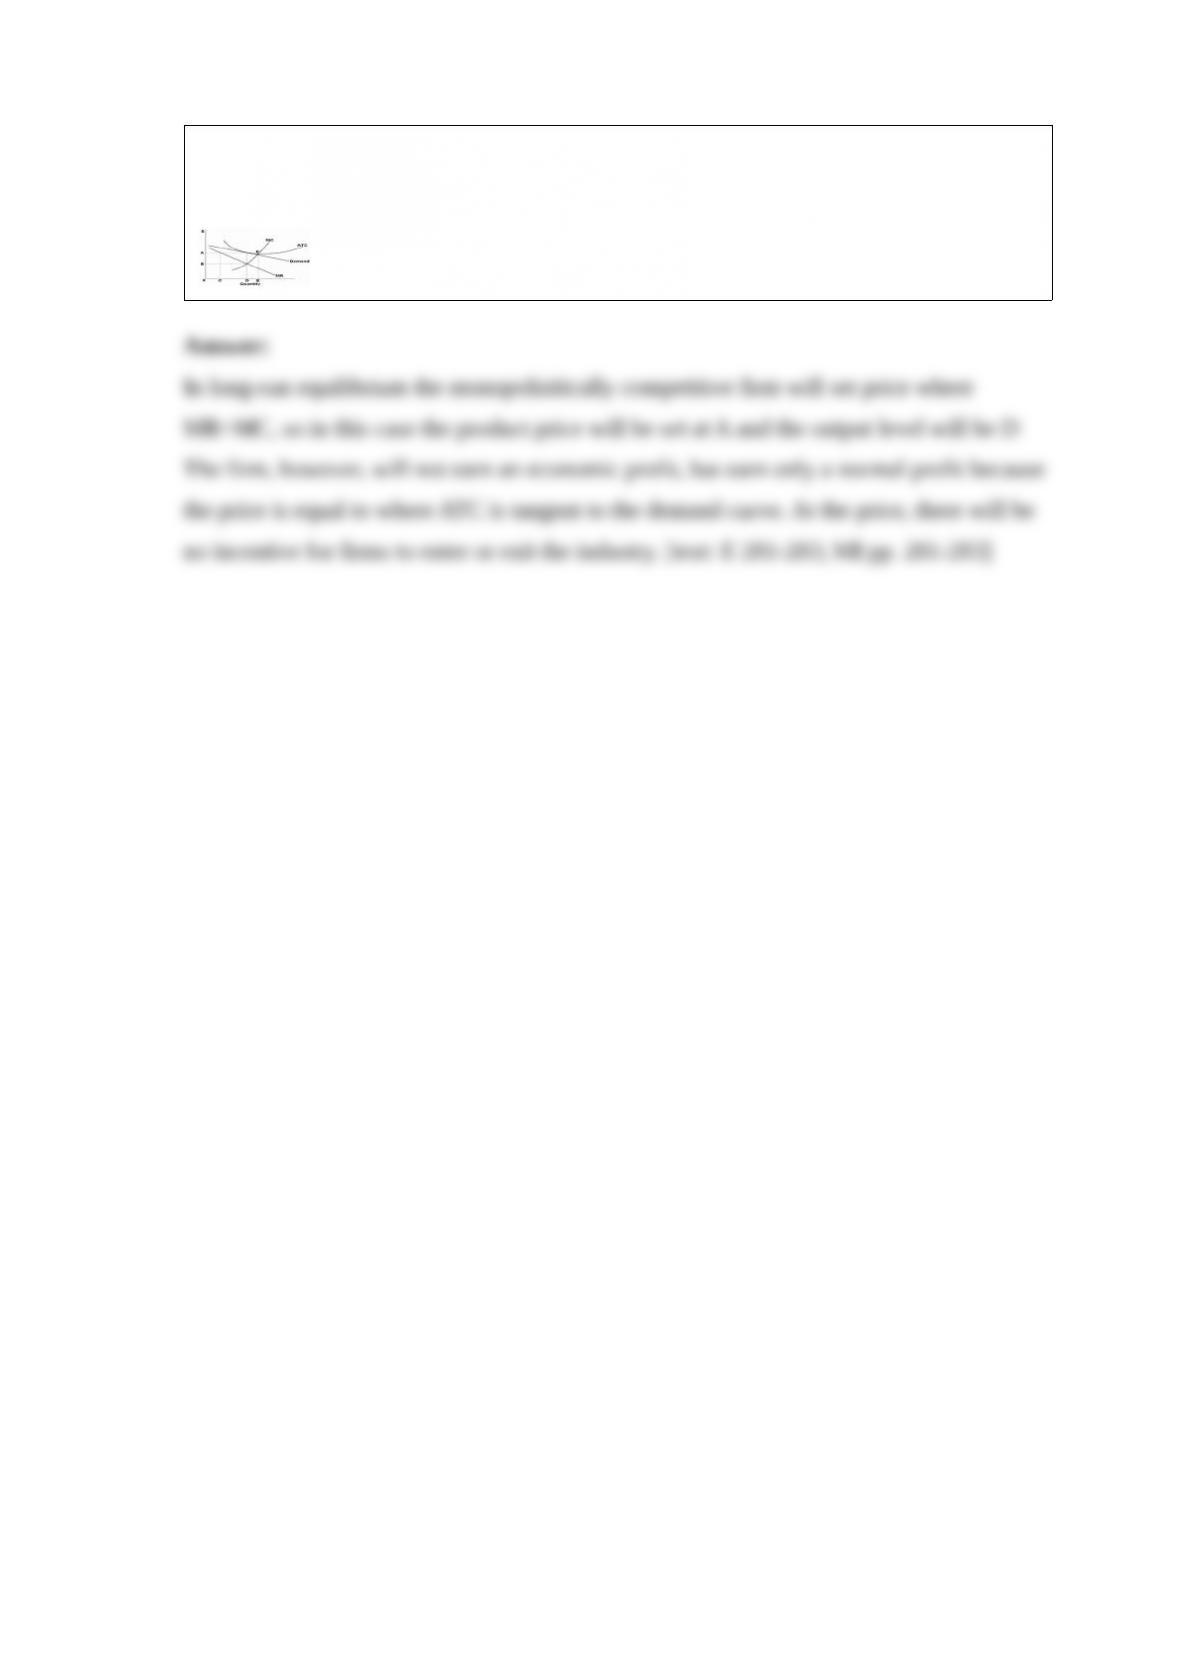
15) Explain why the following graph is likely to represent the long-run equilibrium for
a representative firm in monopolistic competition. What will be the product price,
output, and amount of economic profit?