Reducing α without increasing the sample size will cause β to increase.
The hypergeometric distribution is used when samples are taken from an infinite
population with replacement.
As long as the main factor is statistically significant with randomized block ANOVA,
there is no concern about the significance of the blocking factor.
The five-number summary consists of a distribution’s minimum value, the values for the
first, second, and third quartiles, and maximum value.
If the test statistic for the Kruskal-Wallis test is greater than the critical value for the
Kruskal-Wallis test, the null hypothesis is rejected.
The test statistic for the Kruskal-Wallis test follows the Student’s t-distribution with
degrees of freedom.
When conducting a hypothesis test comparing two populations with independent
samples, each observation from one sample is related to an observation from the other
sample.
The standard error of the mean is the sample mean standard deviation, which measures
the variation around the mean of the sample means.
Using n ” 1 in the denominator for the sample variance is a much better estimate of the
true population variance when compared to dividing by n.
As the sample size decreases, the standard error of the proportion will also decrease.
A single die is rolled many times and the side that faces up is recorded. Eventually, we
expect the number of times that we observe a 1, 2, 3, 4, 5, and 6 to be relatively close to
one another. This expectation is due to the law of large numbers.

The critical sample mean(s) is(are) the sample mean(s) that mark(s) the boundary of the
rejection region.
The sampling distribution of the proportion describes the pattern that sample
proportions tend to take on when randomly drawn from a population.
Bias can occur in a survey when a question is stated in a way that encourages or leads a
respondent to a particular answer.
The sample covariance measures the direction of the linear relationship between two
variables.
Any normally distributed values can be standardized with z-scores.
Two events are considered independentof one another if the occurrence of one event has
no impact on the occurrence of the other event occurring.
The standard error of the difference between two means describes the variation in the
difference between two sample means.

In quality control settings, businesses prefer a larger standard deviation, which is an
indication of more consistency in the process.
The Wilcoxon rank-sum test requires the data be at least at the ordinal level of
measurement and that the shapes of the distributions for the two populations are similar.
The null hypothesis for ANOVA assumes that not all of the population means being
compared are equal.
If the absolute difference between two sample means is large enough to be greater than
the Tukey-Kramer critical range, we have enough evidence to conclude that the
population means are different.
One-way ANOVA requires that samples across the levels are equal to one another.
The event “the first two customers in the store today will pay with cash” is an example
of a simple event.
Autocorrelation describes the condition when residuals in a regression model are
independent of one another.

The probability of the union of two events occurring can never be more than the
probability of the intersection of two events occurring.
The sample correlation coefficient measures the strength and direction of the linear
relationship between two variables.
Consider the relationship between the following variables:
∙ Household income
∙ Square footage of the primary residence
Household income would be considered the independent variable.
Decision tables are used to display marginal and joint probabilities from a contingency
table.
The expected value of perfect information (EVPI) represents the expected payoff we
will realize if we have prior knowledge about which state of nature will occur.
There is no guarantee that every confidence interval taken from a population will
include the population mean.
One-way ANOVA is used when we are looking at the influence that one factor has on
the data values.
The rejection region for the chi-square test to compare two or more population
proportions lies on the right tail of the chi-square distribution.
When all of the data values in the sample are the same, the sample standard deviation
equals 1.0.
The hypothesis tests for the correlation coefficient, and the coefficient of determination
will always produce the same conclusions.
If the null hypothesis for the sign test is false, 50% of the population will fall below the
median and 50% will fall above the median.
When two events are independent, the probability of them both occurring is simply the
product of their individual probabilities of occurring.
The point estimate for the population mean will always be found within the limits of the
confidence interval for the mean.
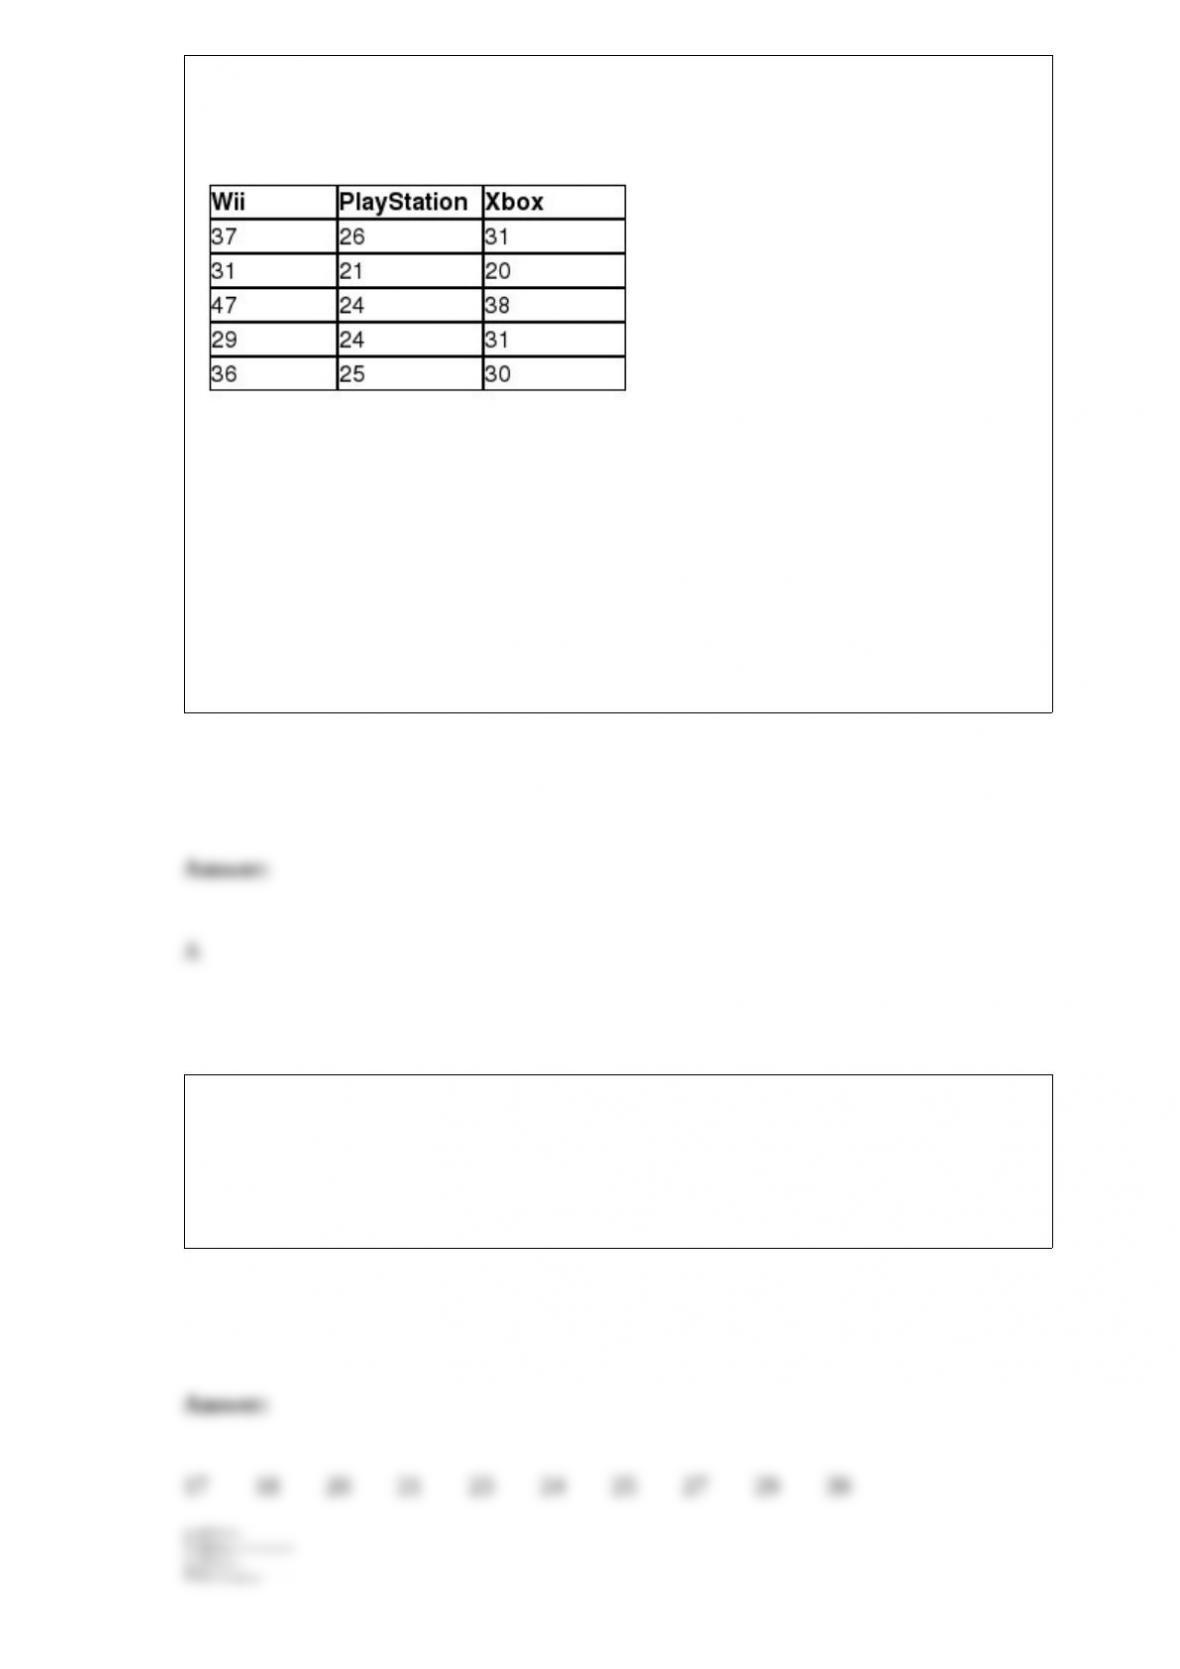
Nintendo Sony would like to test the hypothesis that a difference exists in the average
age of users of a Wii, a PlayStation, or an Xbox console game. The following data
represent the age of a random sample of Wii, PlayStation, and Xbox users.
The sum of squares between for these observations is ________.
A) 360.0
B) 456.8
C) 509.1
D) 575.3
The following data represents the amount of time, in minutes, that a random sample of
Parisians spent eating lunch in a particular caf.
25 21 23 24 20 17 29 18 39 27
Construct a box-and-whisker plot for this data.
YouTube would like to test the hypothesis that the standard deviation for the length of
an online video watched by a user is more than 2 minutes. A random sample of 21
people who watched online videos was selected. The sample standard deviation for the
length of the video was found to be 2.5 minutes. The degrees of freedom for this
hypothesis test would be ________.
A) 18
B) 19
C) 20
D) 21
A ________ component is movement in a time series that results from upward or
downward swings in the U.S. or world economy over a period of several years.
A) cyclical
B) seasonal
C) random
D) trend
A stem and leaf display most resembles a __________.
A) histogram
B) contingency table
C) relative frequency distribution
D) pie chart
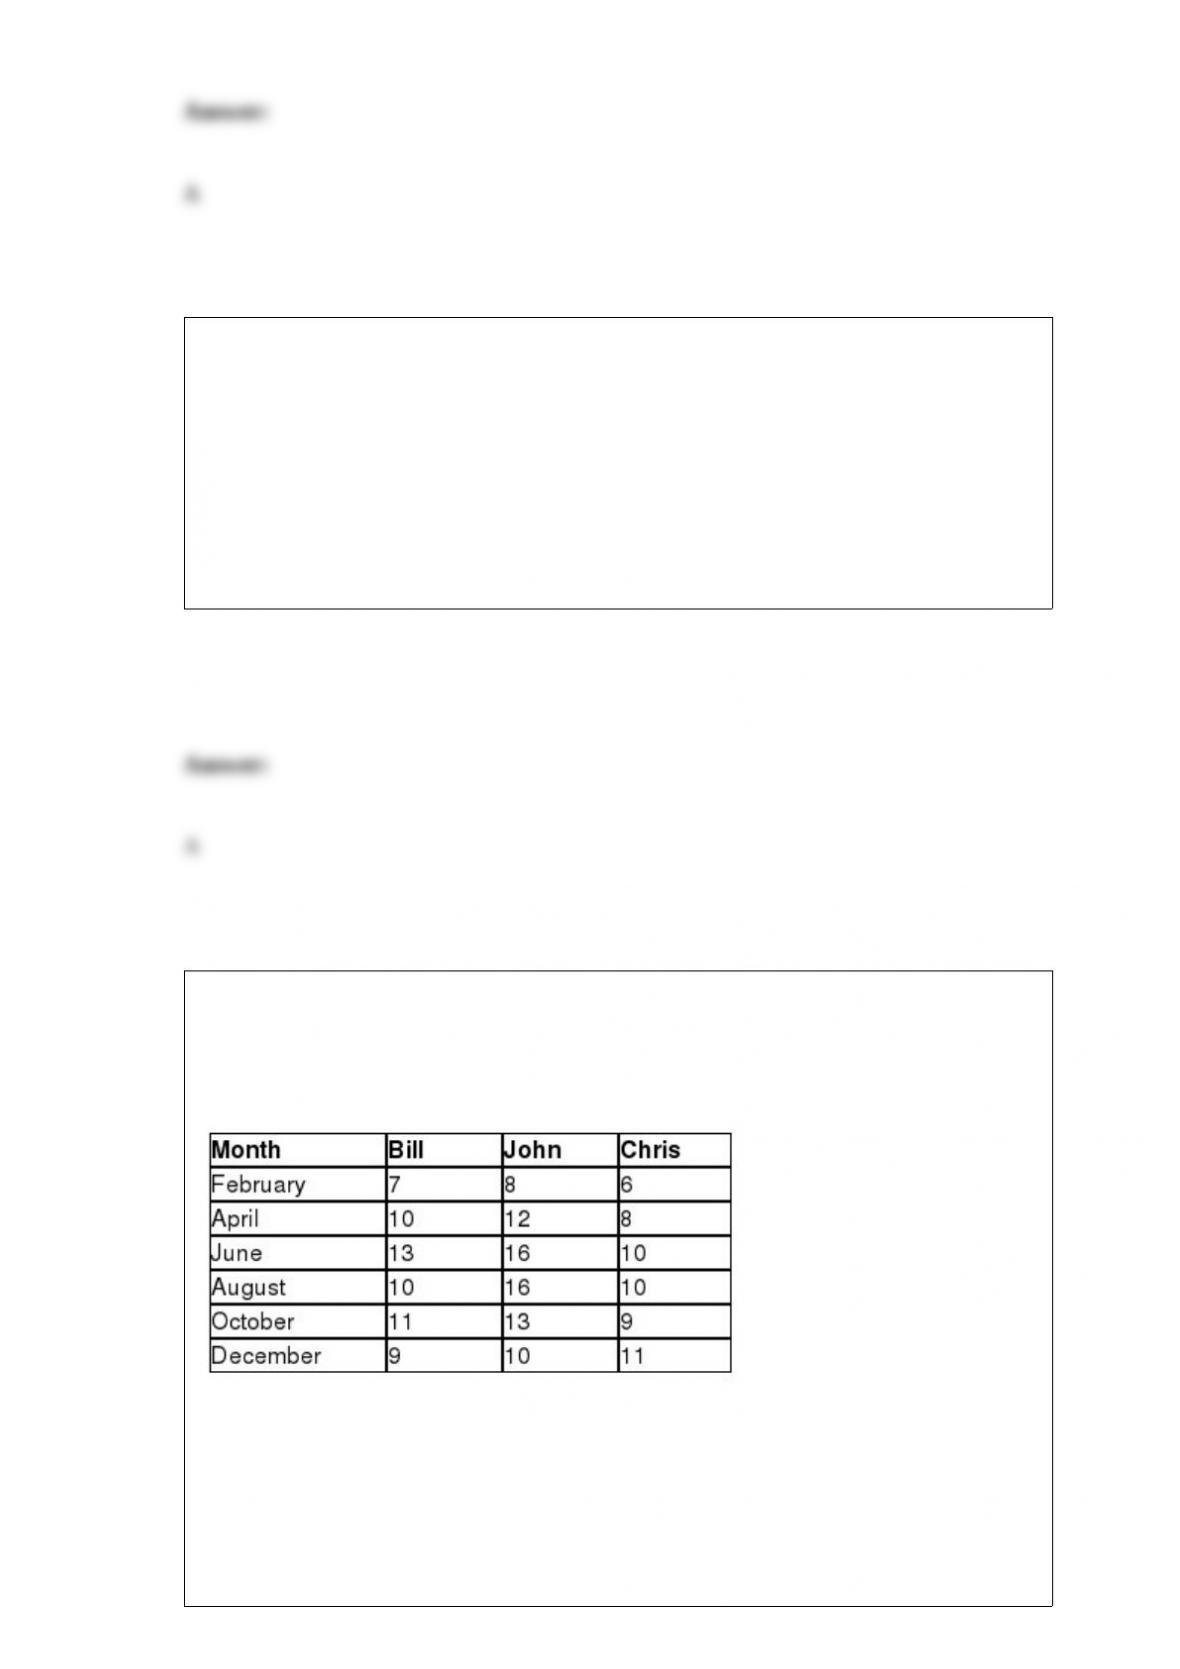
Sheridan Motors is a car dealership that would like to investigate if there is a difference
in the average number of car sales per month between three sales employees using a
randomized block ANOVA. The following data represent the number of car sales last
year for these employees for six different months.
The blocking factor critical value using α = 0.05 for this hypothesis test would be
________.
A) 2.887
B) 3.015

C) 3.326
D) 4.575
A statistics class at Wilmington College has 25 students of which 15 are math majors
and 10 are business majors. The professor randomly selects five students to work
together on a group project. What is the mean of this probability distribution if selecting
a business major is defined as a success?
A) 0.76
B) 1.09
C) 1.69
D) 2.00
The following table represents the number of seconds that a particular web page took to
load on an iPhone for 25 users along with the frequency in each class.
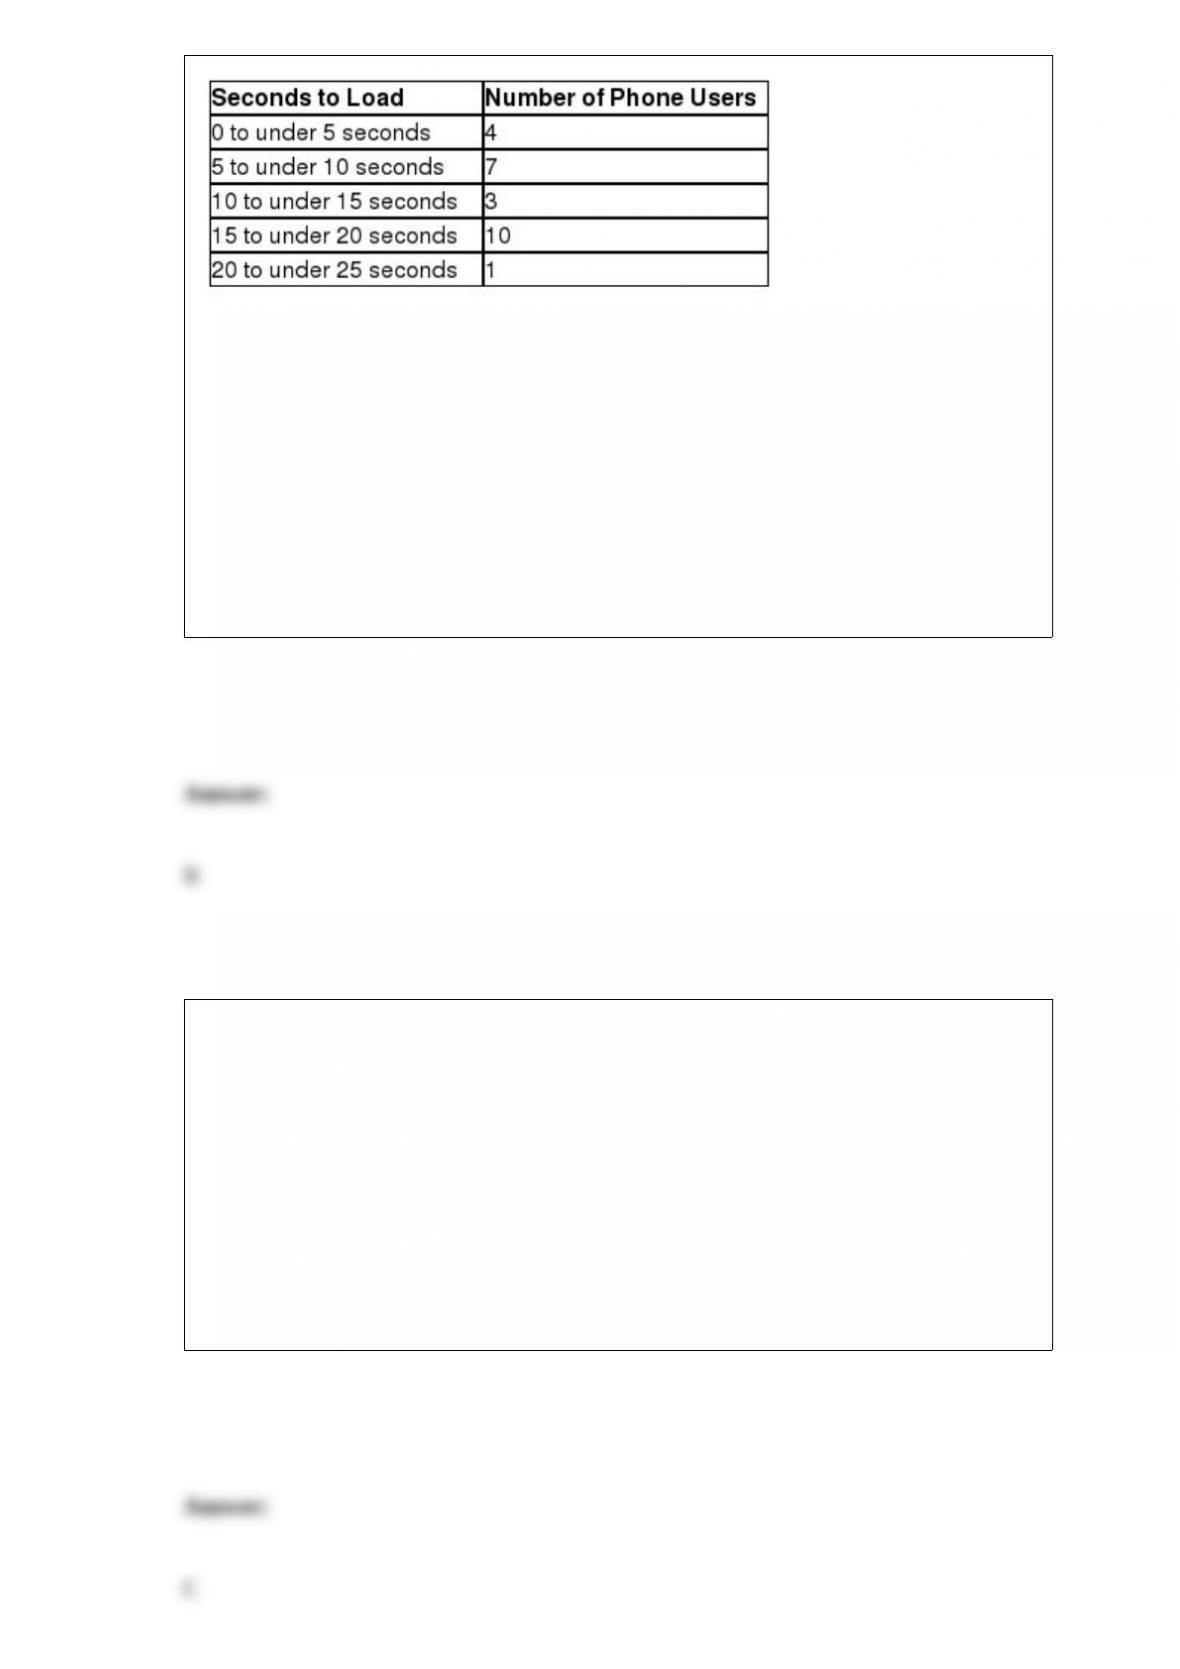
What is the approximate variance for the number of seconds that this web page took to
load on the iPhone?
A) 36.6
B) 38.2
C) 39.0
D) 40.7
A statistics class has 140 students of which 55% are female. A random sample of 40
students was selected. What is the probability that 24 or more from this sample will be
female?
A) 0.0505
B) 0.1469
C) 0.2266
D) 0.2611
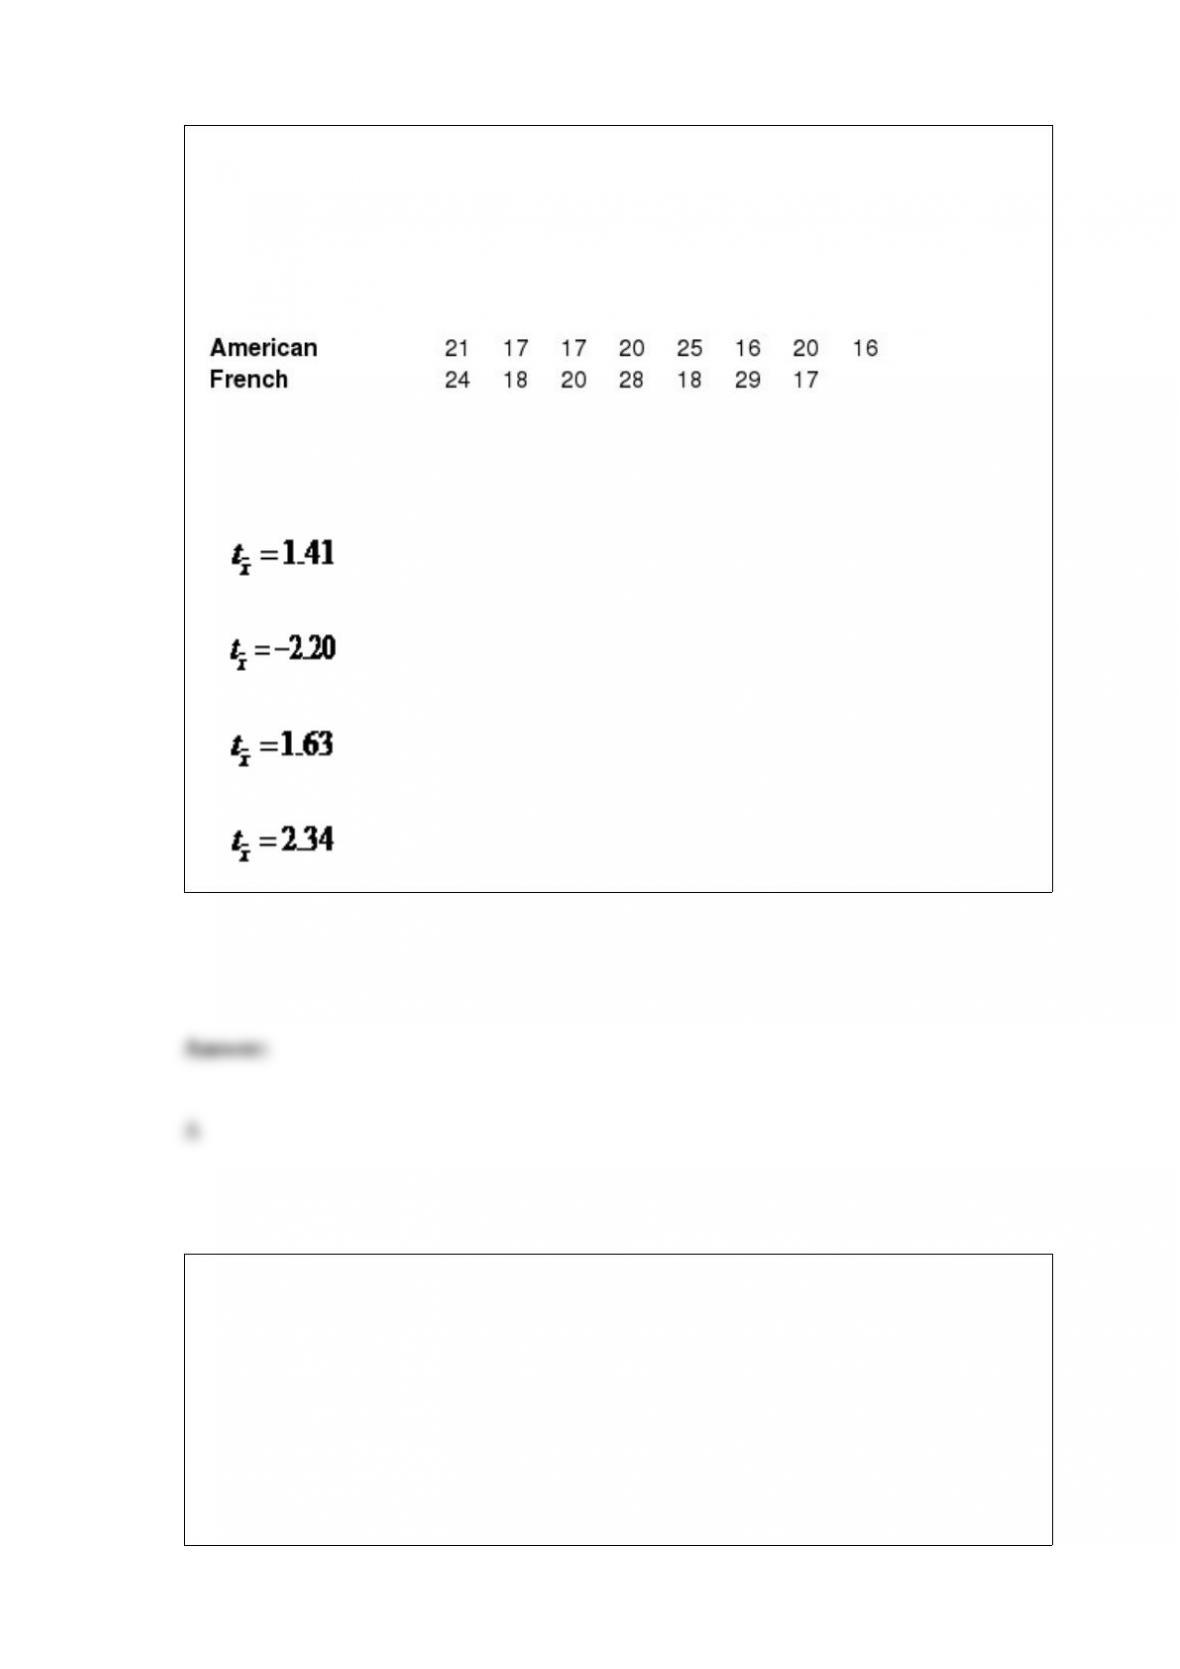
The Wall Street Journal reported that the average amount of time that a French person
spends eating lunch at a restaurant is 22 minutes. Perform a hypothesis test to determine
if a difference exists between the average time an American spends eating lunch when
compared to a person from France. The following data represents the time, in minutes,
that random French and American diners spent at lunch. Assume that the population
variances are equal.
If Population 1 is defined as French diners and Population 2 is defined as American
diners, the test statistic for this hypothesis test would be ________.
A)
B)
C)
D)
In Excel, contingency tables are known as ______________.
A) pivot tables
B) bins
C) frequency distributions
D) bar charts
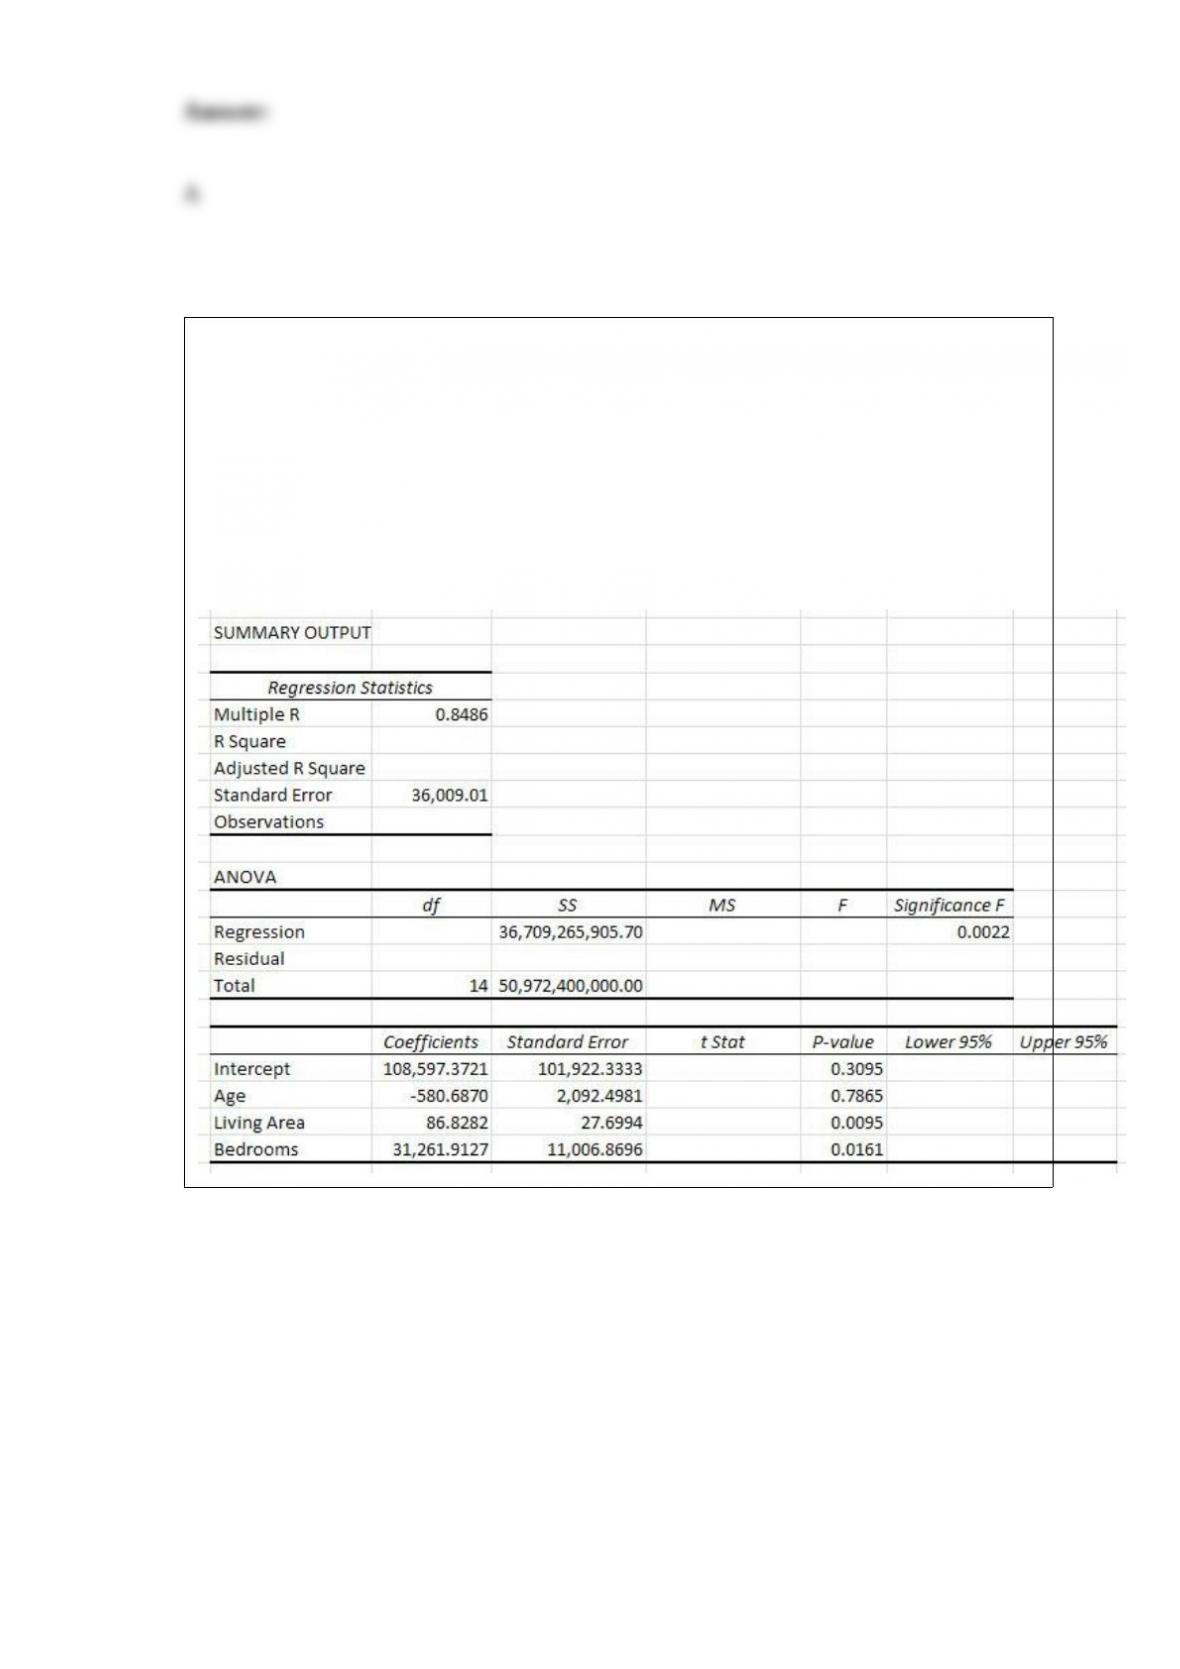
Use the following information to answer the question(s) below.
A home appraisal company would like to develop a regression model that would predict
the selling price of a house based on the age of the house in years (Age), the living area
of the house in square feet (Living Area) and the number of bedrooms (Bedrooms). The
following Excel output shows the partially completed regression output from a random
sample of homes that have recently sold.
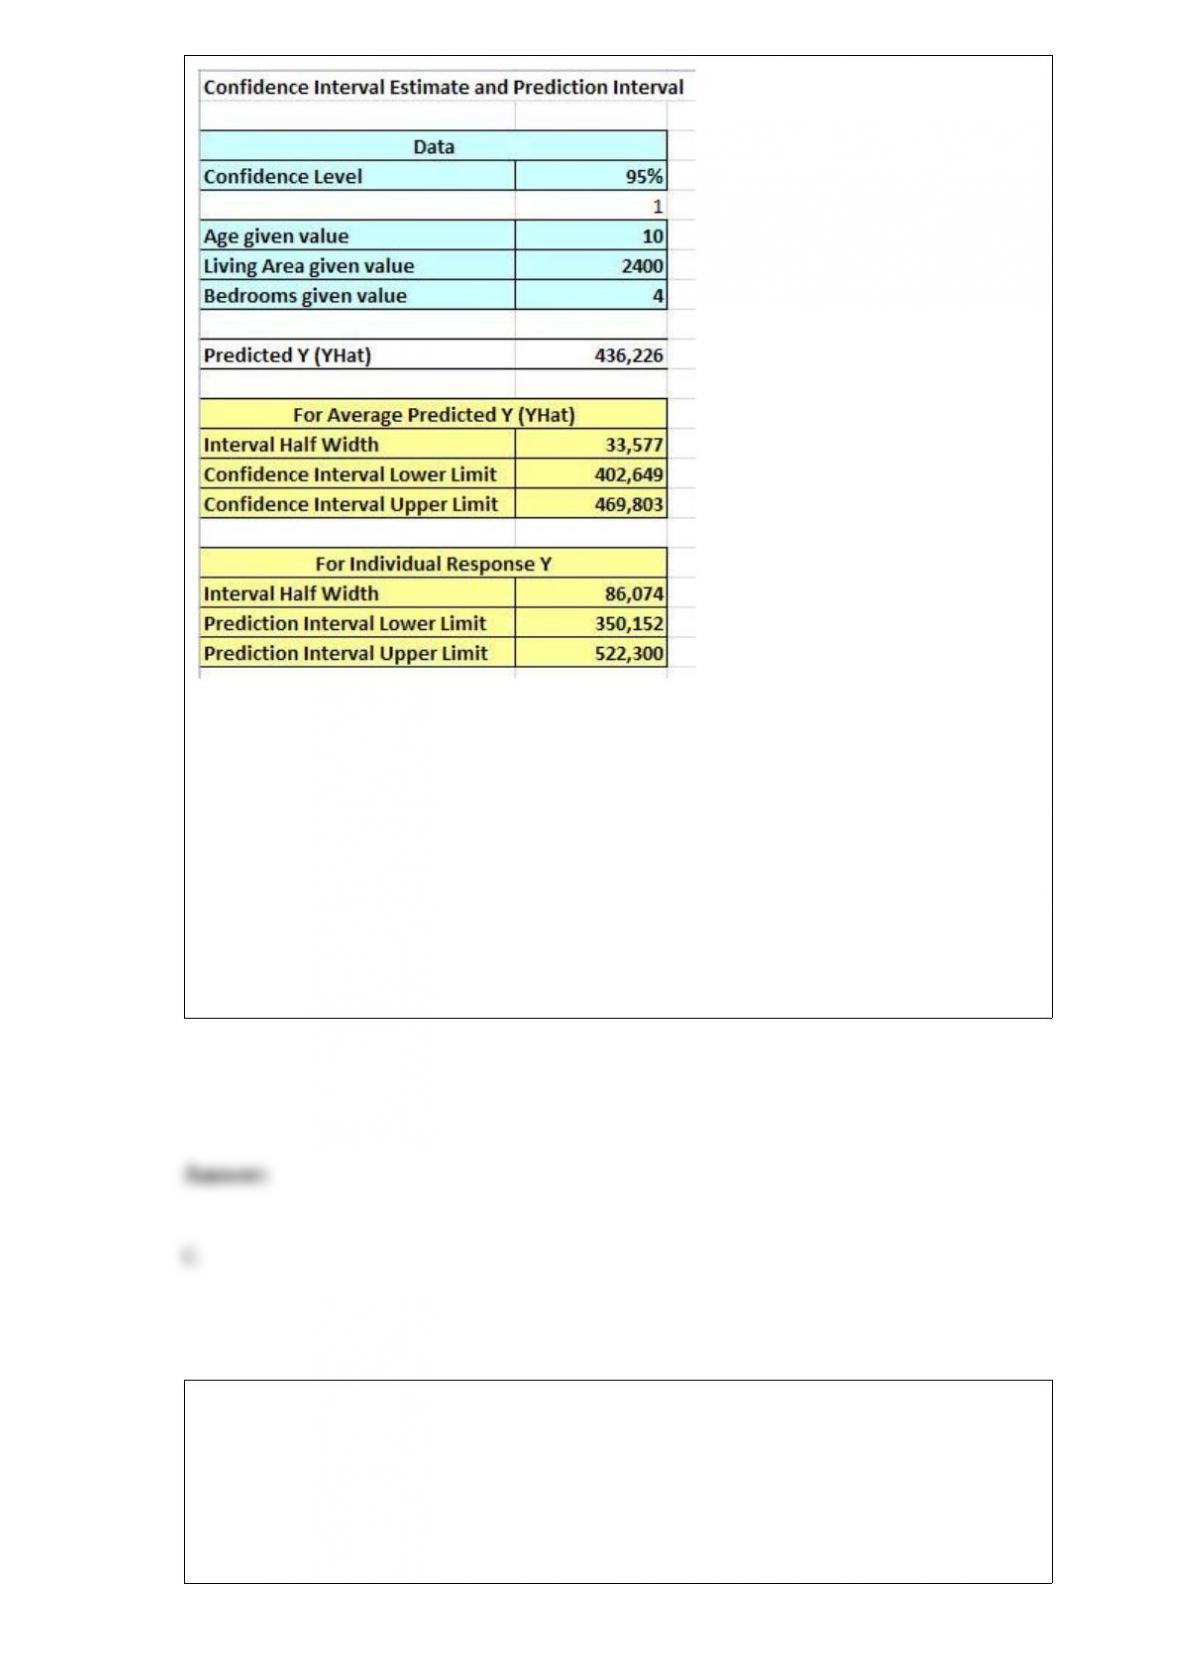
Every additional square foot of the house will
____________________________________.
A) increase the average selling price by $581
B) decrease the average selling price by $581
C) increase the average selling price by $87
D) decrease the average selling price by $28
Suppose the average driving distance for last year’s Masters Golf Tournament was
282.5 yards with a standard deviation of 12.2 yards. A random sample of 30 drives was
selected from a total of 4,144 drives that were hit during this tournament. What is the
probability that the sample average was 279 yards or less?
A) 0.3540

B) 0.2676
C) 0.1611
D) 0.0582
A statistics professor has 115 students in a statistics class and would like to estimate the
number of hours each student studied for the last exam. A random sample of 24 students
was found to study an average of 6.8 hours with a standard deviation of 2.2 hours. The
90% confidence interval to estimate the average number of hours studying for the exam
is ________.
A) (6.69, 6.91)
B) (5.86, 8.74)
C) (6.11, 7.49)
D) (5.79, 7.81)
Use the following information to answer the question(s) below.
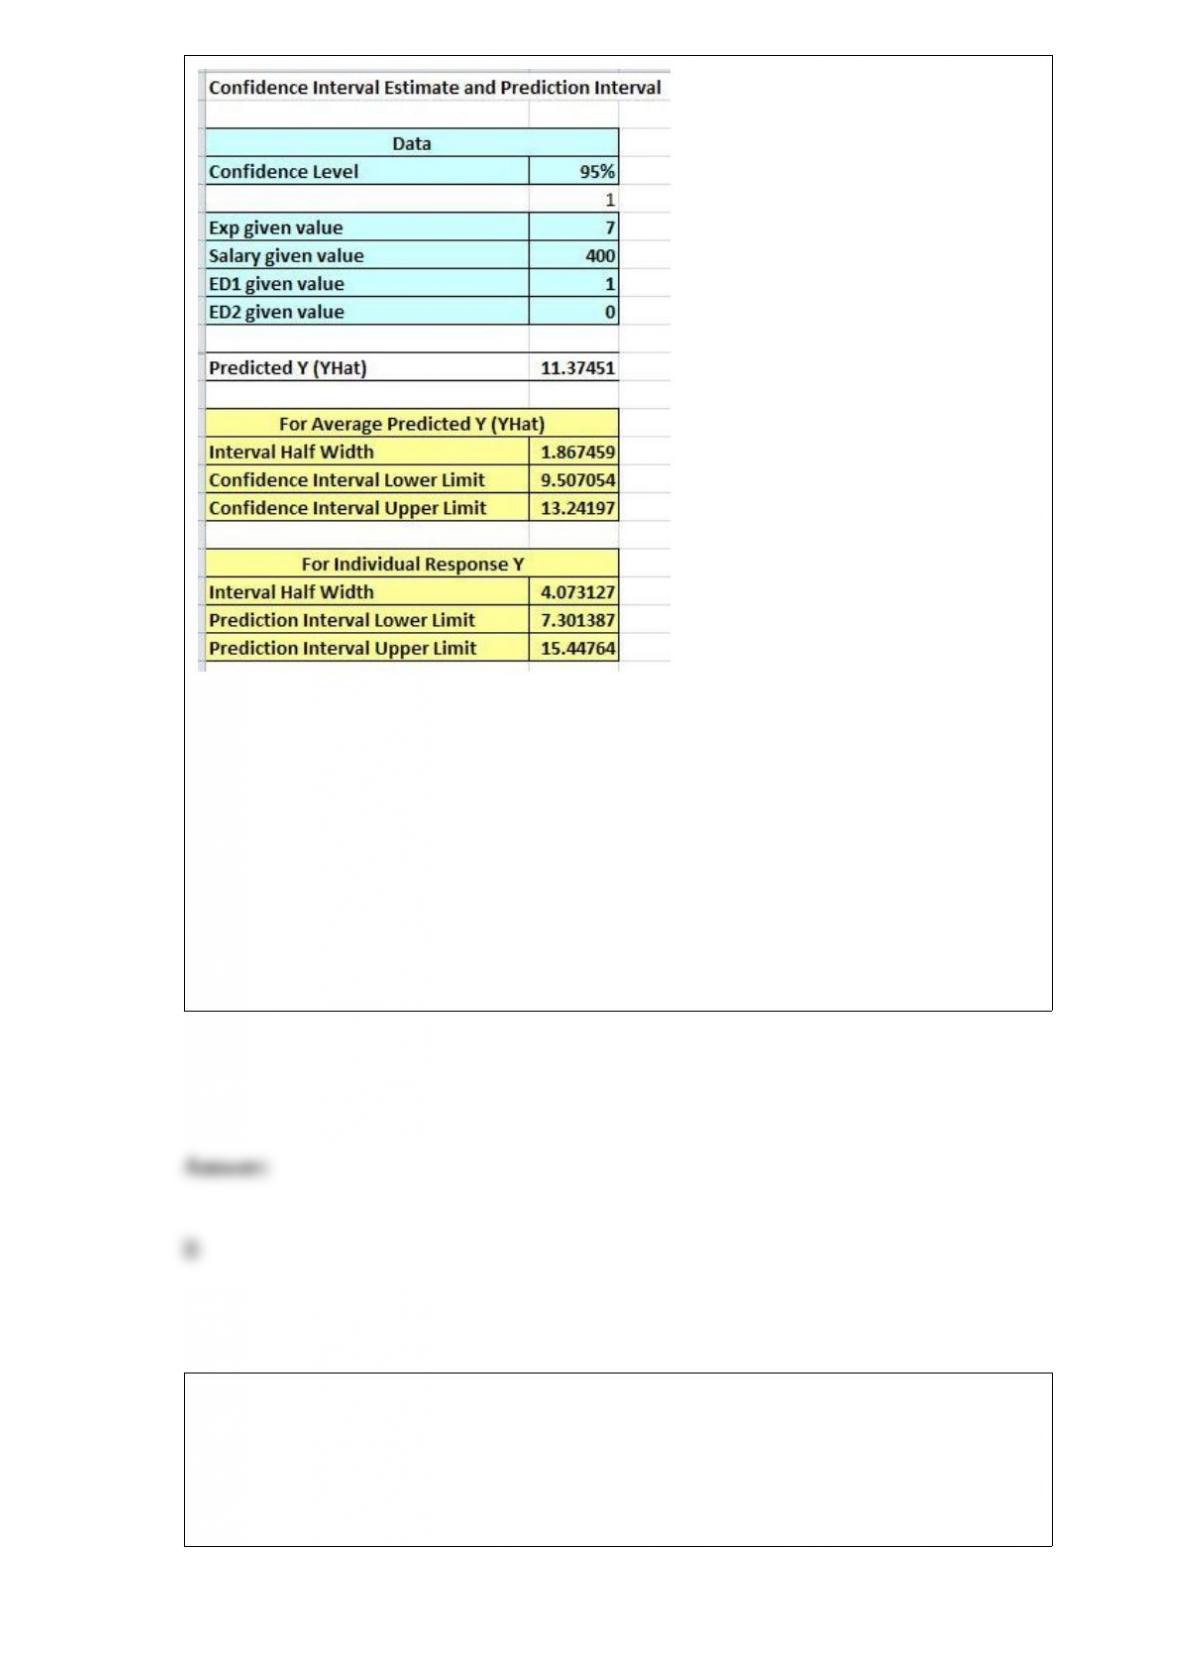
Ford would like to develop a regression model that would predict the number of cars
sold per month by a dealership employee based on the employee’s number of years of
sales experience (Exp), the employee’s weekly base salary before commissions (Salary),
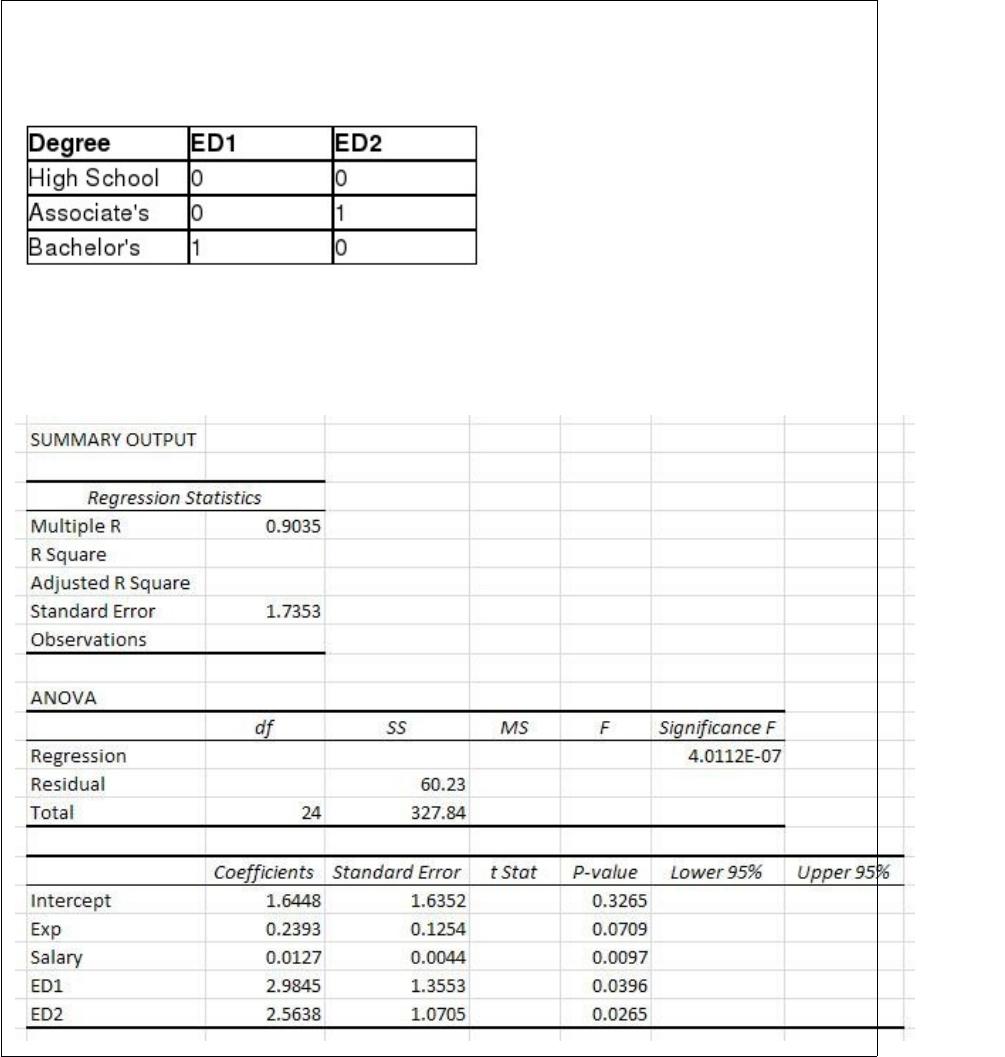
and the education level of the employee. There are three levels of education in the sales
forcehigh school degree, associate’s degree, and bachelor’s degree. The following
dummy variables have been defined.
The following Excel output shows the partially completed regression output from a
random sample of employees from the previous month.
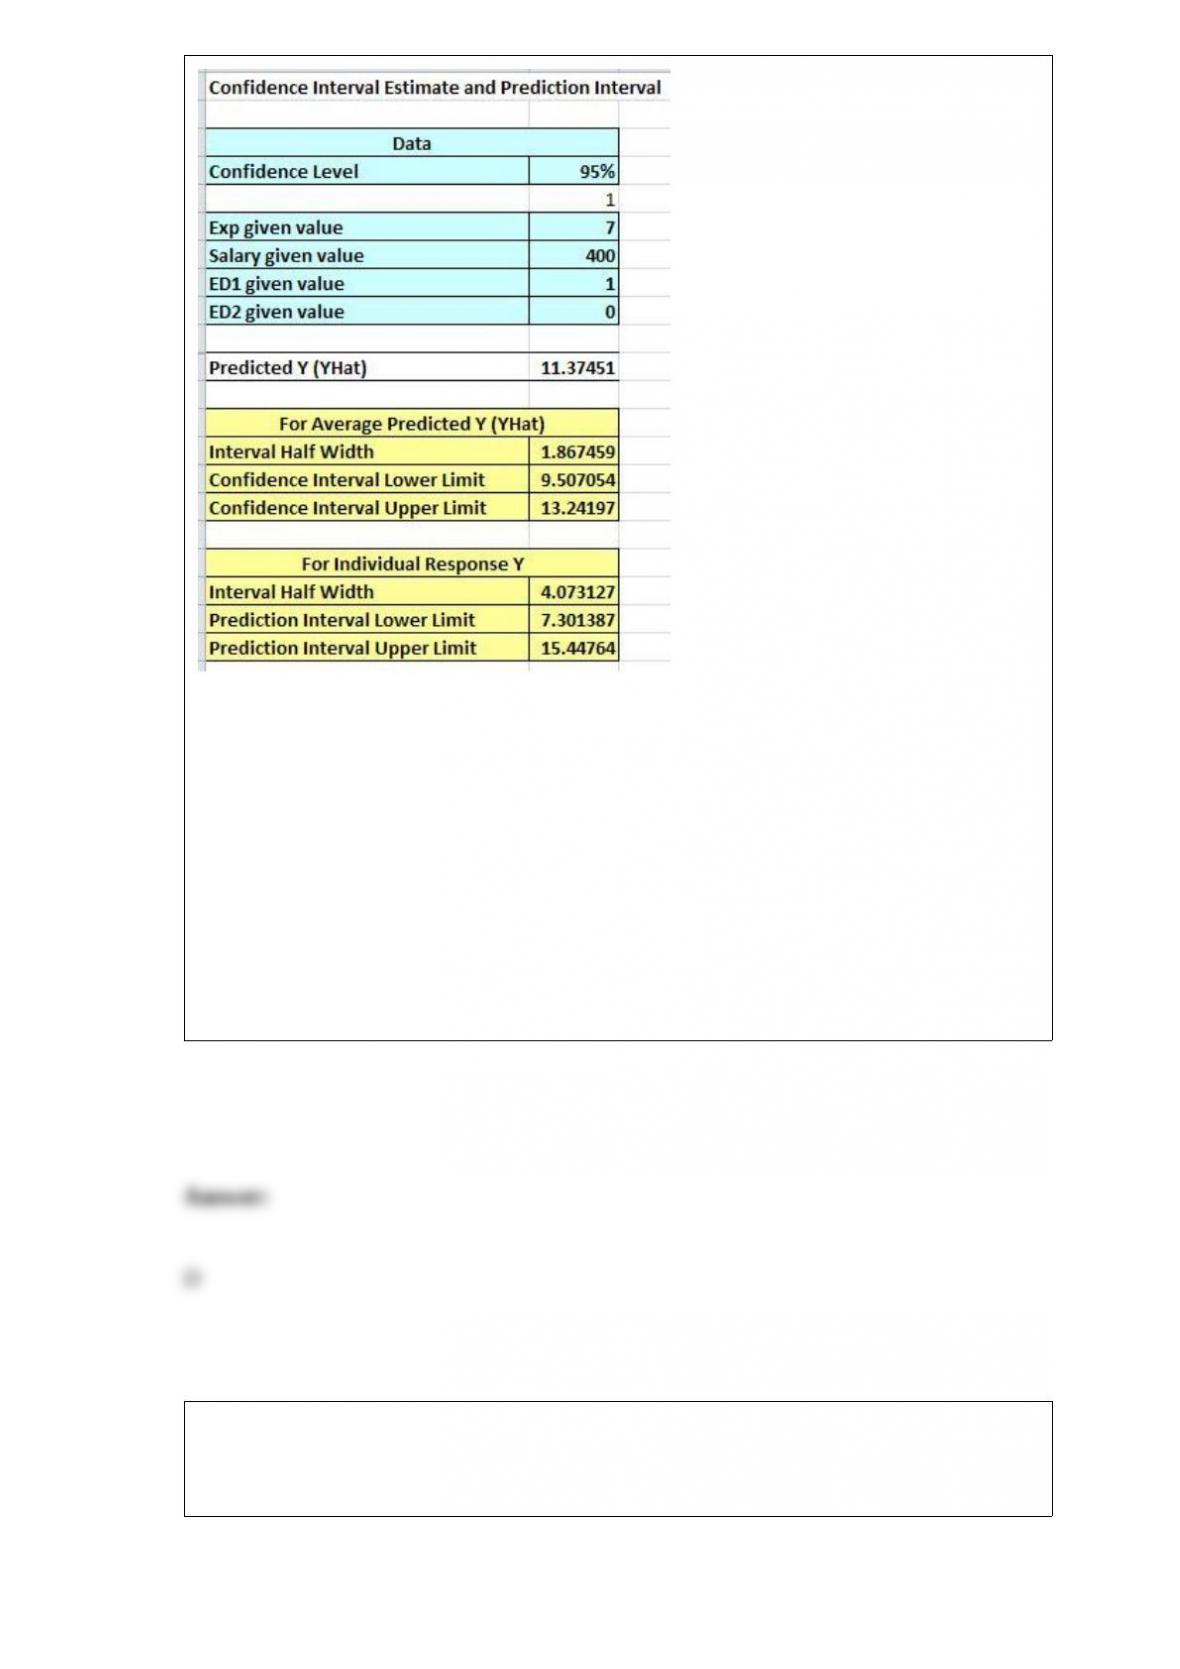
The 95% confidence interval for the average number of cars sold per month by
employees with seven years of experience, a salary of $400 per week, and a bachelor’s
degree is ________.
A) (5.50, 17.24)
B) (8.58, 14.16)
C) (7.30, 15.45)
D) (9.51, 13.24)
Suppose Coke would like to perform a blind taste test between soda with caffeine and
caffeine-free soda. Eight randomly selected customers tasted each soda and rated them
on a scale of 1-20 (20 = highest). The table below displays this data.
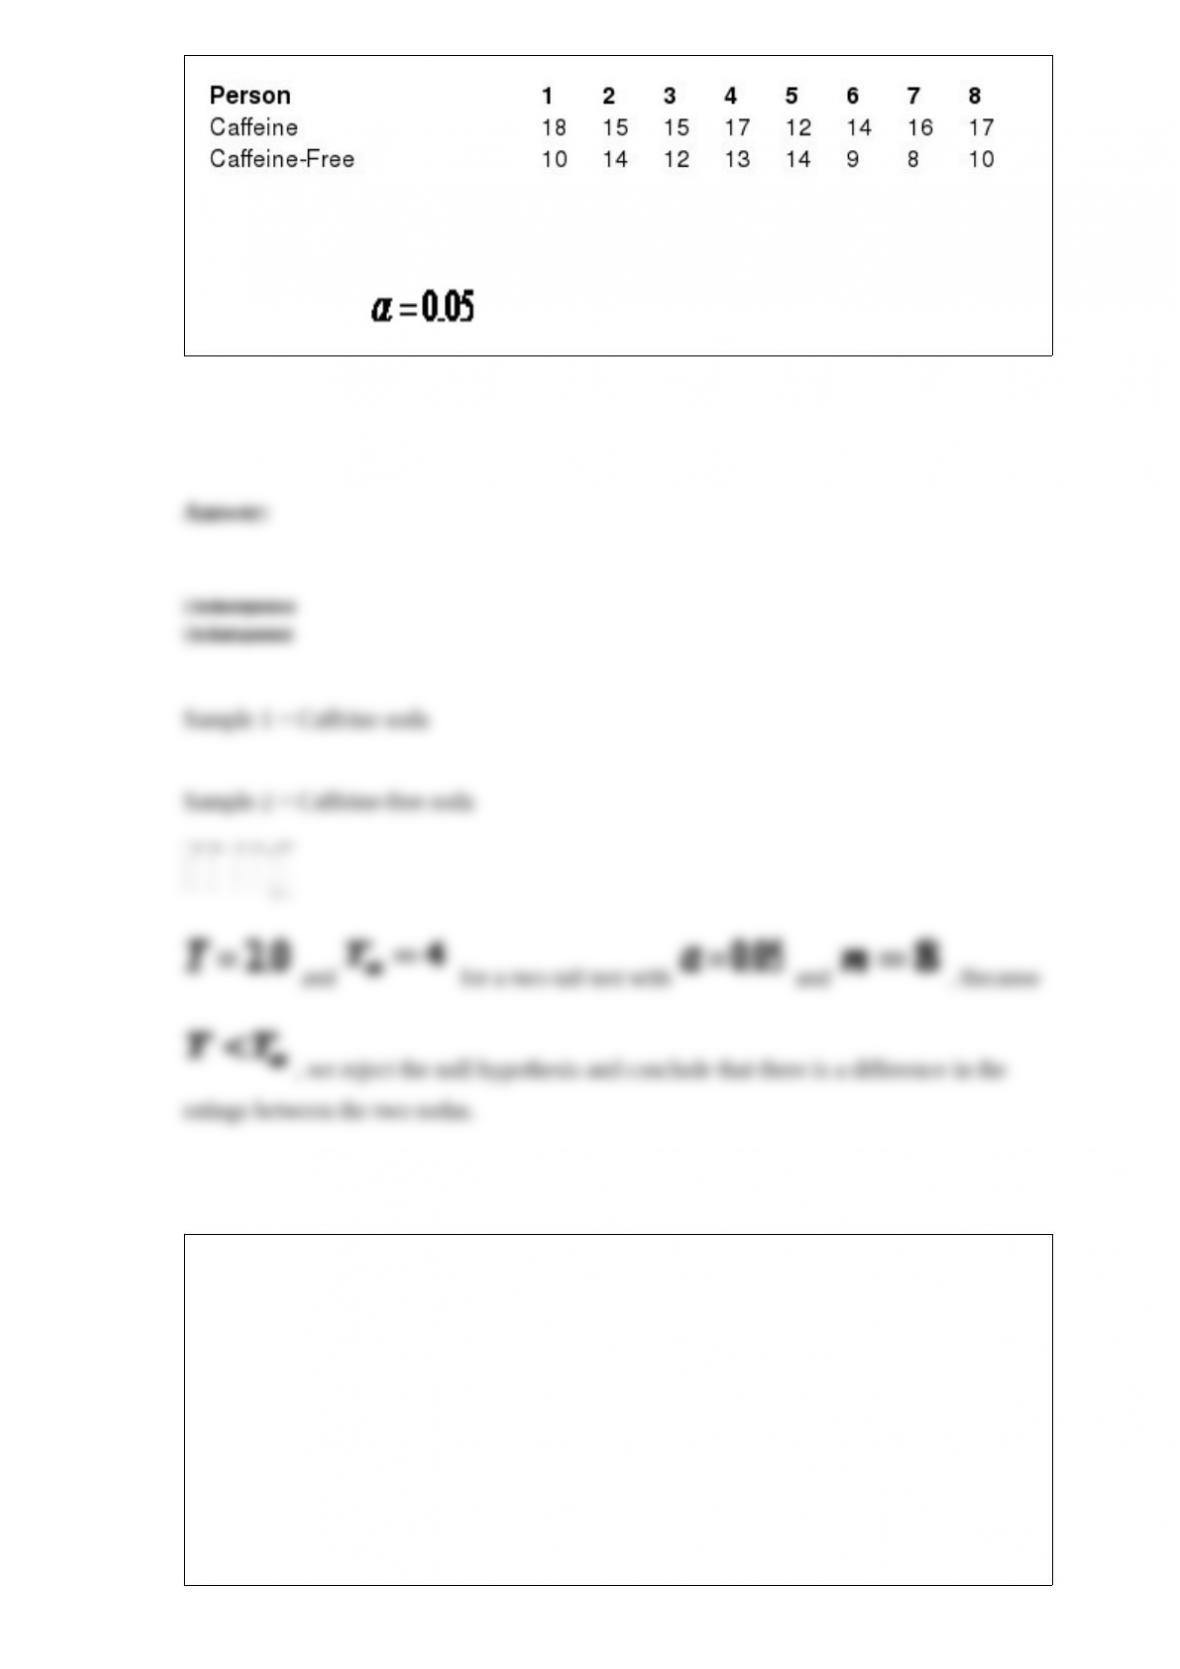
Assuming that the taste test ratings do not follow the normal probability distribution,
perform a hypothesis test to investigate if a difference exists in the ratings between
these sodas using .
________ regression brings one independent variable at a time into a regression model
based on its p-value. The “p-value to enter” and “p-value to remove” values determine
the threshold for independent variables joining and leaving the regression model,
respectively.
A) Best subsets
B) General stepwise
C) Backward elimination
D) Forward selection
The Tukey-Kramer multiple comparisons procedure allows us to examine each pair of
sample means and to conclude whether or not their respective sample means differ for a
one-way ANOVA.
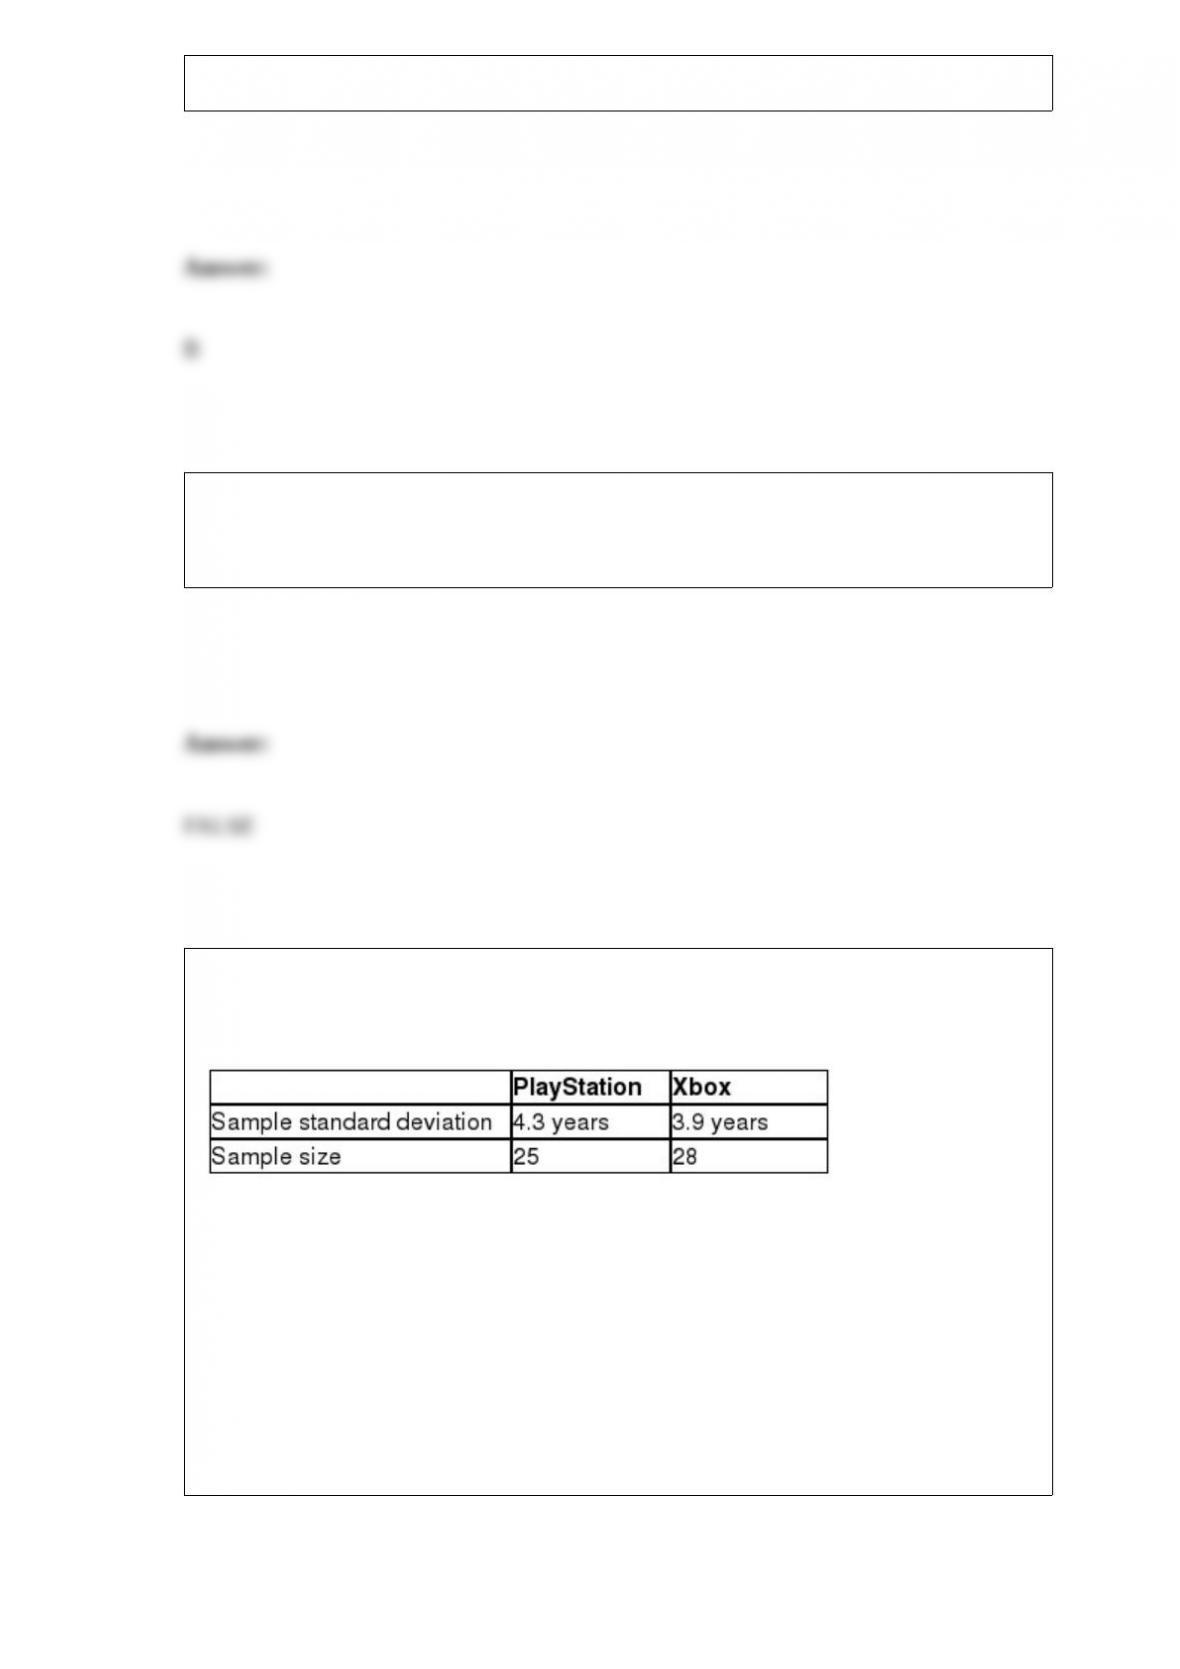
Sony would like to test the hypothesis that the standard deviation for the age of
PlayStation users is higher than the standard deviation for the age of Xbox users. The
following table summarizes sample statistics from each population.
The degrees of freedom for the critical value for Population 2 would be ________.
A) 24
B) 25
C) 27
D) 28

In Chapter 1, the textbook author provided the following extreme example of a poorly
worded survey question:
“We would like to propose a national golf holiday. Everybody gets the day off from
work and can play golf all day. (You would not need permission from your spouse to
play.)Are you in favor of this proposal?
A. Yes, most definitely.
B. Sure, why not?
C. No, I would rather spend the entire day at work.
P.S. If you choose C, we will permanently revoke all your golfing privileges
everywhere in the country for the rest of your life. We are dead serious.””
The results of this survey would be unreliable due to ____________.
A) sampling error
B) judgment error
C) nonsampling error
D) nonprobability error
If a household has at least one cat, there is a 30% probability that the household has at
least one dog. Thirty percent of households have at least one cat and 33% of households
have at least one dog. Given that a household has at least one dog, the probability that
the same household has at least one cat is ________.
A) 0.06
B) 0.17
C) 0.27
D) 0.48
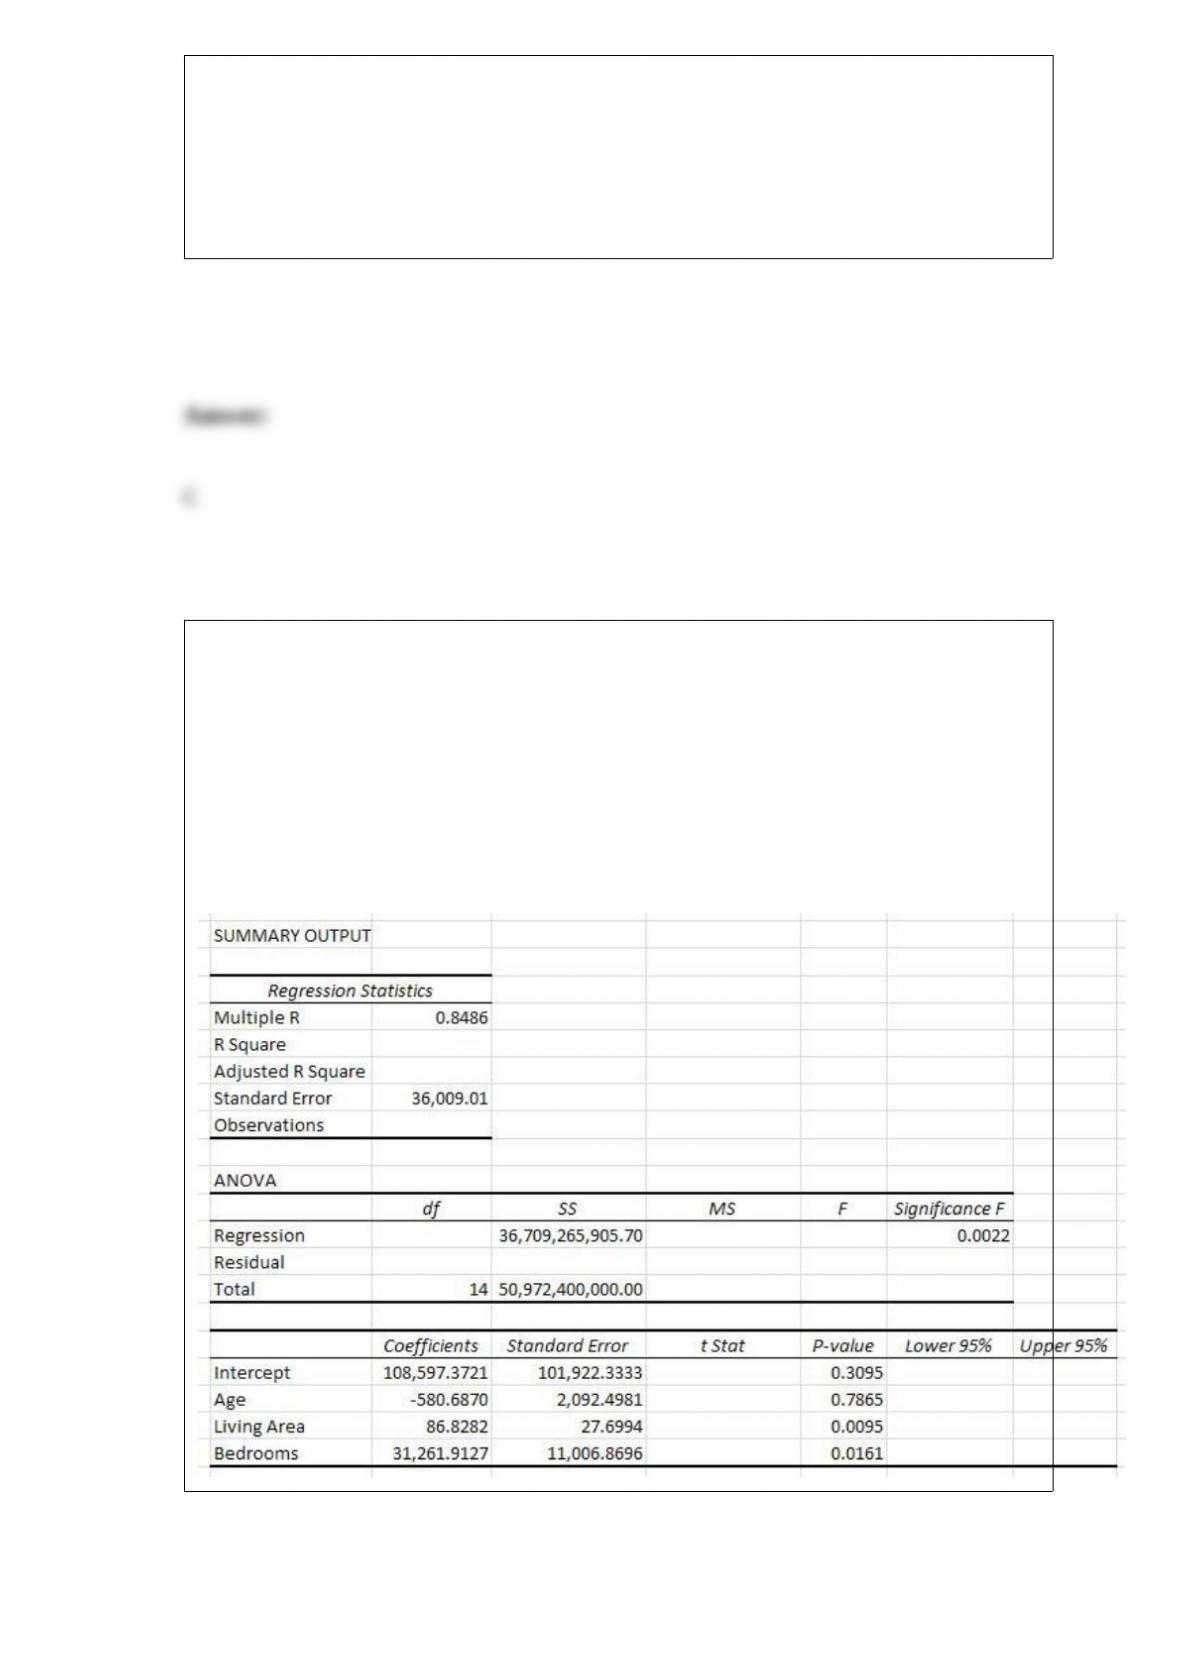
Use the following information to answer the question(s) below.
A home appraisal company would like to develop a regression model that would predict
the selling price of a house based on the age of the house in years (Age), the living area
of the house in square feet (Living Area) and the number of bedrooms (Bedrooms). The
following Excel output shows the partially completed regression output from a random
sample of homes that have recently sold.
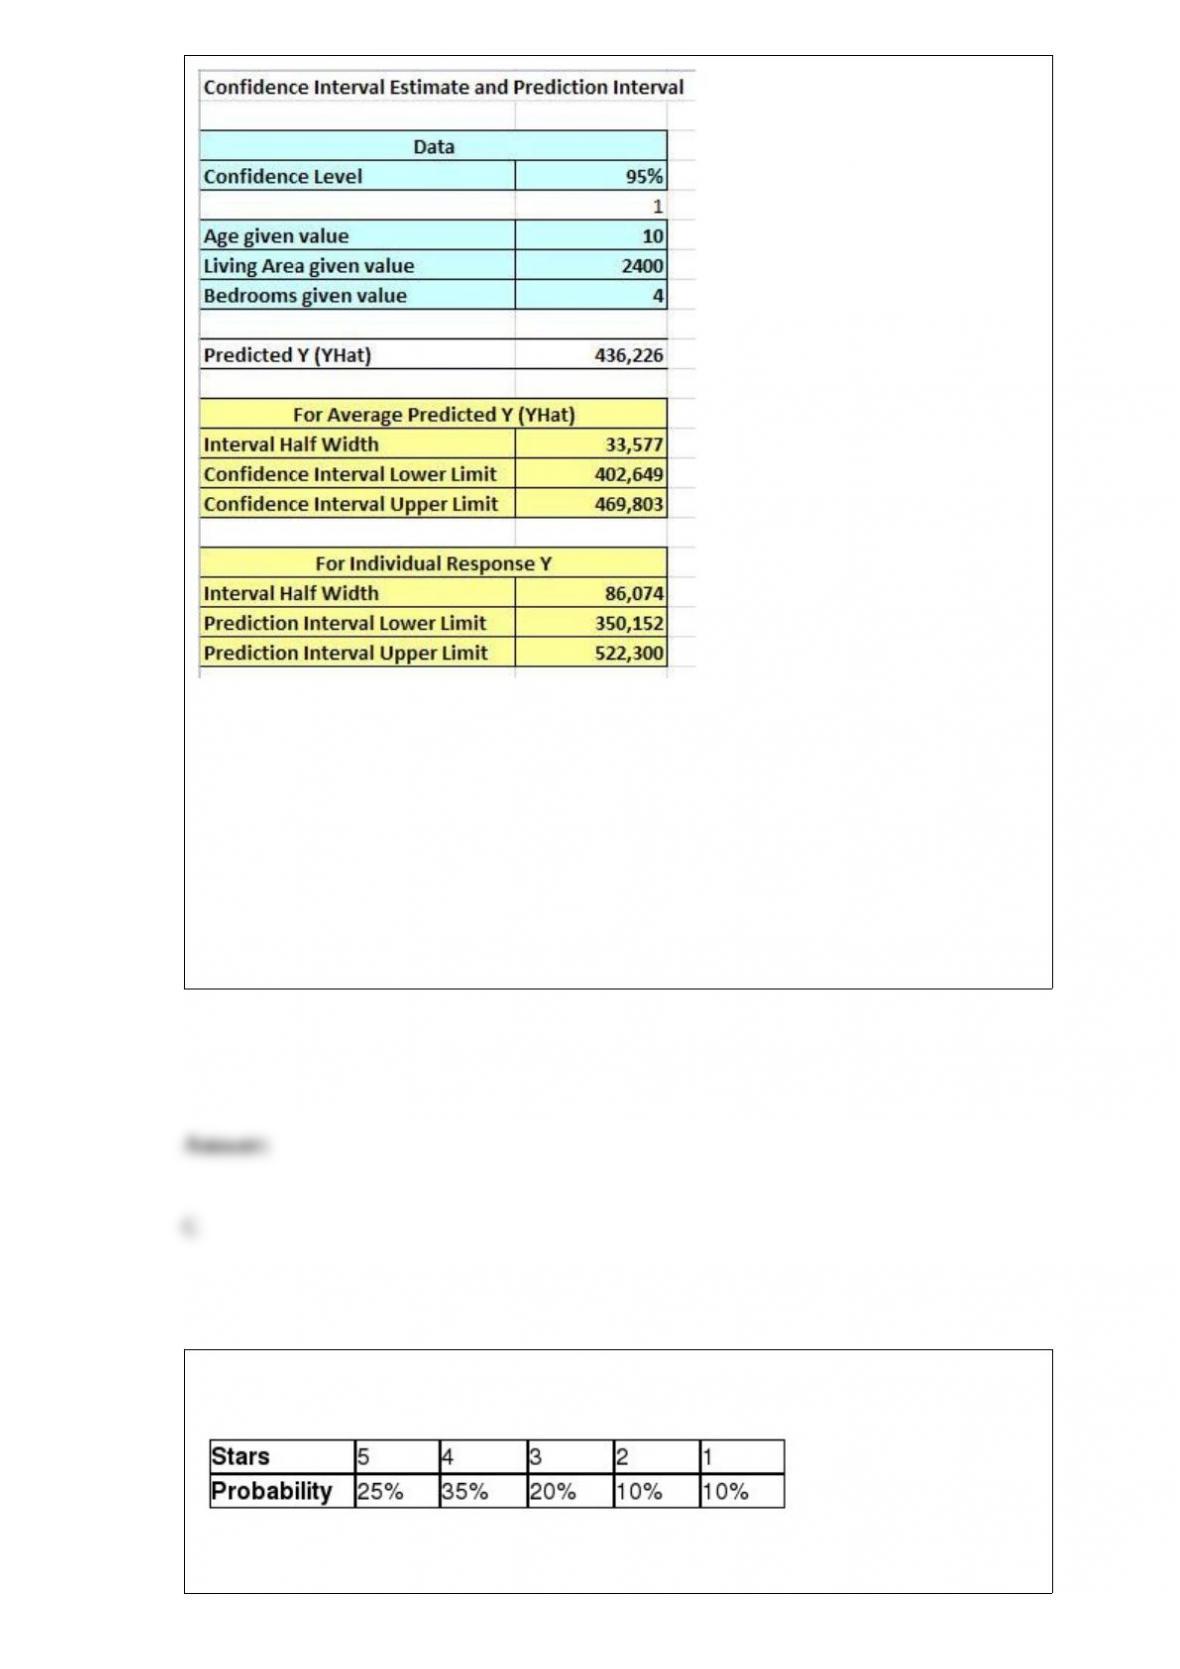
The number of homes that were included in the sample is ________.
A) 11
B) 14
C) 15
D) 16
The following data represent the discrete probability distribution for the number of stars
that reviewers gave a first edition statistics reference book.
The second edition of this reference book has been released and a random sample of
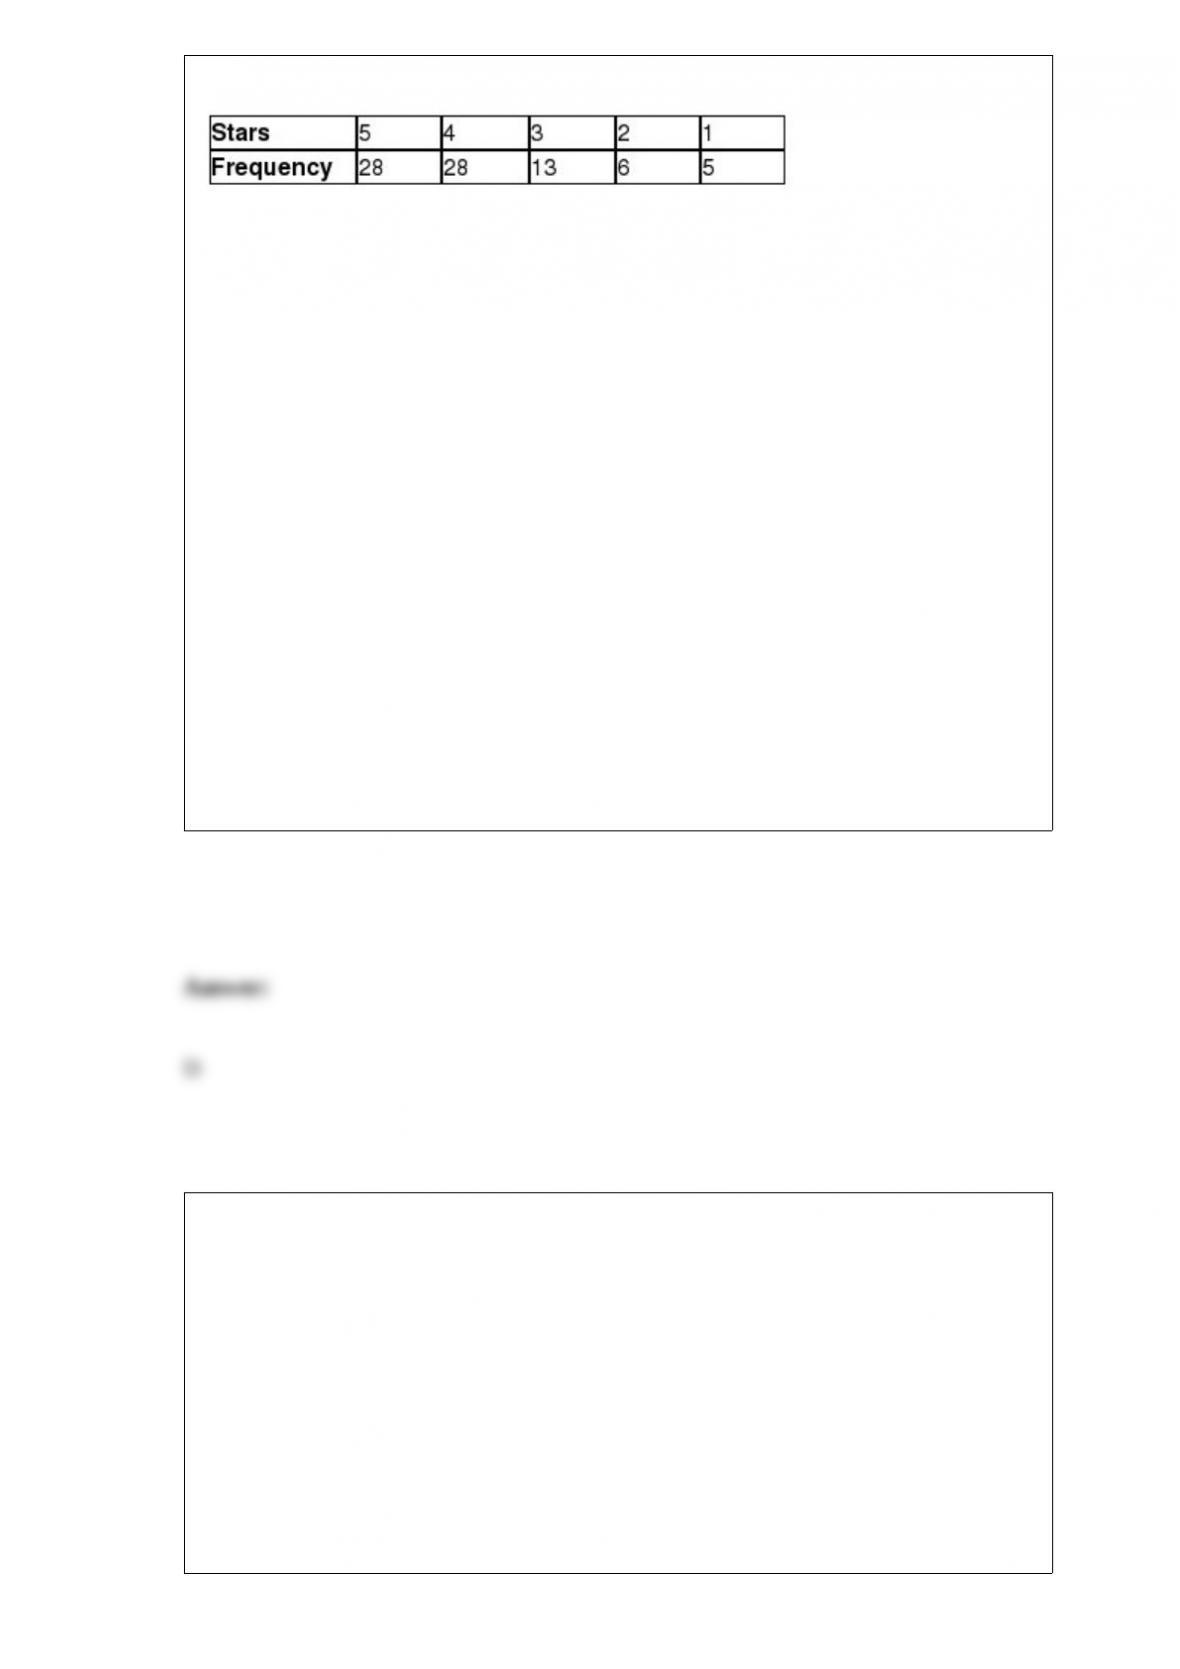
people that have purchased the book has been collected with the following results.
The publisher would like to know if the probability distribution for reviews has changed
from the first edition to the second edition using α = 0.025. The conclusion for this
hypothesis test would be that because the test statistic is
_________________________________________________.
A) more than the critical value, we can reject the null hypothesis and conclude that the
probability distribution for reviews of this book has changed from the first edition to the
second edition
B) less than the critical value, we can reject the null hypothesis and conclude that the
probability distribution for reviews of this book has not changed from the first edition
to the second edition
C) more than the critical value, we cannot reject the null hypothesis and conclude that
the probability distribution for reviews of this book has changed from the first edition to
the second edition
D) less than the critical value, we cannot reject the null hypothesis and cannot conclude
that the probability distribution for reviews of this book has not changed from the first
edition to the second edition
A professor would like to test the hypothesis that the average number of minutes that a
student needs to complete a statistics exam is equal to 45 minutes. A Type II error
would occur if the professor concludes that the average exam time is
_________________________________.
A) not equal to 45 minutes when, in reality, the average time is equal to 45 minutes
B) not equal to 45 minutes when, in reality, the average time is greater than 45 minutes
C) equal to 45 minutes when, in reality, the average time is less than 45 minutes
D) equal to 45 minutes when, in reality, the average time is not equal to 45 minutes
The time for a professor to grade an exam is normally distributed with a mean of 16.3
minutes and a standard deviation of 4.2 minutes. What is the probability that a
randomly selected exam will require less than 20 minutes to grade?
A) 0.3715
B) 0.6328
C) 0.8106
D) 0.9230
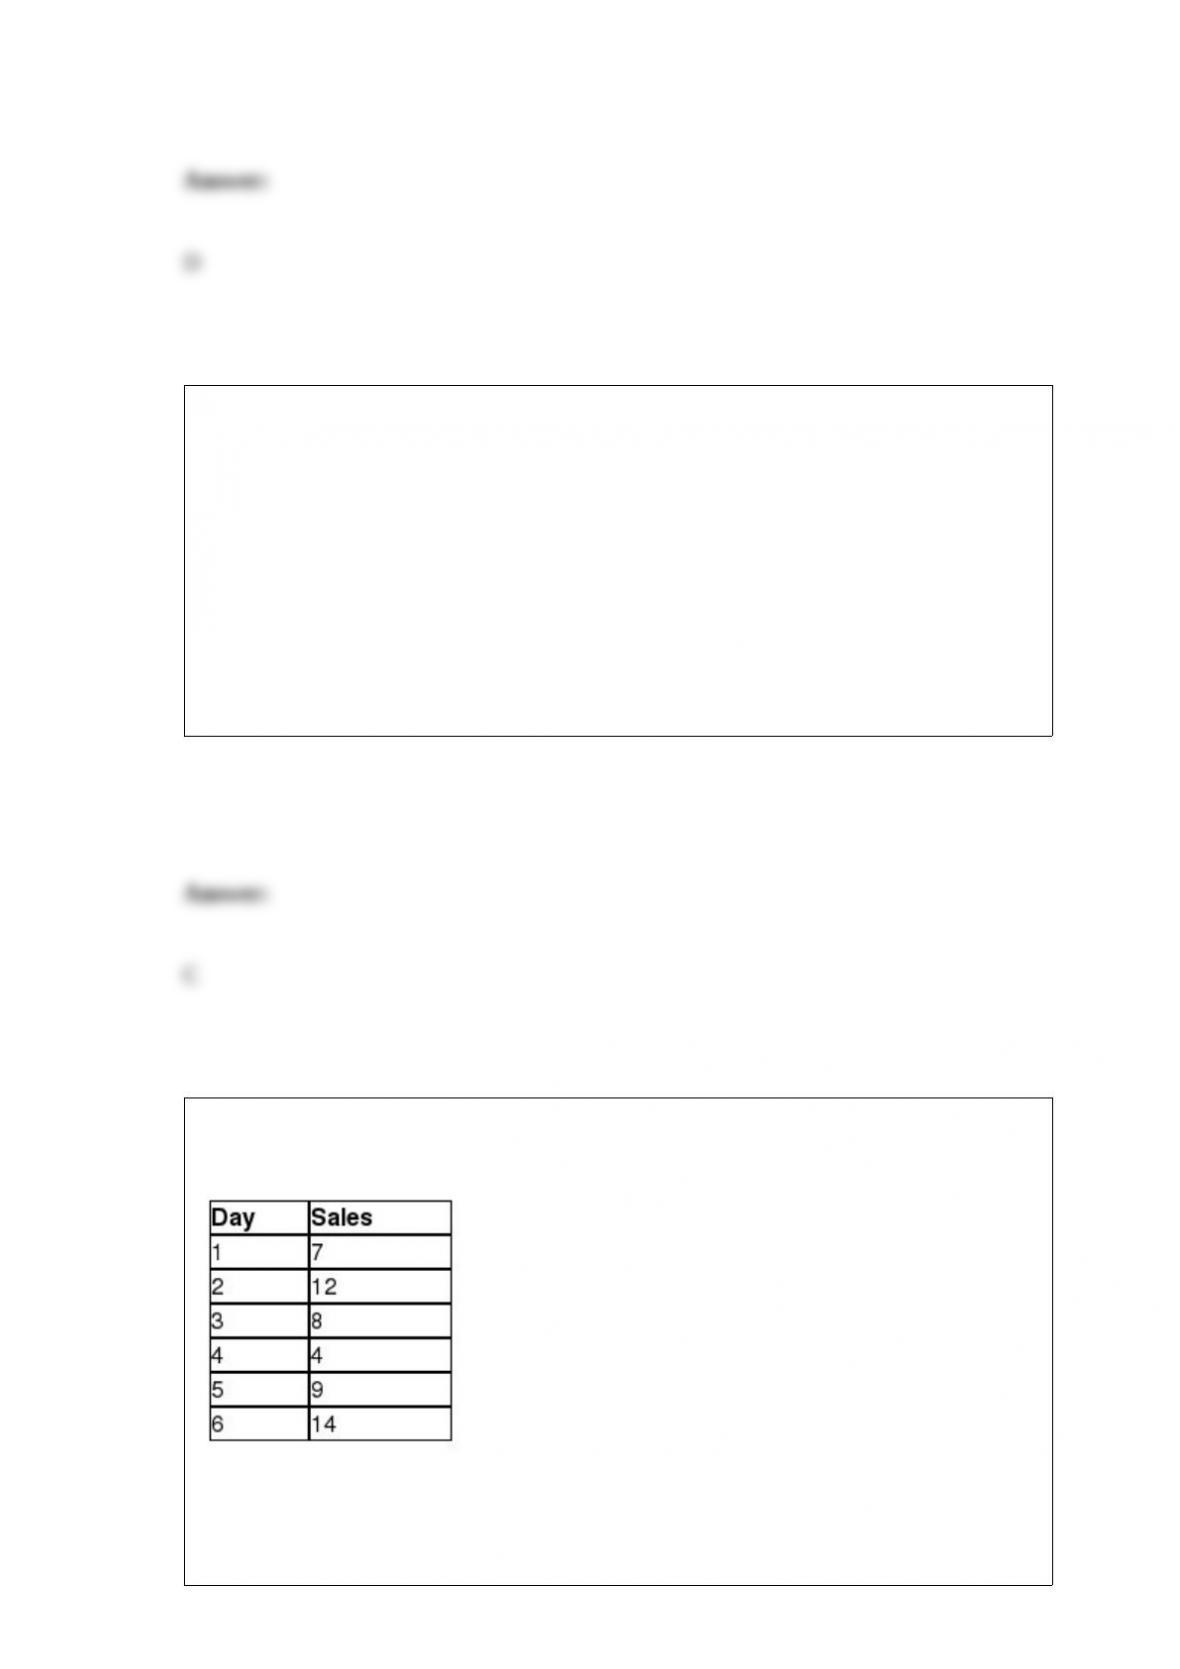
The following data represent the number of sweatshirts sold for each of the past six
days for Hoys Department Store at the beach in Avalon, New Jersey.
Using a three-period weighted moving average with weights 5, 2, and 1, the sales
forecast for Day 7 is ________.

A) 5.8
B) 6.5
C) 6.9
D) 11.5
________ provide a picture of the relationship between two data points that are paired
together.
A) Scatter plots
B) Pareto charts
C) Histograms
D) Pie charts
Use the following information to answer the question(s) below.
Ford would like to develop a regression model that would predict the number of cars
sold per month by a dealership employee based on the employee’s number of years of
sales experience (Exp), the employee’s weekly base salary before commissions (Salary),
and the education level of the employee. There are three levels of education in the sales
forcehigh school degree, associate’s degree, and bachelor’s degree. The following
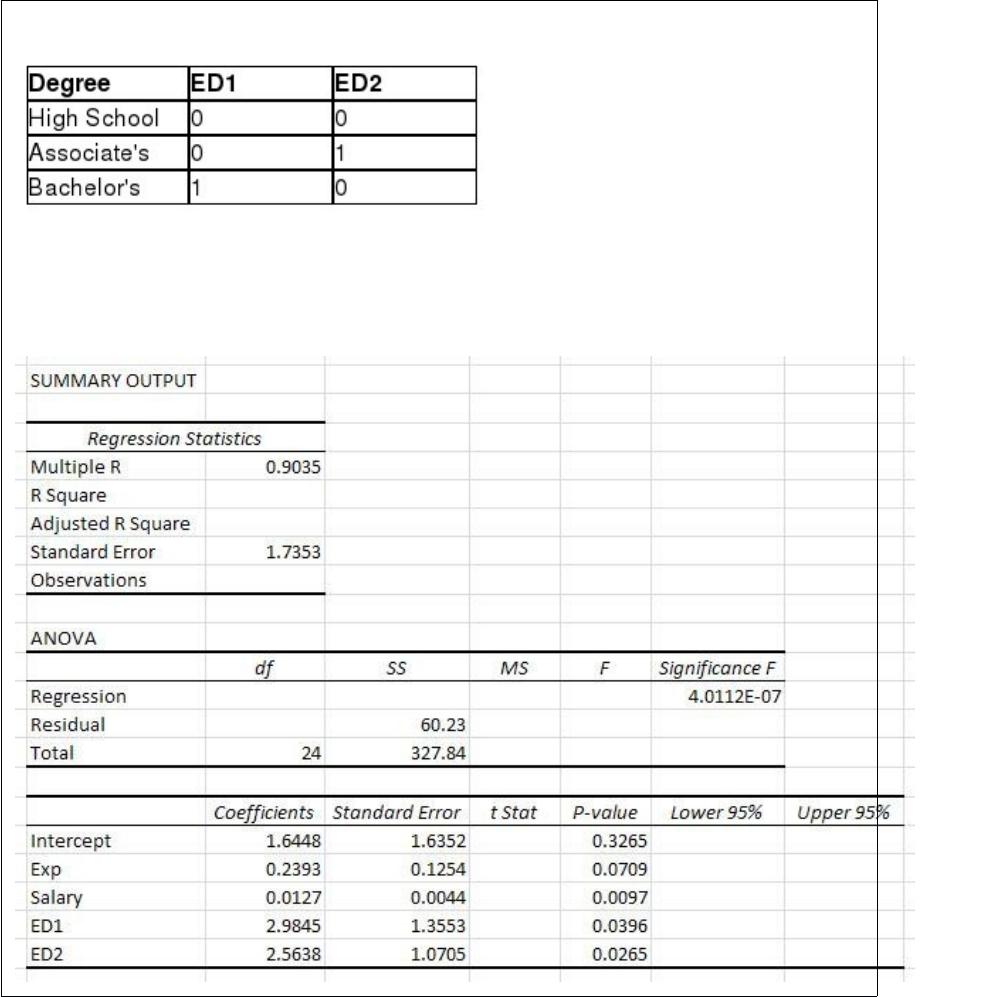
dummy variables have been defined.
The following Excel output shows the partially completed regression output from a
random sample of employees from the previous month.
The critical value to test the significance of the regression coefficients using α = 0.05 is
________.
A) 2.080
B) 2.086
C) 2.179
D) 2.201
Use the following information to answer the question(s) below.
The National Football League has developed a regression model to predict the number
of wins during a season for a team using the following independent variables:
•Average points per game during the season (PPG)
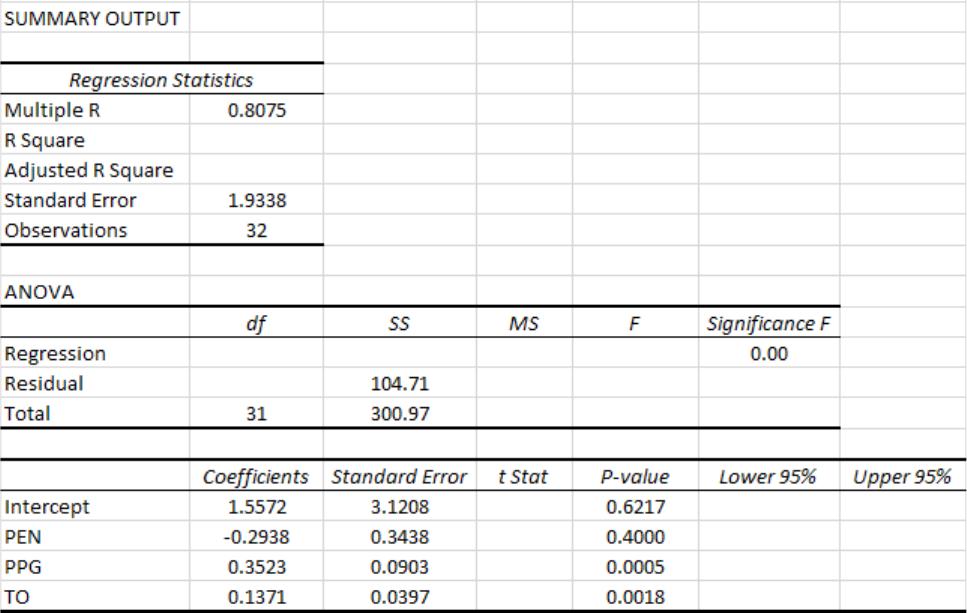
•Average number of penalties committed per game during the season (PEN)
•Turnover differential during the season (TO)
Turnover differential is defined as the number of times the team took the ball away from
their opponent with a turnover minus the number of times the team gave the ball away to
their opponent with a turnover. For example, if TO = +5, the team had five more
takeaways than giveaways. If TO = “7, the team had seven more giveaways than
takeaways during the season.
The following Excel output shows the partially completed regression output from a
random season.
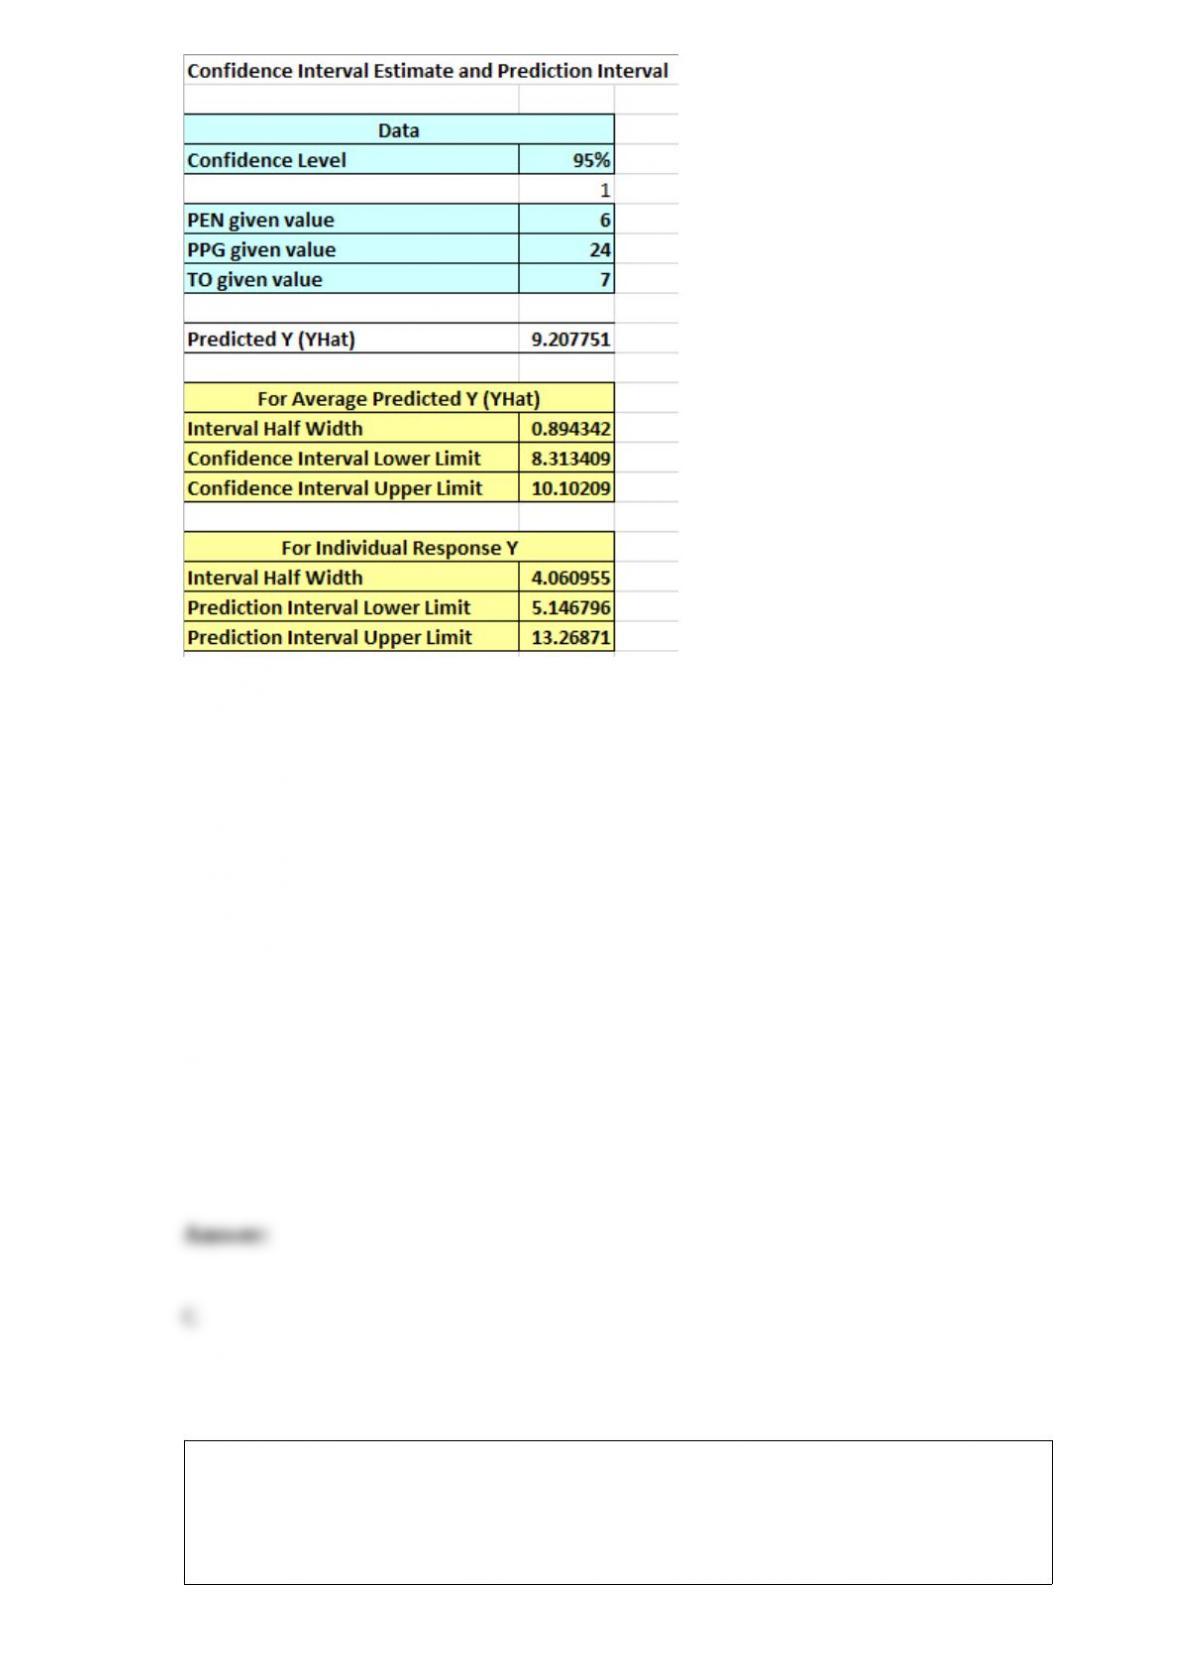
The degrees of freedom for the sum of squares error are ________.
A) 2
B) 3
C) 28
D) 31
Debbie is a buyer for a retail chain and needs to decide what order quantity to place for
women’s coats for the upcoming winter season. Below is a payoff table, in thousands of
dollars, for various order quantities (1 = lowest, 4 = highest) and demand levels for the
winter coats.
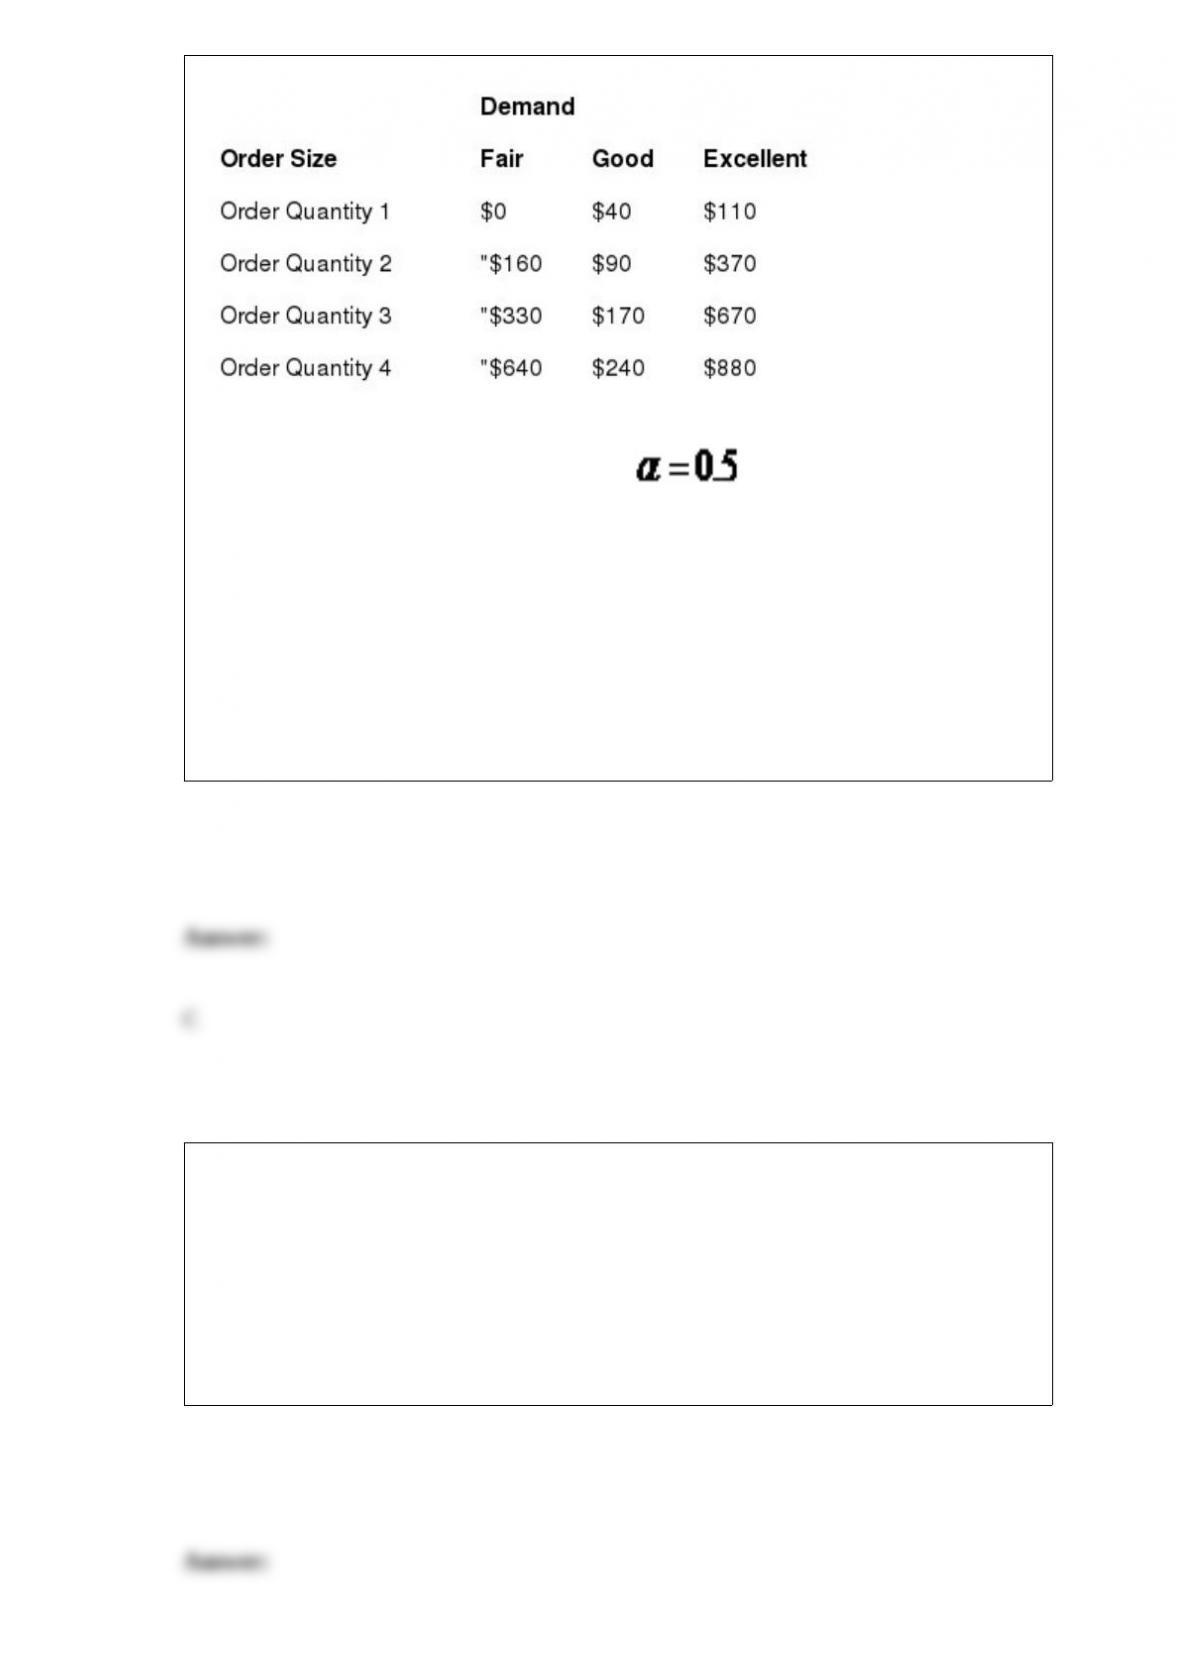
If the Debbie uses the Hurwicz criterion with , which order size will she
place?
A) Order Quantity 1
B) Order Quantity 2
C) Order Quantity 3
D) Order Quantity 4
A powdered ice tea manufacturer has production facilities in Boston, Atlanta, and
Chicago. Boston produces 60% of the company’s total output while Atlanta and
Chicago each manufacturer 20%. Historically, 2% of the cans of ice tea from the Boston
facility have sugar content that is lower than the minimum standard. Five percent of the
output from the Atlanta facility produced low sugar ice tea while 6% of the Chicago
plant produced low sugar ice tea. A randomly selected can of powdered ice tea at a
grocery store has low sugar content. Use Bayes’ Theorem to determine the probability
that the container came from the Chicago plant.
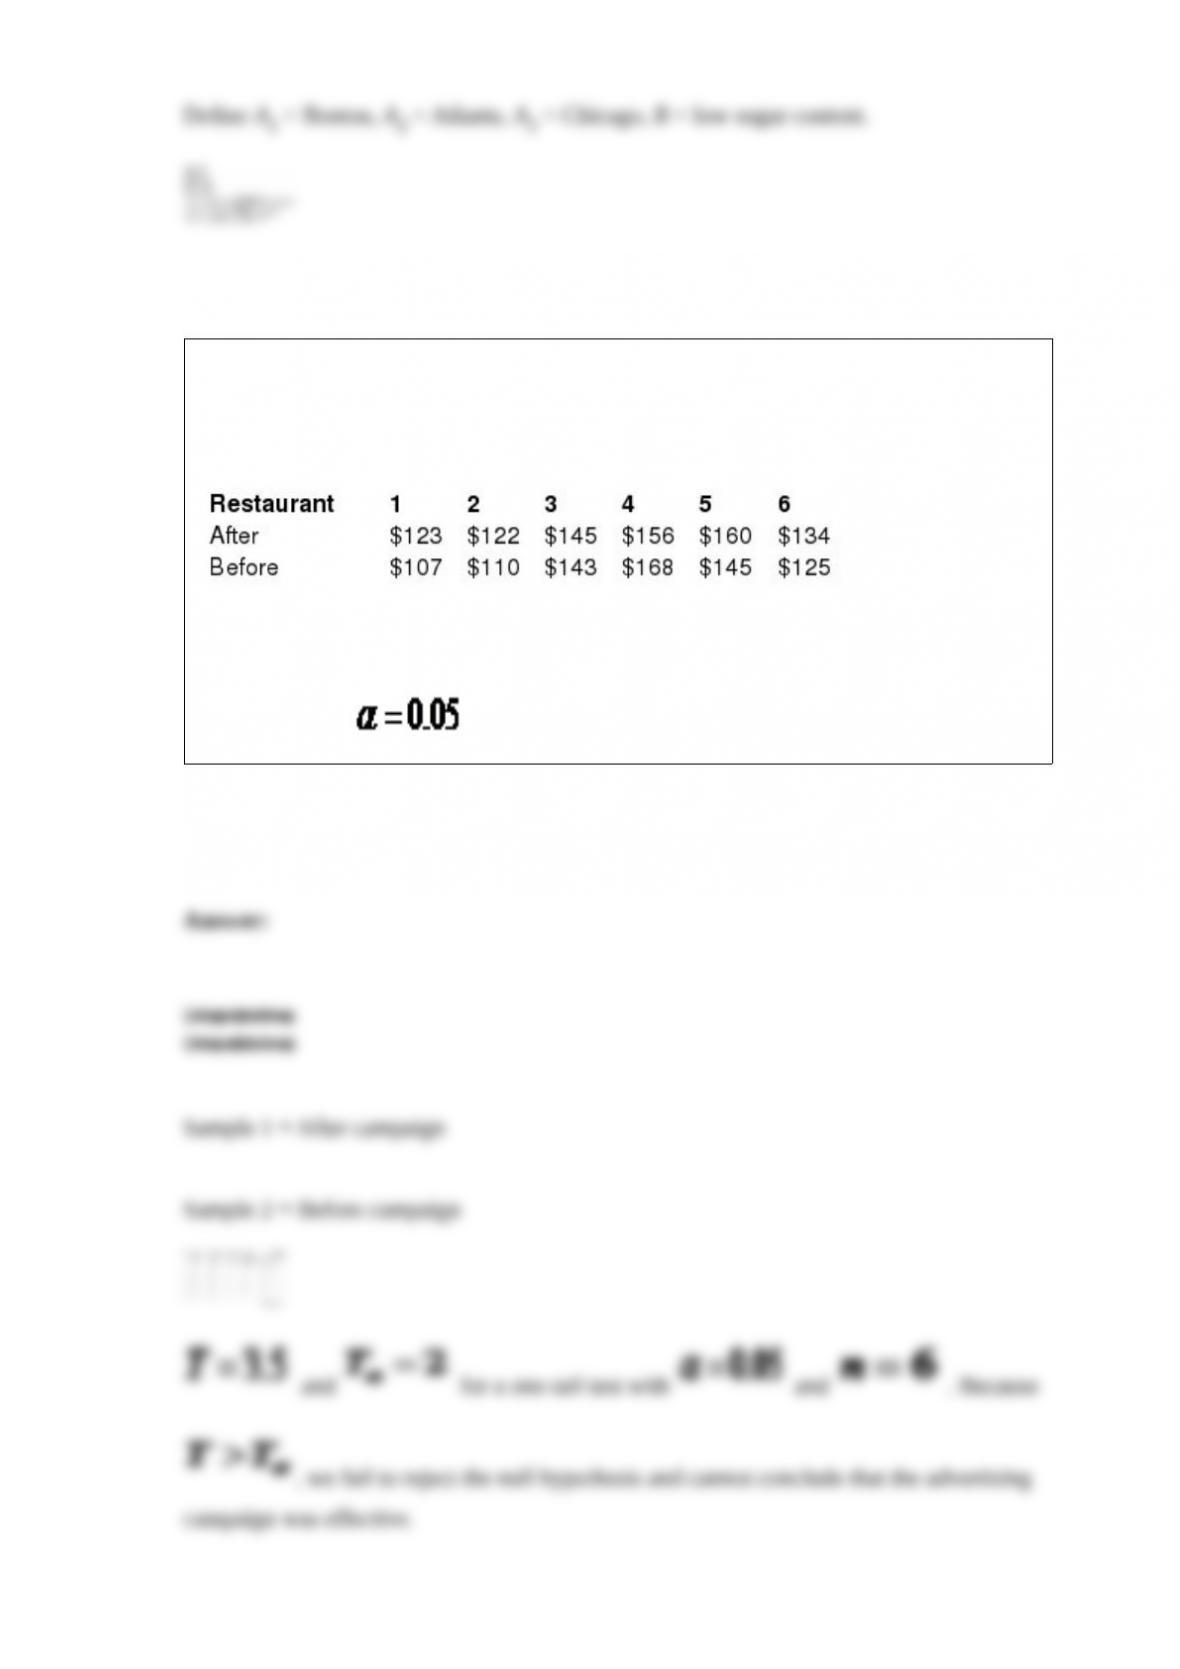
Suppose Burger King has run a major advertising campaign in the hopes of increasing
monthly sales. To investigate the effectiveness of this campaign, Burger King randomly
selected six restaurants and recorded the monthly sales before and after the advertising.
The following data represents these sales figures in thousands of dollars.
Assuming that the sales for both restaurants does not follow the normal probability
distribution, perform a hypothesis test to investigate the effectiveness of the advertising
campaign using .
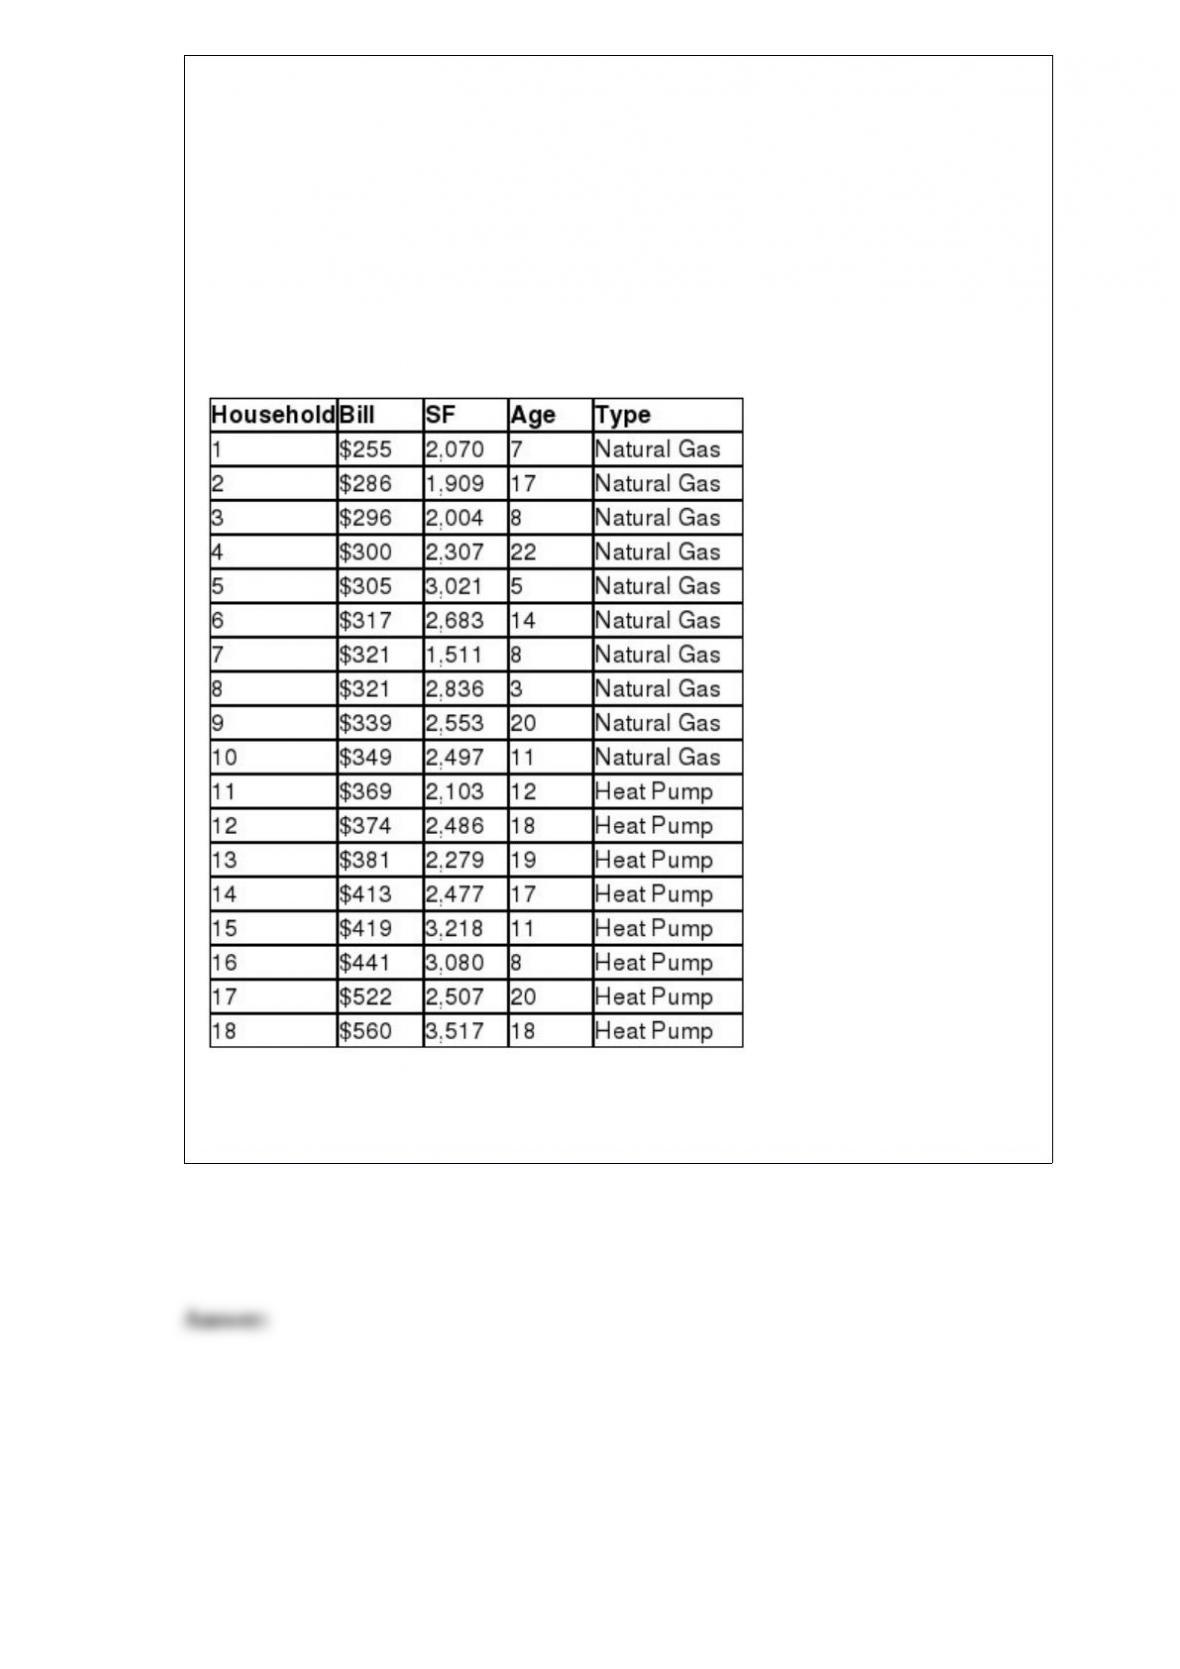
Use the following information to answer the question(s) below.
Delmarva Power is a utility company that would like to predict the monthly heating bill
for a household in Kent County during the month of January. A random sample of 18
households in the county were selected and their January heating bill recorded. This
data is shown in the table below along with the square footage of the house (SF), the
age of the heating system in years (Age,) and the type of heating system (heat pump = 1
or natural gas = 0).
Construct a 95% confidence interval to estimate the average monthly heating bill for a
house that has 2,600 square feet and has a heat pump that is nine years old.
Obesity is defined as being 30 or more pounds over a healthy weight. According to the
Gallup-Healthways Well-being Index, 33.6% of adults living in the state of Delaware
are obese. To verify this percentage, a random sample of 240 adults from Delaware was
selected of which 74 were obese. Does this sample support the findings of the
Gallup-Healthways Well-being Index?
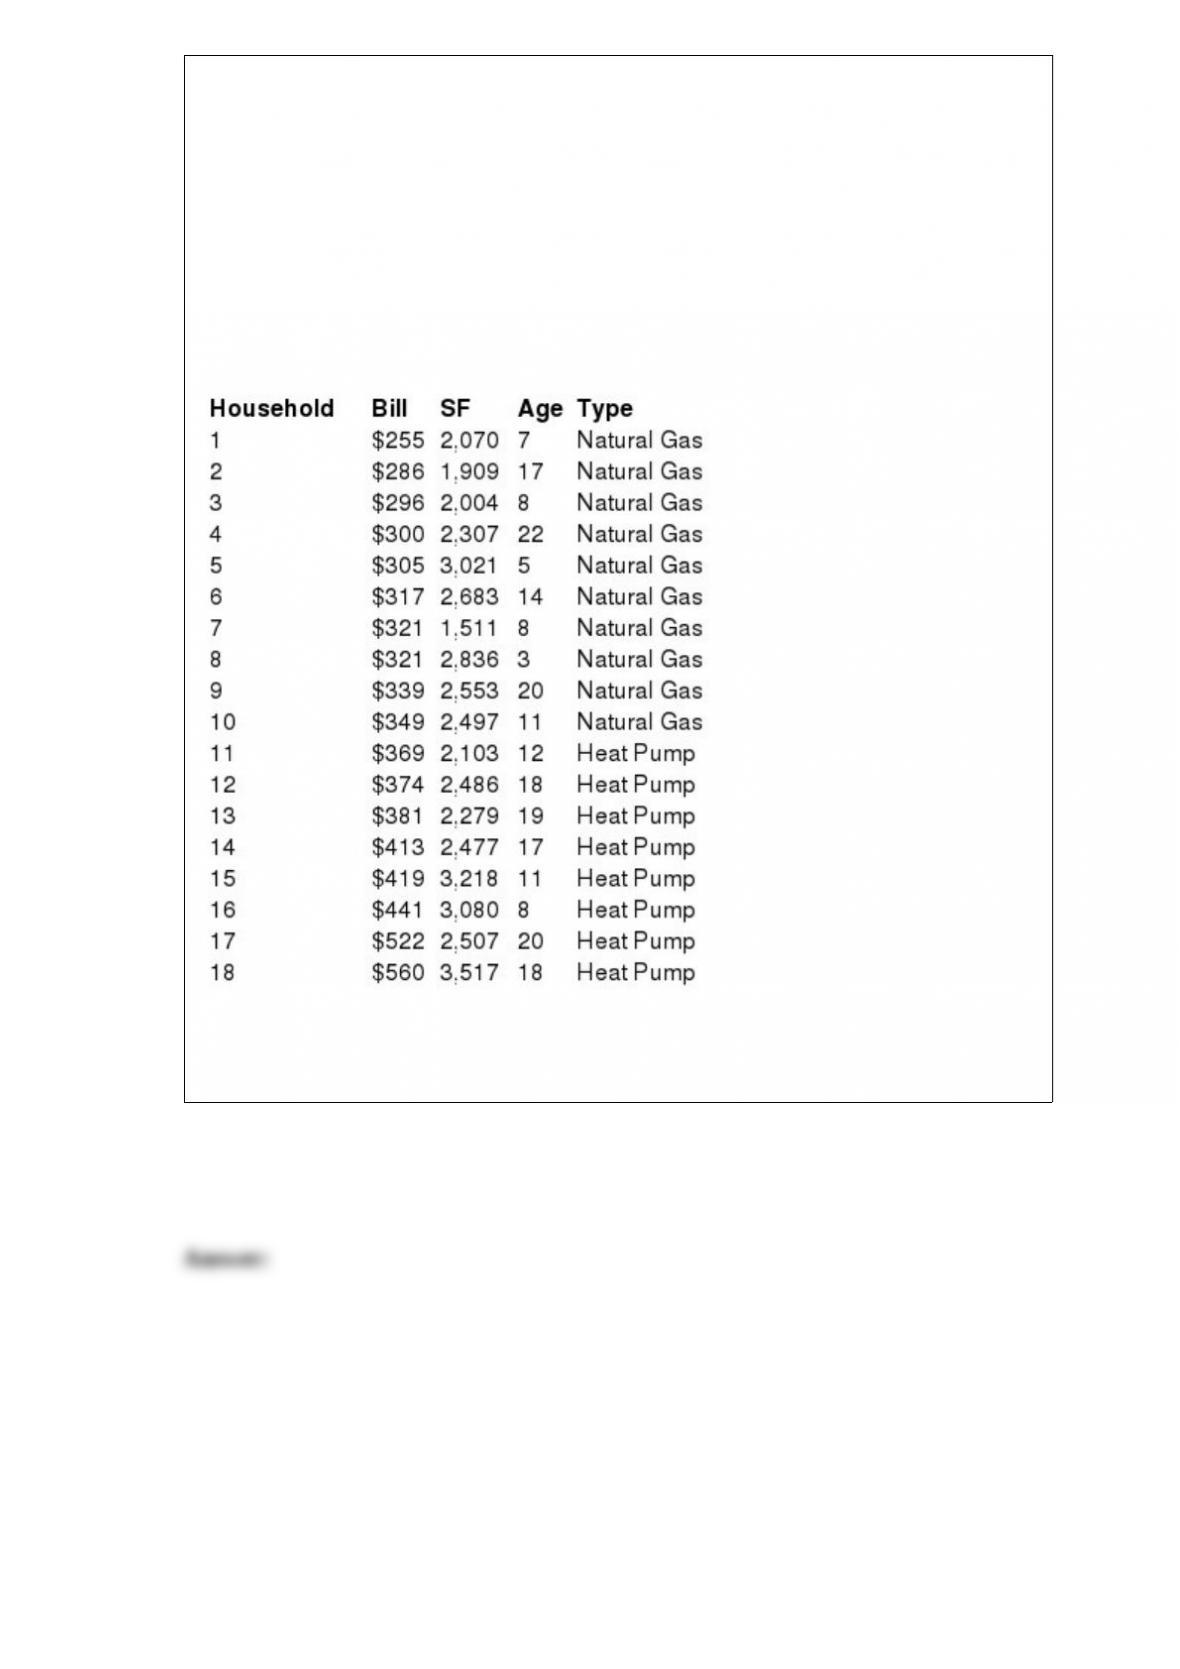
Use the following information to answer the question(s) below.
Delmarva Power is a utility company that would like to predict the monthly heating bill
for a household in Kent County during the month of January. A random sample of 18
households in the county were selected and their January heating bill recorded. This
data is shown in the table below along with the square footage of the house (SF), the
age of the heating system in years (Age,) and the type of heating system (heat pump = 1
or natural gas = 0).
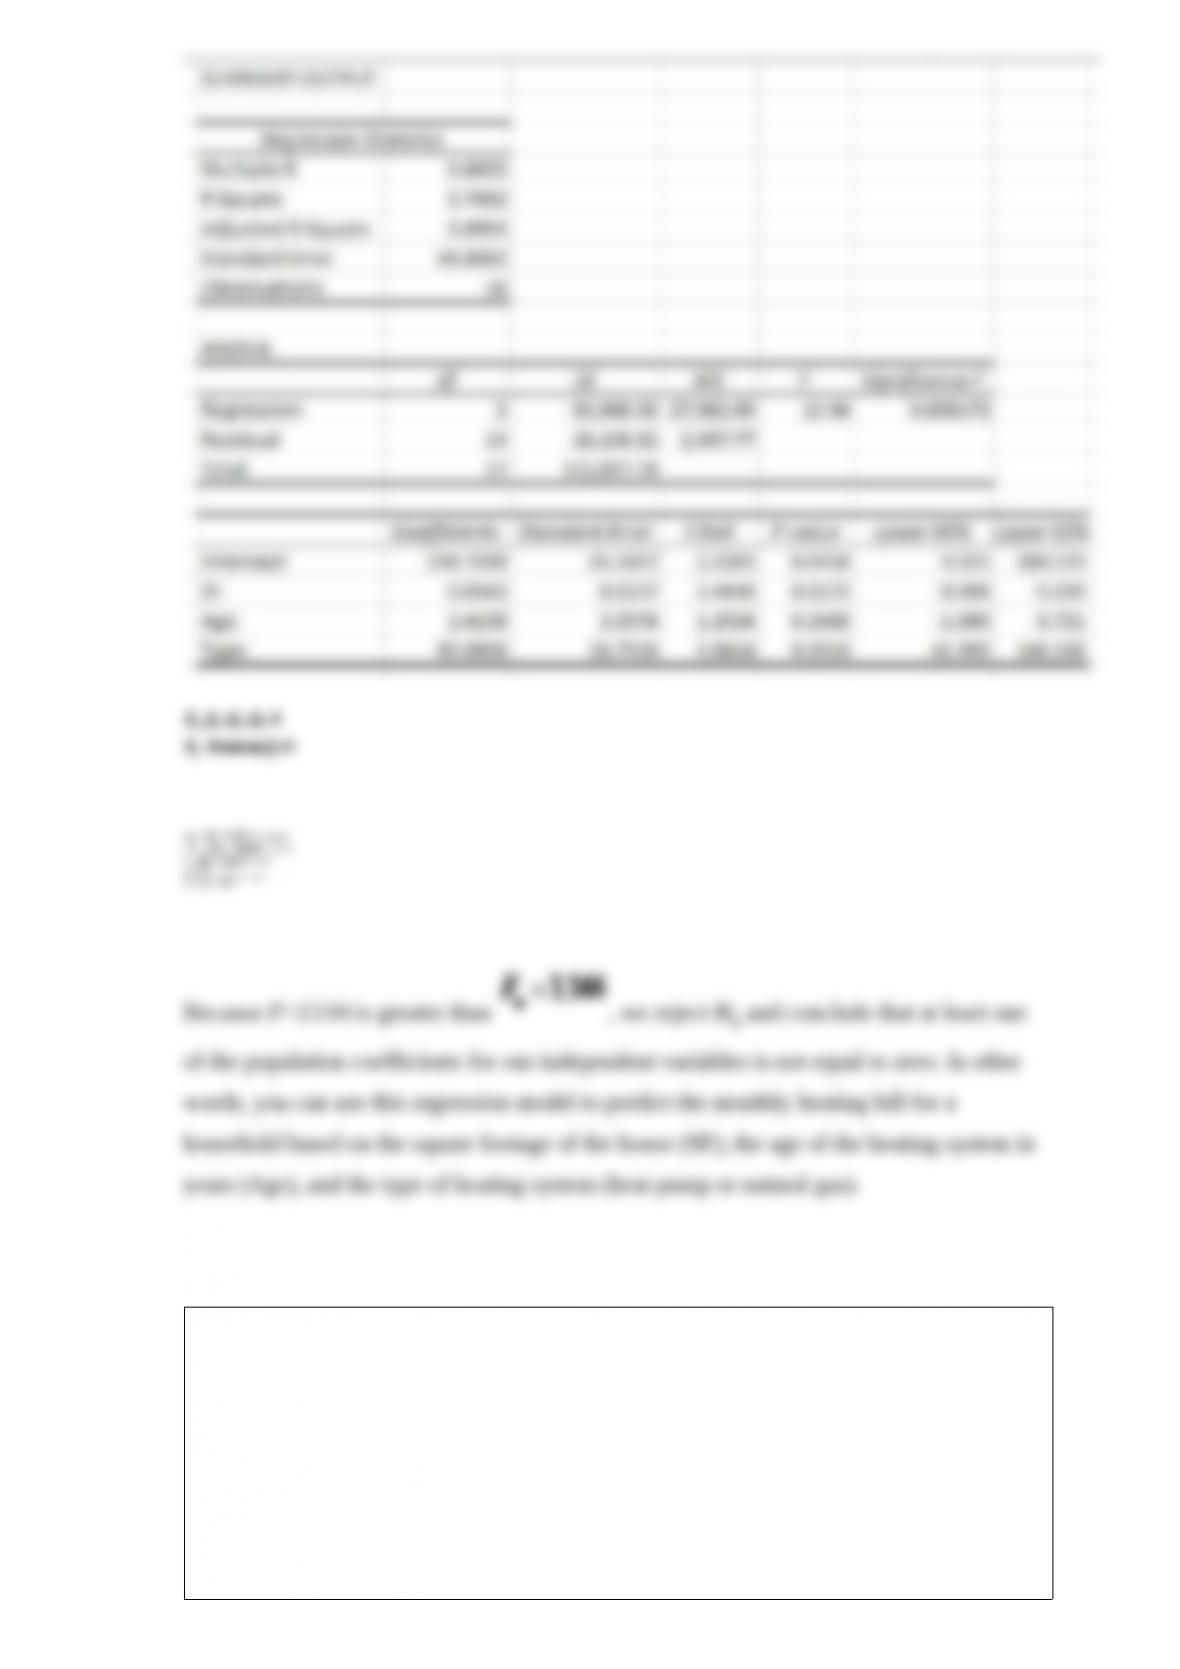
Conduct the hypothesis test, showing the calculations, to test the significance of the
overall regression model for predicting a heating bill using α = 0.05.
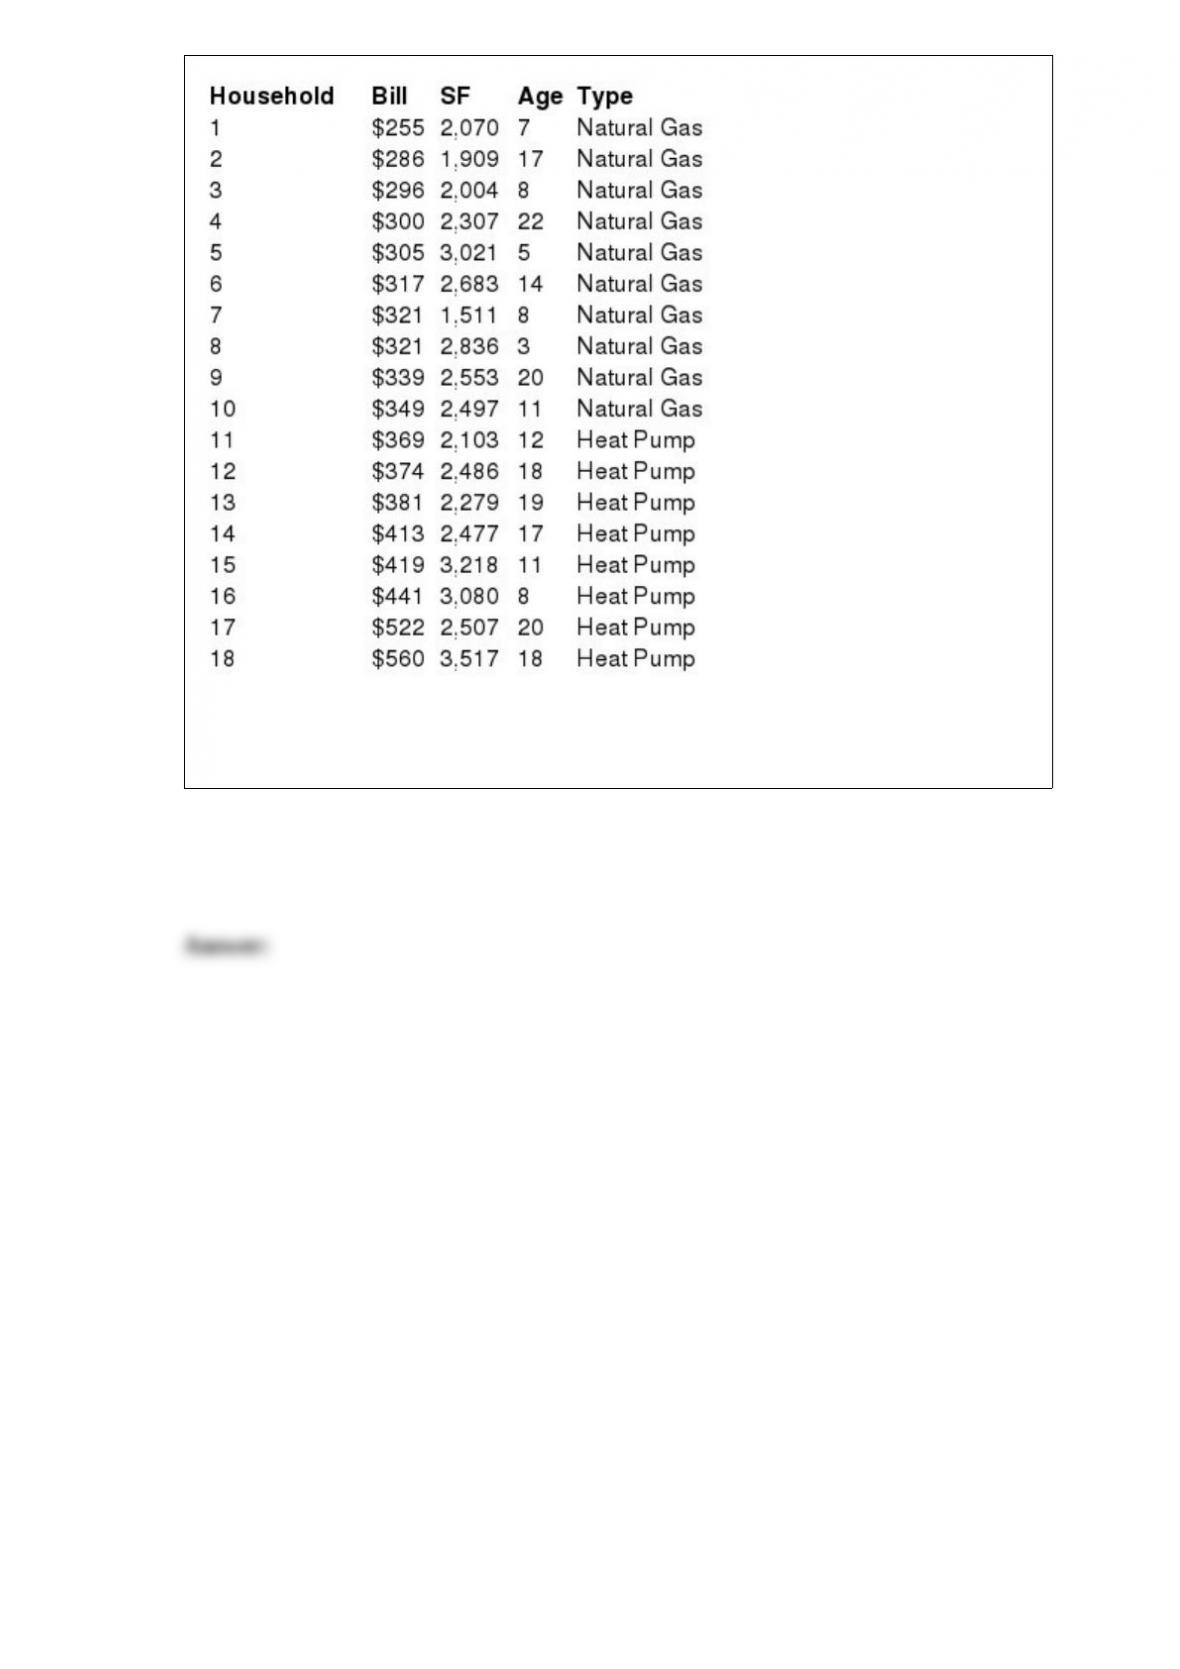
Use the following information to answer the question(s) below.
Delmarva Power is a utility company that would like to predict the monthly heating bill
for a household in Kent County during the month of January. A random sample of 18
households in the county were selected and their January heating bill recorded. This
data is shown in the table below along with the square footage of the house (SF), the
age of the heating system in years (Age,) and the type of heating system (heat pump = 1
or natural gas = 0).
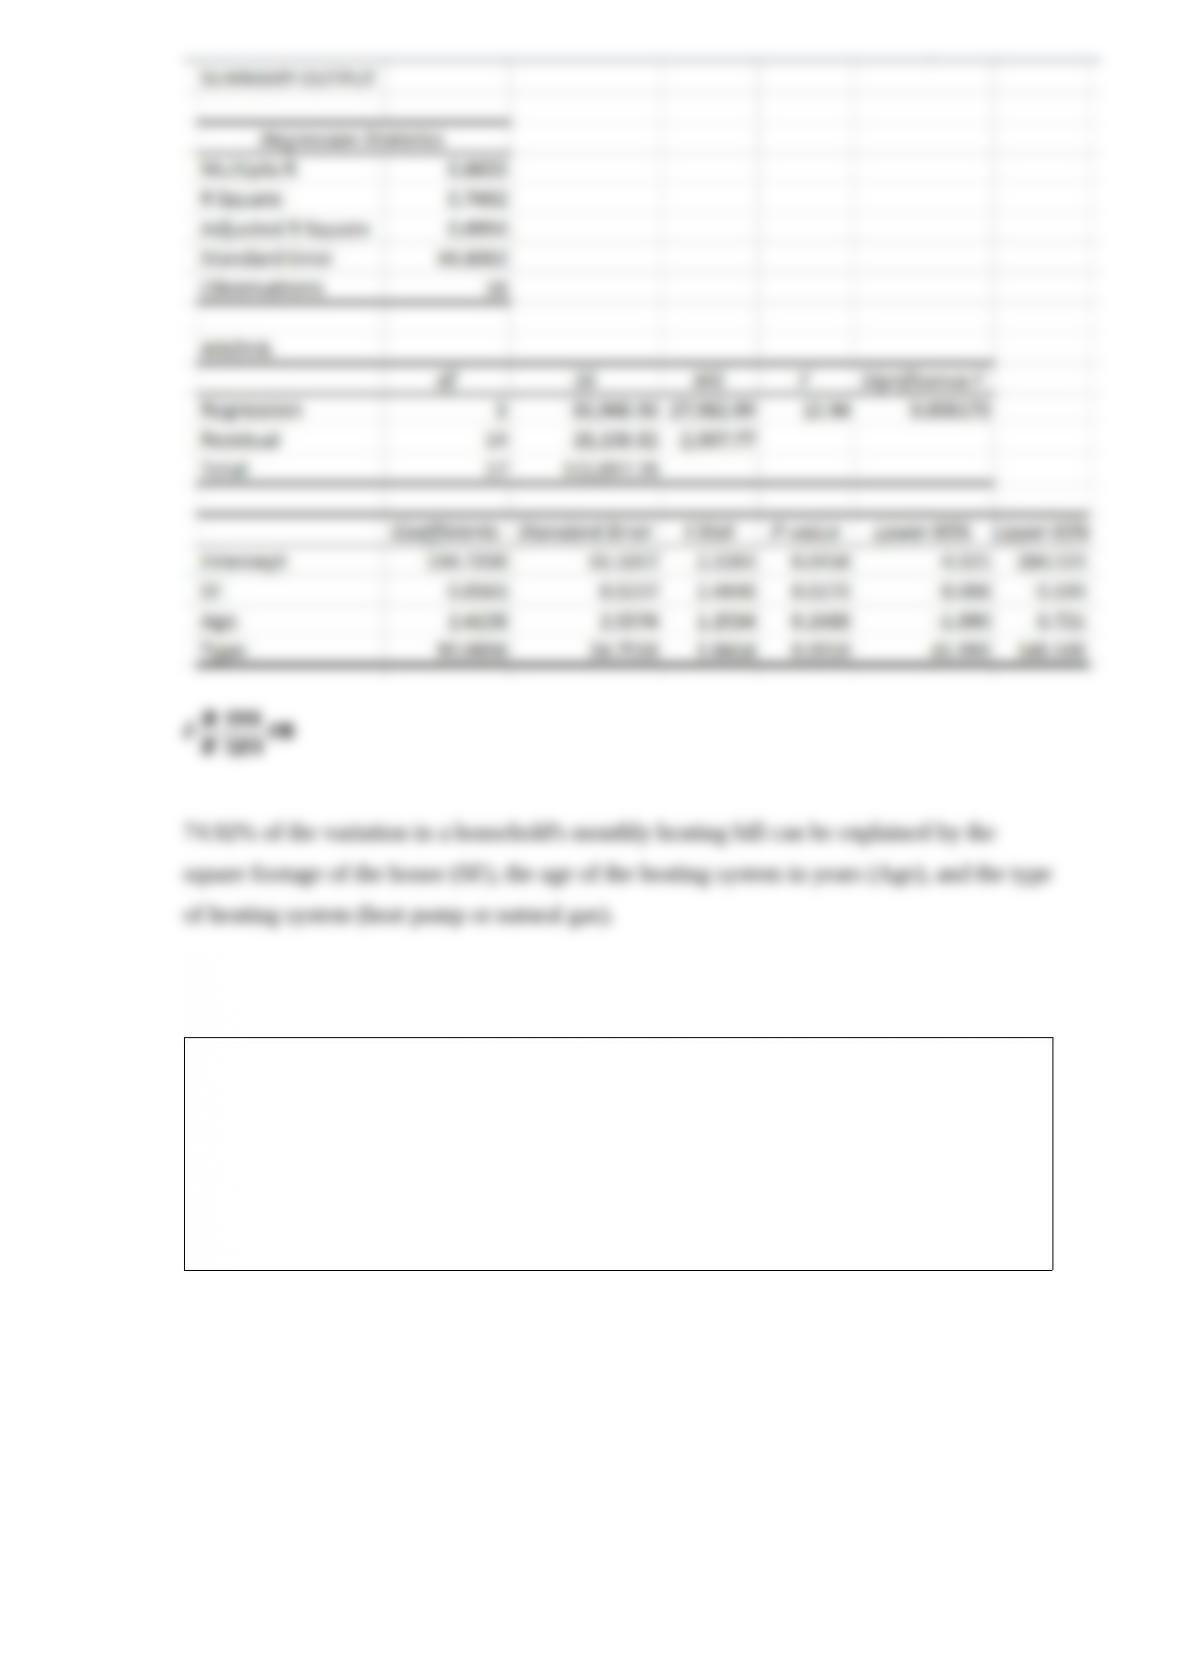
Show the calculations for the multiple coefficient of determination for the heating bill
model and interpret its meaning.
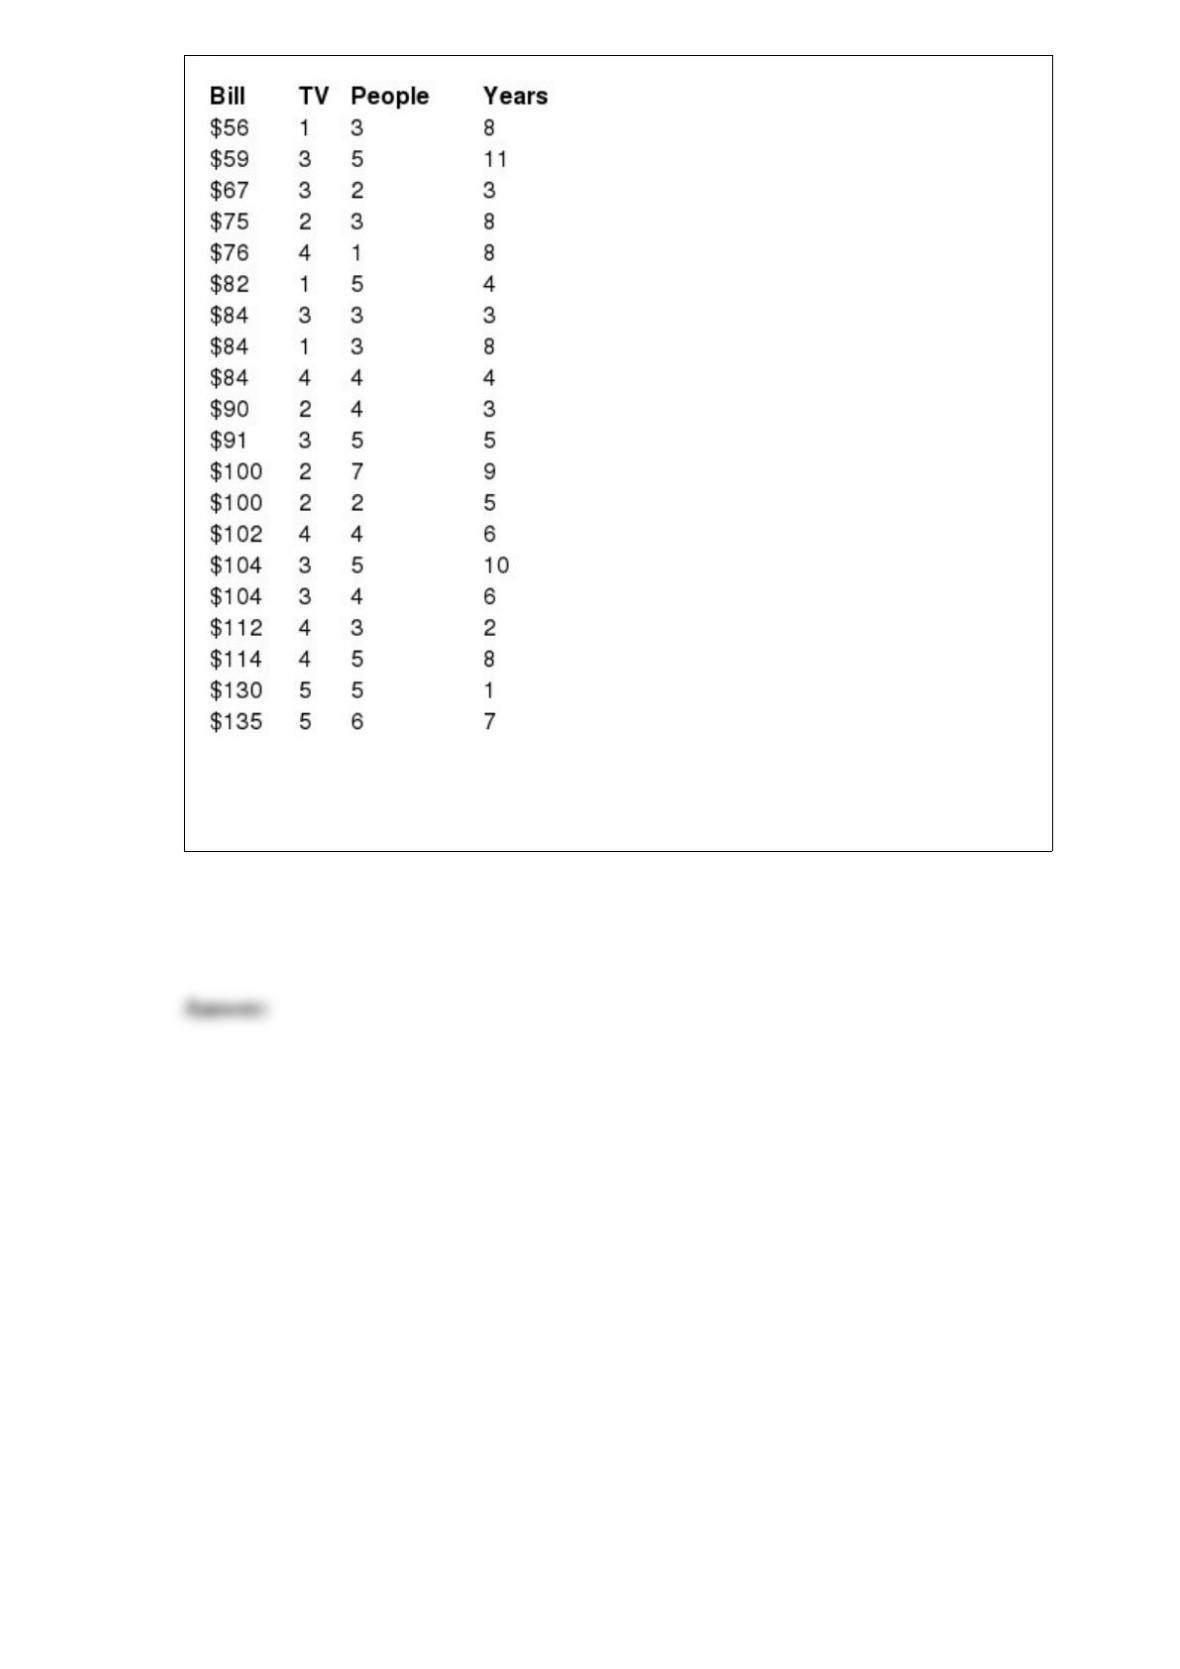
Use the following information to answer the question(s) below.
The following data provides the monthly Comcast cable bill for a random sample of 20
households along with the number of televisions in the household (TV), the number of
people living in the household (People), and the number of years that household has
been a Comcast customer (Years).
Show the calculations for the multiple coefficient of determination for the Comcast
cable bill model and interpret its meaning.
The management of the Green Bay Packers football team would like to test the
hypothesis that the average price of a ticket is less than $225 on the secondary market.
A random sample of 40 customers paid an average of $207 for their ticket. Assume that
the standard deviation of the price of tickets for Packers games is $43. The Green Bay
Packers would like to set α = 0.01. Use the critical value approach to test this
hypothesis.
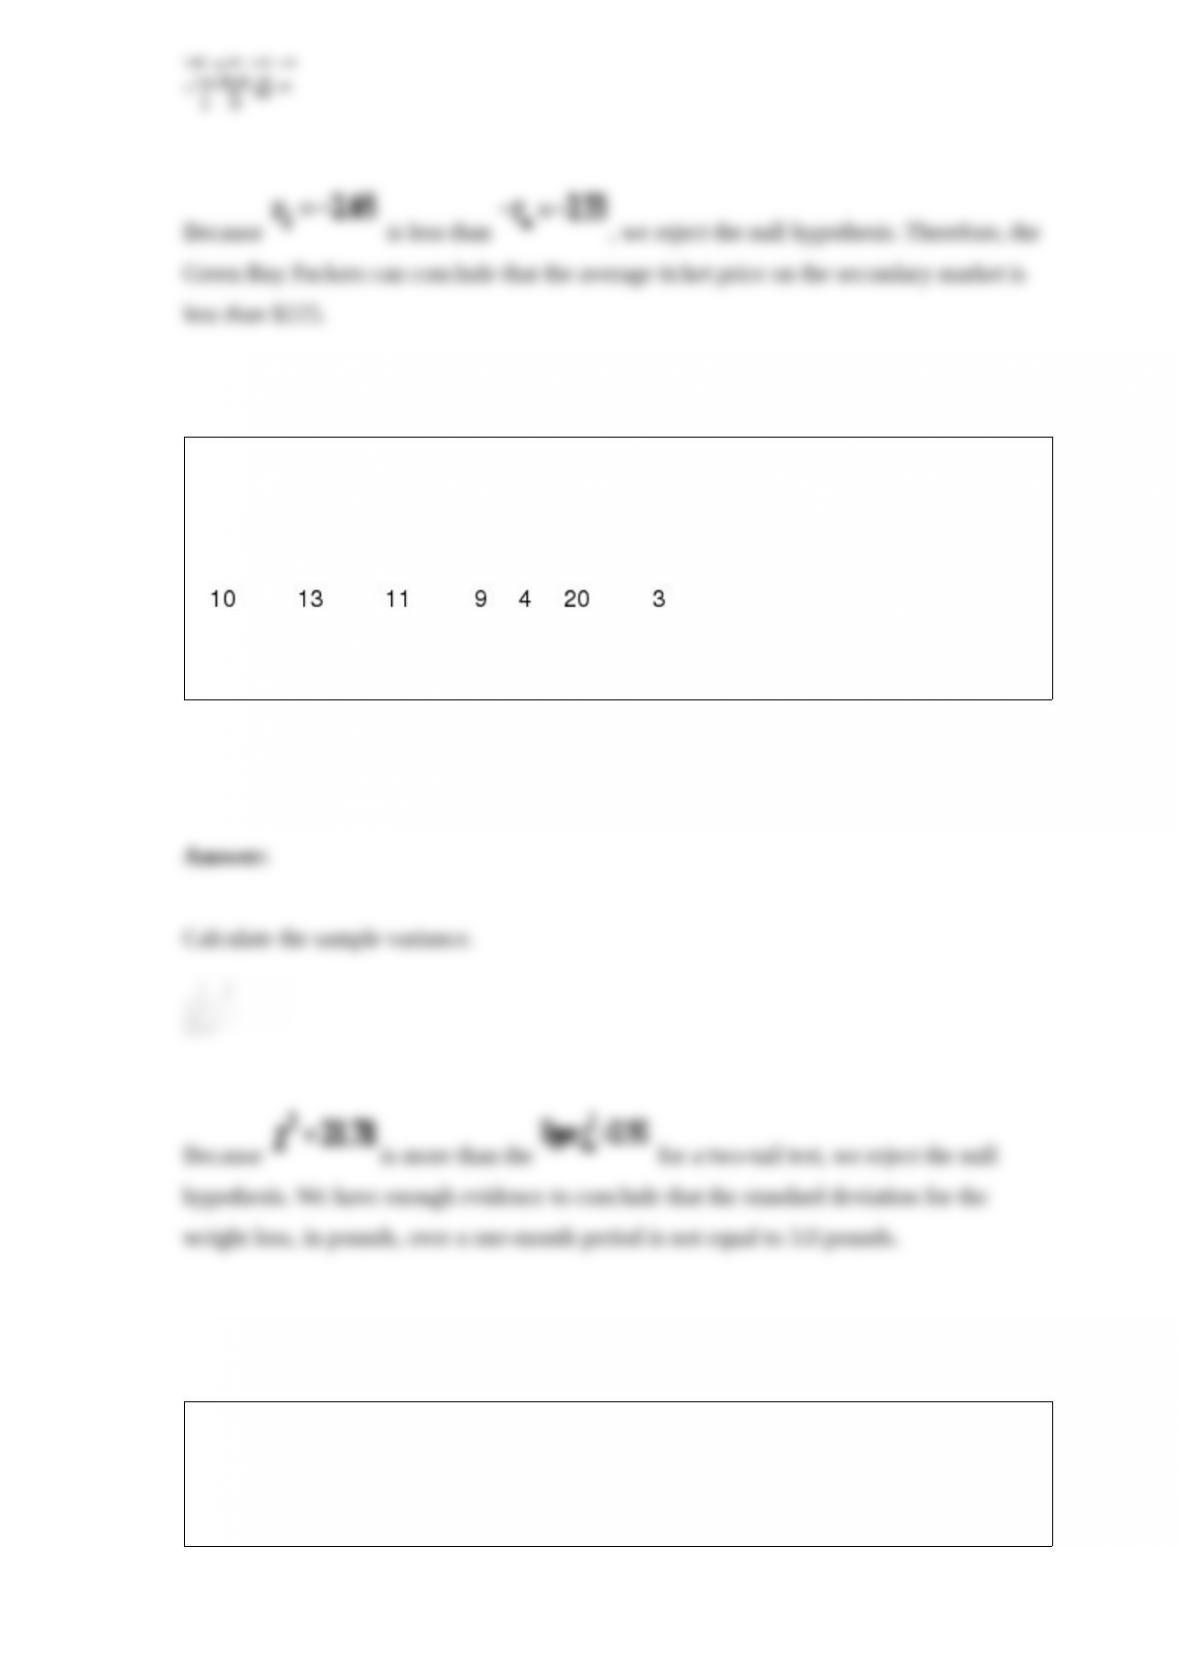
The developers of a weight-loss program would like to test the hypothesis that the
standard deviation for the weight loss, in pounds, over a one-month period is equal to
3.0 pounds. The following table shows the one-month weight loss, in pounds, of seven
individuals who participated in a weight-loss program.
Test the hypothesis using α = 0.10.
Medicare would like to test the hypothesis that the median monthly rate for
one-bedroom assisted-living facility is equal $3,300. The following table summarizes
one-bedroom rates at assisted-living facilities from a random sample. Test this
hypothesis using α = 0.05.
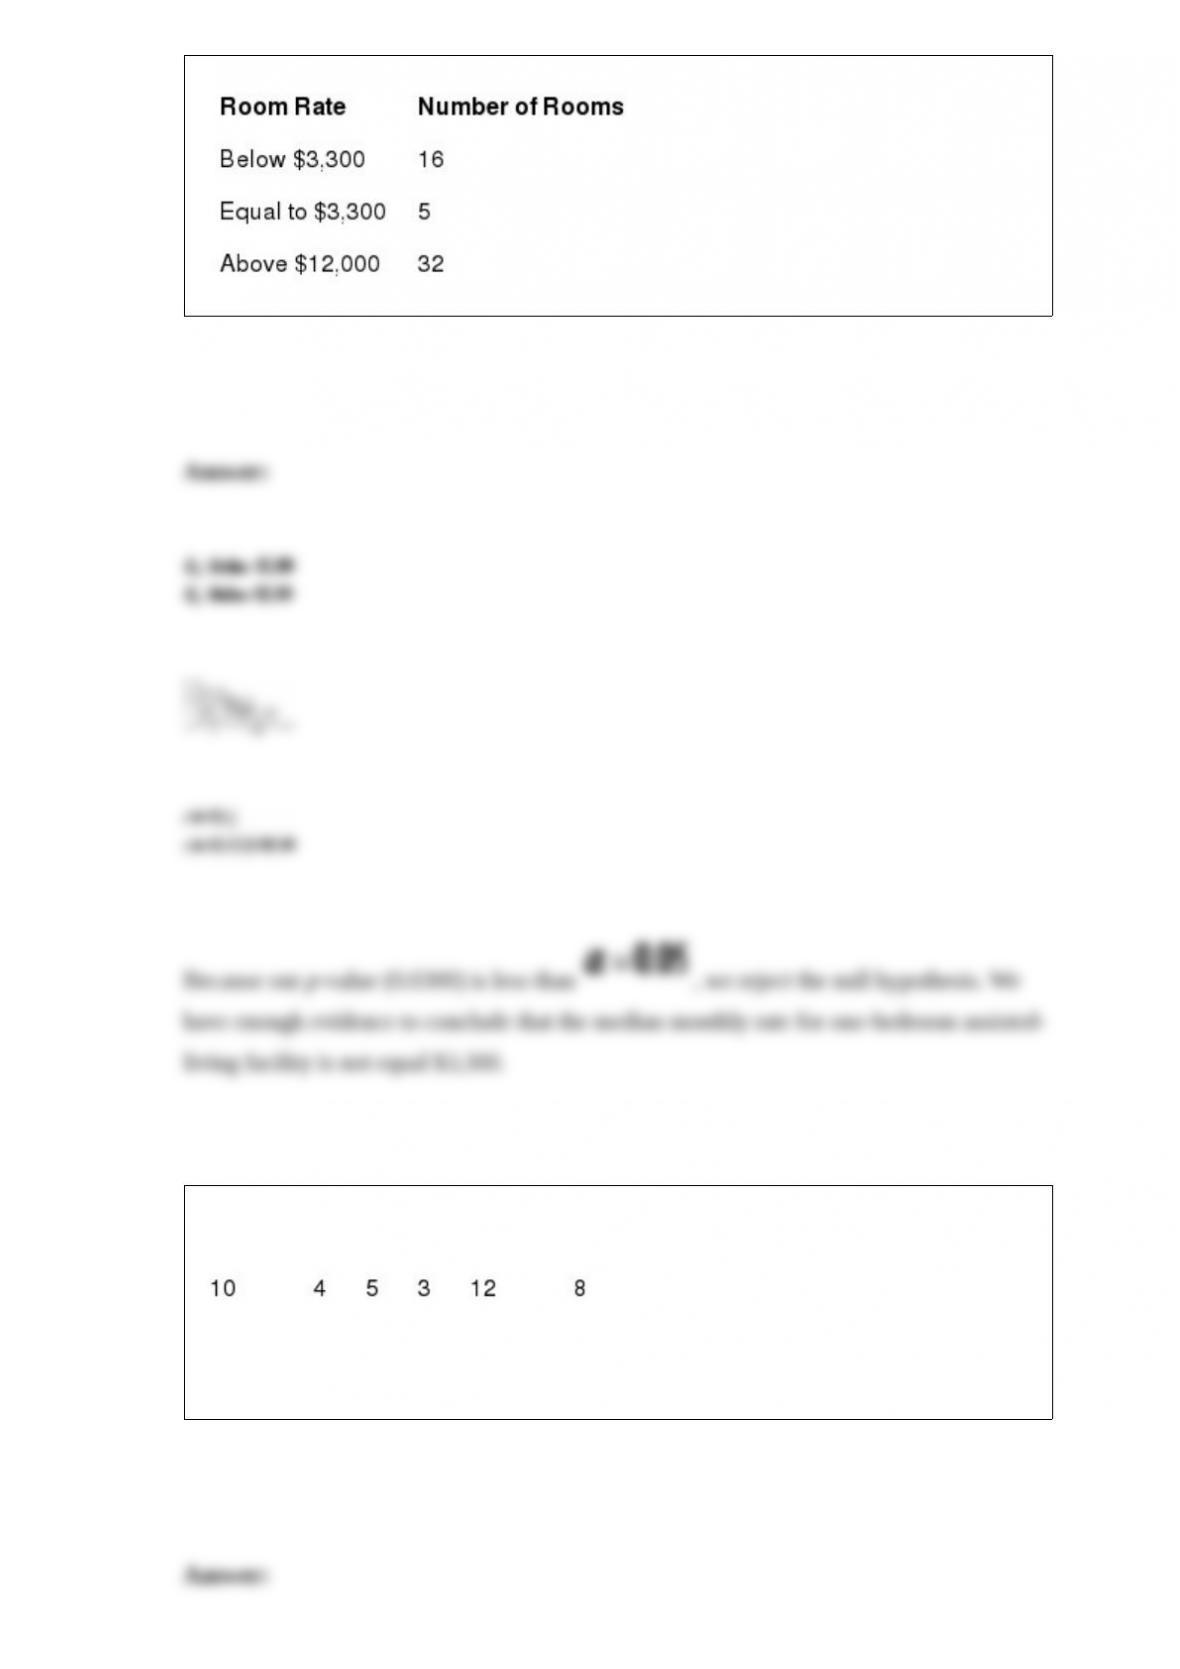
The following table shows the wait time on the phone, in minutes, of six individuals
who require assistance from a customer service representative.
Test the hypothesis that the standard deviation of wait time for all customers waiting for
a representative for this company is less than 4.0 minutes using α = 0.05.
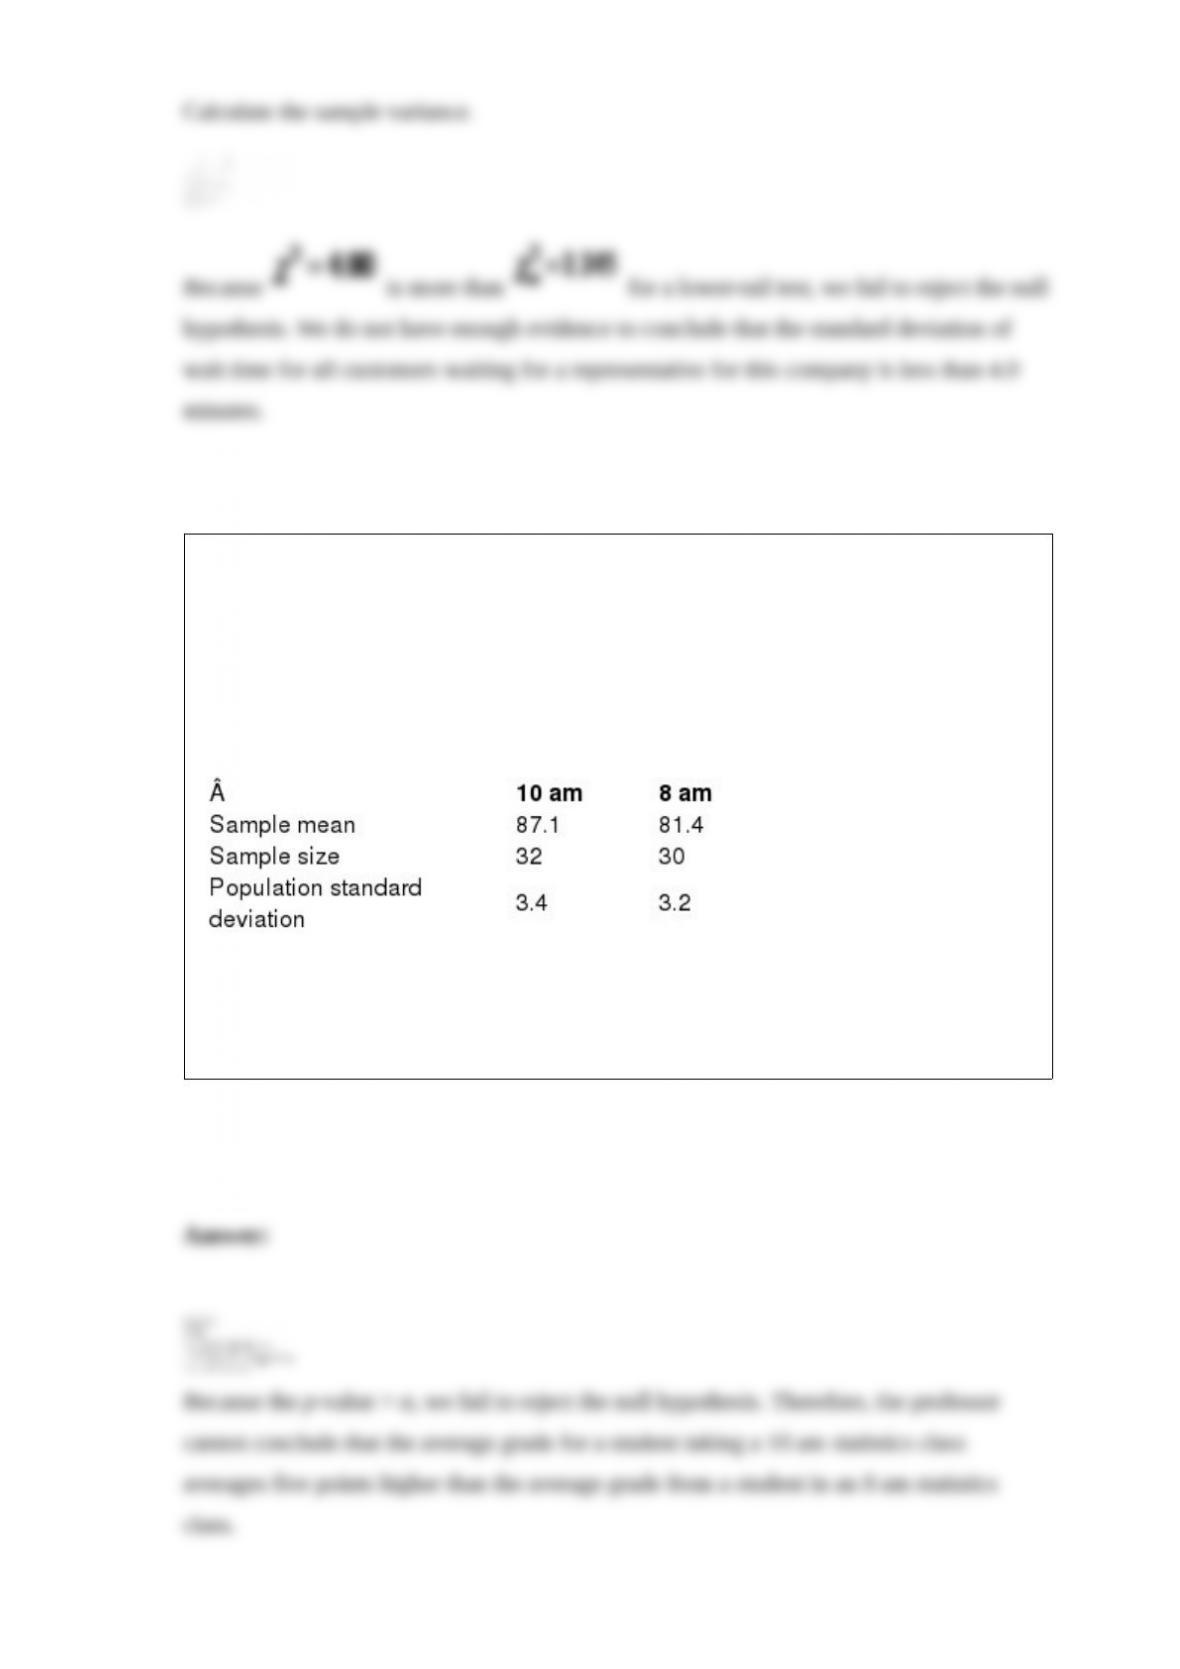
A professor would like to test the hypothesis that the average grade for a student taking
a 10 am statistics class averages five points higher than the average grade from a
student in an 8 am statistics class. The following data shows the sample size and
average grades for students in the two class times along with the population standard
deviations.
Define Population 1 is defined as the 10 am class and Population 2 the 8 am class and
use the p-value approach to test this hypothesis with α = 0.10.